1. Introduction
The hydrogen economy is a new intriguing sustainable scenario, and it is expected that sooner or later it is going to replace the hydrocarbon economy [
1]. With this perspective, a worldwide goal is to provide sustainable and convenient methods to prepare hydrogen fuel. Among them, water splitting (WS), by exploiting the energy of sun, is the most appealing, and many different approaches are currently being investigated [
2]. The advantage of the photoelectrochemical (PEC) approach, compared to the standard photocatalytic one, is that an external potential is used to facilitate the WS process. The intrinsic simplicity of PEC, which combines the light absorber and the energy converter into a single device capable to store solar energy into chemical bonds, is rather evident. For these reasons, numerous studies have been performed to fabricate semiconducting nanomaterials with enhanced PEC properties under visible light. In particular, many efforts have been done on developing materials for photoanodes, where the kinetically hindered Oxygen Evolution Reaction (OER) is occurring. Their final performance depends upon the electrocatalysts stability against oxidation [
3] and on their intrinsic band energetics [
4].
Metal oxide semiconductors are promising photoanode materials because of their relative stability to oxidative photo-corrosion and their low-cost. Hematite, (α-Fe
2O
3), has been identified as an efficient photoanode material characterized by a sufficiently low band gap of 1.9–2.0 eV, to be used as “top” electrode in a “tandem” WS device [
5]. Nevertheless, this material has some shortcomings, such as a short carrier diffusion length, a significant recombination and indirect absorption. During the last few years, other multicomponent oxides have been suggested as possible active materials for the construction of photoanodes. Among them, ZnFe
2O
4, CuWO
4 CuW
1−xMo
xO
4 and especially Cu-vanadates are particularly studied. As with many transition metal (TM) vanadates, Cu-vanadates are characterized by different phases where the Cu/V ratio has a quite large variability. The performances of these phases, together with their PEC stability, were tested in a very comprehensive paper by Gregoire et al. [
6]. In their study it was shown that sputter-deposited phases having lower Cu/V ratios are less stable, in borate buffer solution (pH = 9.2), than other phases with higher Cu/V ratio, (e.g., γ-Cu
3V
2O
8 and Cu
11V
6O
26). The γ-Cu
3V
2O
8 based photoanodes, prepared by sol-gel method were also recently studied by Neale et al. [
7]. The results of these studies were that the V-rich phases suffered from V loss and a consequent decay in the PEC properties, while the higher stability of Cu rich phases was attributed to a self-passivating mechanism that led to the formation of Cu
+ and Cu
2+ oxides on the vanadate surface. In a successive study, again by Gregoire et al. [
4], a library of Cu-vanadates thin films with variable stoichiometry was prepared by a fast and convenient ink-jet printing procedure and, again, it resulted that both α-CuV
2O
6 and α-Cu
2V
2O
7 are highly active and stable photocatalysts in a borate buffer solution, while β-Cu
2V
2O
7 demonstrated a high photoelectroactivity in the presence of ferri/ferrocyanide redox couple at pH = 13. The abovementioned phases, α-CuV
2O
6 and β-Cu
2V
2O
7 were also deposited by a simple drop casting method on fluorine doped tin oxide (FTO) glass and their PEC properties characterized by Mullins et al. [
8]. This study showed that the V rich α-CuV
2O
6 phase is the one showing the highest photocurrent, although both phases were characterized by a short diffusion length for holes and required the addition of a hole scavenger like Na
2SO
3 to improve the photocurrent density. Finally, in a more recent paper by Sharp et al. [
9] it was shown that, although Cu-rich phases show higher absorption and charge separation, these phases also present a higher surface recombination rate. Therefore, considering that Cu-rich phases are the ones showing the higher stability in borate buffer solutions, good charge separation and higher absorption and that, on the other hand, V rich phases seem to be those characterized by the higher photocurrents density, we decided to concentrate our attention on the β-Cu
2V
2O
7 phase, that appeared to be a good compromise between durability and PEC performances. The idea of increasing the adhesion between the substrate and the vanadate particles, in order to improve the durability in the electrolyte solution, led us to think about the use of a high surface area substrate like TiO
2 nanorods (NRs) on FTO [
10], to grow this n-type semiconductor. Moreover, the addition of graphene oxide (GO) flakes, could lead to the formation of a composite material with interesting PEC proprieties in term of durability and photocurrent density. In fact, quite recently, composite systems like BiVO
4/TiO
2 and V
2O
5/BiVO
4/TiO
2 were prepared by hydrothermal synthesis and, although not used as active material in photoanodes, showed superior photocatalytic performances in the degradation of organics caused by an upward shift of V
2O
5 and BiVO
4 conduction bands with respect to TiO
2 with formation of an n-n junction [
11,
12]. A similar approach was also used by Chen and coworkers [
13] where TiO
2 NRs were decorated by Fe
2O
3 grown on preformed TiO
2 NRs obtained by a simple hydrothermal synthesis. With respect to the effect of the addition of GO flakes, it is useful to remind that GO and especially partial reduced GO (r-GO), are considered as a good support for nanostructures because of their carrier mobility [
14], large specific area and high optical transmittance [
15,
16]. Moreover, when TiO
2 nanostructures are combined with GO or r-GO they usually can shuttle and store more electrons due to the formation of many p-n nanojunctions with r-GO, a p-type semiconductor [
17,
18,
19].
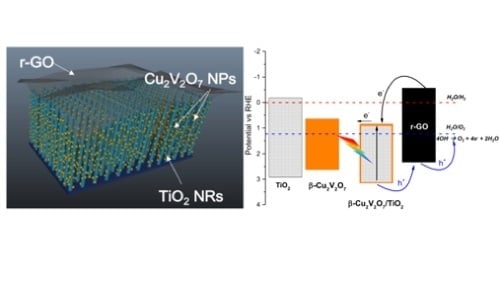
In this study, we describe the preparation and evaluation of the PEC performances of a visible light driven photoanode based on a novel composite material consisting on β-Cu
2V
2O
7 nanoparticles deposited on TiO
2 NRs followed by the addition of r-GO flakes. The decoration of TiO
2 NRs with β-Cu
2V
2O
7 NPs was obtained by an easy and fast aerosol assisted spray pyrolysis (AASP) deposition technique. A further improvement of the performances was obtained by the addition of partially reduced graphene oxide (r-GO), a p-type semiconductor [
20], to reduce the charge transfer resistance. We show here that GO, deposited by electrophoretic deposition, can efficiently coat the surface of the β-Cu
2V
2O
7/TiO
2 nanostructures and, after a mild annealing, is transformed into r-GO causing a remarkable enhancement of the photocurrent with increased durability (from 50 µA/cm
2 in the case of pure TiO
2 NRs, 150 µA/cm
2 for TiO
2NRs decorated with β-Cu
2V
2O
7 NP to 250 µA/cm
2 for r-GO/β-Cu
2V
2O
7/TiO
2).
The prepared films were characterized by wide angle X-ray diffraction (WAXD), scanning electron microscopy (SEM), high resolution transmission electron microscopy (HR-TEM), UV–Vis and Raman spectroscopy, Electrochemical Impedance Spectroscopy (EIS) and PEC measurements. Their surface composition was also studied by X-ray Photoemission Spectroscopy (XPS) before and after the PEC work, under illumination, with the intention of verifying V loss and concomitant formation of CuOx passivating layers.
3. Results and Discussion
The PEC measurements on β-Cu2V2O7 films deposited on FTO (β-Cu2V2O7) using different aerosol solutions (solution 1–3) are discussed later in the text, nevertheless, it is useful to anticipate that vanadates prepared using solution 1 (NH3) gave the best PEC results with respect to the other two solutions. For this reason, only β-Cu2V2O7 on TiO2 NRs (β-Cu2V2O7/TiO2) and r-GO/β-Cu2V2O7 on TiO2 (r-GO/β-Cu2V2O7/TiO2) samples, obtained with solution 1 (see experimental section) are herein discussed. We attributed this behavior to a lower carbon contamination.
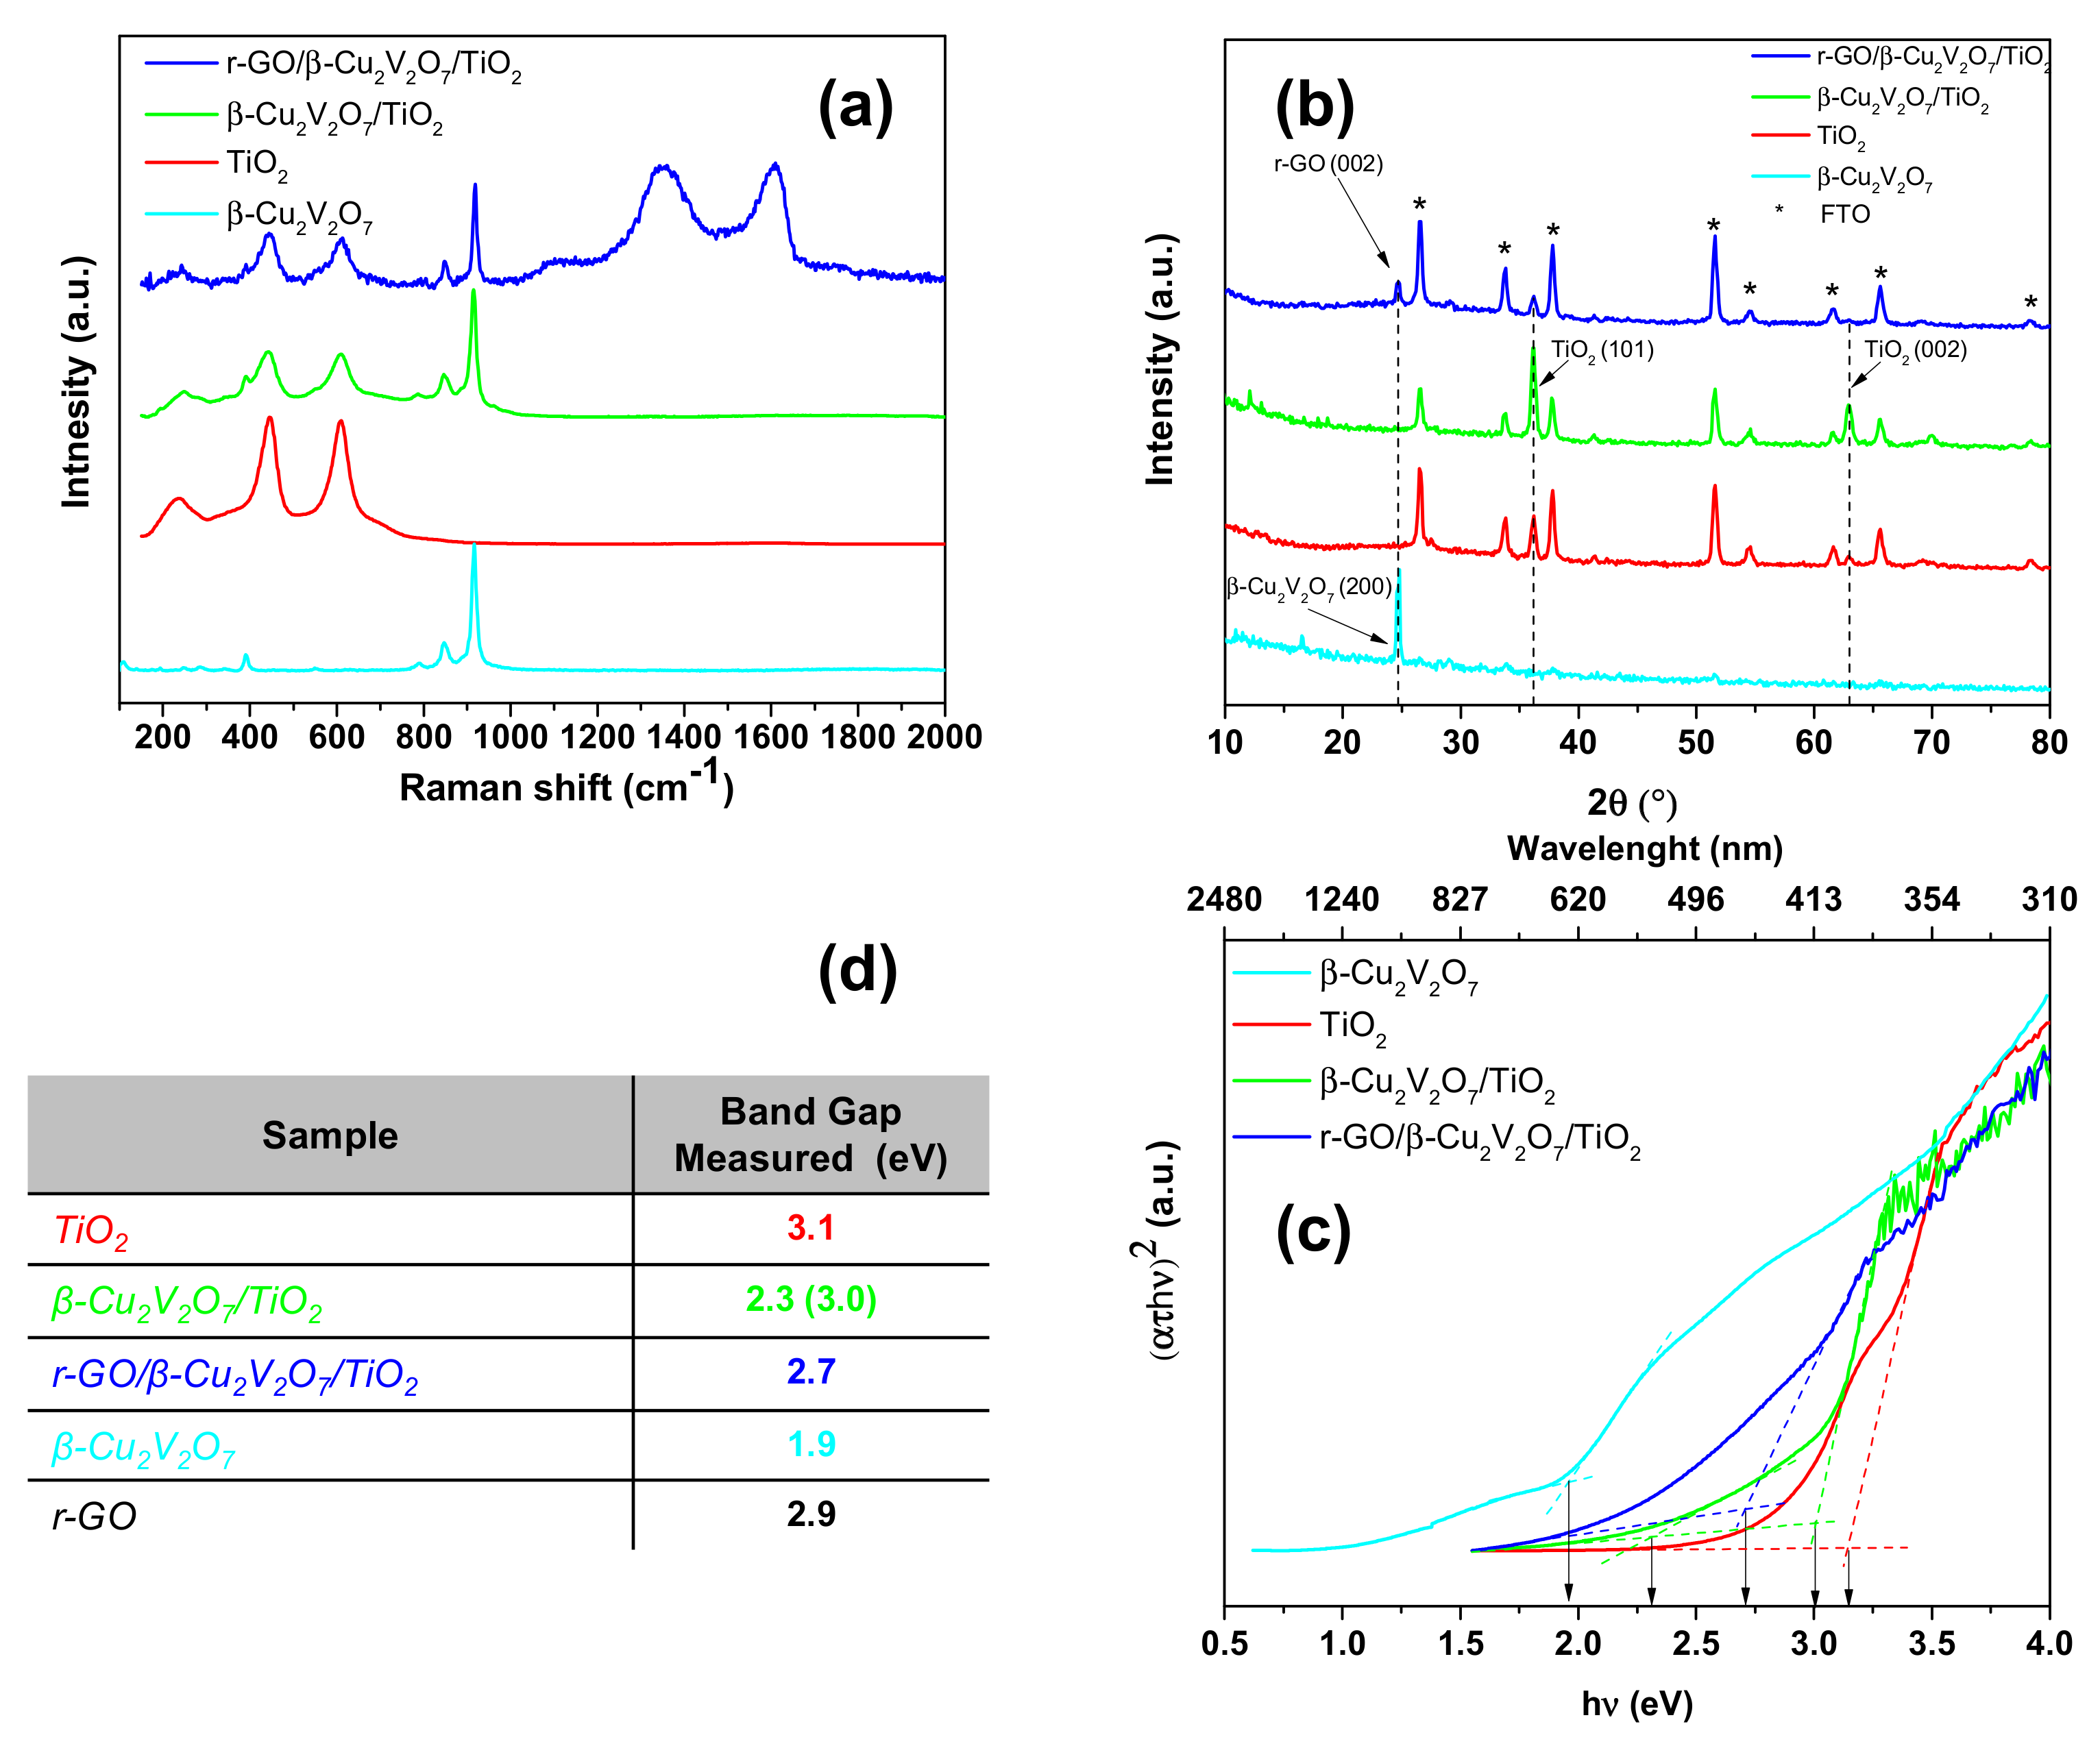
Figure 1a shows the Raman spectra of β-Cu
2V
2O
7, TiO
2, β-Cu
2V
2O
7/TiO
2 and r-GO/β-Cu
2V
2O
7/TiO
2, measured at room-temperature. The Raman region of pure TiO
2 NRs presents all the characteristic peaks corresponding to rutile, that is, the peak at 244 cm
−1 corresponding to the phonon scattering mode of rutile, the signal at 438 cm
−1 assigned to the
Eg mode, and the peak at 621 cm
−1 to the A
1g mode [
24]. The peak centered at 914 cm
−1 is the characteristic band assigned to the β-Cu
2V
2O
7 (VO
3 stretching mode) [
25]. In the case of r-GO/ β-Cu
2V
2O
7/TiO
2 NRs sample, two broad peaks at 1354 (
ID) and 1598 cm
−1 (
IG) are those characteristic of r-GO [
26]. In particular, the
ID/
IG ratio corresponding to thick r-GO flakes was 0.97, as reported in reference [
26], while in the case of areas where the r-GO coating was not visible by the micro-Raman microscope (50×), the ratio was 0.89 before PEC measurements and was reduced to 0.85 after PEC measurements (see
Supplementary Material, Figure S6). These values are completely consistent with the presence of r-GO.
Figure 1b shows the WAXD patterns of the prepared samples: β-Cu
2V
2O
7, β-Cu
2V
2O
7/TiO
2, and r-GO/β-Cu
2V
2O
7/TiO
2. The diffraction peak at 2θ = 24.7° (cyan curve) is assigned to reflections from planes (200) of monoclinic β-Cu
2V
2O
7 (JCPDS No. 73-1032), while peaks at 2θ = 36.2° and 62.9° (red, green and blue curves) correspond to reflections from planes (101) and (002) of rutile (JCPDS No. 21-1276). We calculated the lattice parameters of TiO
2-rutile NRs before and after the coating with Cu
2V
2O
7. These parameters are:
a = 4.569(9) Å,
c = 2.955(2) Å, remaining unchanged after the coating. The blue curve (r-GO/β-Cu
2V
2O
7/TiO
2) presents a further diffraction peak, at 2θ =24.7°, that has to be attributed to r-GO [
27].
Indeed, the XRD pattern of β-Cu2V2O7/TiO2 (green curve) shows an extremely weak peak at 2θ = 24.7°. However, the very low intensity of this peak, probably due to the small thickness of the β-Cu2V2O7 coating made it difficult to detect β-Cu2V2O7 by X-ray diffraction and, therefore, the presence of the reflection at 2θ = 24.7°, in the case of the r-GO/β-Cu2V2O7/TiO2 has to be related to r-GO.
The band gap values (
Eg) of these semiconducting materials can be estimated from the Tauc plots (
Figure 1c). The absorption coefficient is calculated from Equation (1):
where
is the absorption coefficient,
is the thickness of the film, C is a constant,
T the transmittance, and
Rref the reflectance. Since all the samples studied were rather opaque it was necessary to acquire both the diffuse reflectance spectra and the transmittance spectra. The band gap (
Eg) was estimated by calculating the intercept of an extrapolated linear fit of the experimental data, [
]
2, to the flat portion of the plot, where no absorption occurs. The measured values of
Eg for a direct transition are shown in
Figure 1d [
28]. β-Cu
2V
2O
7 and TiO
2 show
Eg values of 1.9 and 3.1 eV, respectively. Samples β-Cu
2V
2O
7/TiO
2 and r-GO/β-Cu
2V
2O
7/TiO
2 present a Tauc plot characterized by a shape typical of composite materials [
11] with intercepts at ca. 3 eV (β-Cu
2V
2O
7/TiO
2 presents an additional band gap at 2.3 eV related to copper vanadate particles) and 2.7 eV, after addition of r-GO (blue curve).
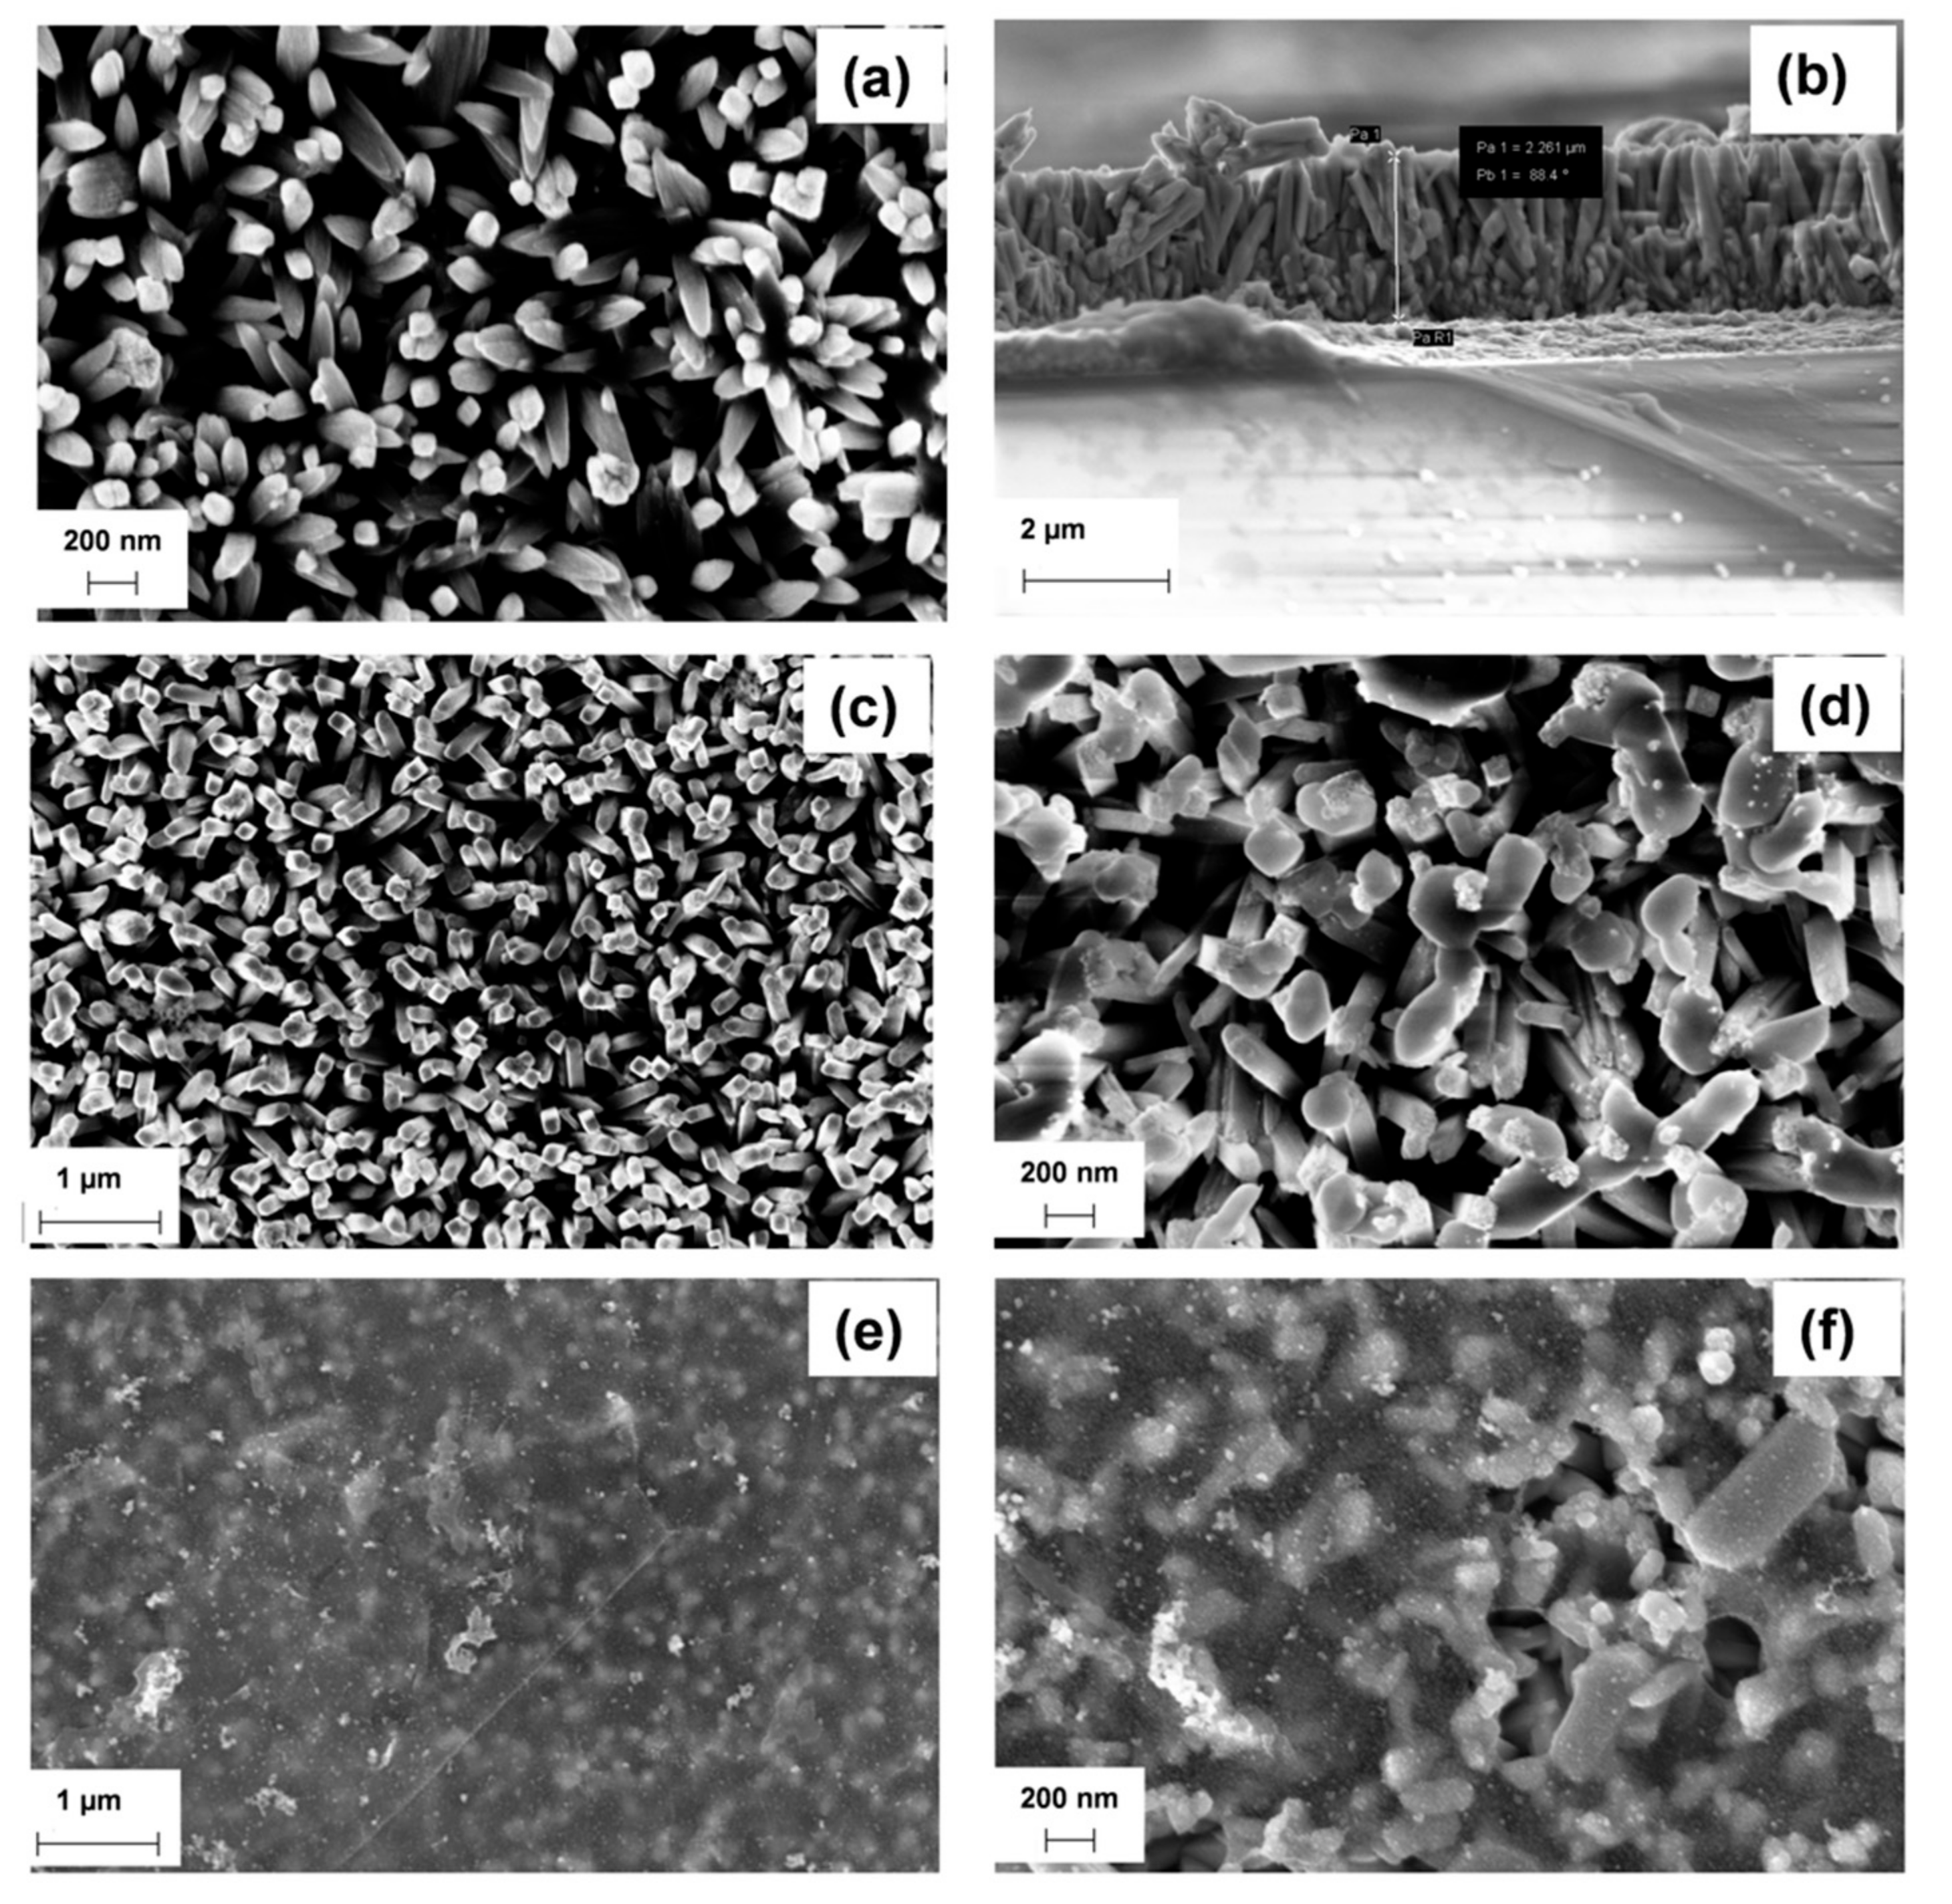
Figure 2 shows the SEM images of the pure TiO
2 NRs supported on FTO (
Figure 2a) and those decorated with β-Cu
2V
2O
7 (
Figure 2c,d) and coated with r-GO flakes (
Figure 2e,f). The as annealed film consists of TiO
2 NRs with a diameter of ~50 nm and a length of ~2 μm (
Figure 2b). The sectional view, reported in
Figure 2b, shows that these TiO
2 NRs are vertically aligned on the FTO substrate with a thickness of about 2–2.4 µm. After the deposition of β-Cu
2V
2O
7, the oxide nanoparticles stick randomly on the top of TiO
2 NRs surface (
Figure 2c,d). Finally, the r-GO flakes tile the nanorods, similar to a silk coat. (
Figure 2e,f).
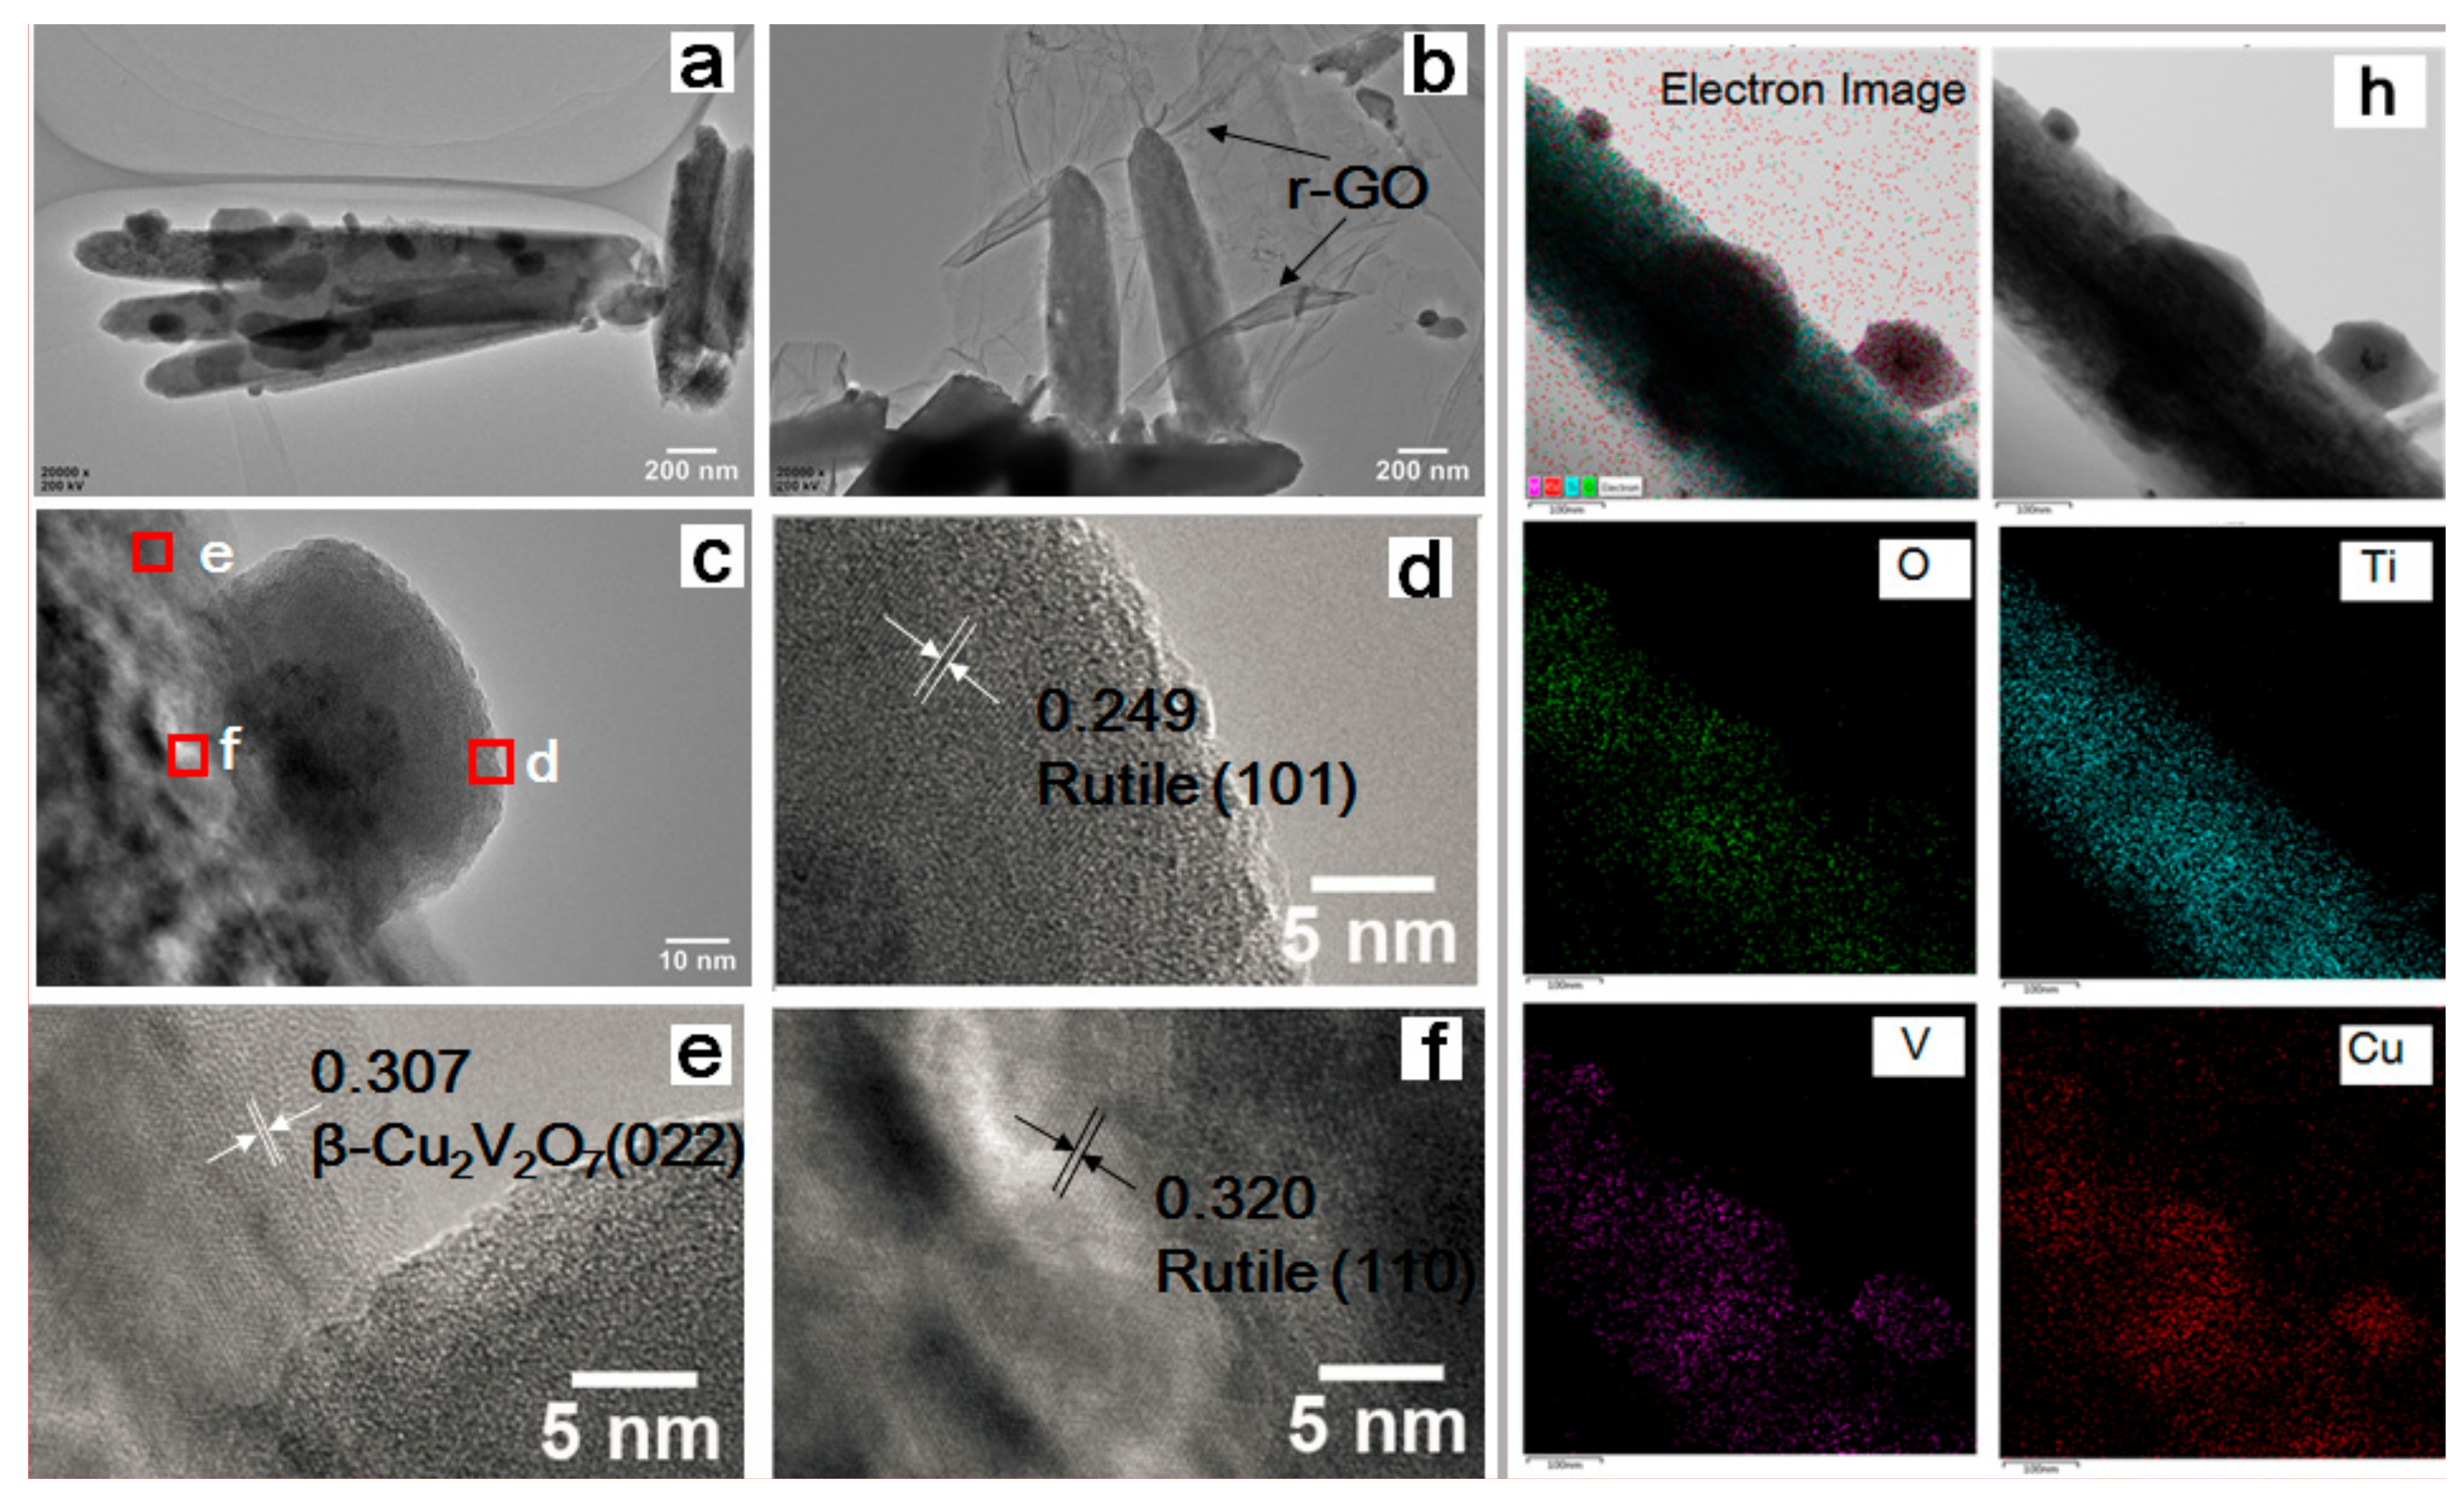
The TEM images and the corresponding energy dispersive X-ray (EDX) images are also presented in
Figure 3. The size of the β-Cu
2V
2O
7 NPs is between 100 and 200 nm with a regular cubic shape (
Figure 3a–c). According to the measurement of the lattice fringes (
d = 0.249, 0.320, and 0.307 nm) there is a very good match with the crystallographic planes of rutile (101), rutile (110) and β-Cu
2V
2O
7 (022), respectively (
Figure 3d–f). The O, Ti, V and Cu EDX elemental maps are also reported in
Figure 3h together with the physical images. These images show that V and Cu are not only present on the vanadate NPs, but also on the surface of the NRs. The AASP deposition procedure allows the deposition of β-Cu
2V
2O
7 crystals not only on top of the rods, but also along their length, with variable dimensions caused by the diffusion of aerosol droplets through the porous TiO
2 NRs layer.
To obtain further information on the surface composition of these nanostructures the samples were characterized by XPS, before PEC measurements, as reported in
Figure 4.
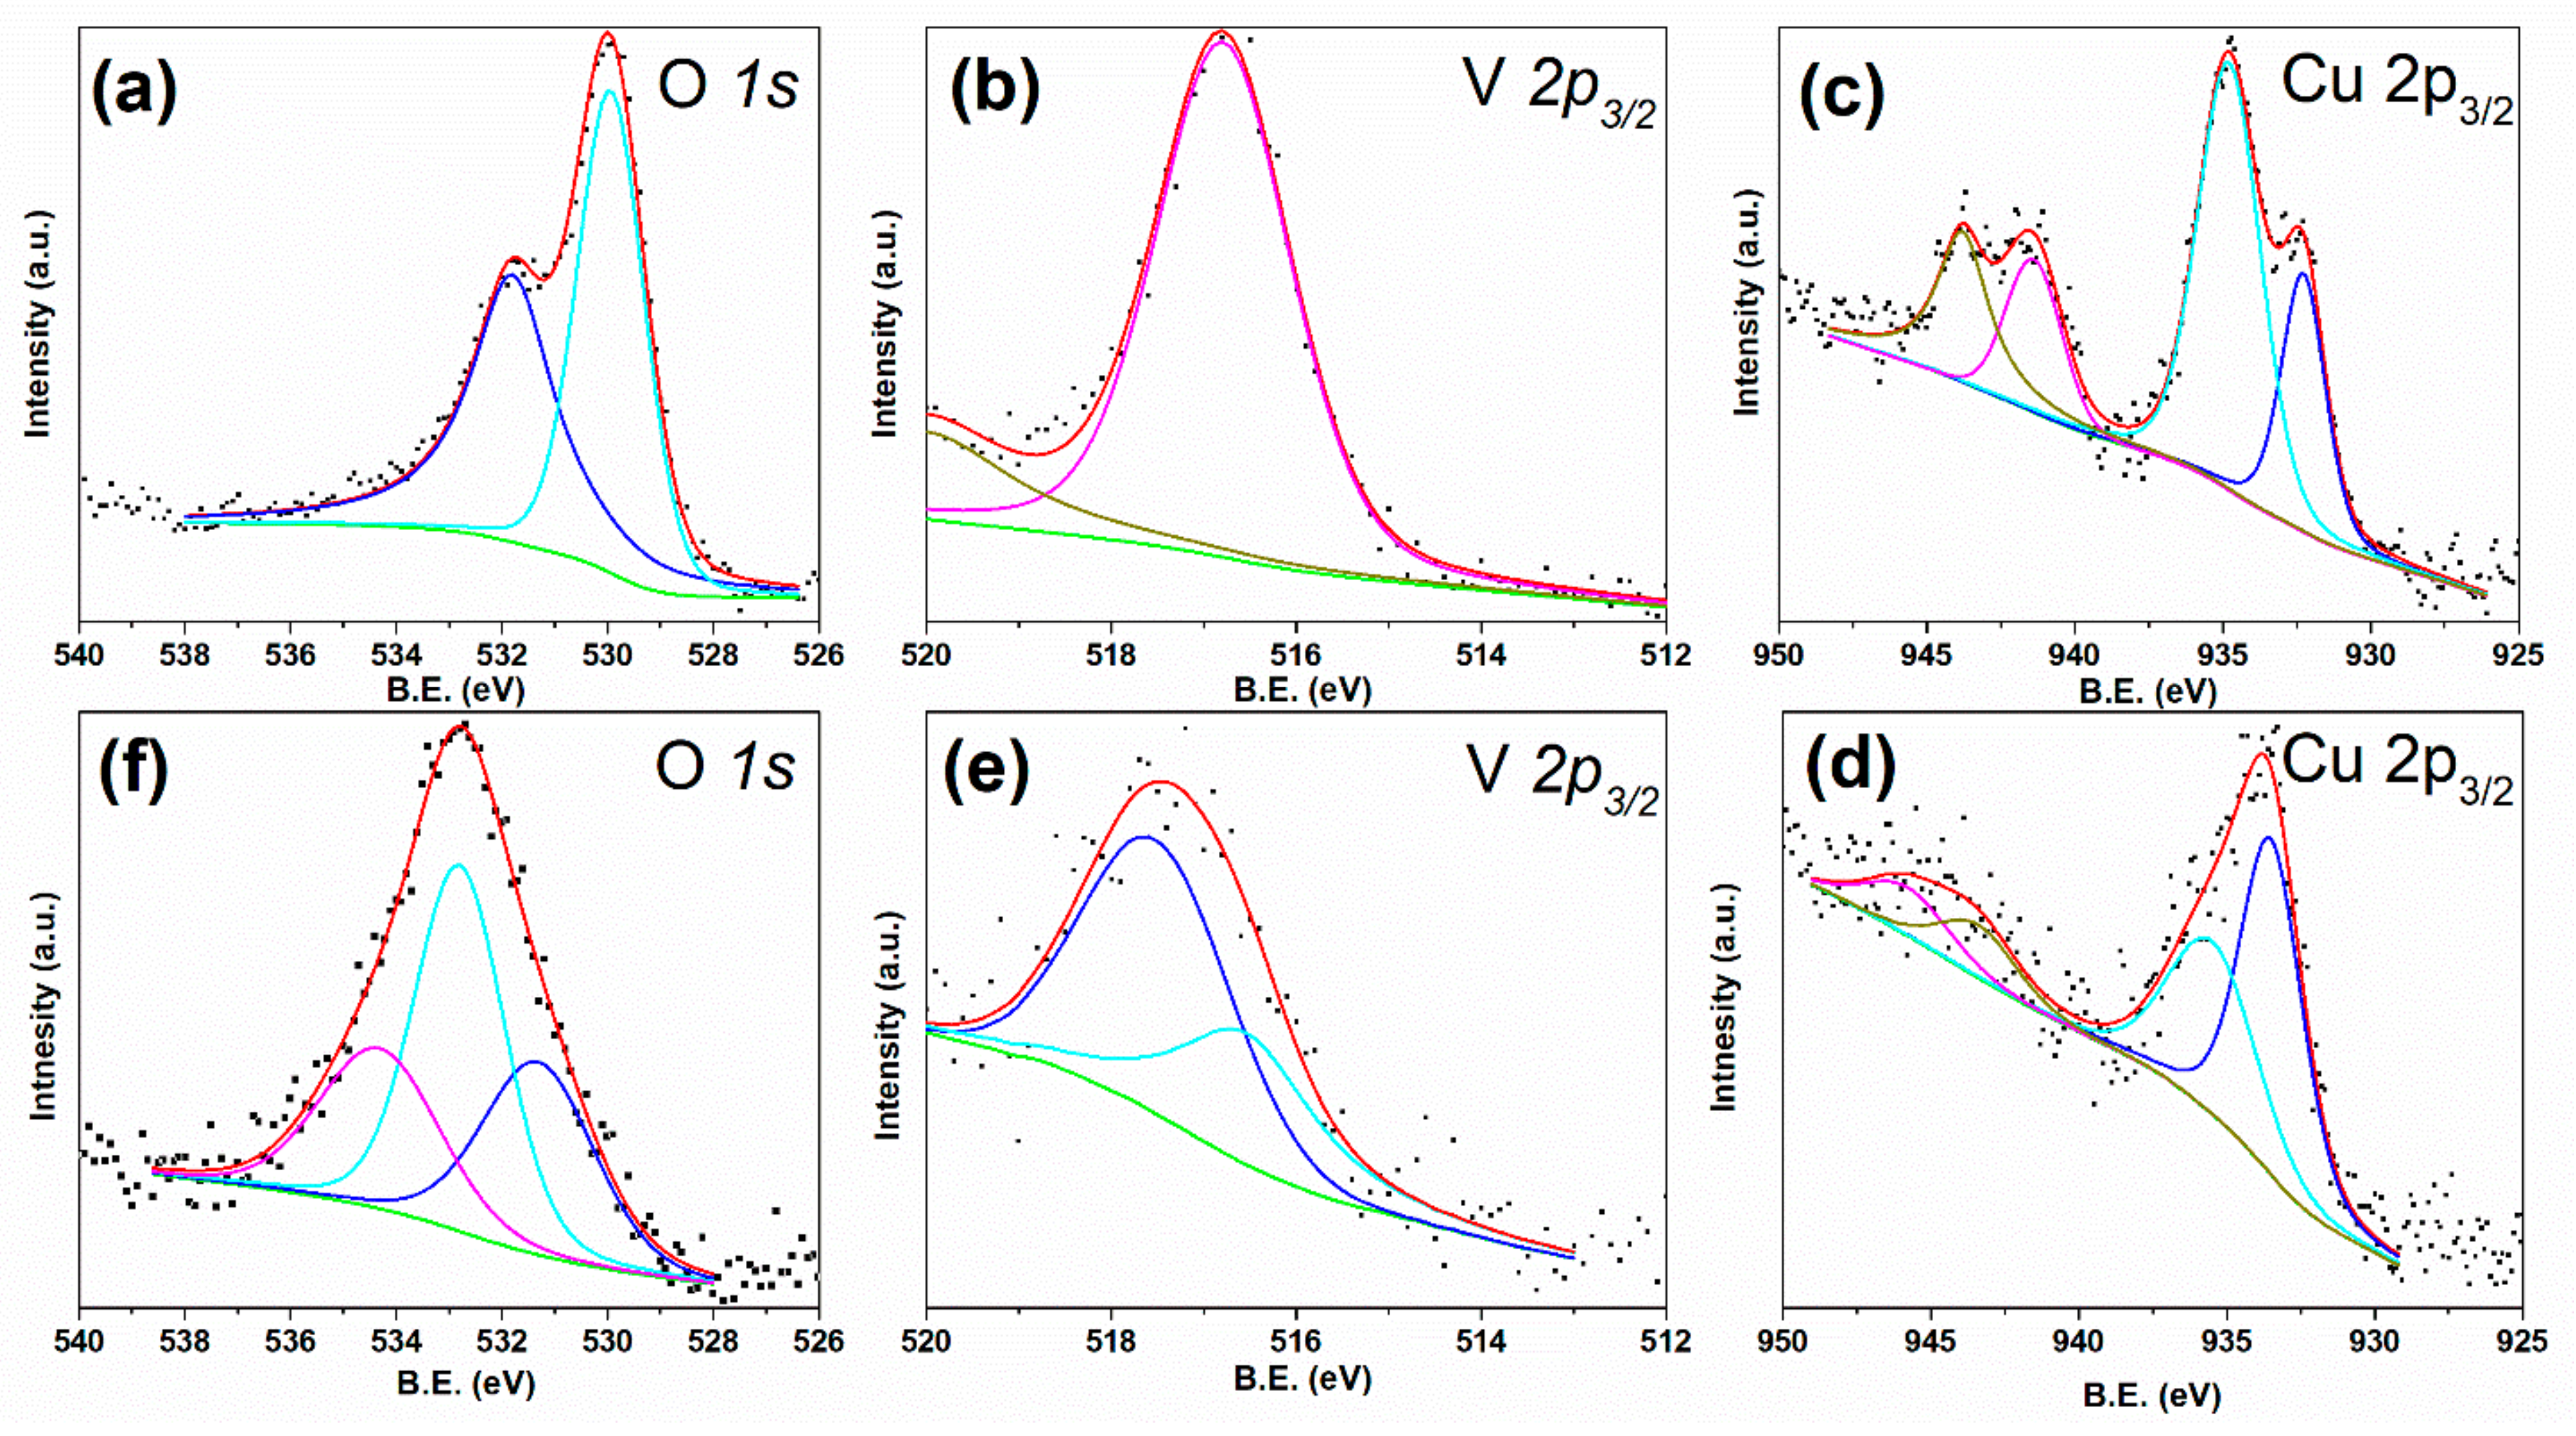
Figure 4 shows the O 1s, V 2p
3/2 and Cu 2p
3/2 XPS spectra obtained from β-Cu
2V
2O
7/TiO
2 (
Figure 4a–c) and r-GO/β-Cu
2V
2O
7/TiO
2 (
Figure 4d–f). The O 1s XPS spectrum of β-Cu
2V
2O
7/TiO
2 (
Figure 4a) can be fitted with two components, located at about 529.8 and 532.0 eV, corresponding to lattice O
2− ions from metal oxides and hydroxyl groups. In the case of the sample decorated with r-GO, the O 1s signal is mainly due to the oxygen atoms bound to carbon (
Figure 4f) and can be fitted with three components at 531.0, 533.0 and 534.5 eV. These three components are due to (O=C) groups, alcoholic groups (HO–C) and water, respectively. The signal at about 529.9 eV, assigned to TiO
2 and vanadate lattice oxygens, is highly attenuated by the GO layers that coat the TiO
2 NRs (see SEM images) [
29]. In the case of copper vanadate supported on TiO
2 NRs, without r-GO, the V 2p
3/2 signal (
Figure 4b) can be fitted with only one component at 516.8 eV with a full width at half maximum (FWHM) of about 1.5 eV, corresponding to V
5+, while in the case of the sample decorated with r-GO,
Figure 4e, the signal contains two components at 516.4 and 517.5 eV corresponding to V
4+ and V
5+, respectively [
6]. It is interesting to note that the Cu 2p
3/2 signal (
Figure 4c,d) indicates the presence of Cu
+2, assigned to the component at 535.4 eV, and Cu
+ at 533.0 eV [
30]. The Cu
+ signal, in the case of the sample treated with r-GO, is actually the main component (Cu
2+ 41% and Cu
+ 59%), indicating that some reaction has occurred between β-Cu
2V
2O
7 and GO. This is confirmed also by the presence of a quite high amount of V
4+ (V
5+ is 62% and V
4+ is 38%) signal, while the Cu
2+/V
5+ ratio (58% Cu
2+ and 42% V
5+) is not too far from the 1:1 expected value for β-Cu
2V
2O
7. In the case of the β-Cu
2V
2O
7/TiO
2 sample, the obtained Cu
2+/V
5+ ratio is also close to the expected value (40% of Cu and 60% of V) and the presence of Cu
+ (Cu
+ 35.5%, Cu
2+ 64.5%) can be due to a photoreduction effect due to the X-ray source or to the presence of traces of CuO
x [
6].
All substrates were tested in PEC experiments, where the light source was a neutral white led with intensity ca. 100 mW/cm
2 (
Figure S4) in Na-borate buffer electrolyte (pH = 9.2). In
Figure 5a, we report the linear voltammetry scans under chopped light for pure β-Cu
2V
2O
7 deposits obtained using different ligands. From the plot it is easy see that NH
3 furnishes the better results in terms of photocurrent (ca. 220 µA/cm
2 a 1.55 V vs. RHE). For this reason, the decoration of TiO
2 NRs by β-Cu
2V
2O
7 was obtained by using NH
3 in the precursor solution. As clearly visible in
Figure 5b,c, the TiO
2 NRs decorated with β-Cu
2V
2O
7 show a better performance in terms of durability with almost no variation in the photocurrent after 3 h of EC work. On the contrary, the photocurrent density is lower with respect to the pure, β-Cu
2V
2O
7 on FTO (
Figure 5a).
Addition of GO flakes by electrophoretic deposition allowed to obtain a much higher photocurrent density (see
Figure 5b,c) and a very good durability. Finally, in
Figure 5d, we report a comparison between the O
2 measured for the r-GO/β-Cu
2V
2O
7/TiO
2 sample in the gas phase (head-space in a sealed electrochemical cell previously purged with N
2), by an O
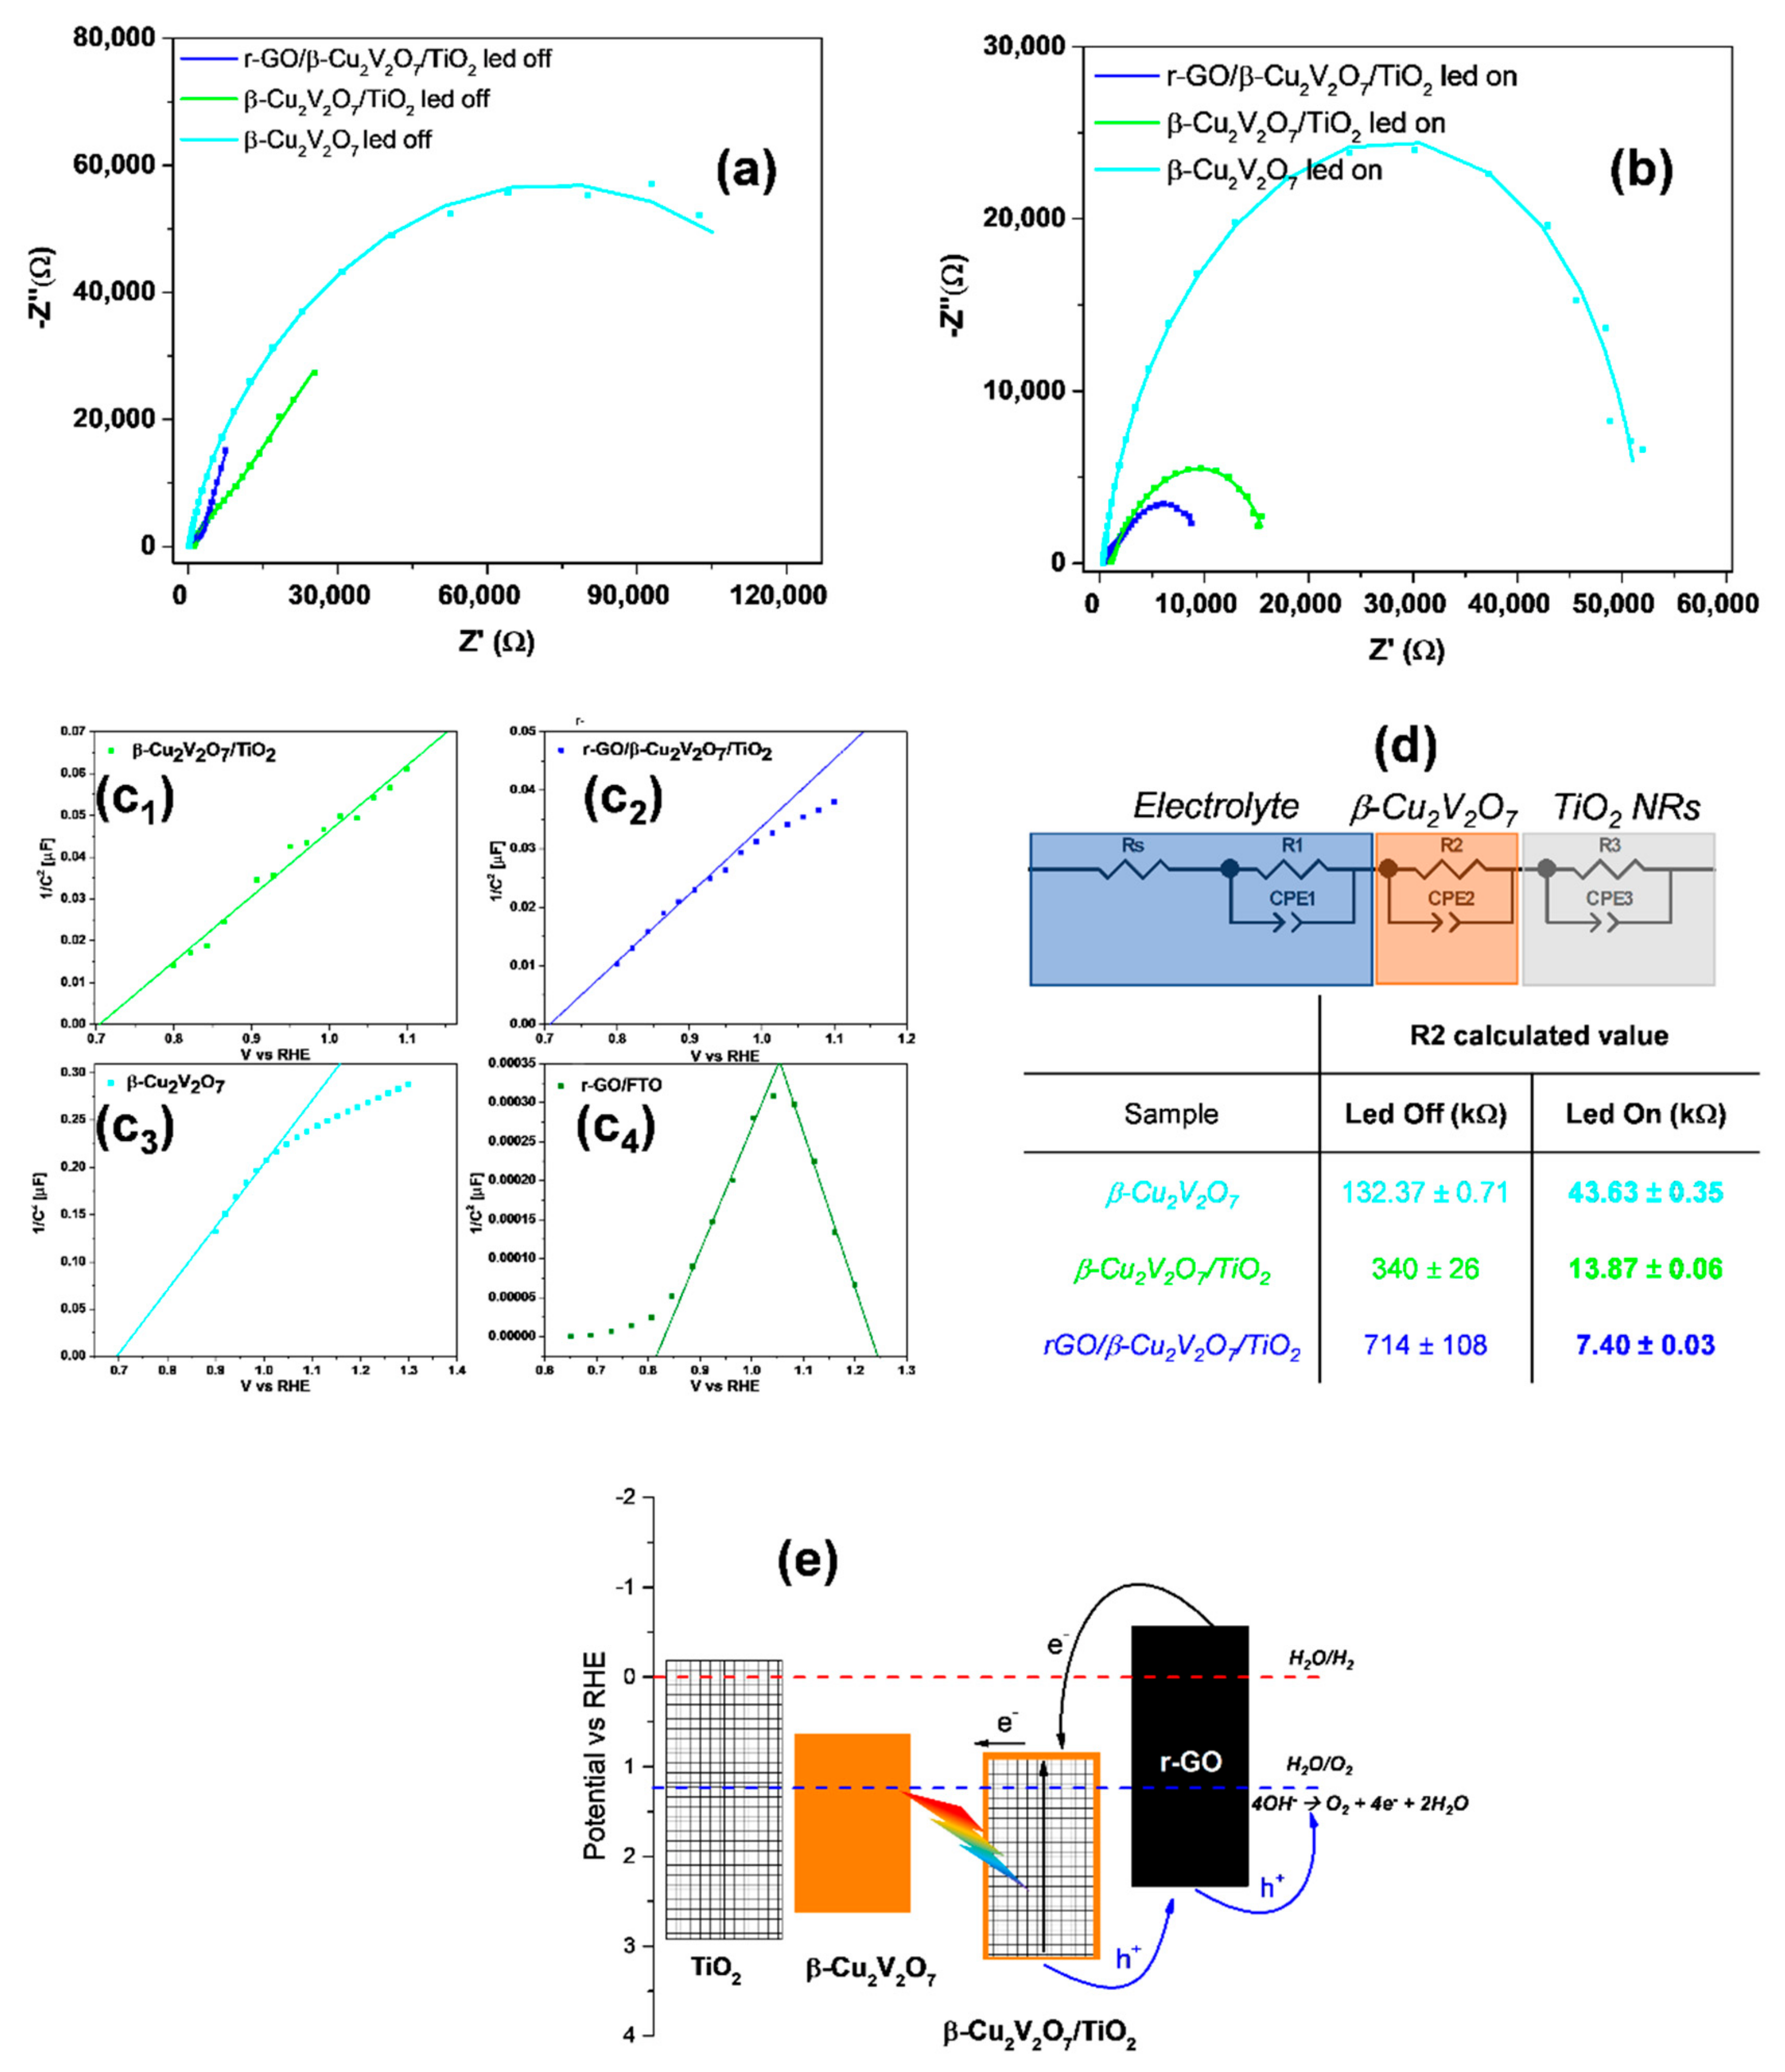
2 probe, based on the quenching of fluorescence, and the theoretical one, calculated from the recorded photocurrent. This measurement clearly demonstrates that the recorded photocurrent is not due to side processes like r-GO oxidation. The samples were also characterized by impedance spectroscopy (EIS) in the dark and under illumination at 1.5 V vs. RHE. From the data reported in
Figure 6a,b it is evident that the samples β-Cu
2V
2O
7/TiO
2 and, especially r-GO/β-Cu
2V
2O
7/TiO
2, are characterized by a much lower charge transfer resistance. The equivalent circuit used to fit the data [
31] contains 2 RQ elements (parallel connection of an ohmic resistance R and a constant phase element Q), in the case of pure β-Cu
2V
2O
7 on FTO, while for the composite materials β-Cu
2V
2O
7/TiO
2 and r-GO/β-Cu
2V
2O
7/TiO
2, we have used a series of 3 RQ elements. This circuit is represented in
Figure 6d where the R
s represents the solution resistance, the first RQ element the double layer, the second one the Cu-vanadate layer and the third one the TiO
2 NRs. It is interesting to point out that upon illumination only the second circuit (R
2) shows a very strong decrease in the charge transfer resistance, while the other 2 circuits present only minor variations. This is a strong indication that it is mainly the Cu-vanadate layer that acts as the active material in the water photo-oxidation, while the role of TiO
2 is simply that of a substrate.
In
Figure 6c we report also the Mott-Schottky (MS) plots (in the range 1–10
5 Hz) obtained from pure β-Cu
2V
2O
7, β-Cu
2V
2O
7/TiO
2 and r-GO/β-Cu
2V
2O
7/TiO
2. The relation between the flat-band potential (
Vfb) and the material capacity (
C) is reported in Equation (2).
NSC indicates the carrier’s concentration in the space charge of the material,
ε the dielectric constant,
e is the electron charge and
A is the area of the electrode. n-types semiconductors, like TiO
2 and β-Cu
2V
2O
7, are characterized by positive slopes, while p-types materials have negative slopes.
The capacity values were calculated by fitting the impedance data with a Randle’s circuit containing Constant Phase Elements (CPE) instead of ideal capacitors. Thus, the capacity was calculated from Brugg’s Equation (3) [
32]
where
Q and
p, are fitting parameters from CPE elements,
Rs is the cell resistance and
Rp is the resistance in parallel with CPE elements. By plotting
C−2 vs. RHE it is possible to determine
Vfb and from this value to derive the approximate position of conduction (CB) and valence (VB) edges. The relation between
Vfb and bands edges (
Ecb and
Evb) can be expressed by Equations (4) and (5) [
33]:
where
Ncb and
Nvb, are the effective density of states in the CB and VB for a n-type and p-type semiconductors, respectively. In the case of n-type conductivity Equation (4) is usually approximated with
Ecb ≈
Vfb + 0.1 eV [
8]. Thus, the MS plots reported in
Figure 6c, show how the decoration of TiO
2 does not change band edges position of the copper vanadate (TiO
2 acts as a support), while the addition of p-type GO, probably produces many p-n nano-junctions with β-Cu
2V
2O
7/TiO
2 (see scheme of
Figure 6d, although not visible from the MS plot of
Figure 6c
2. Indeed, the lower slope of the MS plot of
Figure 6c
2 indicates a higher concentration of electrons (1 × 10
17 m
−3 for β-Cu
2V
2O
7/TiO
2 and 1.4 × 10
17 m
−3 for the sample decorated with r-GO), as already seen in the case of TiO
2 nanorods decorated with Cu
2O nanoparticles [
34]. Finally, the p-type conductivity of r-GO is clearly seen from the MS plot obtained from a pure r-GO sample deposited on FTO and thermally treated at 200 °C for 15 min (
Figure 6c
4).
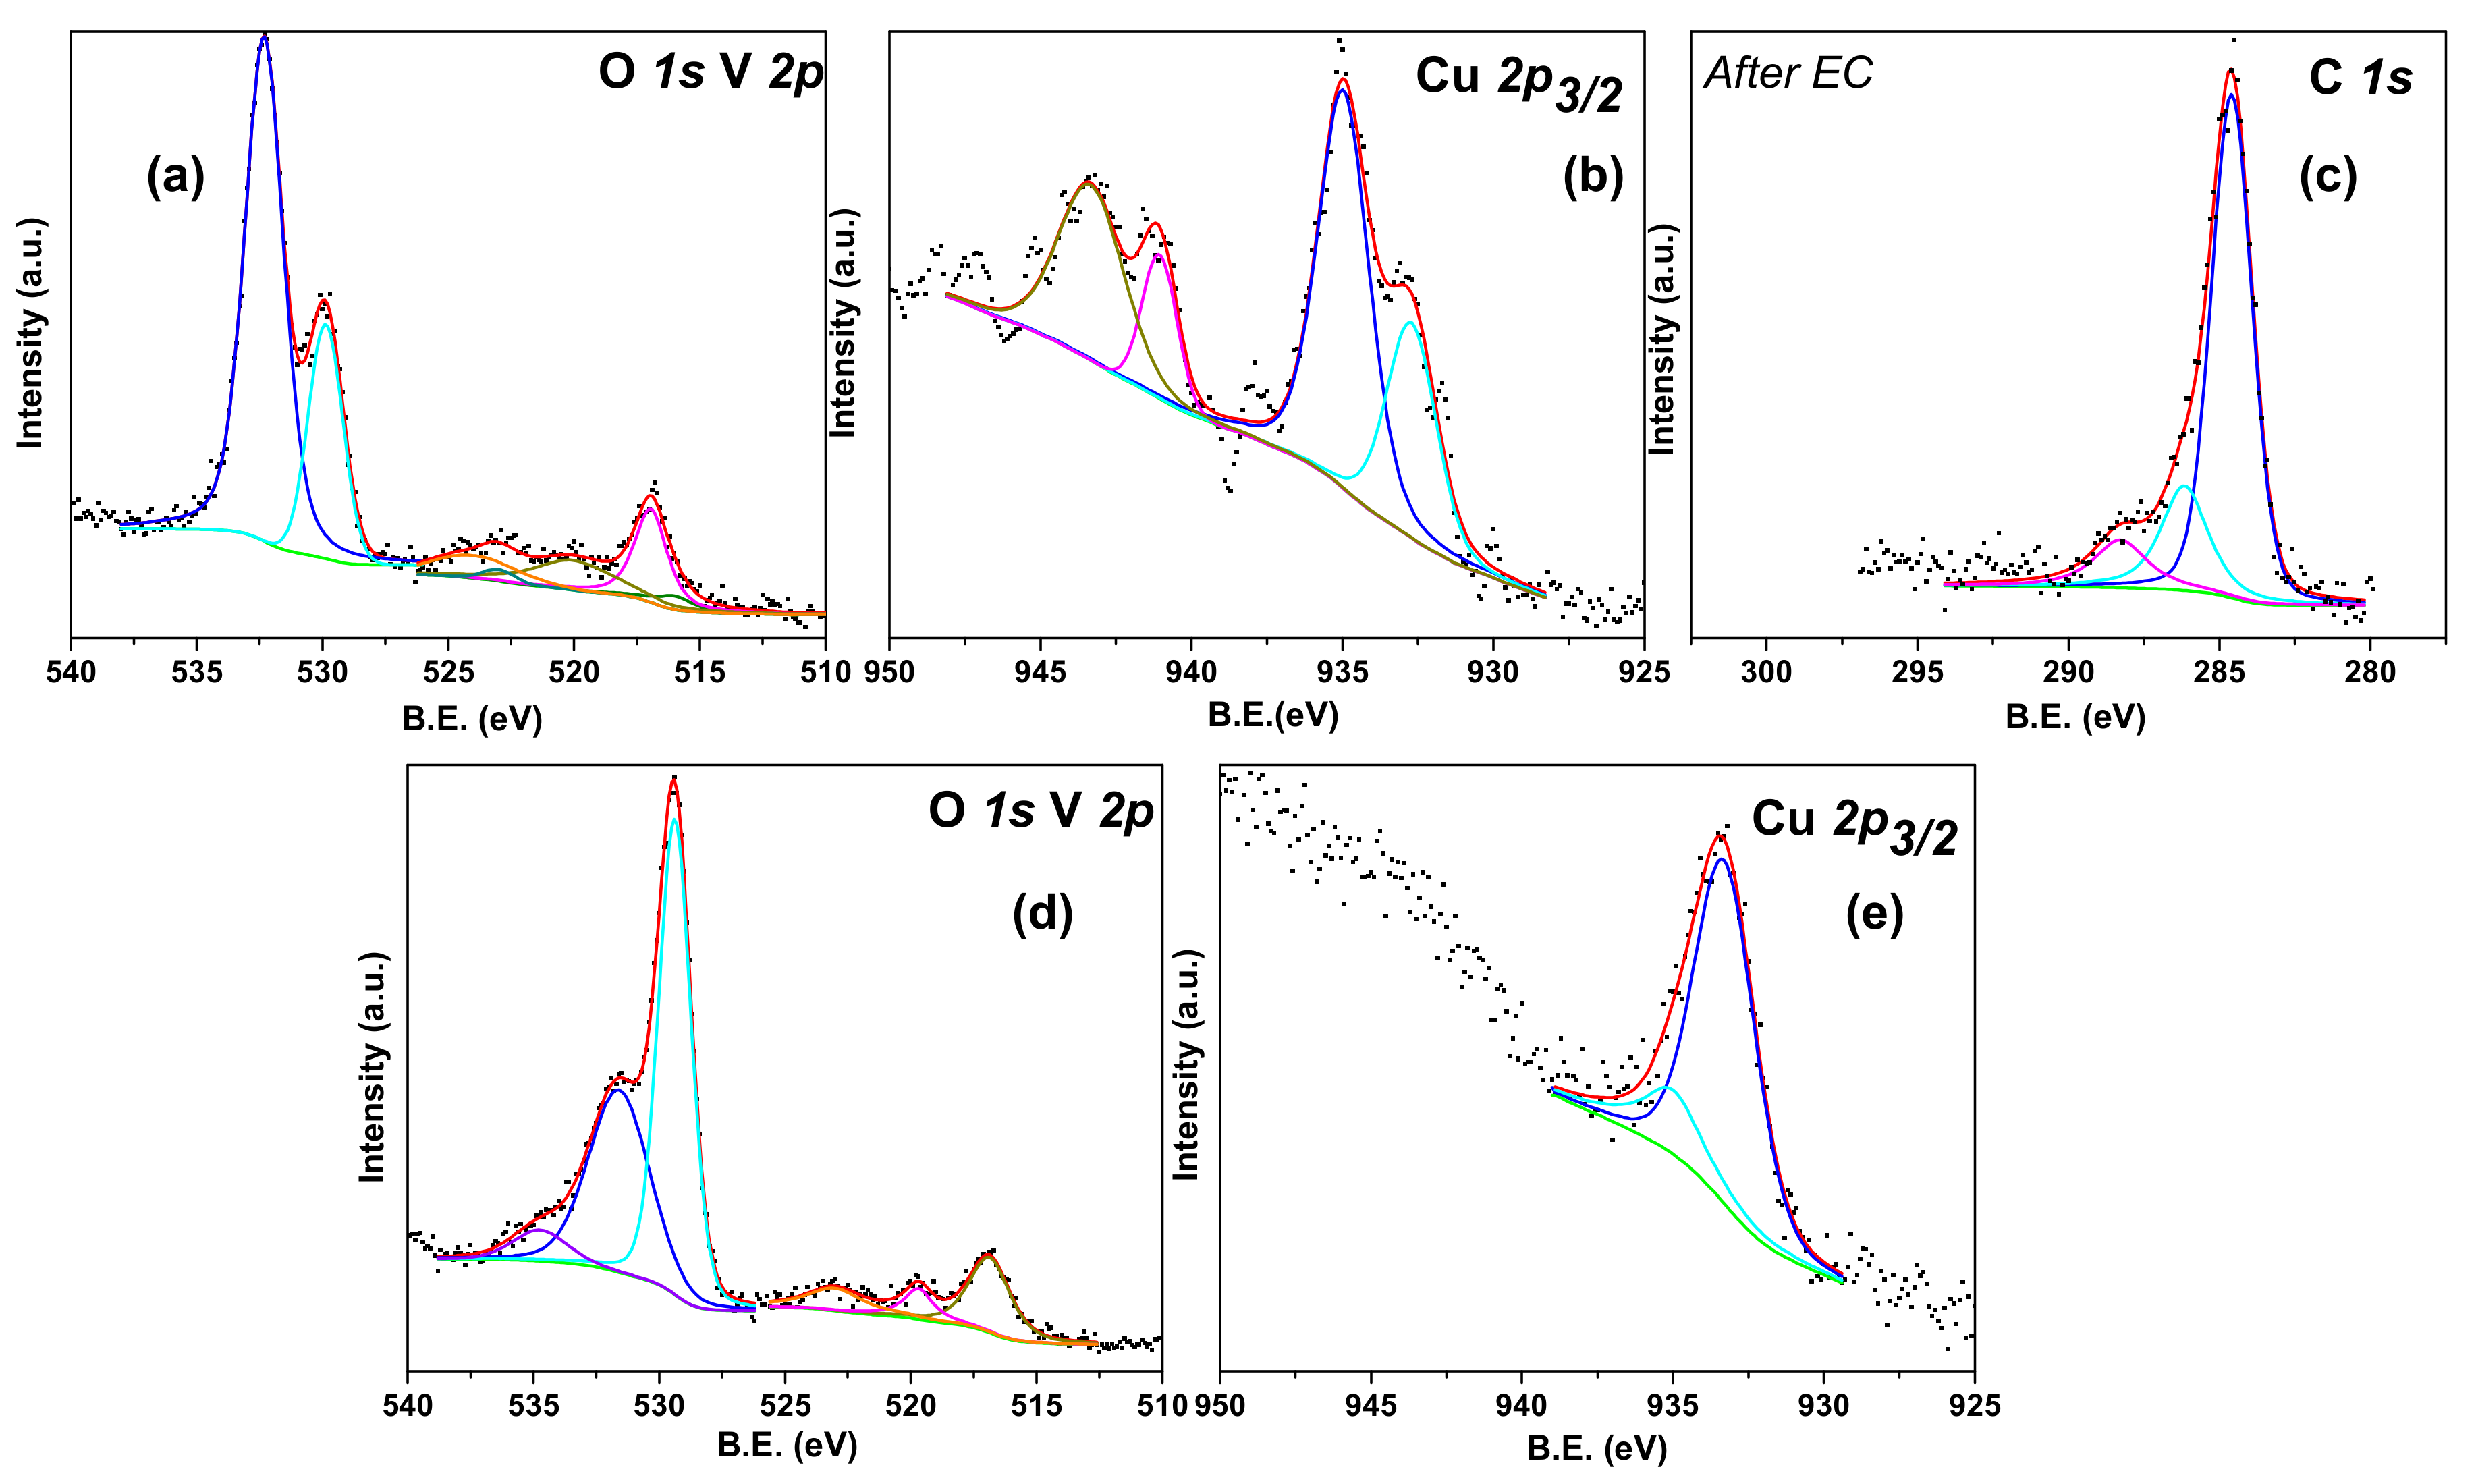
More precise details about the surface composition of these nanostructures can be obtained by acquiring XPS data after electrochemical work. The results of this analysis are summarized in
Figure 7 and
Table 1.
Figure 7a,b shows the O 1s, V 2p and Cu 2p XPS spectra obtained from β-Cu
2V
2O
7/TiO
2 NRs after 3 h of electrochemical measurements, under illumination. The O 1s XPS spectrum can be fitted with two components located at about 529.9 and 532.0 eV that correspond to lattice O
2− ions from β-Cu
2V
2O
7 and TiO
2 and hydroxyls groups [
35]. The V 2p
3/2 signal (in
Figure 7a), can be fitted with two components at 516.0, weak, and 517.0 eV corresponding to V
4+ and V
5+ respectively. The Cu 2p
3/2 signals (
Figure 7b) contains two components, one at 935.0 and another at 933.0 eV indicating the presence of Cu
2+ and a considerable quantity of Cu
+. The presence of Cu
+ is probably caused by a photo-reduction effect and eventually by X-rays in UHV. In
Figure 7c we show also the C 1s spectra acquired from a sample of r-GO/β-Cu
2V
2O
7/TiO
2 after PEC work. The region can be fitted with 3 components at 284.1, 285.7 and 288.0 eV corresponding respectively to C–C, C–O and C=O bonds [
26]. The relative intensity and positions of these signals are fully compatible with p-type r-GO oxide, after a mild heat treatment [
36]. A simple visual inspection of the O 1s and V 2p region, reported in
Figure 7d, reveals how the amount of V in the case of the r-GO/β-Cu
2V
2O
7/TiO
2 is significantly lower if compared with the sample not containing GO. In fact, the V 2p signal is much lower with respect to the O 1s signal at 529.4 eV. Moreover, the Cu 2p signal, reported in
Figure 7e, shows mostly the presence of Cu
+ deduced from the position (933.0 eV) and the very low intensity of the satellites peaks. This fact is in agreement with what already verified on the sample before PEC work where the high amount of Cu
+ and the high Cu/V ratio indicated that the addition of GO modified the composition of the vanadate.
The Cu/V ratios obtained from XPS data after EC work are similar to those obtained before EC (Raman spectra and SEM images after EC are reported in
Figures S6 and S7, respectively). In the case of β-Cu
2V
2O
7/TiO
2 we found a 52% abundance of V
5+ and 48% for Cu
2+, with a rather high amount of Cu
+ (
Figure 7b). In the case of the sample decorated with r-GO, the amount of Cu
2+ is 32%, while the amount of V
5+ is 68%. In this last case the large quantity of Cu
+ seems to be due to the presence of the GO layer.
All the above reported data indicate that supporting β-Cu
2V
2O
7 on TiO
2 NRs allows the obtainment of a material with good durability, as photoanode, with a much lower charge transfer resistance as testified by the EIS data (
Figure 6a,b). The interaction between the TiO
2 NRs and β-Cu
2V
2O
7 has a favorable effect on the photocurrent production since the deposition of V
2O
5 on TiO
2 NRs, by the same AASP process, does not lead to any particular enhancement in the photocurrent if compared with untreated TiO
2 (see
Figures S8 and S9). It’s also known that the decoration of Degussa P25 by CuO nanoparticles actually leads to a modest enhancement of photocurrent values [
37]. A significant improvement in the photocurrent density can be achieved by decorating the β-Cu
2V
2O
7/TiO
2 sample by GO followed by heat treatment at about 200 °C. The addition of GO changes the Cu/V ratio leading to high amount of Cu
+ as testified by the XPS spectra, acquired before and after EC work. We think that the better performance in terms of photocurrent is due to the combination of r-GO/β-Cu
2V
2O
7/TiO
2 since the addition of r-GO to TiO
2 NRs did not lead to any particular improvement in the photocurrent, as is clearly visible in
Figure 5b. We verified that the interaction of GO with β-Cu
2V
2O
7 and heat treatment at 200 °C, after the electrophoretic deposition of GO, actually leads to the formation of p-type r-GO with a band gap, as measured from the UV–Vis spectra (see
Figure S10) of about 2.5–2.7 eV. We can justify the interaction of GO with β-Cu
2V
2O
7, that leads to the variation in the Cu/V ratio, as caused by the relatively low pH of the GO suspension (pH = 6.5), used during the electrophoretic deposition process, and by the GO itself. In fact, the solubility of β-Cu
2V
2O
7 increases at low pH and, at the same time, the GO sheets can easily co-ordinate the Cu
2+ ions [
38]. The Cu
2+ ions, once chemisorbed on the GO nano-sheets, most probably by the carboxylic groups, can be reduced by GO and most probably by the heat treatment, with formation of CO
2 as summarized in the following reaction sequence [
38]:
As known and reported in several publications, the mild thermal treatment at 200–210 °C that leads to the formation of a partially reduced GO has to be intended formally as a disproportionate reaction where the electrons released with O
2, CO or CO
2 evolution are used to reduce the GO surface [
39,
40]. In this particular case, we think that this process leads also to the formation of Cu
+ species as Cu
2O nanoparticles. Since the
Vfb is the same for β-Cu
2V
2O
7, β-Cu
2V
2O
7/TiO
2 and r-GO/β-Cu
2V
2O
7/TiO
2 and the Cu
2+/V
5+ ratio on r-GO/β-Cu
2V
2O
7/TiO
2 is compatible with a 1:2 value, we can formulate the hypothesis that the vanadate partially decomposes forming Cu
2O nanoparticles on the GO flakes and on the NRs surface, while remaining still on the TiO
2 surface, in lower amounts, in a form compatible with the a “CuV
2O
6” stoichiometry. The position of band edges of r-GO with respect to the band edges of the composite material, β-Cu
2V
2O
7/TiO
2, is particularly favorable to form many p-n nano-junctions, as depicted in
Figure 6d, leading to a better charge separation, increase in the photocurrent density and improved durability. It is important to note that the slightly higher position of
Ecb of pure TiO
2 NRs (slightly above the H
+/H
2 reduction potential) would have led to a less favorable junction with p-type r-GO. Finally, the possible formation of a further p-n junction between the Cu
2O nanoparticle and the TiO
2 surface should also be taken into account [
34].

 ,
, 


