Understanding the Role of Rutile TiO2 Surface Orientation on Molecular Hydrogen Activation


Abstract
:
1. Introduction
2. Materials and Methods
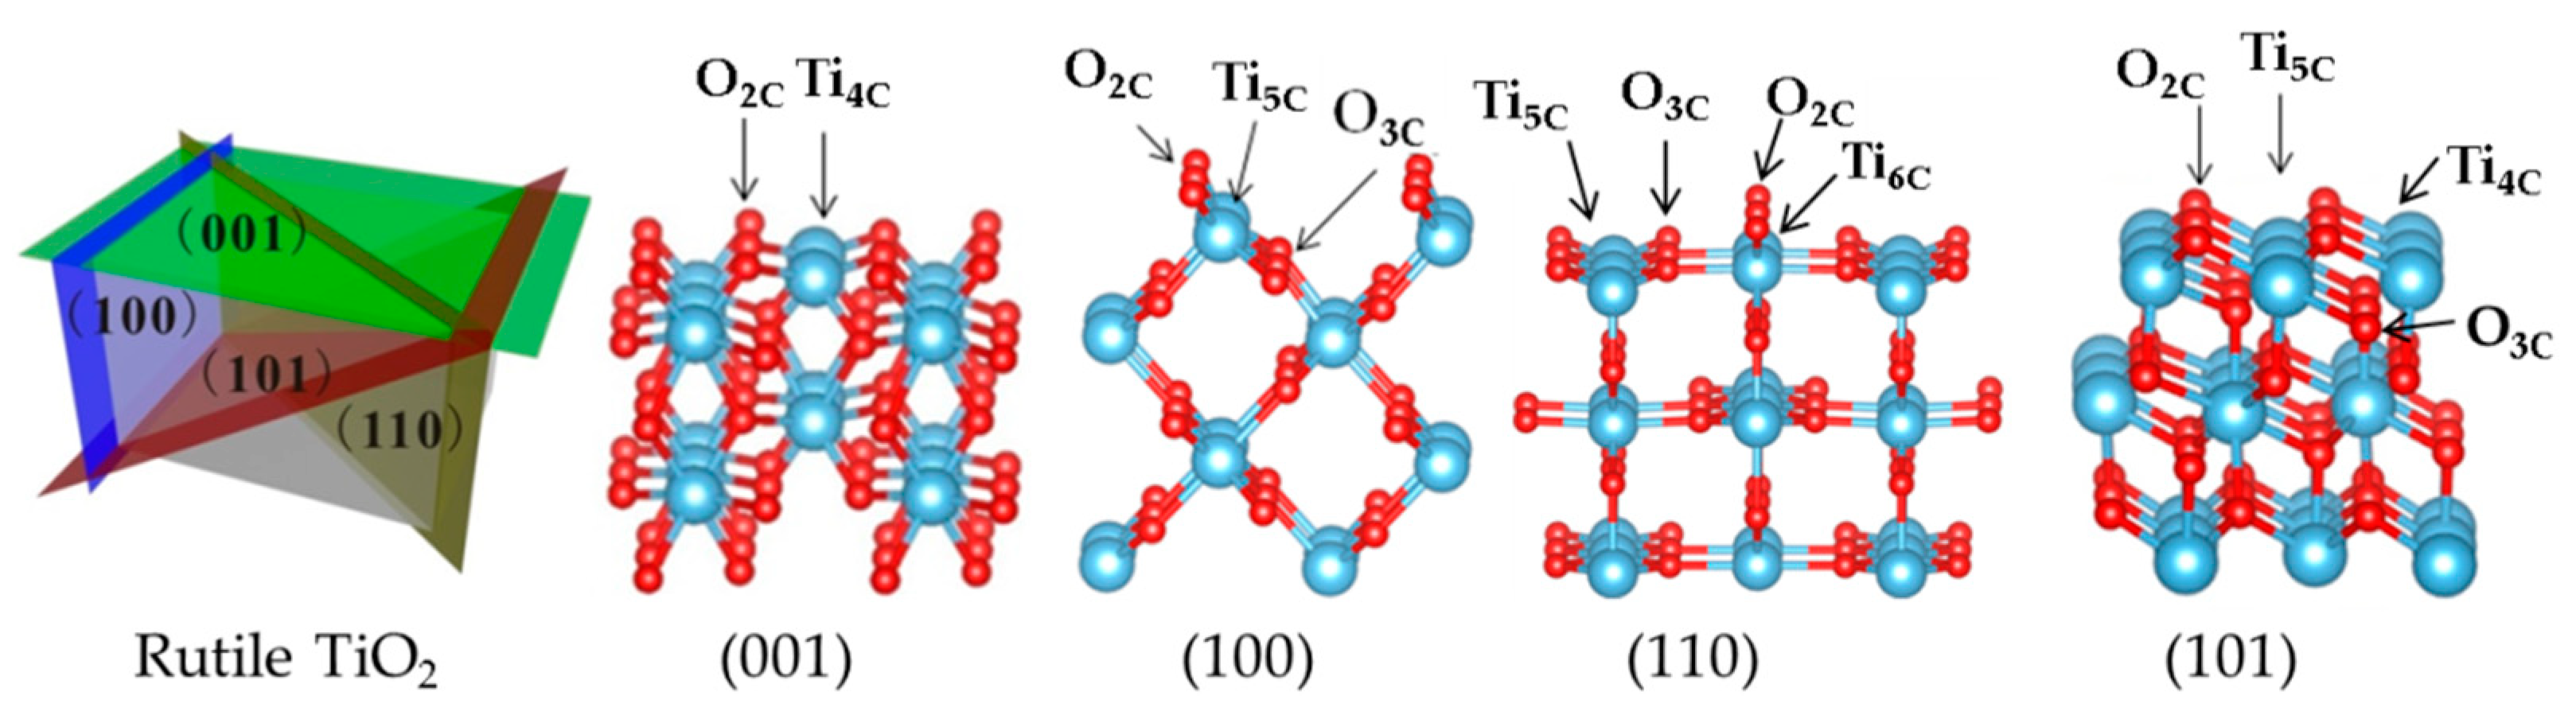
Slab Model
3. Results and Discussion
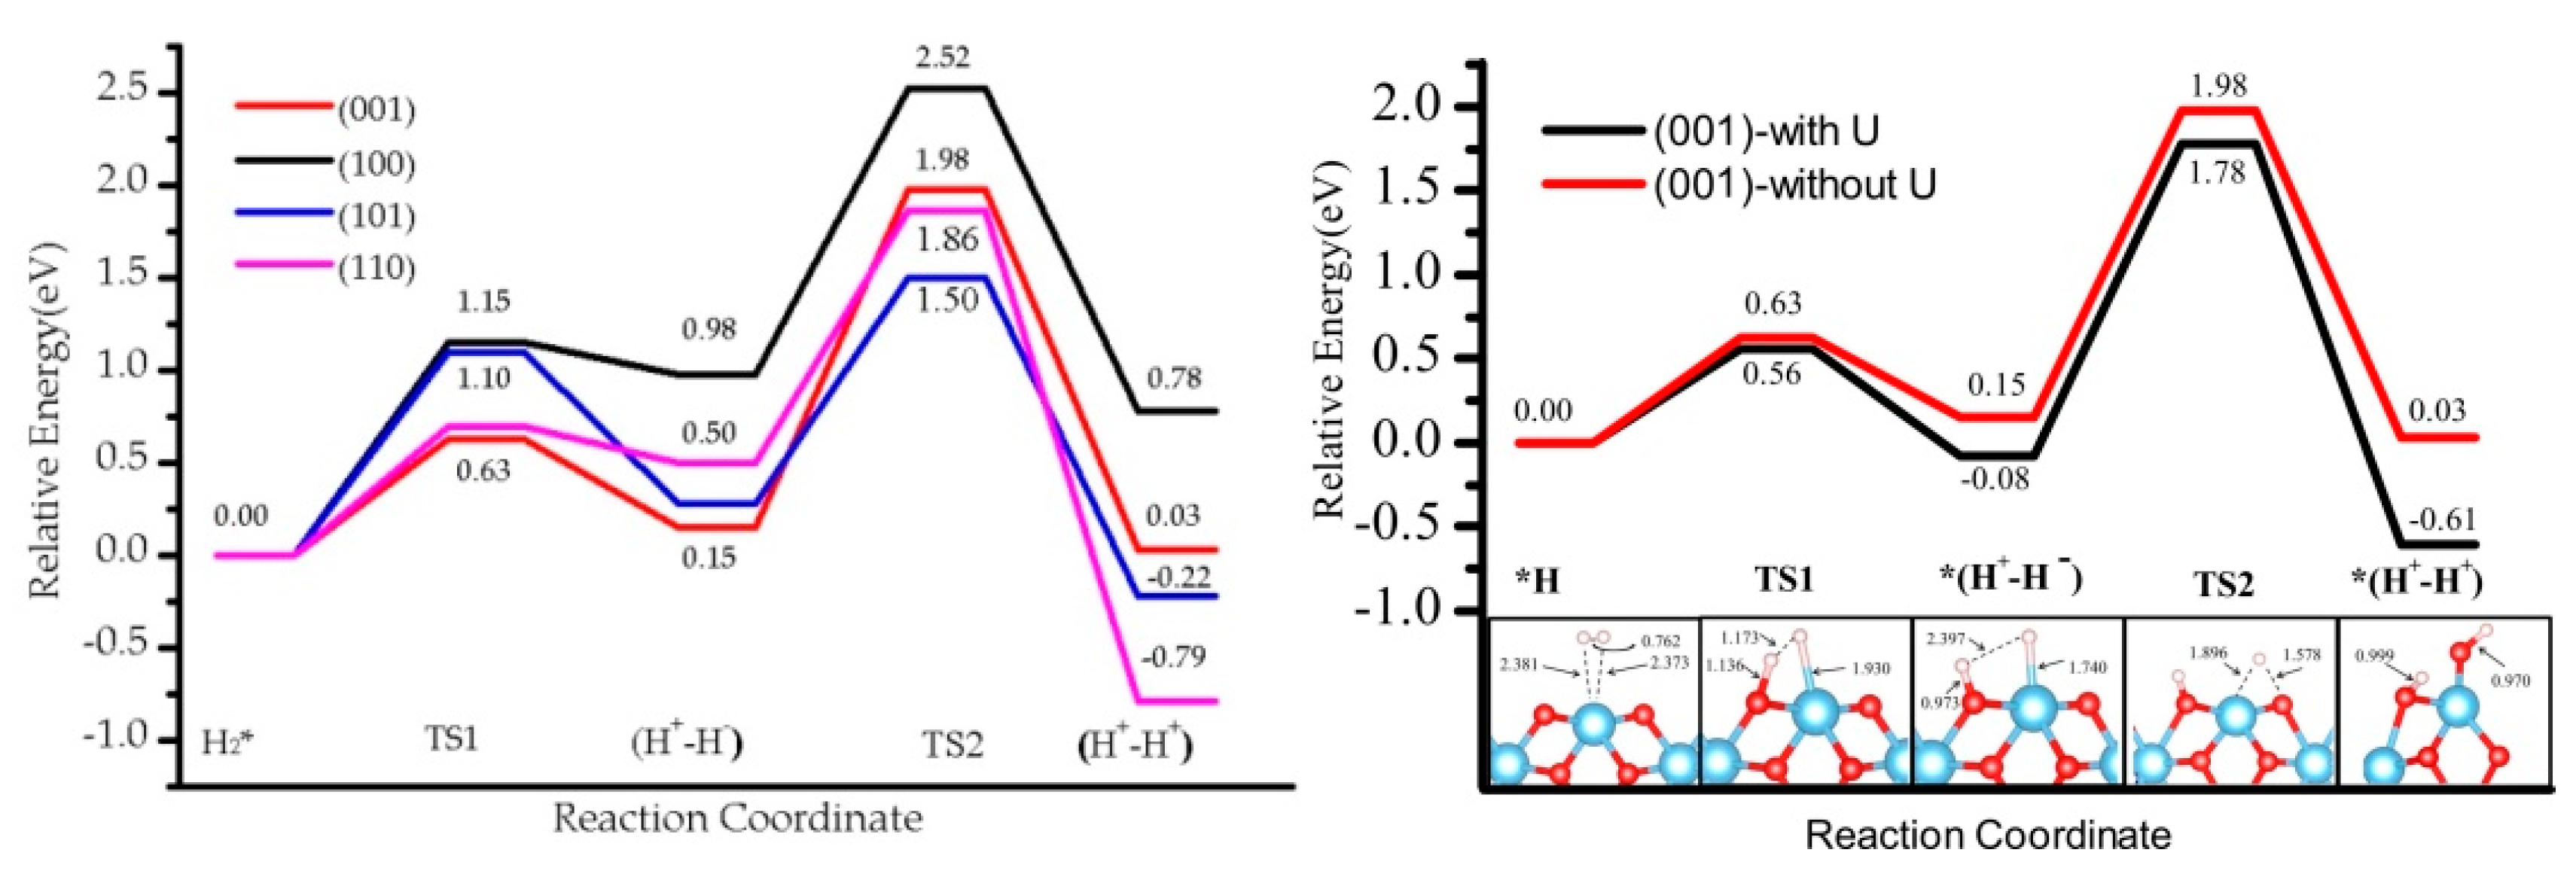
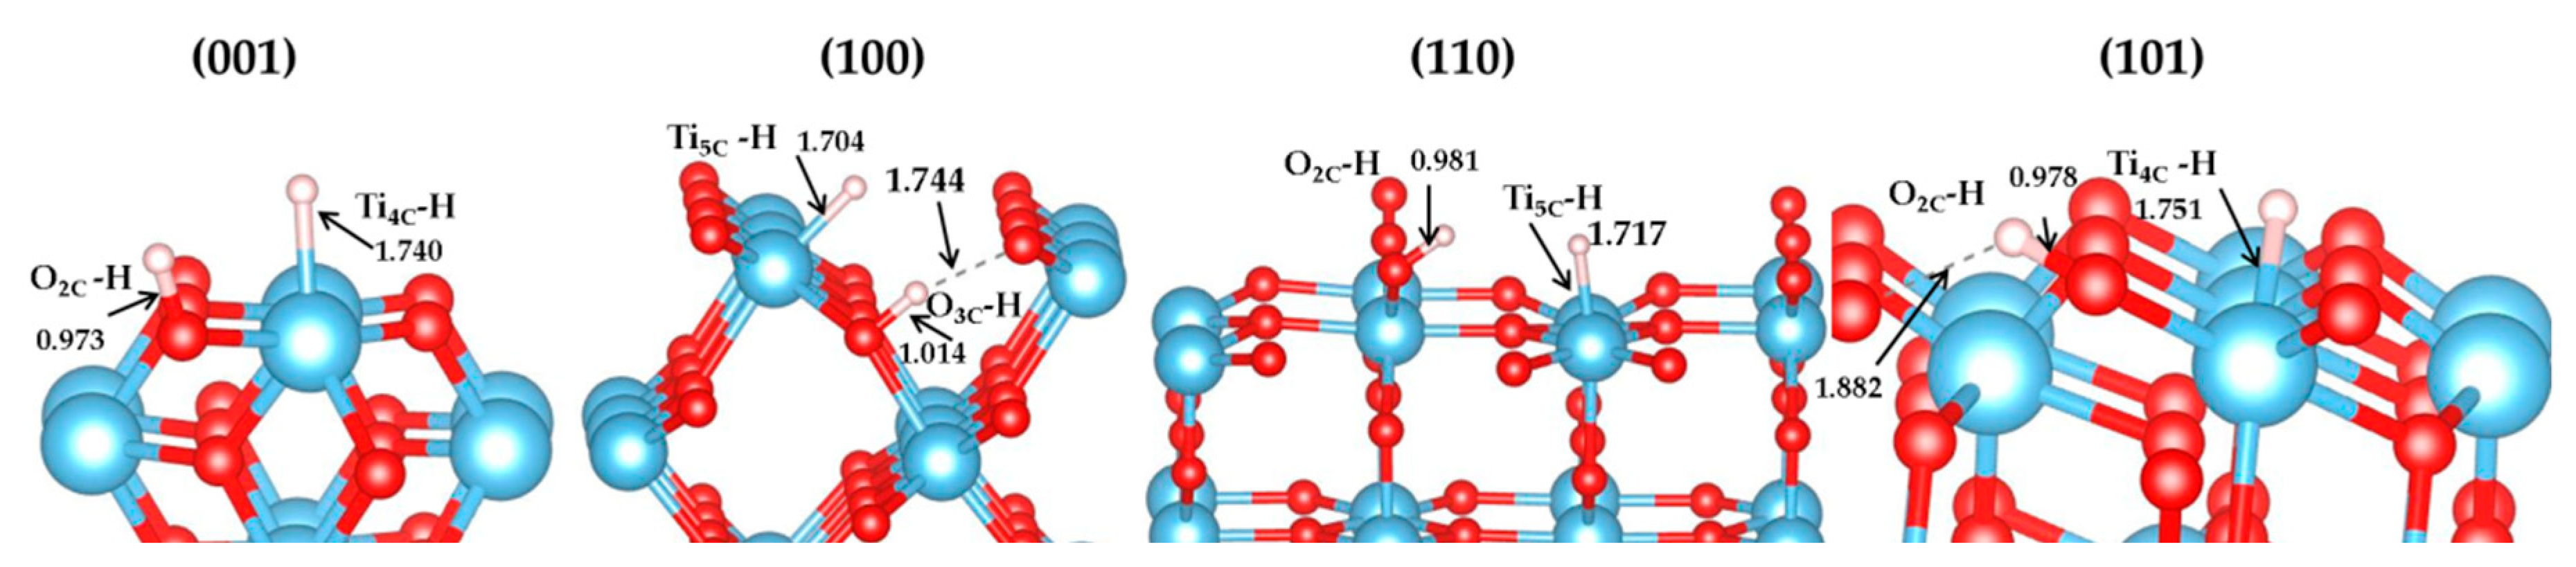
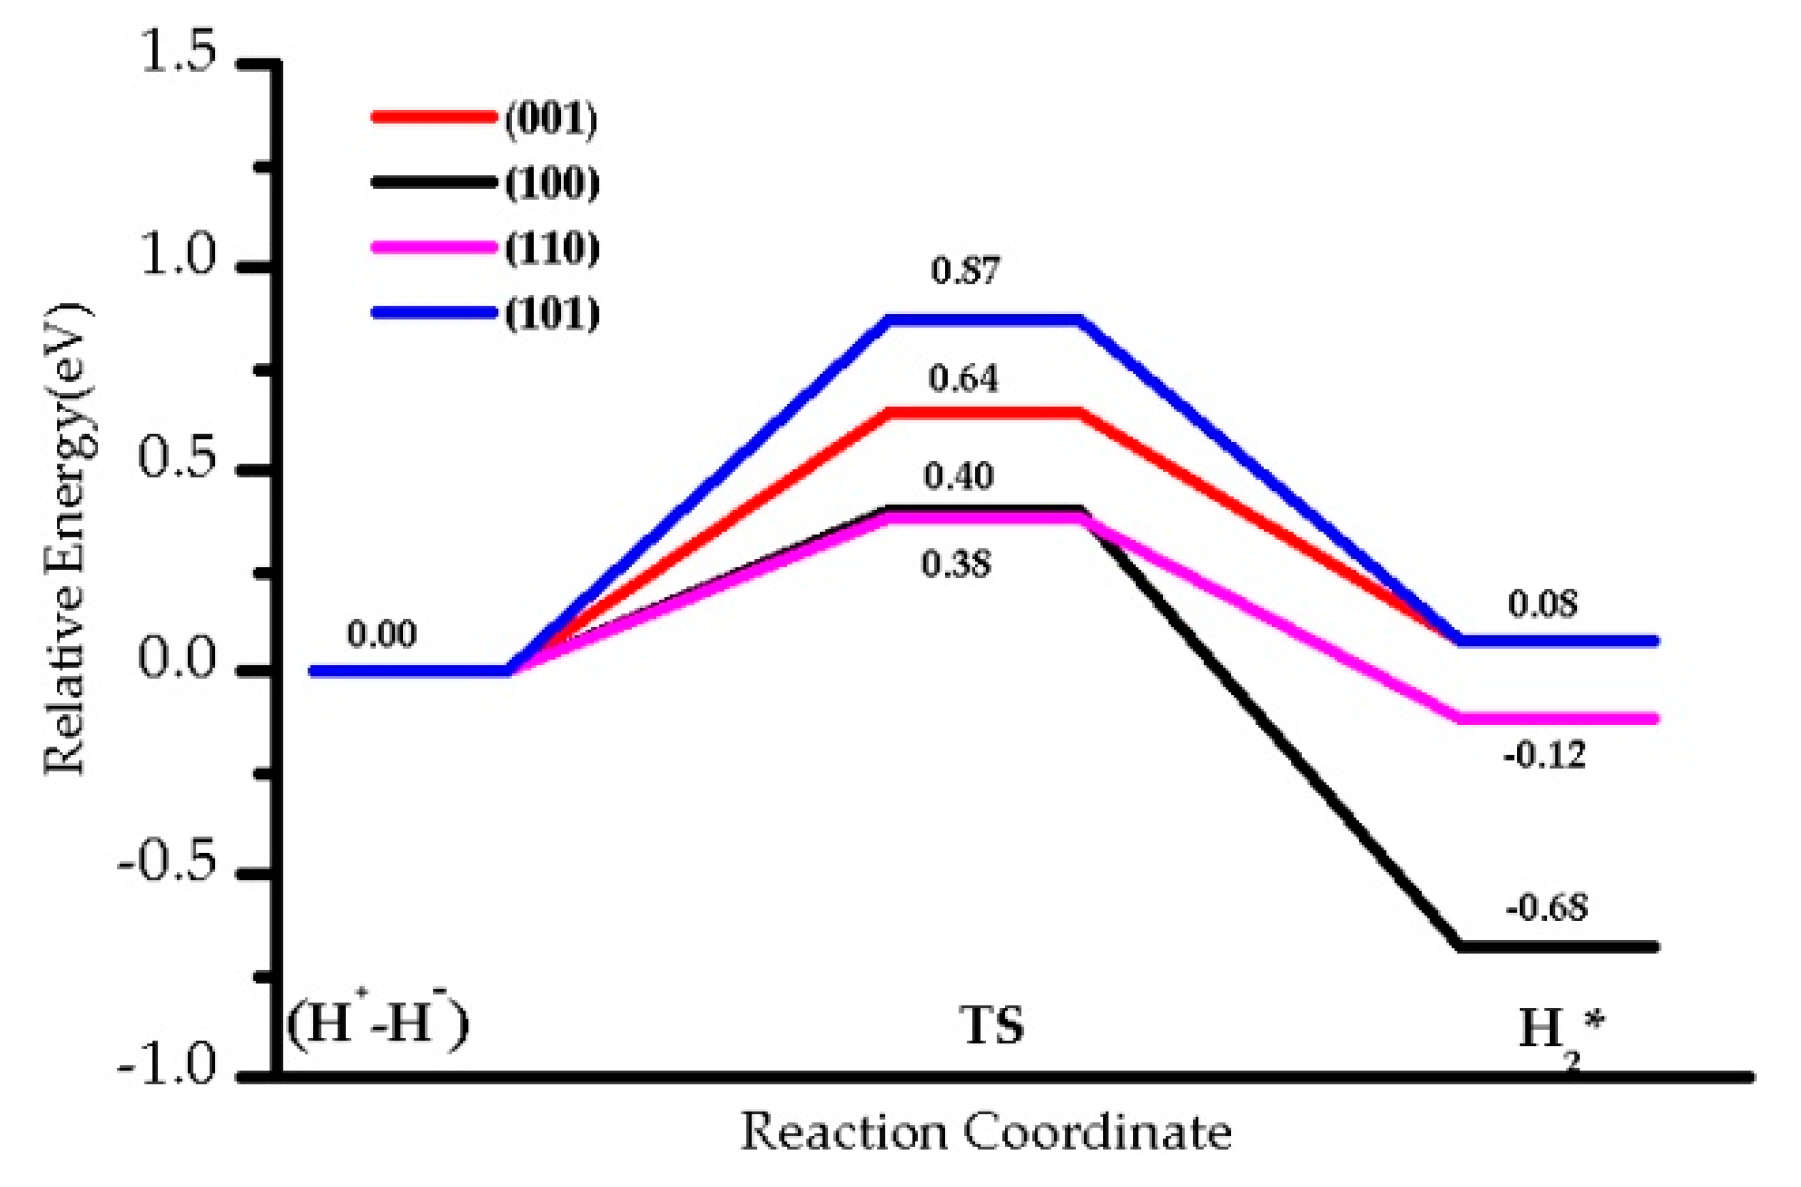
3.1. H2 Dissociation
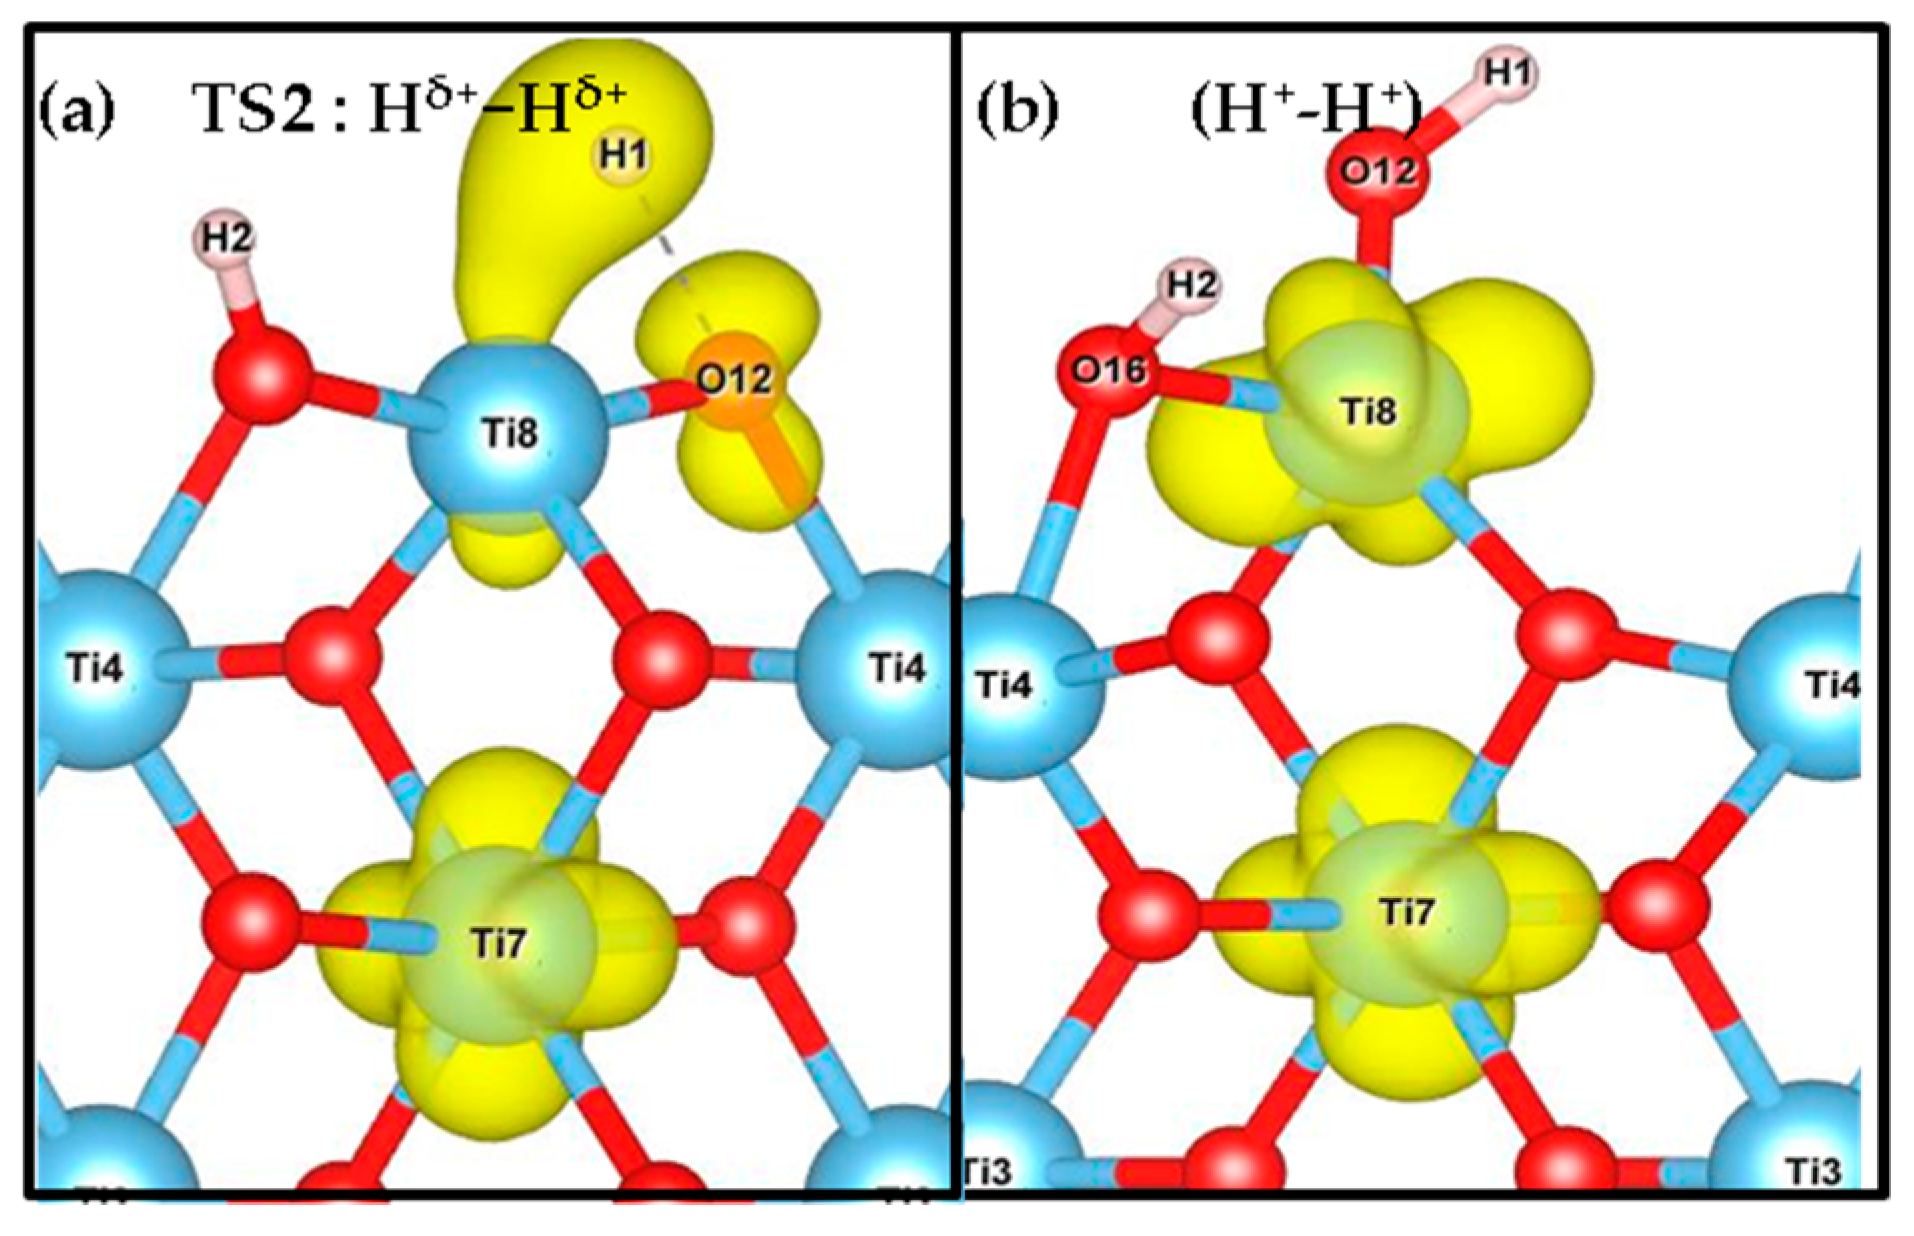
3.2. Electronic Structure
3.3. Effect of the Hubbard Correction U
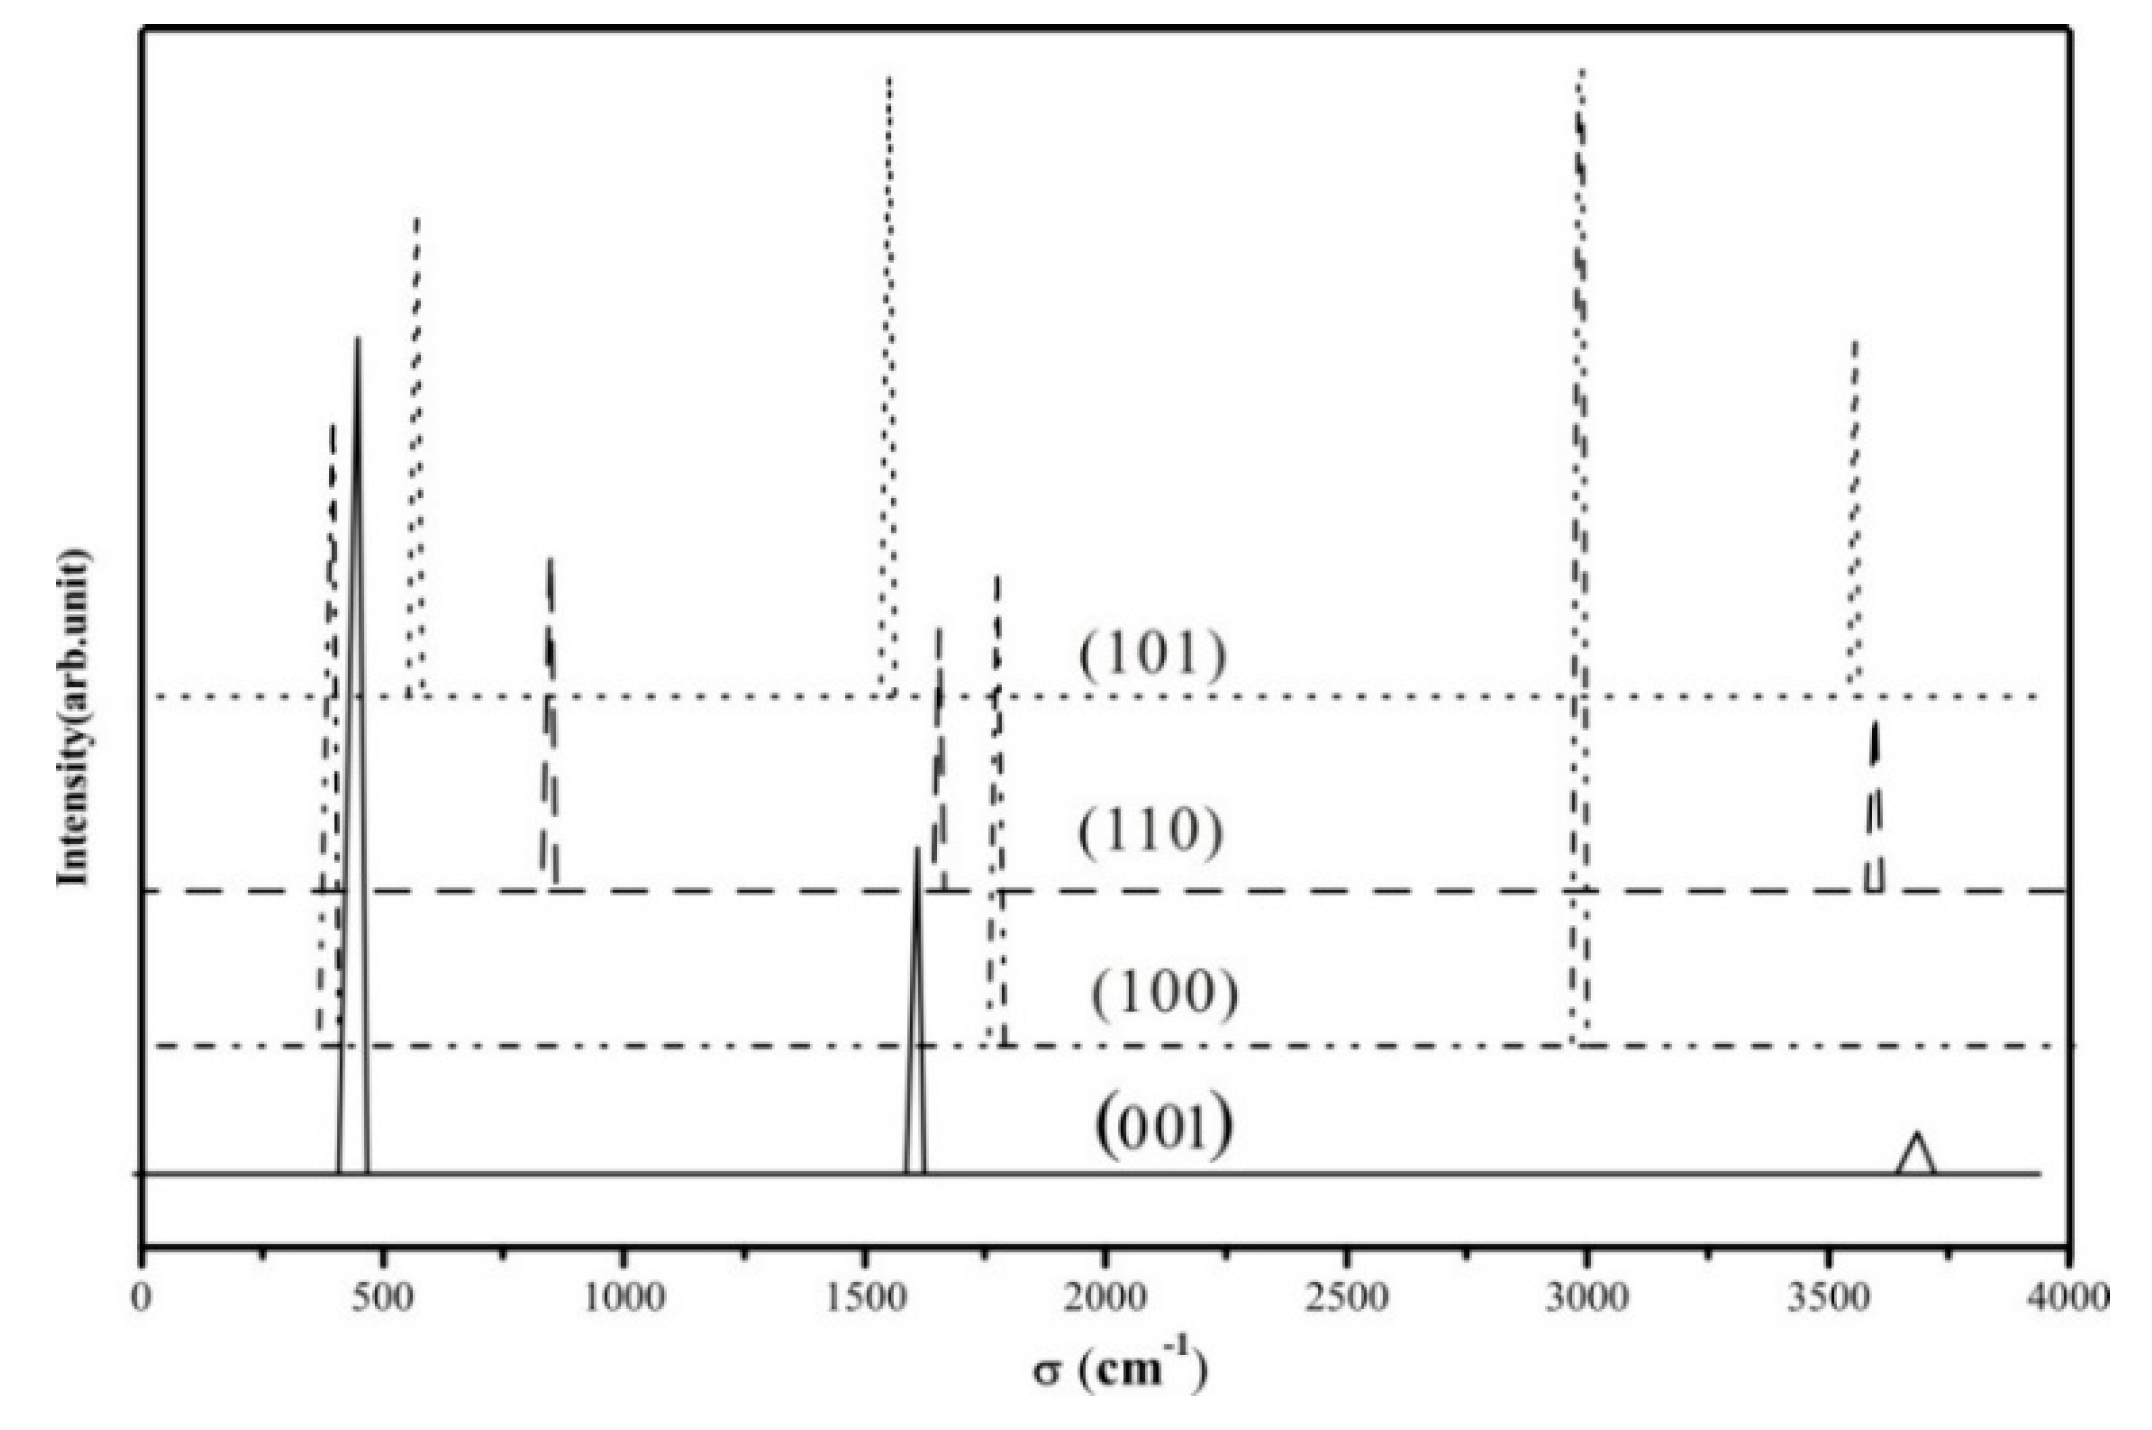
3.4. Vibrational Spectrum
3.5. The H2 Recombination-Desorption Reaction
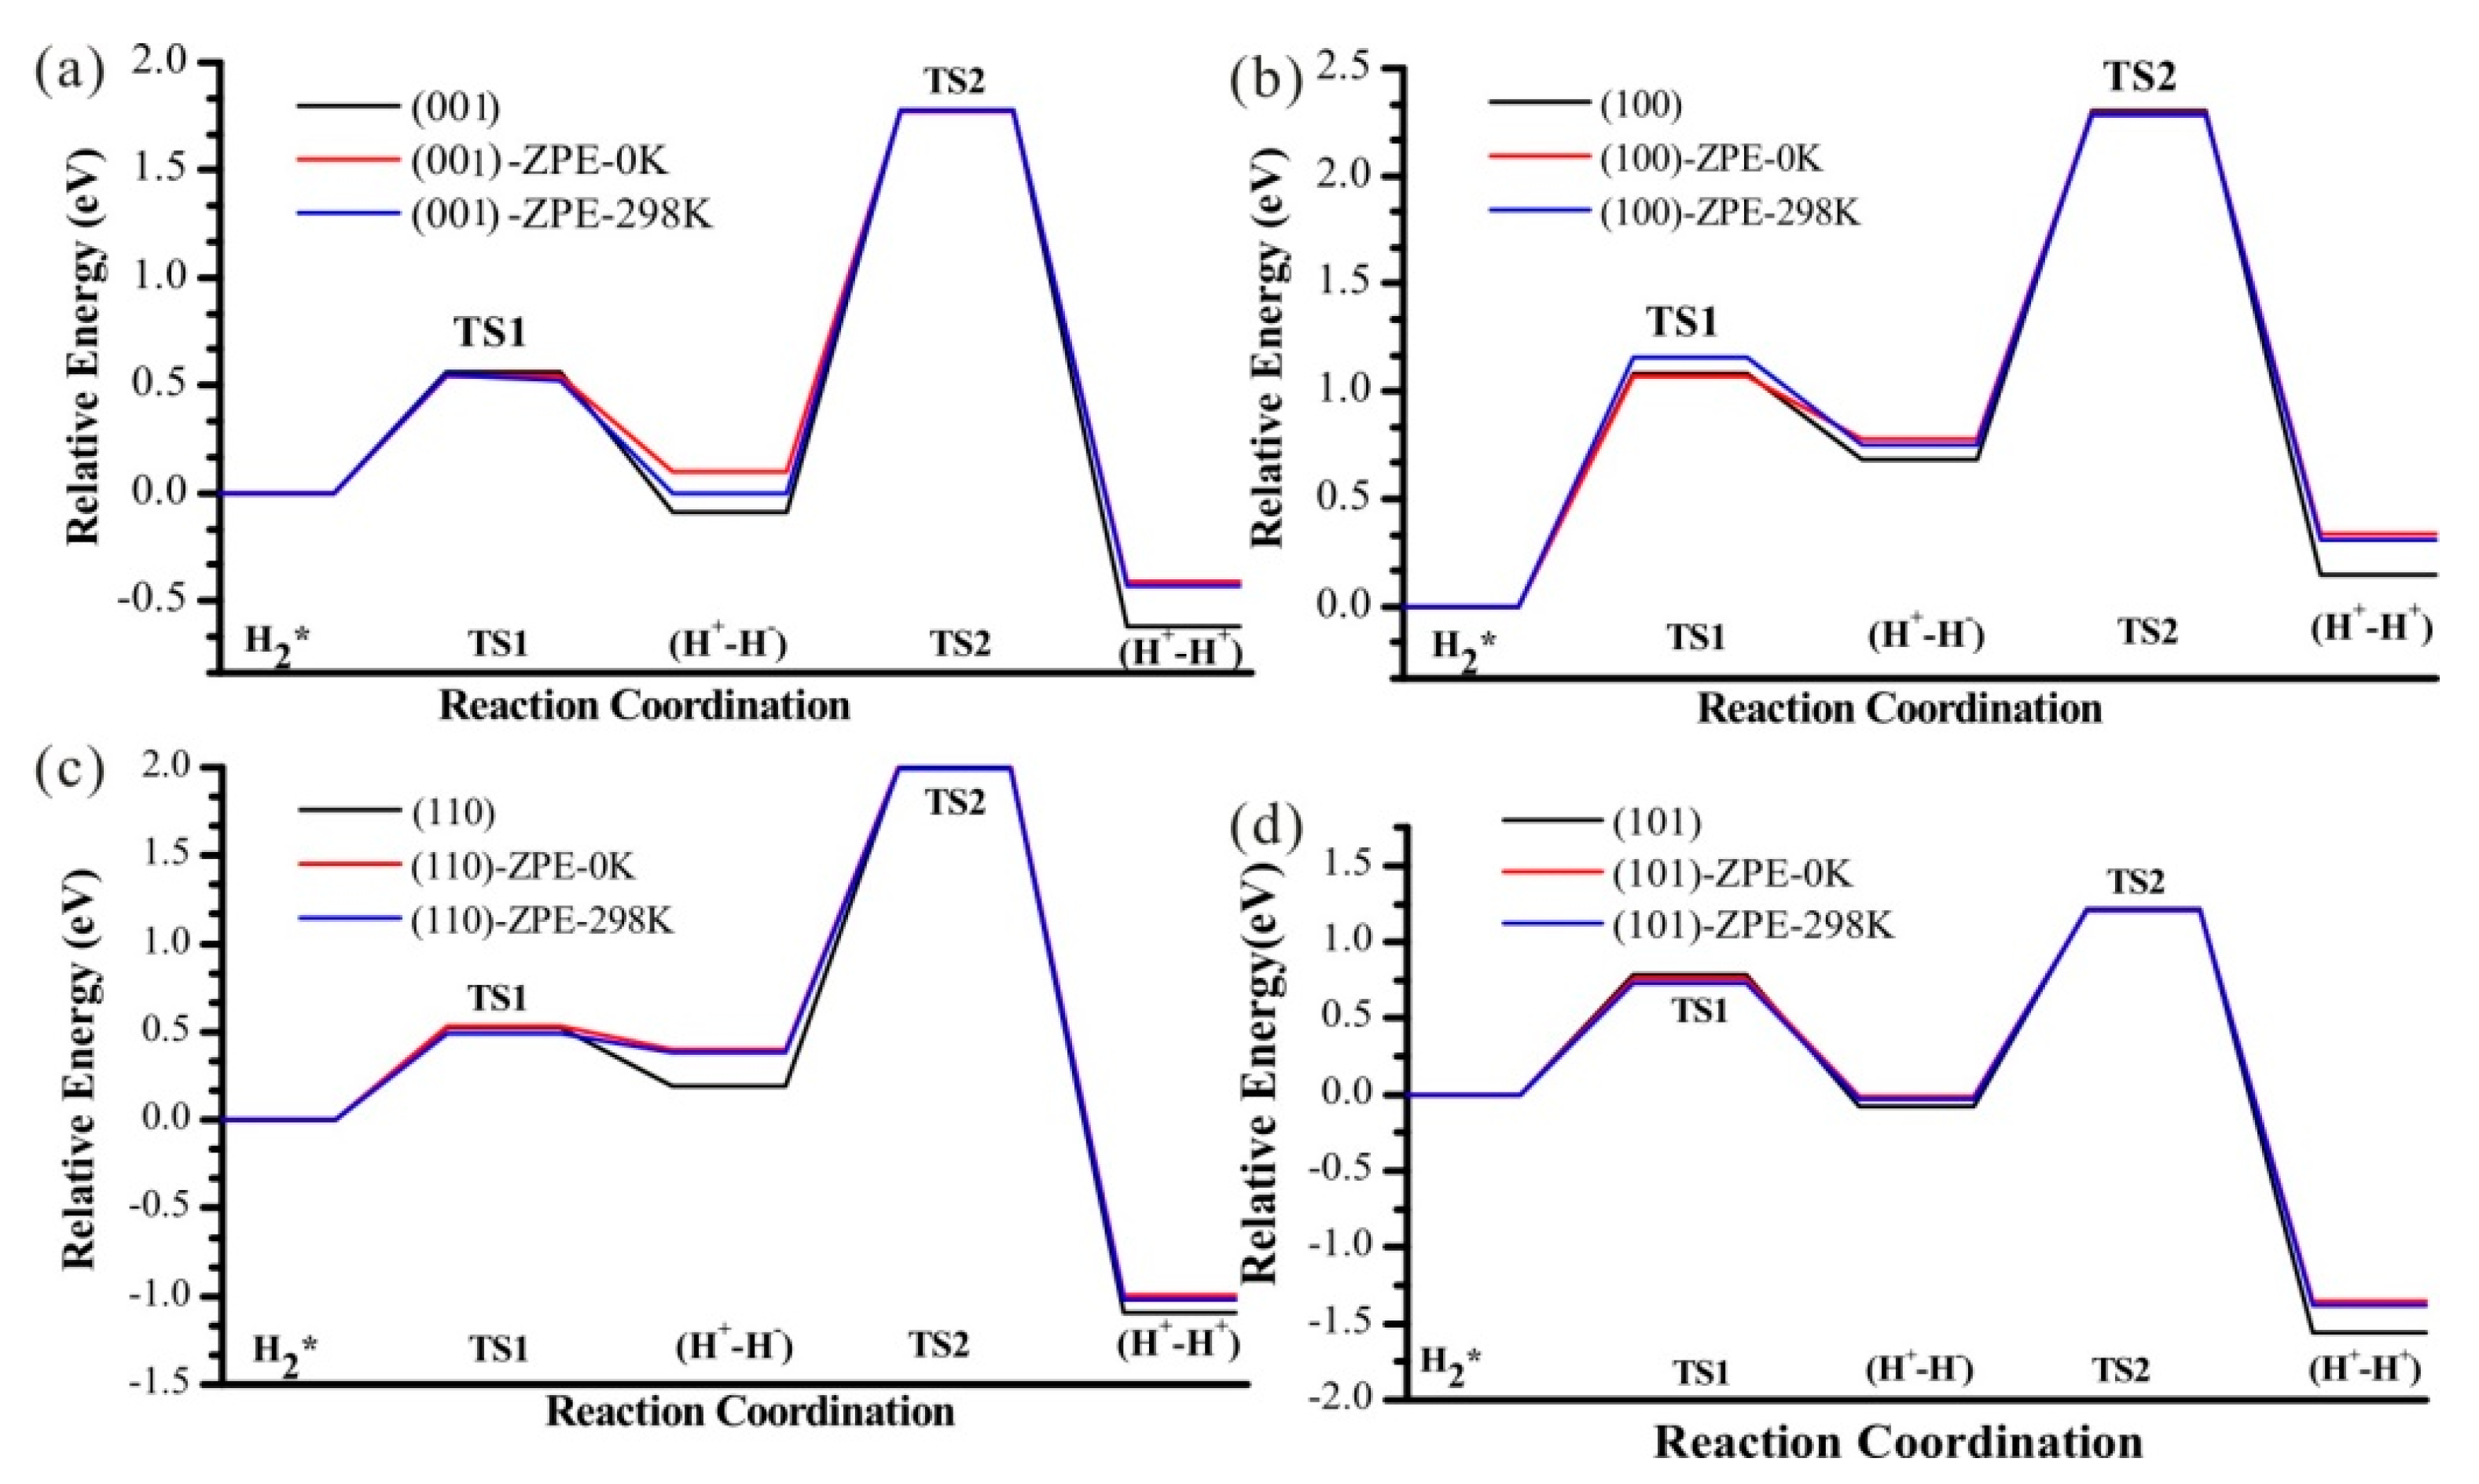
3.6. Zero-Point Energy Correction and Effect of Temperature
4. Conclusions
Supplementary Materials
Author Contributions
Funding
Acknowledgments
Conflicts of Interest
References
- Bach, U.; Lupo, D.; Comte, P.; Moser, J.E.; Weissortel, F.; Salbeck, J.; Spreitzer, H.; Gratzel, M. Solid-state dye-sensitized mesoporous TiO2 solar cells with high photon-to-electron conversion efficiencies. Nature 1998, 395, 583–585. [Google Scholar] [CrossRef]
- Crossland, E.J.W.; Noel, N.; Sivaram, V.; Leijtens, T.; Alexander-Webber, J.A.; Snaith, H.J. Mesoporous TiO2 single crystals delivering enhanced mobility and optoelectronic device performance. Nature 2013, 495, 215–219. [Google Scholar] [CrossRef] [PubMed]
- Fujishima, A.; Honda, K. Electrochemical photolysis of eater at a semiconductor electrode. Nature 1972, 238, 37. [Google Scholar] [CrossRef] [PubMed]
- Tada, H.; Fujishima, M.; Kobayashi, H. Photodeposition of metal sulfide quantum dots on titanium (IV) dioxide and the applications to solar energy conversion. Chem. Soc. Rev. 2011, 40, 4232–4243. [Google Scholar] [CrossRef] [PubMed]
- Chen, M.S.; Goodman, D.W. The structure of catalytically active gold on titania. Science 2004, 306, 252–255. [Google Scholar] [CrossRef] [PubMed]
- Maeda, Y.; Iizuka, Y.; Kohyama, M. Generation of oxygen vacancies at a Au/TiO2 perimeter interface during CO oxidation detected by in situ electrical conductance measurement. J. Am. Chem. Soc. 2013, 135, 906–909. [Google Scholar] [CrossRef]
- Varghese, O.K.; Gong, D.W.; Paulose, M.; Ong, K.G.; Dickey, E.C.; Grimes, C.A. Extreme changes in the electrical resistance of titania nanotubes with hydrogen exposure. Adv. Mater. 2003, 15, 624–627. [Google Scholar] [CrossRef]
- Zhou, X.Y.; Wang, Z.; Xia, X.H.; Shao, G.S.; Homewood, K.; Gao, Y. Synergistic cooperation of rutile TiO2 {002}, {101}, and {110} facets for hydrogen sensing. ACS Appl. Mater. Interfaces 2018, 10, 28199–28209. [Google Scholar] [CrossRef]
- Sugita, Y.; Ishizaki, K.; Iwasa, F.; Ueno, T.; Minamikawa, H.; Yamada, M.; Suzuki, T.; Ogawa, T. Effects of pico-to-nanometer-thin TiO2 coating on the biological properties of microroughened titanium. Biomaterials 2011, 32, 8374–8384. [Google Scholar] [CrossRef]
- Bruce, P.G.; Scrosati, B.; Tarascon, J.M. Nanomaterials for rechargeable lithium batteries. Angew. Chem. Int. Ed. 2008, 47, 2930–2946. [Google Scholar] [CrossRef]
- Linsebigler, A.L.; Lu, G.Q.; Yates, J.T. Photocatalysis on TiO2 surface—Principles, mechanisma, and selected results. Chem. Rev. 1995, 95, 735–758. [Google Scholar] [CrossRef]
- Etgar, L.; Zhang, W.; Gabriel, S.; Hickey, S.G.; Nazeeruddin, M.K.; Eychmuller, A.; Liu, B.; Gratzel, M. High efficiency quantum dot heterojunction solar cell using anatase (001) TiO2 nanosheets. Adv. Mater. 2012, 24, 2202–2206. [Google Scholar] [CrossRef] [PubMed]
- Sun, C.H.; Jia, Y.; Yang, X.H.; Yang, H.G.; Yao, X.D.; Lu, G.Q.; Selloni, A.; Smith, S.C. Hydrogen incorporation and storage in well-defined nanocrystals of anatase titanium dioxide. J. Phys. Chem. C 2011, 115, 25590–25594. [Google Scholar] [CrossRef]
- Wang, Z.; Xia, X.H.; Guo, M.L.; Shao, G.S. Fundamental pathways for the adsorption and transport of hydrogen on TiO2 Surfaces: Origin for effective sensing at about room temperature. ACS Appl. Mater. Interfaces 2016, 8, 35298–35307. [Google Scholar] [CrossRef] [PubMed]
- Chen, X.B.; Liu, L.; Yu, P.Y.; Mao, S.S. Increasing solar absorption for photocatalysis with black hydrogenated titanium dioxide nanocrystals. Science 2011, 331, 746–750. [Google Scholar] [CrossRef] [PubMed]
- Kudo, A.; Miseki, Y. Heterogeneous photocatalyst materials for water splitting. Chem. Soc. Rev. 2009, 38, 253–278. [Google Scholar] [CrossRef] [PubMed]
- Wang, G.M.; Wang, H.Y.; Ling, Y.C.; Tang, Y.C.; Yang, X.Y.; Fitzmorris, R.C.; Wang, C.C.; Zhang, J.Z.; Li, Y. Hydrogen-treated TiO2 nanowire arrays for photoelectrochemical water splitting. Nano Lett. 2011, 11, 3026–3033. [Google Scholar] [CrossRef]
- Woll, C. Hydrogen adsorption on metal oxide surfaces: A reinvestigation using He-atom scattering. J. Phys. Condes. Matter 2004, 16, S2981–S2994. [Google Scholar] [CrossRef]
- Zheng, Z.K.; Huang, B.B.; Lu, J.B.; Wang, Z.Y.; Qin, X.Y.; Zhang, X.Y.; Dai, Y.; Whangbo, M.H. Hydrogenated titania: Synergy of surface modification and morphology improvement for enhanced photocatalytic activity. Chem. Commun. 2012, 48, 5733–5735. [Google Scholar] [CrossRef]
- Joo, J.B.; Dillon, R.; Lee, I.; Yin, Y.D.; Bardeen, C.J.; Zaera, F. Promotion of atomic hydrogen recombination as an alternative to electron trapping for the role of metals in the photocatalytic production of H2. Proc. Natl. Acad. Sci. USA 2014, 111, 7942–7947. [Google Scholar] [CrossRef]
- Aschauer, U.; Selloni, A. Hydrogen interaction with the anatase TiO2(101) surface. Phys. Chem. Chem. Phys. 2012, 14, 16595–16602. [Google Scholar] [CrossRef] [PubMed]
- Calatayud, M.; Minot, C. Effect of relaxation on structure and reactivity of anatase (100) and (001) surfaces. Surf. Sci. 2004, 552, 169–179. [Google Scholar] [CrossRef]
- Diebold, U. The surface science of titanium dioxide. Surf. Sci. Rep. 2003, 48, 53–229. [Google Scholar] [CrossRef]
- Islam, M.M.; Calatayud, M.; Pacchioni, G. Hydrogen adsorption and diffusion on the anatase TiO2(101) surface: A first-principles investigation. J. Phys. Chem. C 2011, 115, 6809–6814. [Google Scholar] [CrossRef]
- Liu, L.L.; Wang, Z.; Pan, C.X.; Xiao, W.; Cho, K. Effect of hydrogen on O2 adsorption and dissociation on a TiO2 anatase (001) surface. ChemPhysChem 2013, 14, 996–1002. [Google Scholar] [CrossRef]
- Nadeem, I.M.; Treacy, J.P.W.; Selcuk, S.; Torrelles, X.; Hussain, H.; Wilson, A.; Grinter, D.C.; Cabailh, G.; Bikondoa, O.; Nicklin, C.; et al. Water dissociates at the aqueous interface with reduced anatase TiO2 (101). J. Phys. Chem. Lett. 2018, 9, 3131–3136. [Google Scholar] [CrossRef] [PubMed]
- Vittadini, A.; Casarin, M.; Selloni, A. Hydroxylation of TiO2-B: Insights from density functional calculations. J. Mater. Chem. 2010, 20, 5871–5877. [Google Scholar] [CrossRef]
- Yin, X.L.; Calatayud, M.; Qiu, H.; Wang, Y.; Birkner, A.; Minot, C.; Woll, C. Diffusion versus desorption: Complex behavior of H atoms on an oxide surface. ChemPhysChem 2008, 9, 253–256. [Google Scholar] [CrossRef]
- Ma, S.C.; Huang, S.D.; Fang, Y.H.; Liu, Z.P. TiH hydride formed on amorphous black titania: Unprecedented active species for photocatalytic hydrogen evolution. ACS Catal. 2018, 8, 9711–9721. [Google Scholar] [CrossRef]
- Chen, H.Y.T.; Giordano, L.; Pacchioni, G. From heterolytic to homolytic H2 dissociation on nanostructured MgO(001) Films as a function of the metal support. J. Phys. Chem. C 2013, 117, 10623–10629. [Google Scholar] [CrossRef]
- Coluccia, S.; Boccuzzi, F.; Ghiotti, G.; Mirra, C. Evidence for heterolytic dissociation of H2 on the surface of thermally activated MgO powders. Z. Fur Phys. Chem. Wiesb. 1980, 121, 141–143. [Google Scholar] [CrossRef]
- Di Valentin, C.; Pacchioni, G.; Selloni, A. Electronic structure of defect states in hydroxylated and reduced rutile TiO2(110) surfaces. Phys. Rev. Lett. 2006, 97. [Google Scholar] [CrossRef] [PubMed]
- Garcia-Melchor, M.; Lopez, N. Homolytic products from heterolytic paths in H2 dissociation on metal oxides: The example of CeO2. J. Phys. Chem. C 2014, 118, 10921–10926. [Google Scholar] [CrossRef]
- Hu, G.X.; Wu, Z.L.; Jiang, D.E. First principles insight into H2 activation and hydride species on TiO2 Surfaces. J. Phys. Chem. C 2018, 122, 20323–20328. [Google Scholar] [CrossRef]
- Joubert, J.; Salameh, A.; Krakoviack, V.; Delbecq, F.; Sautet, P.; Coperet, C.; Basset, J.M. Heterolytic splitting of H2 and CH4 on gamma-alumina as a structural probe for defect sites. J. Phys. Chem. B 2006, 110, 23944–23950. [Google Scholar] [CrossRef] [PubMed]
- Menetrey, M.; Markovits, A.; Minot, C. Reactivity of a reduced metal oxide surface: Hydrogen, water and carbon monoxide adsorption on oxygen defective rutile TiO2(110). Surf. Sci. 2003, 524, 49–62. [Google Scholar] [CrossRef]
- Panayotov, D.A.; Yates, J.T. n-Type doping of TiO2 with atomic hydrogen-observation of the production of conduction band electrons by infrared spectroscopy. Chem. Phys. Lett. 2007, 436, 204–208. [Google Scholar] [CrossRef]
- Calatayud, M.; Markovits, A.; Menetrey, M.; Mguig, B.; Minot, C. Adsorption on perfect and reduced surfaces of metal oxides. Catal. Today 2003, 85, 125–143. [Google Scholar] [CrossRef]
- Fernandez-Torre, D.; Carrasco, J.; Ganduglia-Pirovano, M.V.; Perez, R. Hydrogen activation, diffusion, and clustering on CeO2(111): A DFT+U study. J. Chem. Phys. 2014, 141. [Google Scholar] [CrossRef]
- Liu, Y.P.; Li, Y.H.; Yang, S.Y.; Lin, Y.; Zuo, J.L.; Liang, H.; Peng, F. Revealing the relationship between photocatalytic properties and structure characteristics of TiO2 reduced by hydrogen and carbon monoxide treatment. ChemSusChem 2018, 11, 2766–2775. [Google Scholar] [CrossRef]
- Batzill, M. Fundamental aspects of surface engineering of transition metal oxide photocatalysts. Energy Environ. Sci. 2011, 4, 3275–3286. [Google Scholar] [CrossRef]
- Farneth, W.E.; Hotsenpiller, P.A.M.; Bolt, J.D.; Lowekamp, J.B.; Rohrer, G.S. Orientation dependence of photochemical reactions on TiO2 thin film surfaces. Abstr. Pap. Am. Chem. Soc. 1998, 216, U747. [Google Scholar]
- Han, X.G.; Kuang, Q.; Jin, M.S.; Xie, Z.X.; Zheng, L.S. Synthesis of titania nanosheets with a high percentage of exposed (001) facets and related photocatalytic properties. J. Am. Chem. Soc. 2009, 131, 3152–3153. [Google Scholar] [CrossRef]
- Kislov, N.; Lahiri, J.; Verma, H.; Goswami, D.Y.; Stefanakos, E.; Batzill, M. Photocatalytic degradation of methyl orange over single crystalline ZnO: Orientation dependence of photoactivity and photostability of ZnO. Langmuir 2009, 25, 3310–3315. [Google Scholar] [CrossRef]
- Ohno, T.; Sarukawa, K.; Matsumura, M. Crystal faces of rutile and anatase TiO2 particles and their roles in photocatalytic reactions. New J. Chem. 2002, 26, 1167–1170. [Google Scholar] [CrossRef]
- Calatayud, M.; Yin, X.L.; Qiu, H.; Wang, Y.; Birkner, A.; Minot, C.; Woll, C. Comment on “Imaging of the hydrogen subsurface site in rutile TiO2”. Phys. Rev. Lett. 2010, 104. [Google Scholar] [CrossRef]
- Kowalski, P.M.; Meyer, B.; Marx, D. Composition, structure, and stability of the rutile TiO2(110) surface: Oxygen depletion, hydroxylation, hydrogen migration, and water adsorption. Phys. Rev. B 2009, 79. [Google Scholar] [CrossRef]
- Sasahara, A.; Murakami, T.; Tomitori, M. XPS and STM study of TiO2(110)-(1 x 1) surfaces immersed in simulated body fluid. Surf. Sci. 2018, 668, 61–67. [Google Scholar] [CrossRef]
- Yu, X.J.; Zhang, Z.R.; Yang, C.W.; Bebensee, F.; Heissler, S.; Nefedov, A.; Tang, M.R.; Ge, Q.F.; Chen, L.; Kay, B.D.; et al. Interaction of formaldehyde with the Rutile TiO2(110) Surface: A combined experimental and theoretical study. J. Phys. Chem. C 2016, 120, 12626–12636. [Google Scholar] [CrossRef]
- Zhang, D.Y.; Yang, M.N.; Dong, S. Hydroxylation of the rutile TiO2(110) surface enhancing its reducing power for photocatalysis. J. Phys. Chem. C 2015, 119, 1451–1456. [Google Scholar] [CrossRef]
- Imanishi, A.; Tsuji, E.; Nakato, Y. Dependence of the work function of TiO2 (Rutile) on crystal faces, studied by a scanning auger microprobe. J. Phys. Chem. C 2007, 111, 2128–2132. [Google Scholar] [CrossRef]
- Lu, Y.; Jaeckel, B.; Parkinson, B.A. Preparation and characterization of terraced surfaces of low-index faces of anatase, rutile, and brookite. Langmuir 2006, 22, 4472–4475. [Google Scholar] [CrossRef]
- Raza, H.; Pang, C.L.; Haycock, S.A.; Thornton, G. Evidence of discrete bond breaking steps in the 1 x 1 to 1 x 3 phase transition of TiO2(100). Phys. Rev. Lett. 1999, 82, 5265–5268. [Google Scholar] [CrossRef]
- Warschkow, O.; Wang, Y.; Subramanian, A.; Asta, M.; Marks, L.D. Structure and local-equilibrium thermodynamics of the c(2 × 2) reconstruction of rutile TiO2 (100). Phys. Rev. Lett. 2008, 100. [Google Scholar] [CrossRef]
- Lindberg, F.; Heinrichs, J.; Ericson, F.; Thomsen, P.; Engqvist, H. Hydroxylapatite growth on single-crystal rutile substrates. Biomaterials 2008, 29, 3317–3323. [Google Scholar] [CrossRef]
- Muscat, J.; Harrison, N.M. The physical and electronic structure of the rutile (001) surface. Surf. Sci. 2000, 446, 119–127. [Google Scholar] [CrossRef]
- Norenberg, H.; Dinelli, F.; Briggs, G.A.D. Network-like (7 root 2 x root 2) R45 degrees surface reconstruction on rutile TiO2(001) by non-equilibrium self-organization. Surf. Sci. 1999, 436, L635–L640. [Google Scholar] [CrossRef]
- Poirier, G.E.; Hance, B.K.; White, J.M. Identification of the facet planes of phase I TiO2(001) rutile by scanning tunneling tunneling microscopy and low-energy electron-diffraction. J. Vac. Sci. Technol. B 1992, 10, 6–15. [Google Scholar] [CrossRef]
- Sosnowchik, B.D.; Chiamori, H.C.; Ding, Y.; Ha, J.Y.; Wang, Z.L.; Lin, L.W. Titanium dioxide nanoswords with highly reactive, photocatalytic facets. Nanotechnology 2010, 21. [Google Scholar] [CrossRef]
- Thibado, P.M.; Bonnell, D.A. Metal-oxide interactions on copper-segregated and copper-deposited TiO2 rutile (001) surfaces. J. Am. Ceram. Soc. 1997, 80, 1267–1273. [Google Scholar] [CrossRef]
- Yang, M.H.; Chen, T.T.; Wang, Y.S.; Chiu, H.T.; Lee, C.Y. Electrochromism of rutile nanowires, vertically aligned along the 001 direction, due to alkali metal ion intercalation. J. Mater. Chem. 2011, 21, 18738–18743. [Google Scholar] [CrossRef]
- Yamamoto, Y.; Matsumoto, Y.; Koinuma, H. Homo-epitaxial growth of rutile TiO2 film on step and terrace structured substrate. Appl. Surf. Sci. 2004, 238, 189–192. [Google Scholar] [CrossRef]
- Yang, X.F.; Jin, C.J.; Liang, C.L.; Chen, D.H.; Wu, M.M.; Yu, J.C. Nanoflower arrays of rutile TiO2. Chem. Commun. 2011, 47, 1184–1186. [Google Scholar] [CrossRef]
- Di Valentin, C.; Tilocca, A.; Selloni, A.; Beck, T.J.; Klust, A.; Batzill, M.; Losovyj, Y.; Diebold, U. Adsorption of water on reconstructed rutile TiO2(011)-(2x1): Ti=O double bonds and surface reactivity. J. Am. Chem. Soc. 2005, 127, 9895–9903. [Google Scholar] [CrossRef]
- Dulub, O.; Di Valentin, C.; Selloni, A.; Diebold, U. Structure, defects, and impurities at the rutile TiO2(011)-(2 x 1) surface: A scanning tunneling microscopy study. Surf. Sci. 2006, 600, 4407–4417. [Google Scholar] [CrossRef]
- Kubo, T.; Orita, H.; Nozoye, H. Surface structures of rutile TiO2 (011). J. Am. Chem. Soc. 2007, 129, 10474–10478. [Google Scholar] [CrossRef]
- Kresse, G.; Hafner, J. Ab initio molecular-dynamics for liquid-metals. Phys. Rev. B 1993, 47, 558–561. [Google Scholar] [CrossRef]
- Kresse, G.; Hafner, J. Ab initio molecular-dynamics simulation of the liquid-metal amorphous-semiconductor transition in germantion in germanium. Phys. Rev. B 1994, 49, 14251–14269. [Google Scholar] [CrossRef]
- Blochl, P.E. Projector augmented-wave method. Phys. Rev. B 1994, 50, 17953–17979. [Google Scholar] [CrossRef] [Green Version]
- Kresse, G.; Joubert, D. From ultrasoft pseudopotentials to the projector augmented-wave method. Phys. Rev. B 1999, 59, 1758–1775. [Google Scholar] [CrossRef]
- Perdew, J.P.; Burke, K.; Ernzerhof, M. Generalized gradient approximation made simple. Phys. Rev. Lett. 1996, 77, 3865–3868. [Google Scholar] [CrossRef]
- Perdew, J.P.; Chevary, J.A.; Vosko, S.H.; Jackson, K.A.; Pederson, M.R.; Singh, D.J.; Fiolhais, C. Atoms, moleculars, solids, and surfaces: Application of the generalized gradient approximation for exchange and correlation. Phys. Rev. B 1993, 48, 4978. [Google Scholar] [CrossRef]
- Dudarev, S.L.; Botton, G.A.; Savrasov, S.Y.; Humphreys, C.J.; Sutton, A.P. Electron-energy-loss spectra and the structural stability of nickel oxide: An LSDA+U study. Phys. Rev. B 1998, 57, 1505–1509. [Google Scholar] [CrossRef]
- Finazzi, E.; Di Valentin, C.; Pacchioni, G.; Selloni, A. Excess electron states in reduced bulk anatase TiO2: Comparison of standard GGA, GGA plus U, and hybrid DFT calculations. J. Chem. Phys. 2008, 129. [Google Scholar] [CrossRef]
- Henkelman, G.; Jonsson, H. Improved tangent estimate in the nudged elastic band method for finding minimum energy paths and saddle points. J. Chem. Phys. 2000, 113, 9978–9985. [Google Scholar] [CrossRef] [Green Version]
- Henkelman, G.; Uberuaga, B.P.; Jonsson, H. A climbing image nudged elastic band method for finding saddle points and minimum energy paths. J. Chem. Phys. 2000, 113, 9901–9904. [Google Scholar] [CrossRef] [Green Version]
- Kyriakou, G.; Davidson, E.R.M.; Peng, G.W.; Roling, L.T.; Singh, S.; Boucher, M.B.; Marcinkowski, M.D.; Mavrikakis, M.; Michaelides, A.; Sykes, E.C.H. Significant quantum effects in hydrogen activation. ACS Nano 2014, 8, 4827–4835. [Google Scholar] [CrossRef]
- Baroni, S.; de Gironcoli, S.; Dal Corso, A.; Giannozzi, P. Phonons and related crystal properties from density-functional perturbation theory. Rev. Mod. Phys. 2001, 73, 515–562. [Google Scholar] [CrossRef] [Green Version]
- Giannozzi, P.; Baroni, S. Vibrational and dielectric-properties of C60 from density-functional perturbation theory. J. Chem. Phys. 1994, 100, 8537–8539. [Google Scholar] [CrossRef]
- Grimme, S.; Antony, J.; Ehrlich, S.; Krieg, S. A consistent and accurate ab initio parametrization of density functional dispersion correction (DFT-D) for the 94 elements H-PuJ. Chem. Phys. 2010, 132, 154104. [Google Scholar] [CrossRef]
- Matz, O.; Calatayud, M. Breaking H2 with CeO2: Effect of Surface Termination. ACS Omega 2018, 11, 16063–16073. [Google Scholar] [CrossRef]
- Sanville, E.; Kenny, S.D.; Smith, R.; Henkelman, G. Improved grid-based algorithm for Bader charge allocation. J. Comput. Chem. 2007, 28, 899–908. [Google Scholar] [CrossRef]
- Coperet, C.; Estes, D.P.; Larmier, K.; Searles, K. Isolated surface hydrides: Formation, structure, and reactivity. Chem. Rev. 2016, 116, 8463–8505. [Google Scholar] [CrossRef]
- Knotek, M.L. Characterization of hydrogen species on TiO2 by electron-stimulated desorption. Surf. Sci. 1980, 91, L17–L22. [Google Scholar] [CrossRef]
- Pan, J.M.; Maschhoff, B.L.; Diebold, U.; Madey, T.E. Interaction of water, oxigen, and hydrogen with TiO2 surfaces having different defect densities. J. Vac. Sci. Technol. A Vac. Surf. Films 1992, 10, 2470–2476. [Google Scholar] [CrossRef]
- Yan, Y.; Shi, W.D.; Yuan, Z.; He, S.G.; Li, D.M.; Meng, Q.B.; Ji, H.W.; Chen, C.C.; Ma, W.H.; Zhao, J.C. The formation of Ti-H Species at interface is lethal to the efficiency of TiO2-based dye-sensitized devices. J. Am. Chem. Soc. 2017, 139, 2083–2089. [Google Scholar] [CrossRef]
- Tsyganenko, A.; Filimonov, V. Infrared spectra of surface hydroxyl groups and crystalline structure of oxides. Spectrosc. Lett. 1972, 5, 477–487. [Google Scholar] [CrossRef]
- Arrouvel, C.; Digne, M.; Breysse, M.; Toulhoat, H.; Raybaud, P. Effects of morphology on surface hydroxyl concentration: A DFT comparison of anatase–TiO2 and γ-alumina catalytic supports. J. Catal. 2004, 222, 152–166. [Google Scholar] [CrossRef]
- Jones, P.; Hockey, J. Infra-red studies of rutile surfaces. Part 2—Hydroxylation, hydration and structure of rutile surfaces. Trans. Faraday Soc. 1971, 67, 2679–2685. [Google Scholar] [CrossRef]
- Buchholz, M.; Wöll, C. Interaction of carboxylic acids with rutile TiO2(110): IR-investigations of terephthalic and benzoic acid adsorbed on a single crystal substrate. Surf. Sci. 2016, 643, 117–123. [Google Scholar] [CrossRef]
- Henderson, M.A. An HREELS and TPD study of water on TiO2(110): The extent of molecular versus dissociative adsorption. Surf. Sci. 1996, 355, 151–166. [Google Scholar] [CrossRef]
- Henderson, M.A.; Epling, W.S.; Peden, C.H.F.; Perkins, C.L. Insights into photoexcited electron scavenging processes on TiO2 obtained from studies of the reaction of O2 with OH groups adsorbed at electronic defects on TiO2(110). J. Phys. Chem. B. 2003, 107, 534–545. [Google Scholar] [CrossRef]
- Petrik, N.G.; Kimmel, G.A. Reaction kinetics of water molecules with oxygen vacancies on rutile TiO2(110). J. Phys. Chem. C 2015, 119, 23059–23067. [Google Scholar] [CrossRef]
- Hameeuw, K.; Cantele, G.; Ninno, D.; Trani, F.; Iadonisi, G. Influence of surface and subsurface defects on the behavior of the rutile TiO2(110) surface. Phys. Status Solidi A Appl. Mater. 2006, 203, 2219–2222. [Google Scholar] [CrossRef]
- Kim, W.J.; Han, M.H.; Lebegue, S.; Lee, E.K.; Kim, H. Electronic Structure and Band Alignments of Various Phases of Titania Using the Self-Consistent Hybrid Density Functional and DFT plus U Methods. Front. Chem. 2019, 7. [Google Scholar] [CrossRef]
- Iacomino, A.; Cantele, G.; Ninno, D.; Marri, I.; Ossicini, S. Structural, electronic, and surface properties of anatase TiO2 nanocrystals from first principles. Phys. Rev. B 2008, 78. [Google Scholar] [CrossRef]
- Iacomino, A.; Cantele, G.; Trani, F.; Ninno, D. DFT Study on Anatase TiO2 Nanowires: Structure and Electronic Properties as Functions of Size, Surface Termination, and Morphology. J. Phys. Chem. C 2010, 114, 12389–12400. [Google Scholar] [CrossRef]
- Han, F.S.; Zhou, Z.H.; Huang, Z.X.; Li, M.T.; Guo, L.J. Effect of Water Adsorption on the Interfacial Structure and Band Edge Alignment of Anatase TiO2(001)/Water by First-Principles Molecular Dynamics. J. Phys. Chem. C 2018, 122, 26965–26973. [Google Scholar] [CrossRef]
- Zhang, D.Y.; Yang, M.N.; Dong, S. Improving the photocatalytic activity of TiO2 through reduction. RSC Adv. 2015, 5, 35661–35666. [Google Scholar] [CrossRef]
- Kunat, M.; Burghaus, U.; Woll, C. The adsorption of hydrogen on the rutile TiO2(110) surface. Phys. Chem. Chem. Phys. 2004, 6, 4203–4207. [Google Scholar] [CrossRef]


| Surface | (001) | (100) | (110) | (101) |
|---|---|---|---|---|
| Supercell | 1 × 1 | 1 × 1 | 2 × 2 | 1 × 1 |
| Composition (TiO2 units) | 8.00 | 8.00 | 32.00 | 8.00 |
| TiO2 layers (frozen/relaxed) | 8 | 8 | 4 | 8 |
| 4/4 | 4/4 | 2/2 | 4/4 | |
| Coordination | O(2) | O(2,3) | O(2,3) | O(2,3) |
| Ti(4) | Ti(5) | Ti(5,6) | Ti(4,5) | |
| Parameter: a, b in Å | a = 4.661 | a = 4.661 | a = 6.018 | a = 5.522 |
| b = 4.661 | b = 2.962 | b = 13.096 | b = 4.661 | |
| Automatic k-point = 1/30 Å−1 | 5 × 5 × 1 | 5 × 8 × 1 | 4 × 2 × 1 | 5 × 5 × 1 |
| Esurf (J nm−2) | 1.30 | 0.73 | 0.55 | 1.07 |
| (001) | (100) | (110) | (101) | |
|---|---|---|---|---|
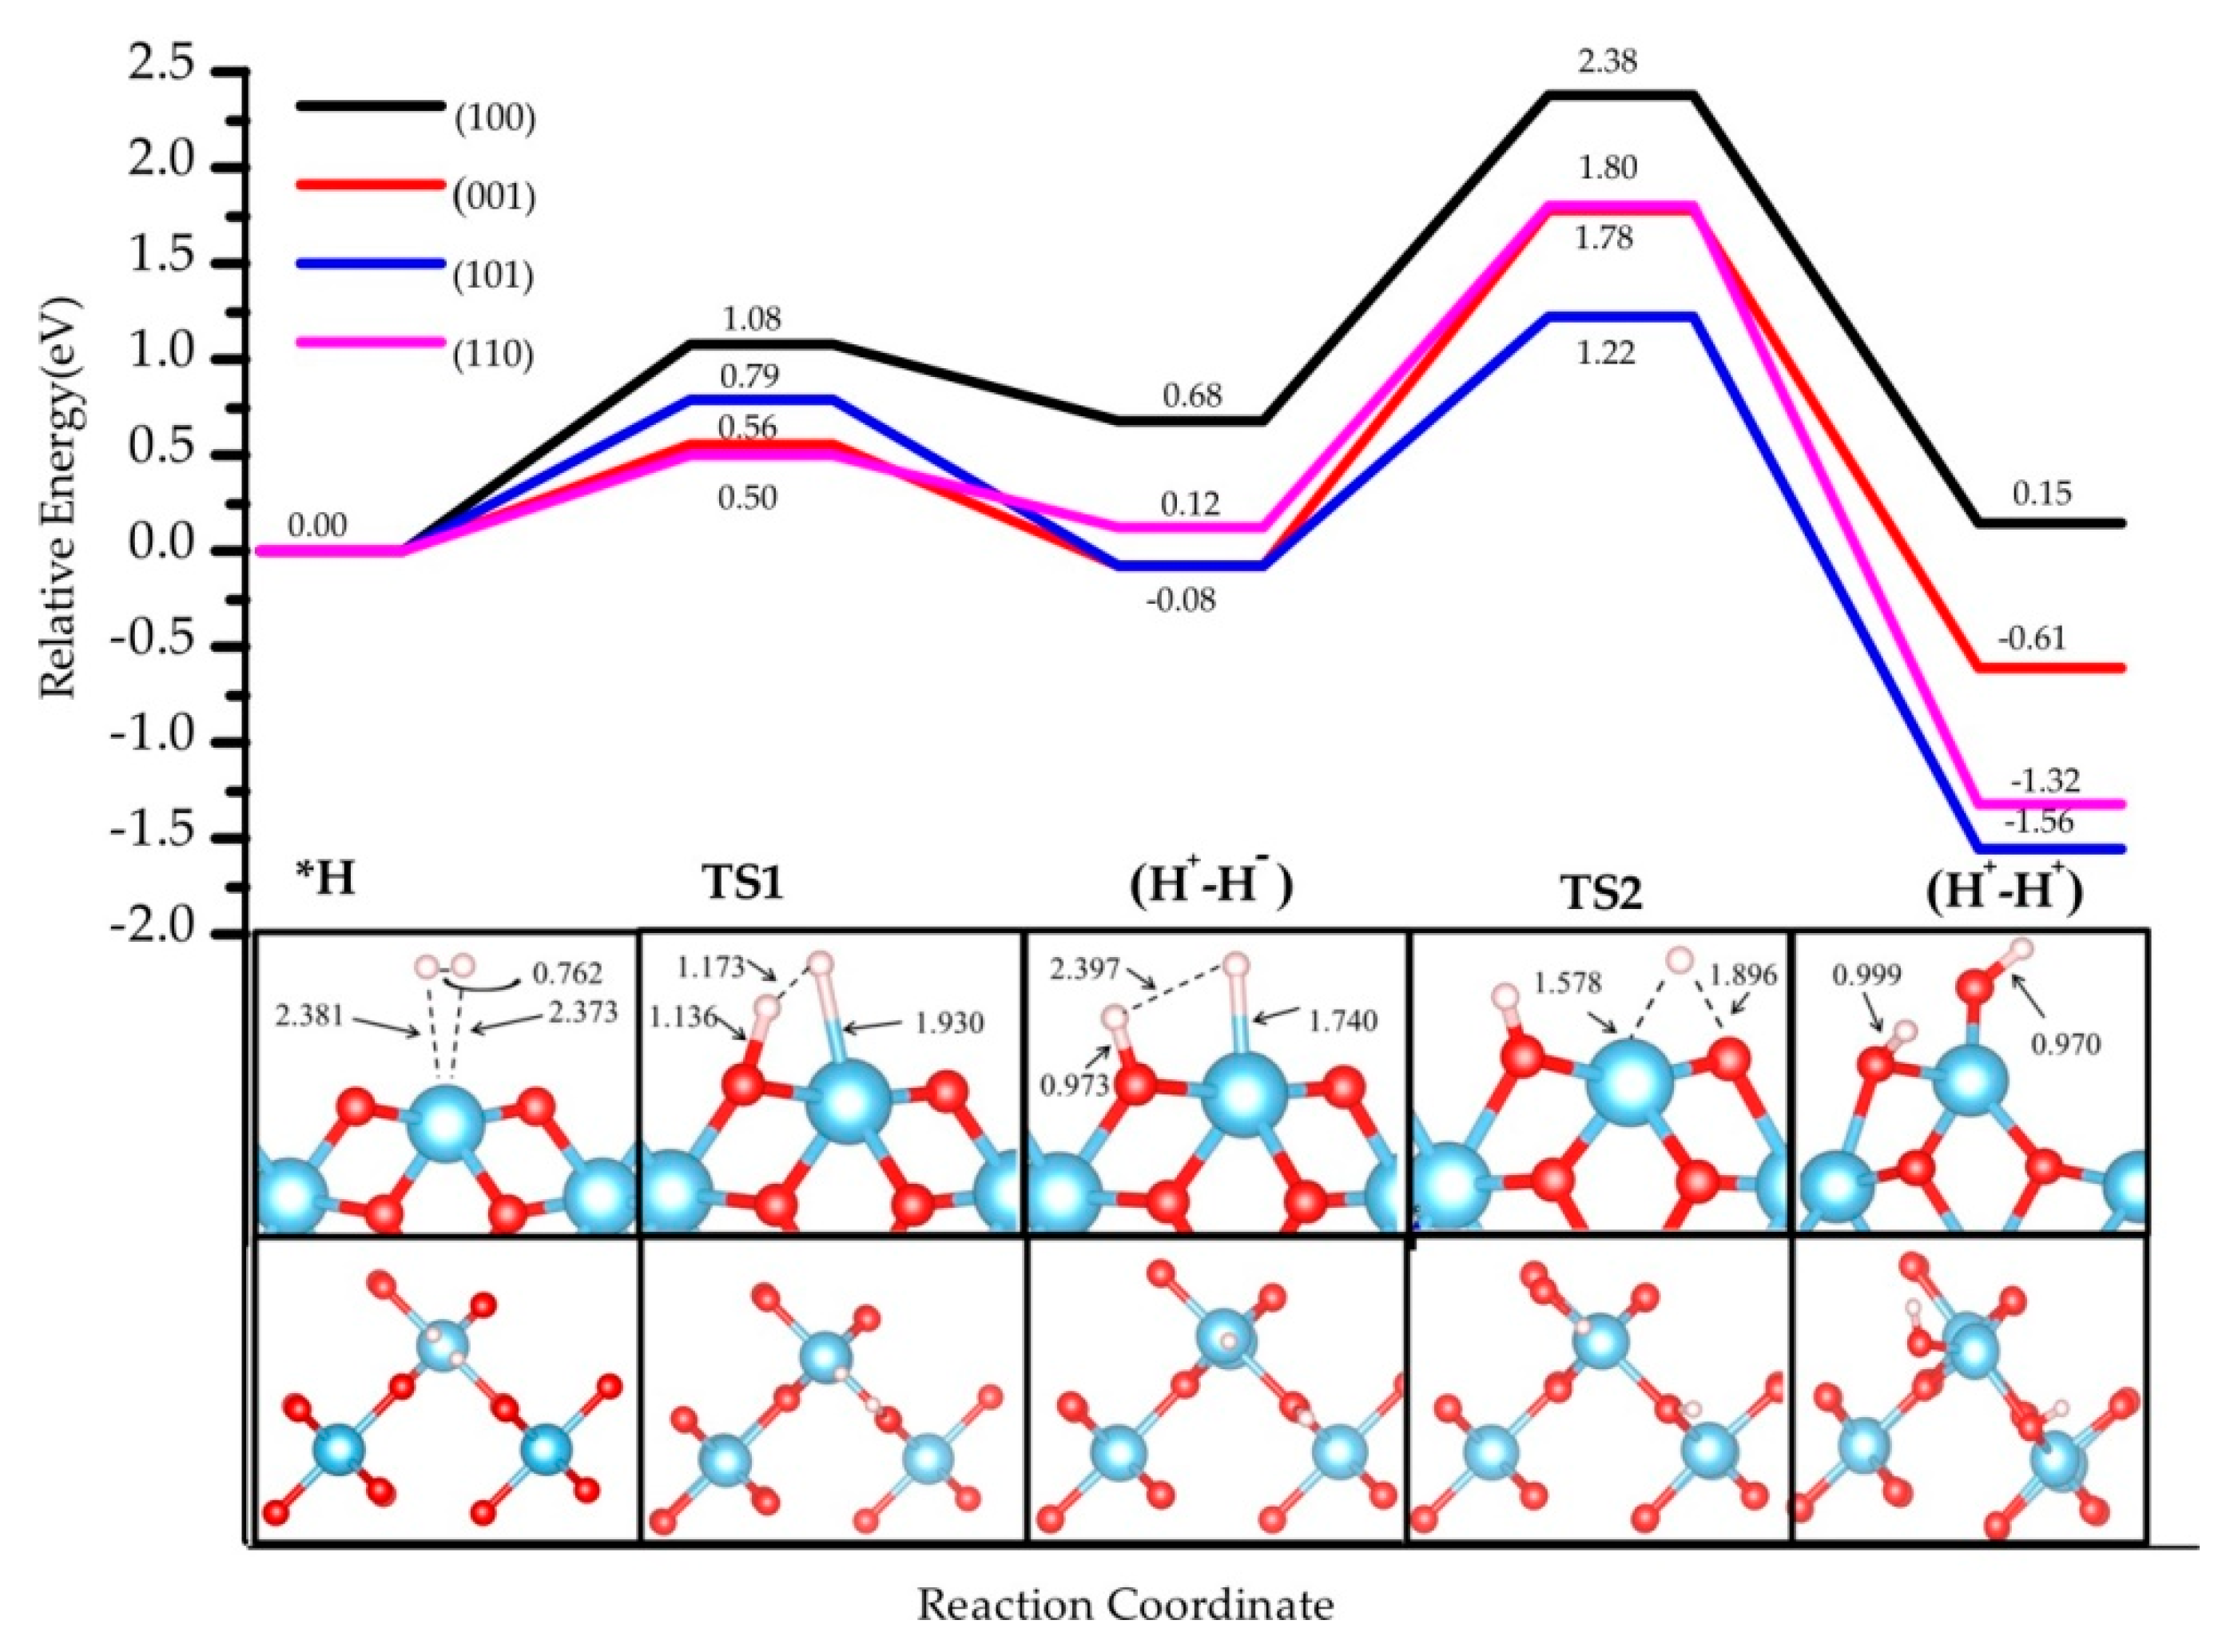
| H2 * | 0.00 (0.00) | 0.00 (0.00) | 0.00 (0.00) | 0.00 (0.00) |
| TS1 | 0.56 (0.63) | 1.08 (1.15) | 0.50 (0.70) | 0.79 (1.10) |
| (H+-H−) | −0.08 (0.15) | 0.68 (0.98) | 0.12 (0.50) | −0.08 (0.28) |
| TS2 | 1.78 (1.98) | 2.38 (2.52) | 1.80 (1.86) | 1.22 (1.50) |
| (H+-H+) | −0.61 (0.03) | 0.15 (0.78) | −1.32 (−0.79) | −1.56 (−0.22) |
| ∆E1 | −0.08 (0.15) | 0.68 (0.98) | 0.12 (0.68) | −0.08 (0.28) |
| 0.56 (0.63) | 1.08 (1.15) | 0.50 (0.70) | 0.79 (1.10) | |
| 0.64 (0.48) | 0.40 (0.17) | 0.38 (0.20) | 0.87 (0.82) | |
| ∆E2 | −0.53 (−0.12) | −0.53 (−0.20) | −1.44 (−1.47) | −1.48 (−0.50) |
| Eact2 | 1.86 (1.83) | 1.70 (1.54) | 1.68 (1.18) | 1.40 (1.22) |
| qTi+ /qO− | qH+/qH− qTi+/qOa− | qH+/qH− qTi+/qOb− | qH+/qH+ /qTi+/qOb− | ||||
|---|---|---|---|---|---|---|---|
| Slab | H2 * | TS1 | (H+-H−)-Oa | (H+-H−)-Ob | TS2 | (H+-H+) | |
| (001) | 1.98/−1.00 | 0.02/−0.01 /1.98/−1.00 | 0.48/−0.41 /1.97/−1.02 | 0.67/−0.42 /1.95/−1.22 | 0.67/−0.42 /1.95/−0.98 | 0.63/−0.10 /1.90/−0.97 | 0.65/0.61 /1.79/−1.26 |
| (100) | 2.03/−1.07 | 0.04/−0.02 /2.01/−1.07 | 0.43/−0.32 /1.96/−1.12 | 0.65/−0.30 /1.90/−1.24 | 0.65/−0.30 /1.90/−0.98 | 0.64/−0.01 /1.77/−1.10 | 0.60/0.60 /1.78/−1.27 |
| (110) | 2.01/−0.90 | 0.04/−0.02 /2.04/−0.92 | 0.35/−0.31 /2.01/−0.97 | 0.70/−0.34 /1.93/−1.22 | 0.70/−0.34 /1.93/−0.91 | 0.67/0.00 /1.95/−0.92 | 0.64/0.62 /1.87/−1.15 |
| (101) | 1.99/−0.96 | 0.04/−0.03 /1.98/−0.96 | 0.38/−0.40 /1.97/−1.03 | 0.67/−0.40 /1.96/−1.20 | 0.67/−0.40 /1.96/−0.93 | 0.60/−0.10 /1.90/−1.25 | 0.60/0.66 /1.83/−1.30 |
| Slab | (001) | (100) | (110) | (101) | Slab | (001) | (100) | (110) |
|---|---|---|---|---|---|---|---|---|
| Species | TS2 | (H+-H+) | TS2 | (H+-H+) | TS2 | (H+-H+) | TS2 | (H+-H+) |
| Total | 1.70 | 2.00 | 1.90 | 2.00 | 1.92 | 2.00 | 1.70 | 2.00 |
| Ti | 0.80 | 0.97 | 0.99 | 0.91 | 0.24 | 0.90 | 0.80 | 0.99 |
| Ti | 0.16 | 1.00 | 0.11 | 1.05 | 0.24 | 0.90 | 0.16 | 0.99 |
| O | 0.24 | 0.00 | 0.02 | 0.00 | 0.00 | 0.00 | 0.24 | 0.00 |
| H1 | 0.44 | 0.00 | 0.87 | 0.00 | 0.97 | 0.00 | 0.44 | 0.00 |
| H2 | 0.00 | 0.00 | 0.00 | 0.00 | 0.10 | 0.00 | 0.00 | 0.00 |
| Stretching Modes | (001) | (100) | (110) | (101) |
|---|---|---|---|---|
| (Ti-H) | 1644.78 (0.39) | 1768.74 (0.52) | 1653.87 (0.32) | 1577.45 (0.76) |
| (O-H) | 3742.87 (0.05) | 2976.54 (1.56) | 3606.59 (0.22) | 3622.37 (0.44) |
© 2019 by the authors. Licensee MDPI, Basel, Switzerland. This article is an open access article distributed under the terms and conditions of the Creative Commons Attribution (CC BY) license (http://creativecommons.org/licenses/by/4.0/).
Share and Cite
Wei, B.; Tielens, F.; Calatayud, M. Understanding the Role of Rutile TiO2 Surface Orientation on Molecular Hydrogen Activation. Nanomaterials 2019, 9, 1199. https://doi.org/10.3390/nano9091199
Wei B, Tielens F, Calatayud M. Understanding the Role of Rutile TiO2 Surface Orientation on Molecular Hydrogen Activation. Nanomaterials. 2019; 9(9):1199. https://doi.org/10.3390/nano9091199
Chicago/Turabian StyleWei, Baohuan, Frederik Tielens, and Monica Calatayud. 2019. "Understanding the Role of Rutile TiO2 Surface Orientation on Molecular Hydrogen Activation" Nanomaterials 9, no. 9: 1199. https://doi.org/10.3390/nano9091199
APA StyleWei, B., Tielens, F., & Calatayud, M. (2019). Understanding the Role of Rutile TiO2 Surface Orientation on Molecular Hydrogen Activation. Nanomaterials, 9(9), 1199. https://doi.org/10.3390/nano9091199