Superior Hydrogen Sensing Property of Porous NiO/SnO2 Nanofibers Synthesized via Carbonization


1
State Key Laboratory of Power Transmission Equipment & System Security and New Technology, Chongqing University, Chongqing 400044, China
2
Analytical and Testing Center of Chongqing University, Chongqing 401331, China
3
College of Engineering and Technology, Southwest University, Chongqing 400715, China
*
Authors to whom correspondence should be addressed.
Nanomaterials 2019, 9(9), 1250; https://doi.org/10.3390/nano9091250
Submission received: 8 August 2019
/
Revised: 18 August 2019
/
Accepted: 29 August 2019
/
Published: 3 September 2019
Abstract
:In this paper, the porous NiO/SnO2 nanofibers were synthesized via the electrospinning method along with the carbonization process. The characterization results show that the pristine SnO2-based nanofibers can form porous structure with different grain size by carbonization. The hydrogen gas-sensing investigations indicate that the NiO/SnO2 sensor exhibits more prominent sensing properties than those of pure SnO2 sensor devices. Such enhanced performance is mainly attributed to the porous nanostructure, which can provide large active adsorption sites for surface reaction. Moreover, the existence of p-n heterojunctions between NiO and SnO2 also plays a key role in enhancing gas-sensing performances. Finally, the H2 sensing mechanism based on the NiO/SnO2 nanocomposite was proposed for developing high-performance gas sensor devices.
1. Introduction
Hydrogen (H2) is a key characteristic parameter that reflects the spark, arc and partial discharge faults in transformer oil [1]. Using the gas sensor technology to realize the on-line monitoring of H2 gas can effectively analyze the operating state of the transformer to ensure the power supply requirements in our life [2]. In the field of gas sensors, semiconductor oxide sensors, such as ZnO [3,4], WO3 [5], SnO2 [6,7], CuO [8], NiO [9], etc., have been widely studied due to the characteristics of favorable gas sensitivity and easy synthesis, as well as the ability of detecting various gases due to the unique physical and chemical properties.
It is known to all that the intrinsic semiconductor gas-sensing materials have the disadvantages of poor gas response, high operating temperature, and long response-recovery time owing to the inherent defects of semiconductors [10,11]. Thus, a large number of researches about using various synthetic techniques to control the surface morphology of sensing materials have been reported [12,13,14]. Moreover, extensive studies have been devoted to the optimization of gas sensor performances by doping method [15,16,17,18]. For instance, Katoch et al. [19] reported that smaller hole-diameter ZnO fibers synthesized by electrospinning possess more sensitive gas response to target gases than those with larger diameters, since the ZnO fibers has an increase in the surface area. Xue et al. [20] fabricated a sensor with flower-like CeO2-SnO2 composites via hydrothermal reaction which exhibited enhanced gas response, more selective and better linearity for triethylamine gas compared to the pure SnO2 sensor. In particular, NiO (p-type) and SnO2 (n-type), two typical semiconductors with wide band gaps, which are able to form p-n heterojunctions at their interface, have attracted a lot of interest of researchers [21,22]. Jayababu et al. [23] synthesized the NiO/SnO2 nanocomposites by a simple two-step process (co-precipitation technique followed by sol-gel method); the sensor based on the nanocomposites shown improved ethanol gas-sensing properties in comparison with the SnO2 and NiO sensor devices. And these advanced sensing characteristics were chiefly due to the existence of p-n heterojunctions. Meng et al. [24] reported a gas sensor which was fabricated with the NiO-SnO2 heterojunction microflowers. The gas-sensing investigations exhibited that the 5 mol% NiO-doped SnO2 composite sample has improved sensing performances to HCHO gas. However, the synthesis of nanomaterials with large surface area and multi-active adsorption sites are still a significant but challenging task. Moreover, to the best of our knowledge, SnO2, ZnO, TiO2/SnO2 and In/NiO nanofiber sensitive materials and their gas-sensing performances have already been studied [25,26,27,28]. While the synthesis of porous NiO/SnO2 nanofibers with carbonization process in various heating rates for H2 gas sensors was much less widely reported.
Herein, we have successfully synthesized porous composites of SnO2-based nanofibers with the electrospinning method combined with the carbonization process. The as-prepared SnO2 sensor with various carbonization heating rates cause changes in the gas sensing performances due to the different micro grain size of the sample. The gas-sensing characteristics of SnO2-based nanocomposites to H2 (1–250 ppm) at various optimal operation temperature (165–240 °C) have been studied. The investigated results indicate that the NiO/SnO2 nanofibers can enhance the H2 gas-sensing properties to a large extent. Such remarkable characteristics can be principally due to the unique porous microstructure and the formation of p–n heterojunctions at the interface of NiO and SnO2.
2. Experimental Procedure
2.1. Preparation
Nickel chloride hexahydrate (NiCl2·6H2O, 99.9%), Tin chloride dehydrate (SnCl2·2H2O, ≥ 99.9%), Polyvinylpyrrolidone (PVP, Mw = 1,300,000), and N,N-Dimethylformamide (DMF, ≥ 99.9%) were obtained from Aladdin Chemical Co., Ltd. (Shanghai, China). Absolute ethanol was bought from Chongqing Chuandong Chemical Reagent Co., Ltd. (Chongqing, China). All the chemicals reagents were used as received without any further treatment.
Firstly, 1.128 g SnCl2·2H2O, 0.209 g NiCl2·6H2O (nickel atoms account for 15% of the total metal salt), absolute ethanol (5 mL) and DMF (5 mL) were added to a beaker (25 mL) and magnetically stirred for about 30 min until the solute dissolved completely. Then, 0.8 g PVP was added into the above solution and vigorously stirred for 6 h at 50 °C. After that, the prepared precursor solution was filled to a plastic 10 mL syringe with an inner diameter metallic needle of 0.8 mm. As shown in Figure 1, a high voltage of 12 kV was applied between the flat tin foil collector and the needle with the spacing of 15 cm. The precursor solution was continuously fed at a rate of 1 mL/h and the chamber was maintained at an appropriate environment condition of 35 °C and 45% relative humidity. Finally, the pristine electrospun nanofibers (marked as NiSn/0) were collected and dried at room temperature for 2 h to further use. For comparison, the pristine of pure SnO2 nanofiber, named Sn/0, was prepared by the same process without adding NiCl2·6H2O.
2.2. Carbonization
The prepared precursor electrospun pure SnO2 nanofibers were delivered to an alumina ceramic crucible and annealed at 500 °C for 3 h with diverse aging rates (2 °C/min and 4 °C/min, respectively) in air atmosphere. For convenience, we denoted the carbonated SnO2 products as Sn/2 and Sn/4, respectively. Moreover, the pristine NiO/SnO2 nanofibers were carbonized by the similar process, and annealed with aging rate of 4 °C/min in air (labeled as NiSn/4).
2.3. Characterization
The X-ray diffraction (XRD, Spectris Pte. Ltd. PANalytical X’Pert Powder, Almelo, Holland, operated at 40 kV and 40 mA) with Cu Kα radiation (λ = 0.15418 nm) and scanning electron microscopy (SEM, MIRA3 LMH, TESCAN, Brno, Czech, operated at 10 kV) were used to examine the crystalline parameters and microstructures, respectively. High resolution transmission electron microscopy (HRTEM) and high angle annular dark field (HAADF) images of our products were recorded by Thermo Fisher Scientific (FEI Talos F200S G2, Bleiswijk, Holland). Additionally, the chemical compositions of the samples were obtained by energy dispersive X-ray spectroscopy (EDS) elemental mapping and spot analyses. X-ray photoelectron spectroscopy (XPS, Thermo Fisher Scientific ESCALAB 250Xi) with Al Kα radiation was used to study the surface chemical state of our samples. The Brunauer-Emmett-Teller (BET) surface area and pore size were examined by the Quadrasorb 2MP analyzer.
2.4. Fabrication and Measurement
Gas-sensor devices based on nanofiber sensing-materials were fabricated via the same technology as the previously reported article [29]. In this study, gas sensing properties of the obtained sensor devices at different working temperatures for various concentrations of H2 were studied by the Chemical Gas Sensor-8 (CGS-8) intelligent gas sensing analysis system (Beijing Elite Tech Co., Ltd., Beijing, China) [30]. The sensor response was denoted by S = Ra/Rg, in which Ra is the resistance in atmospheric air, and Rg is the resistance in the target gas [31]. The response and recovery time of gas sensor devices were defined as the time required by the sensor to achieve 90% of the total resistance after injecting and removing the target gas [32]. The measurements of these sensors were all conducted in constant laboratory environmental conditions with temperature 25 °C and 50% relative humidity.
3. Results and Discussion
3.1. Structural and Morphological Characterizations
Figure 2 displays the XRD spectra of the Sn/2, Sn/4 and NiSn/4 samples. It can be seen from Figure 2 for spectrum of the Sn/2, Sn/4 products that the diffraction peaks marked with the corresponding angles can be well matched the SnO2 (JCPDS File NO.41-1445) [33]. The XRD spectrum of NiSn/4 nanofiber shows that the introduction of NiO broadens the diffraction peaks of the sample, indicating that the crystal lattice of the composite nanofibers may be distorted. Moreover, it is difficult to observe the diffraction peaks of NiO, which may due to its small content and the presence of the second phase in the diffraction peak of SnO2 [34]. The average grain sizes of the most prominent diffraction peaks of (110), (101) and (211) for the Sn/2, Sn/4 and NiSn/4 nanofibers, located at 26.72°, 34.04° and 51.81°, respectively, were calculated using the Debye-Scherer equation (D = kλ/ρcosθ). Results were approximately 12.12 nm, 11.38 nm and 6.29 nm, respectively [35].
The surface topography characteristics of the electrospun samples were examined via SEM as shown in Figure 3. From Figure 3a,b, it can be seen that both the pristine Sn/0 and NiSn/0 samples exhibit continuous multi-layered fiber-like shapes in a random distribution. The diameter of a single nanofiber is approximately 200 nm as shown in the insert picture from Figure 3a,c,e,g present the SEM images of the carbonized SnO2-based nanofibers under different aging conditions. We can find that the surface morphology of the samples has hardly changed after aging, except for a few fibers fracture as indicated by the red box in the images of Figure 3c,e,g. This phenomenon may be caused by the thermal effects during the aging process [36]. Figure 3d,f,h show high-magnification SEM images of Sn/2, Sn/4 and NiSn/4 nanofibers. Obviously, the surface topography of the electrospun samples became rough due to the thermo decomposition of PVP [37]. In addition, the carbonized pure SnO2 nanofibers as displayed in Figure 3d,f show different surface roughness at different heating rates. The surface of the Sn/2 nanofiber obtained by slow heating rate is rougher than the Sn/4 sample. The surface of the composite NiSn/4 nanofiers as shown in Figure 3h was relatively smooth, which may attribute to the introduction of NiO.
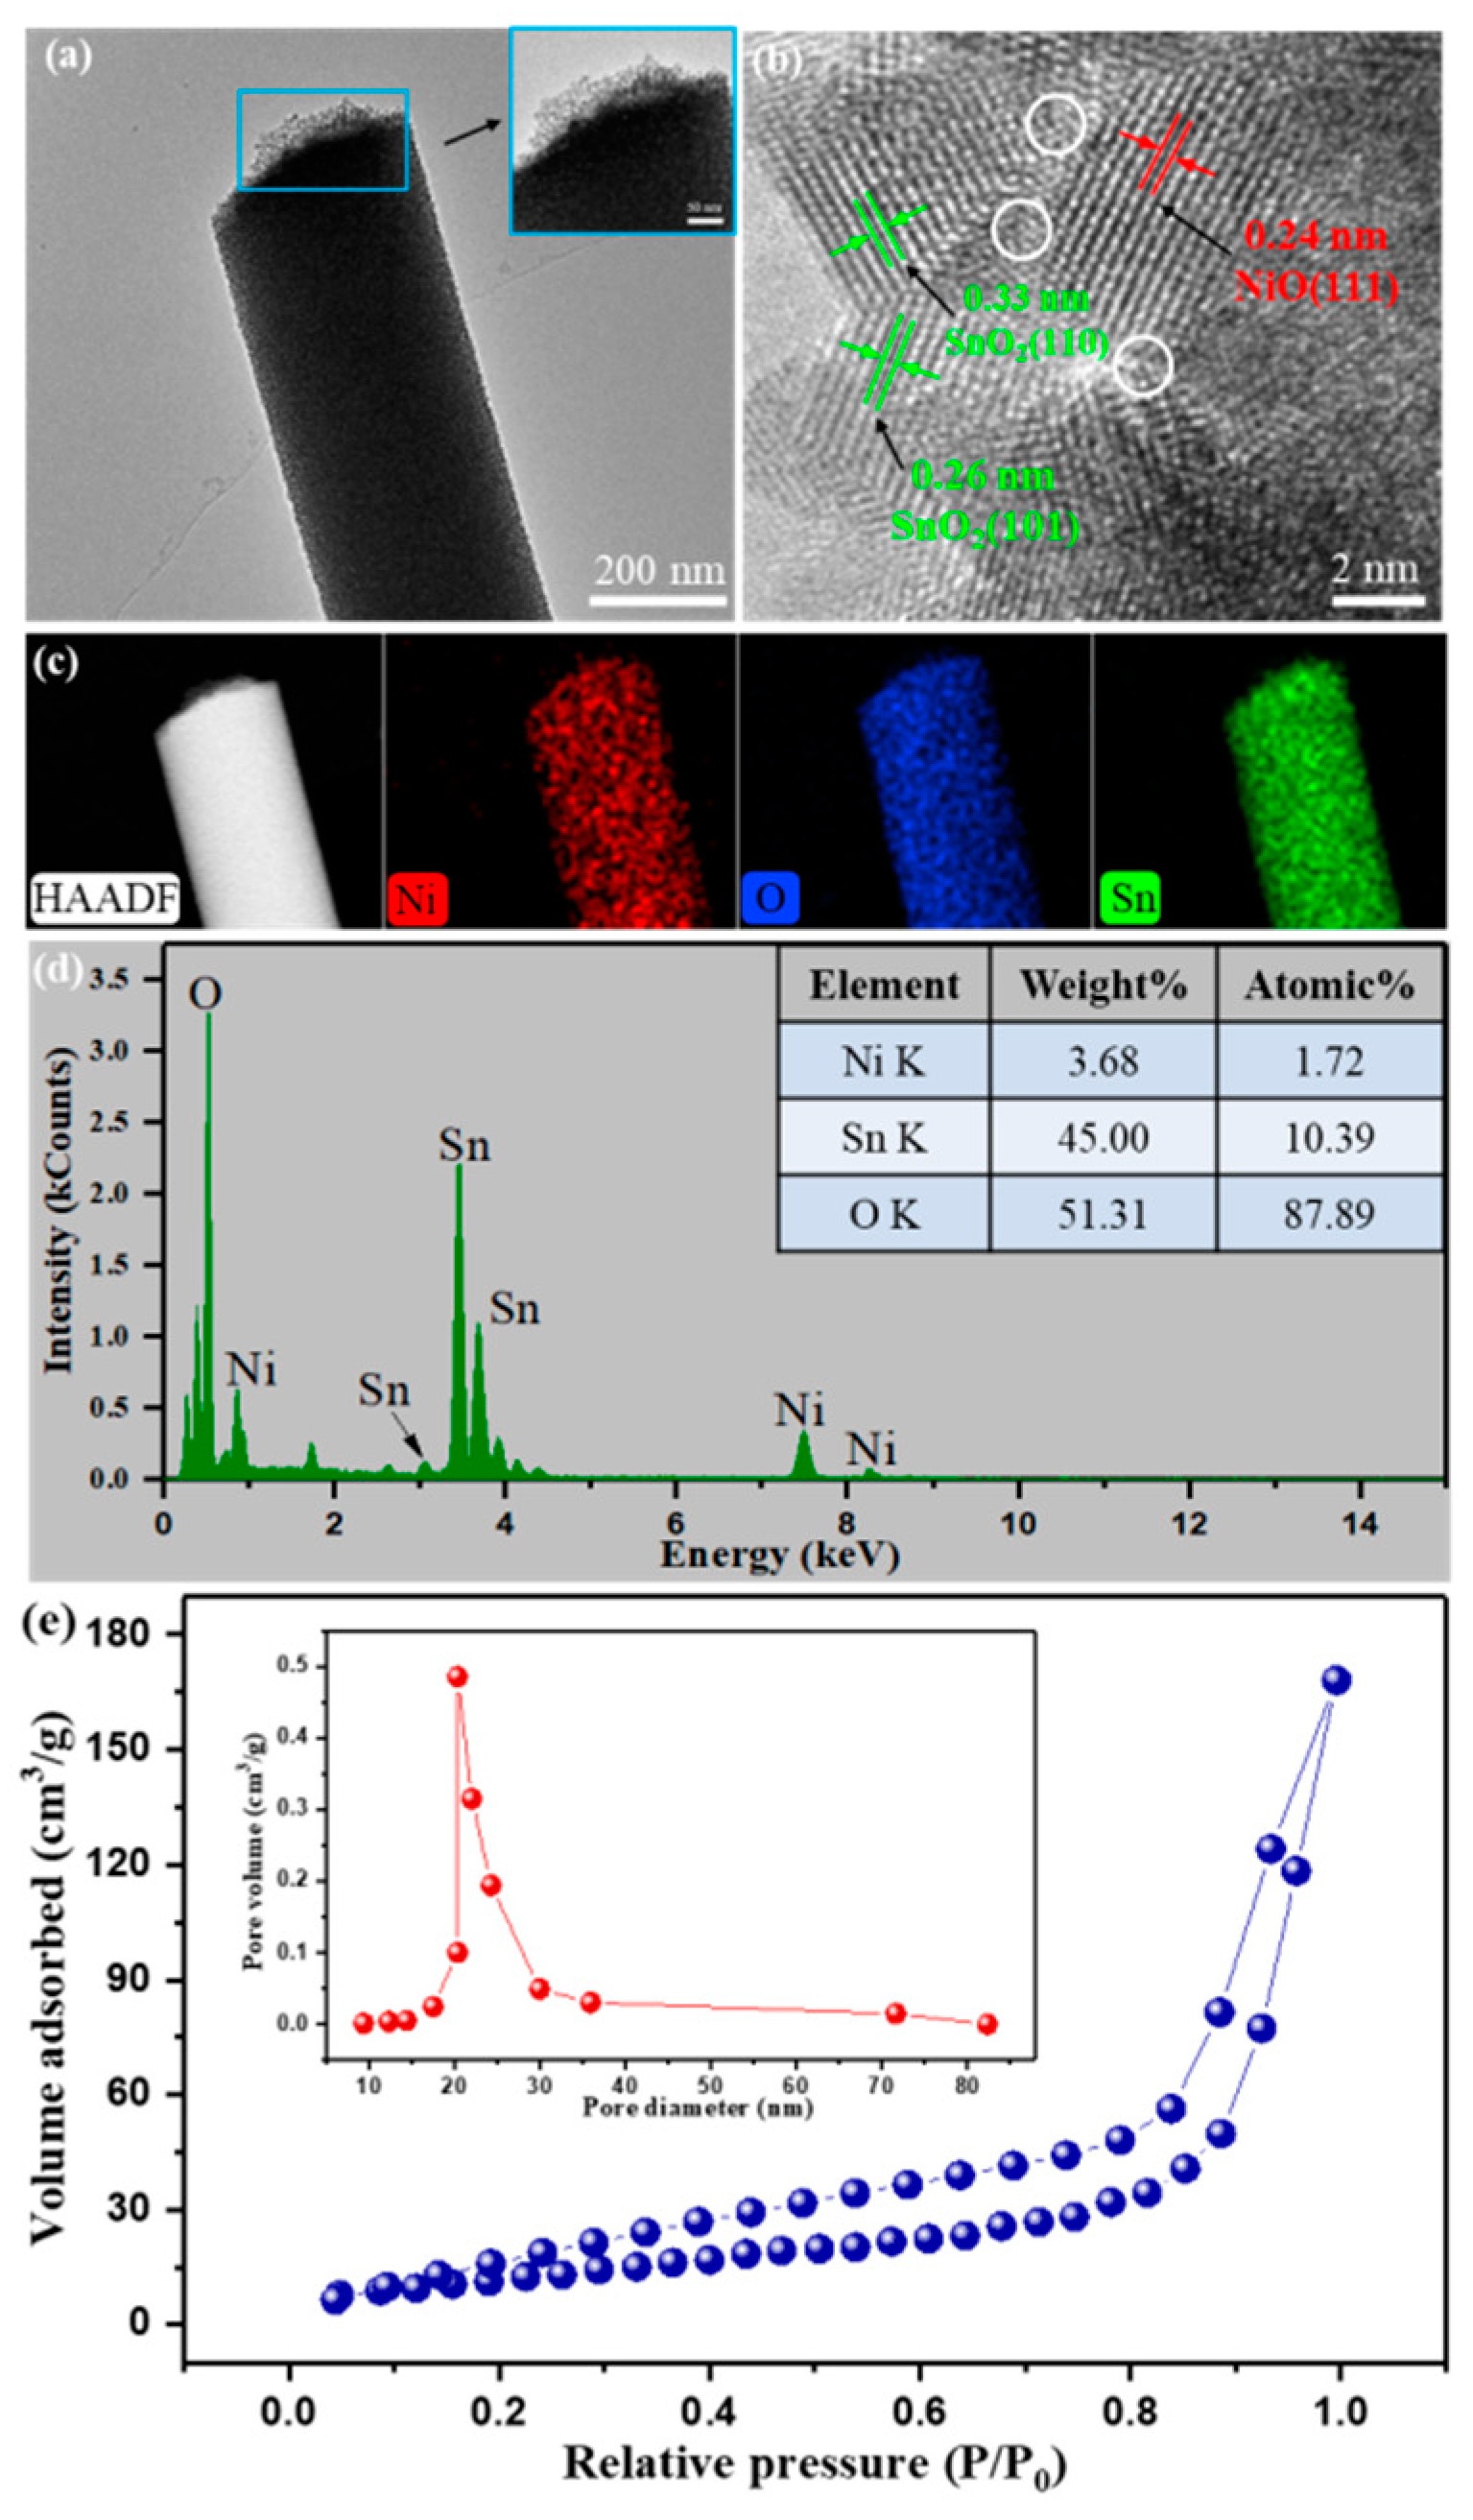
The morphological properties, nanostructures and chemical compositions along with contents of the NiSn/4 nanocomposite were studied by HRTEM, HAADF and EDS, respectively. As shown in Figure 4, the NiSn/4 nanofiber with a diameter about 200 nm was composed of a large number of stacked nanoparticles, and NiO and SnO2 particles cannot be clearly distinguished. This sample with unique porous nanostructure can provide more gas adsorption active sites and as a consequence may exhibit excellent gas-sensing performances. Obvious lattice fringes can be seen from Figure 4b, presenting a polycrystalline structure of the NiSn/4 sample. The marked lattice spacing of 0.33 nm and 0.26 nm shown no difference in the (110) and (101) planes of SnO2, respectively [38]. Besides, the lattice fringes with a spacing of 0.24 nm, which can be attributed to the NiO (111) plane [39]. The p-n heterojunctions exist between the SnO2 and NiO as marked by the white circle in Figure 4b. The difference in element weight can be reflected in various brightness of HADDF image, and element mapping can be used to analyze the distribution of sample elements. Based on these principles, we obtained the element composition and distribution results by means of characterization, as shown in Figure 4c. From Figure 4c, all images with uniform brightness and color, indicating that elements are evenly distributed in the nanofiber. EDS was used to further investigate the element composition and content of NiSn/4 nanocomposite. From the EDS spectrum (Figure 4d), we can see the presence of the elements O, Ni and Sn. The proportion of Ni atoms was calculated to be 14.2%, which was approximately the same as the experimental preset value (15%). The N2 adsorption-desorption isotherm and pore size distribution curve of the NiSn/4 nanofibers was shown in Figure 4e. From Figure 4e, we can find a distinct hysteresis loop, which indicates that the NiSn/4 nanofibers exhibit a large textural porosity. Moreover, the BET surface area of the NiSn/4 sample was calculated to be 43.57 m2/g. The corresponding pore size distribution was calculated by the BJH method [18]. The pore size distribution cure indicates that the relatively narrow pore size distribution centers are approximately 20.3 nm.
The surface physical and chemical features of semiconductor nanomaterials, especially the oxygen defect content, play a significant part in gas-sensing properties of materials [40]. Therefore, we used XPS to study the elemental compositions and valence states of the NiSn/4 nanocomposite surface, and processed the peak fitting of the main elements. As presented in Figure 5a, the total spectrum of NiSn/4 sample surface mainly contains the elements of Sn, Ni, and O. The present of C peak with binging energy of 284.8 eV was introduced by the instrument itself for peak correction [41]. Figure 5b shows two peaks of Sn 3d5/2 (486.8 eV) and Sn 3d3/2 (495.2 eV) with binding energy difference of 8.4 eV, suggesting a normal chemical state of Sn4+ in the sample [42]. The divided high-resolution spectra of Ni 2p was fitted by Lorentz-Gauss Fitting, and shown in Figure 5c. Both the Ni 2p3/2 and Ni 2p1/2 are composed of the main peak and the satellite peak. The peaks of Ni 2p3/2 at 855.0 eV with its satellite peak (861.1 eV) and Ni 2p1/2 at 872.6 eV with its satellite peak (879.1 eV) indicated Ni2+ exists in the NiO/SnO2 composite [43]. From Figure 5d, the O1s peak is composed of three peaks located 529.9 eV, 531.5 eV and 532.6 eV, which were correspond for O2−, oxygen vacancies and hydroxyl groups, respectively [44].
3.2. Gas-Sensing Properties
Figure 6 shows the gas response of sensor devices to 100 ppm H2 at the operation temperatures ranging from 165 °C to 240 °C. From Figure 6, the gas response of sensors based on Sn/0, Sn/2, Sn/4 and NiSn/4 nanofibers initially increased with increasing temperature and reached the maximum values of 3.018, 24.293, 27.559 and 37.153, respectively. This process is mainly attributed to the fact that target gases can obtain more energy to surmount the energy barrier as working temperature increased, which promote the adsorption and reaction of the gas molecules and the surface of gas-sensing materials [45]. The gas response decreased with further temperature increases, which may be related to the enhancement of desorption process caused by the higher operation temperature. The optimal operation temperatures of Sn/0, Sn/2 and Sn/4 sensors were 210 °C, while the optimal operation temperature of NiSn/4 snesor was 195 °C. In addition, the gas response of the Sn/0 sensor is significantly lower than that of the sensor (Sn/2 and Sn/4) fabricated with carbonized nanofibers, which may due to the organic solvent contained in the nanofiber.
The gas response curves of Sn/2, Sn/4 and NiSn/4 sensors to H2 with various concentrations at their optimal operation temperatures are shown in Figure 7a. The gas responses of sensor devices increased with increasing H2 concentration up to 150 ppm, which is because of the more H2 molecules reacts with sensing- material, the more resistance of nanomaterial decreases. Additionally, the gas response of the NiSn/4 sensor device is higher than the other two sensors (Sn/2, Sn/4). This test results may be caused by the formation of p-n heterojunctions in the sample after the addition of NiO. We can also find from Figure 7a that the Sn/4 sample has an enhanced gas response than the Sn/2 sample, which may be related to the smaller grain size of the Sn/4 sample [36]. Figure 7b shows the corresponding linear fitting curves of the sensor devices at low H2 concentrations (1–25 ppm). The linear fitting results indicate that the synthesized samples have good linearity at low concentrations.
It is widely acknowledged that the response and recovery characteristic is an important parameter of sensor devices. Thus, the response and recovery performances of Sn/2, Sn/4 and NiSn/4 sensors to 25 ppm H2 sensors was investigated as shown in Figure 8. It can be found from Figure 8a–c that the gas responses of all sensor devices show the same trend, that is, the gas responses of the Sn/2, Sn/4 and NiSn/4 sensors, gradually increase and tend to be stable at 11.934, 14.947 and 19.342, respectively, when H2 is injected, while they rapidly decrease when H2 is discharged. The corresponding response and recovery times of the Sn/2, Sn/4 and NiSn/4 sensors as shown in Figure 8d were calculated as approximately 17/7, 15/6 and 12/5 s, respectively. In addition, we can find from Figure 8d that the recovery time of the sensor is less than the response time. The possible reason could be that the unique porous nanostructure may provide an effective gas path for gas desorption, which allows H2 to be released quickly from the sensing materials [17].
Figure 9a displays the resistance curve of the NiSn/4 sample toward 50 ppm H2 at 195 °C in five periods. As seen in Figure 9a, the resistance of the NiSn/4 sensor can be restored to the stable values of approximately 19.9 KΩ and 524.5 KΩ as the gas is introduced and discharged in five cycles. The corresponding dynamic gas-sensing curve is presented in Figure 9b. The gas response of the NiSn/4 sensor reaches the maximum value of approximately 26.674 with a standard deviation of 1.20% when the gas enters, and returns to the original value as the H2 exits, which confirms the excellent reproducibility of the gas-sensing performances. The long stability of NiSn/4 sensor to 50 ppm H2 at 195 °C is shown in Figure 9c. From Figure 9c, we can find that the gas response of NiSn/4 sensor demonstrates good reproducibility over the test period, which indicates the excellent stability of prepared NiSn/4 sensor.
In addition, the gas-sensing properties of some various nanostructures hydrogen sensors that have been reported in the last few years are listed in Table 1. Compared with those reported sensor, the present NiO/SnO2 sensor shows superior gas response, which indicates that our product is more likely to be used for H2 detection in real application.
3.3. Sensing Mechanism
In general, semiconducting sensing nanomaterials with interesting physical and chemical properties can detect various gases because of the adsorption gas molecules can exchange charge carriers with the semiconductor materials lead to the change of electrical resistance [55]. As exposing SnO2 (n-type with band gap of 3.6 eV) to air, its surface-adsorbed oxygen molecules will trap electrons from tin dioxide conduction band and ionize into diverse adsorbed oxygen (O−, O2− and O2−) under the action of heat [32]. And the electric resistance of the sensing-material will be enhanced during this reaction process.
Whereas exposing SnO2 to H2, the chemically adsorbed oxygen will react with the H2 gas, and the free electrons will be released into the conduction band of SnO2, which ended up with reduced electrical resistance and increased gas response. Thus, the positive gas response (Ra/Rg) was measured. Compared with the Sn/2 sample, the improved gas sensitivity performances of the Sn/4 sample can be attributed to the fact that the Sn/4 with smaller grain size provides more active adsorption situs for gas adsorption and facilitates the reaction. That is to say, when exposing the Sn/4 nanofibers to H2, more electrons were released back to the sensing materials and the resistance value of Sn/4 in target gas (H2) was measured to be lower than that of the Sn/2 nanofibers, eventually resulting in the Sn/4 nanofibers exhibiting higher gas response.
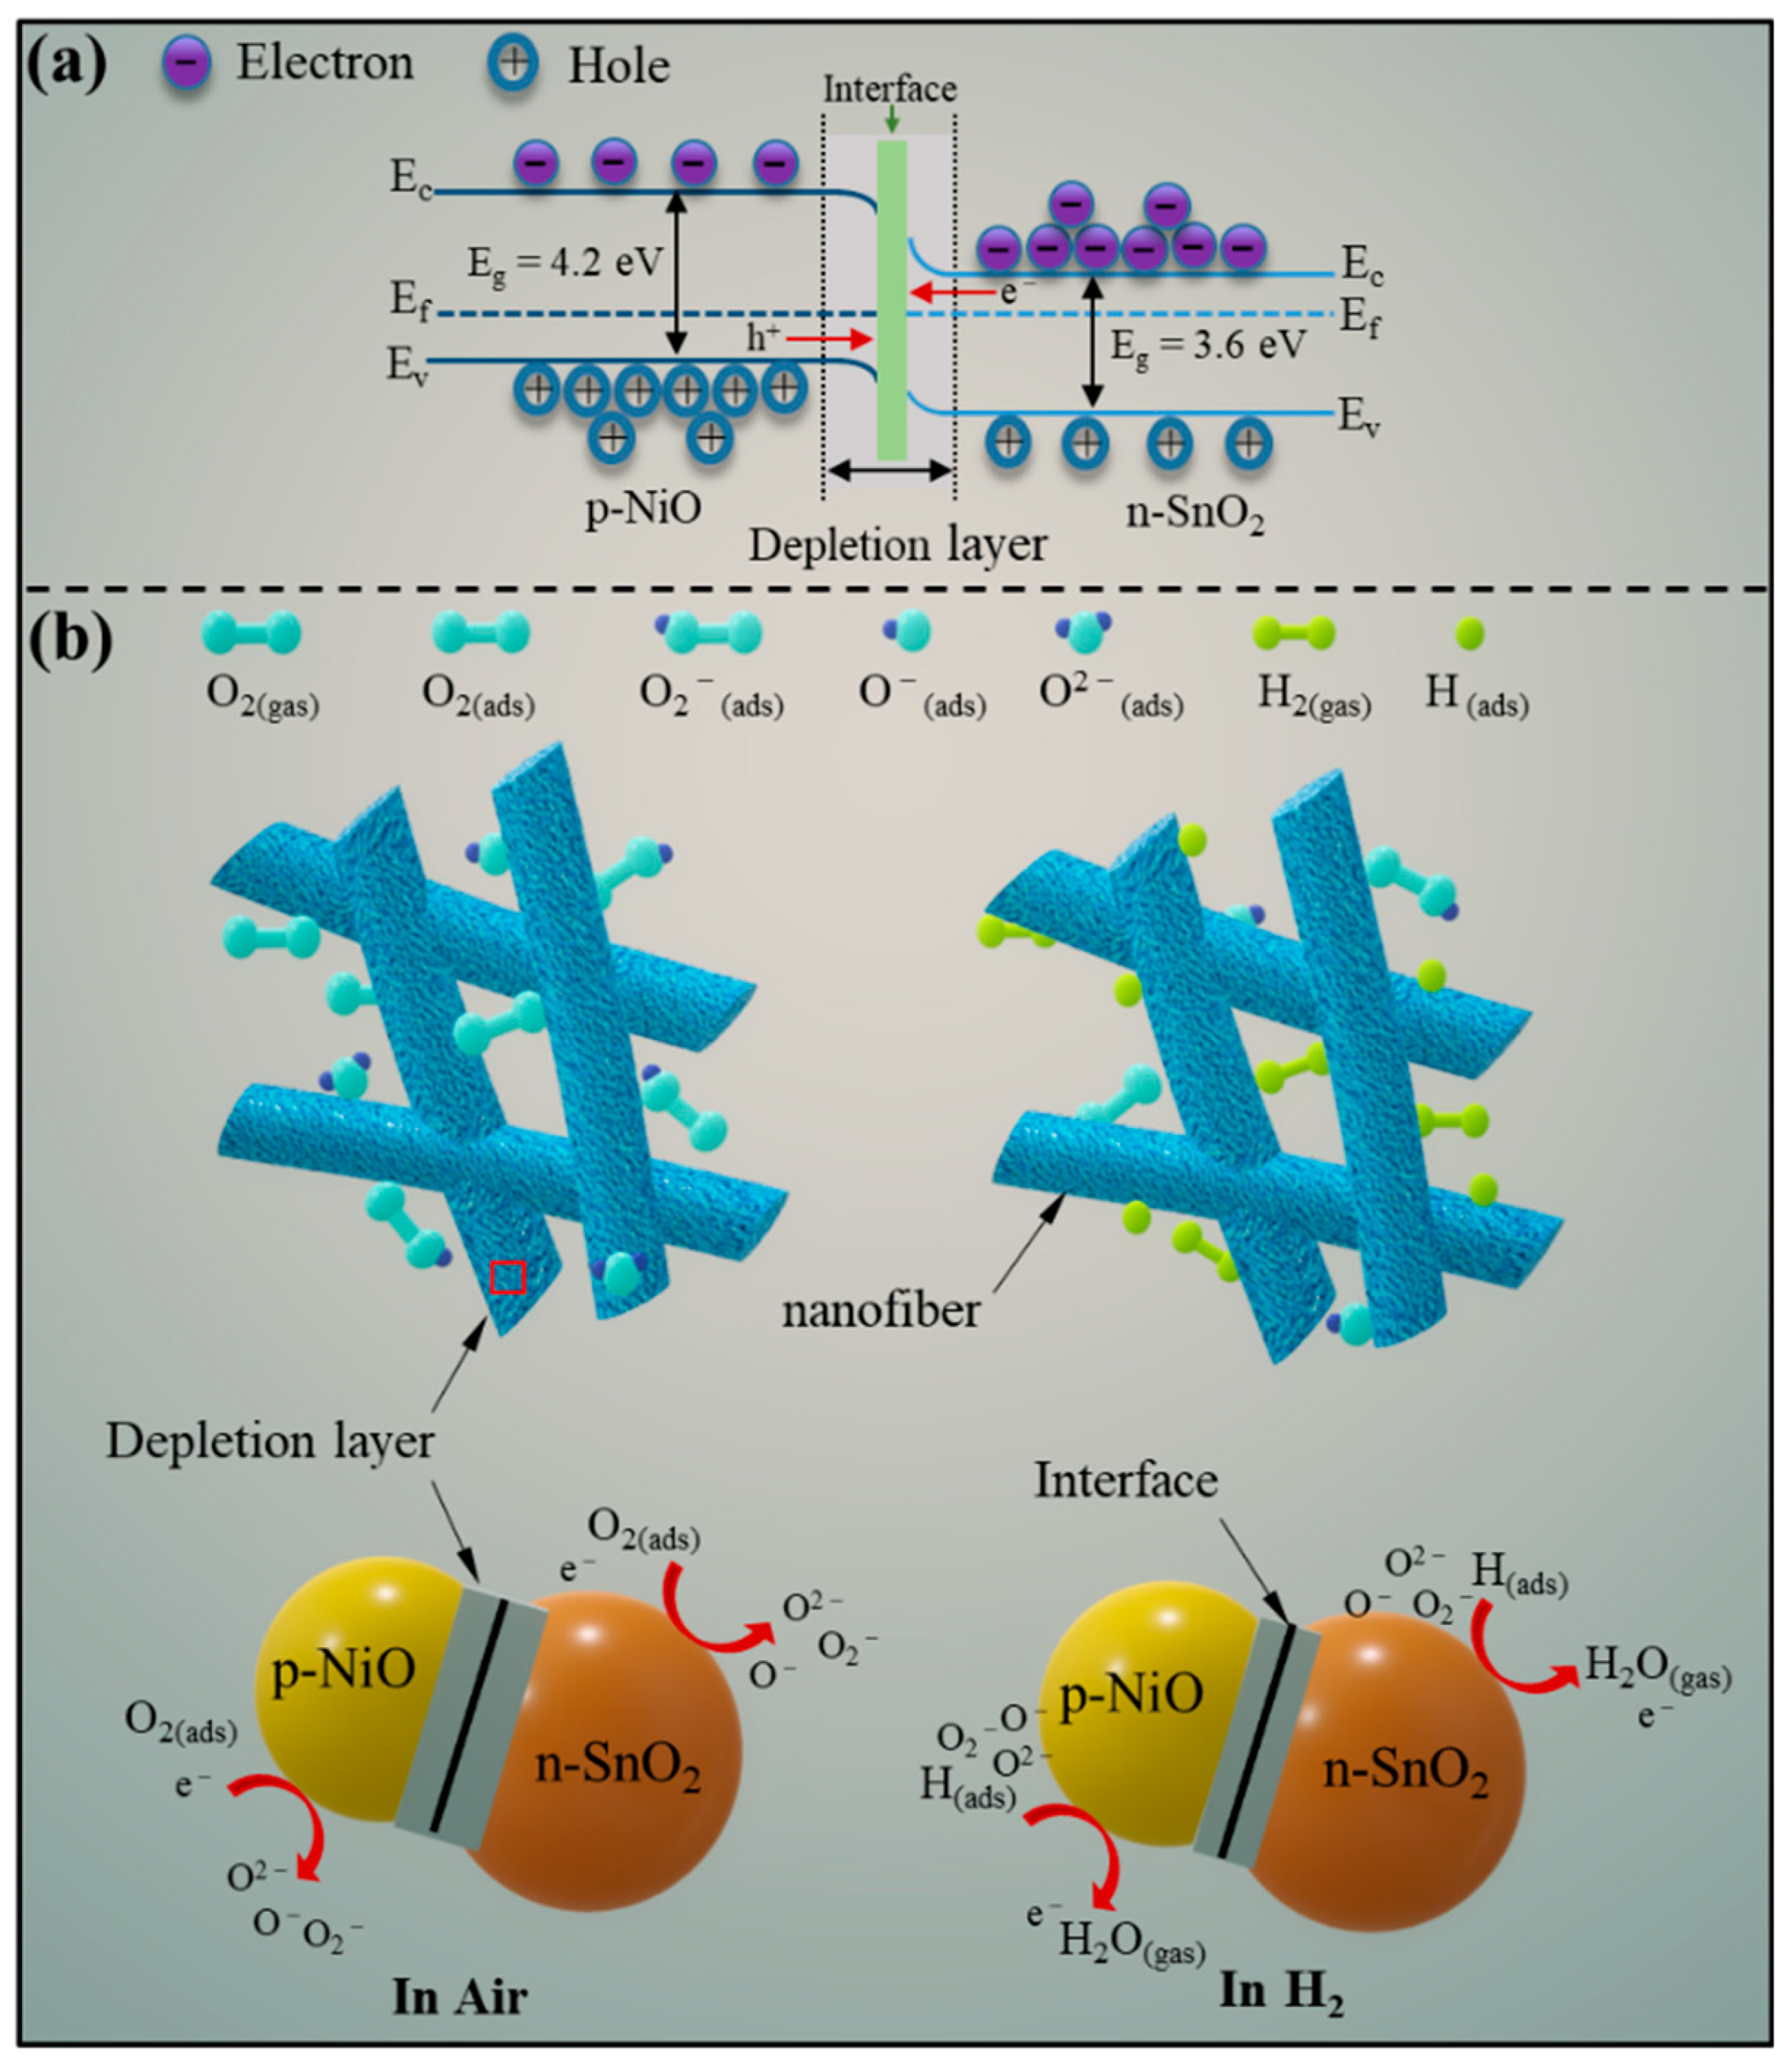
The enhanced gas-sensing property of the NiO/SnO2 sensor is attributable to the formation of p-n heterojunctions at the interfaces between NiO and SnO2. As we all know, NiO as a typical p-type semiconductor with the band gap of 4.2 eV shows conductivity by holes [56]. When NiO and SnO2 make contact with each other, the electrons will transfer from SnO2 to NiO, while the holes transfer will be reversed due to the difference in concentration of the charge carriers [57]. The semiconductor band is significantly bent until the Fermi level is equal as shown in Figure 10a, resulting in the formation of a self-built electric field and p-n heterojunctions at the interface [58]. This heterojunction effect leads to the formation of a depletion layer.
When the NiO/SnO2 nanocomposite is exposed to air, as shown in Figure 10b, oxygen molecules can absorb on the surface of the sensing material and trap electrons in the NiO/SnO2 sample to form adsorbed oxygen. The electric resistance in air (Ra) of NiO/SnO2 sample is higher than that of the pure SnO2 sample due to the existence of depletion layer [59]. When H2 was injected, the absorbed oxygen on the surface of NiO/SnO2 nanofiber react with target molecules and release electrons back to the SnO2 conduction band and combine with the holes of NiO. This process will lead to the depletion layer significantly narrows and the electric resistance of the NiO/SnO2 nanocomposites obviously decreases [32]. Therefore, according to the definition of gas response (Ra/Rg), the enhanced gas response of the sensor was measured due to the variation of resistance [60]. In short, as-prepared NiO/SnO2 composite nanofibers with p-n heterojunctions exhibit enhanced gas-sensing properties to hydrogen.
4. Conclusions
In summary, the porous sensing materials of SnO2-based nanofibers have successfully synthesized via electrospinning method along with carbonization process in various heating rates. The results of characterization indicate that carbonization process can make the pristine nanofibers form porous nanostructure. Gas-sensing investigations prove that various ageing heating rates can cause changes in the micro grain size of SnO2 nanofibers, leading to differences in gas-sensing properties. In addition, the NiO/SnO2 nanocomposites based sensor shows improved gas-sensing properties to H2 by comparing with the pure one. Specifically, the optimum working temperatures of the NiO/SnO2 (NiSn/4) and pure SnO2 (Sn/4) sensors were tested to be about 210 °C and 195 °C, respectively. The corresponding gas responses to 100 ppm H2 under their optimum working temperatures reached 37.153 and 27.559, respectively. Moreover, the superior hydrogen sensing properties of the NiO/SnO2 sensor with good low concentration linearity, short response-recovery time and excellent reproducibility are also obtained. This work suggests that the NiO/SnO2 nanocomposites with unique porous and p–n heterojunctions would make it as a potential candidate for superior-performance sensing of gases.
Author Contributions
conceptualization, Q.Z. and H.L.; methodology, F.W.; validation, K.H., B.Z. and L.H.; investigation, H.L. and K.H.; resources, B.Z.; data curation, H.L.; writing—original draft preparation, H.L.; writing—review and editing, F.W., Q.Z. and H.L.; visualization, K.H. and L.H.; supervision, B.Z.; project administration, F.W. and Q.Z.
Funding
This research was funded by the National Key R&D Program of China (2017YFB0903801), the Fundamental Research Funds for the Central Universities (2019CDXYDQ0010) and the National “111” Project of the Ministry of Education of China (B08036).
Conflicts of Interest
The authors declare no conflict of interest.
References
- Jang, B.; Kim, M.H.; Baek, J.; Kim, W.; Lee, W. Highly sensitive hydrogen sensors: Pd-coated Si nanowire arrays for detection of dissolved hydrogen in oil. Sens. Actuators B Chem. 2018, 273, 809–814. [Google Scholar] [CrossRef]
- Xu, L.N.; Chen, W.G.; Jin, L.F.; Zeng, W. A novel SnO2 nanostructures and their gas-sensing properties for CO. J. Mater. Sci. Mater. Electron. 2016, 27, 4826–4832. [Google Scholar] [CrossRef]
- Yoo, R.; Park, Y.; Jung, H.; Rim, H.J.; Cho, S.; Lee, H.S.; Lee, W. Acetone-sensing properties of doped ZnO nanoparticles for breath-analyzer applications. J. Alloys Compd. 2019, 803, 135–144. [Google Scholar] [CrossRef]
- Zhao, G.D.; Xuan, J.Y.; Liu, X.L.; Jia, F.C.; Sun, Y.P.; Sun, M.L.; Yin, G.C.; Liu, B. Low-cost and high-performance ZnO nanoclusters gas sensor based on new-type FTO electrode for the low-concentration H2S gas detection. Nanomaterials 2019, 9, 435. [Google Scholar] [CrossRef] [PubMed]
- Haviar, S.; Capek, J.; Batkova, S.; Kumar, N.; Dvorak, F.; Duchon, T.; Fialova, M.; Zeman, P. Hydrogen gas sensing properties of WO3 sputter-deposited thin films enhanced by on-top deposited CuO nanoclusters. Int. J. Hydrogen Energy 2018, 43, 22756–22764. [Google Scholar] [CrossRef]
- Zhou, Q.; Chen, W.G.; Xu, L.N.; Kumar, R.; Gui, Y.G.; Zhao, Z.Y.; Tang, C.; Zhu, S.P. Highly sensitive carbon monoxide (CO) gas sensors based on Ni and Zn doped SnO2 nanomaterials. Ceram. Int. 2018, 44, 4392–4399. [Google Scholar] [CrossRef]
- Deepa, S.; Kumari, K.P.; Thomas, B. Contribution of oxygen-vacancy defect-types in enhanced CO2 sensing of nanoparticulate Zn-doped SnO2 films. Ceram. Int. 2017, 43, 17128–17141. [Google Scholar] [CrossRef]
- Zhang, J.Z.; Yan, Y. Synthesis of biomorphic tube-like CuO using pomelo white flesh as biotemplate and its sensing properties over H2S at room temperature. J. Mater. Sci. 2017, 52, 13711–13718. [Google Scholar] [CrossRef]
- Zhou, Q.; Umar, A.; Sodki, E.M.; Amine, A.; Xu, L.N.; Gui, Y.G.; Ibrahim, A.A.; Kumar, R.; Baskoutas, S. Fabrication and characterization of highly sensitive and selective sensors based on porous NiO nanodisks. Sens. Actuators B Chem. 2018, 259, 604–615. [Google Scholar] [CrossRef]
- Choi, P.G.; Izu, N.; Shirahata, N.; Masuda, Y. Improvement of sensing properties for SnO2 gas sensor by tuning of exposed crystal face. Sens. Actuators B Chem. 2019, 296, 126655. [Google Scholar] [CrossRef]
- Li, H.K.; Zhu, D.C.; Yang, Z.Y.; Lu, W.R.; Pu, Y. The ethanol-sensitive property of hierarchical MoO3-mixed SnO2 aerogels via facile ambient pressure drying. Appl. Surf. Sci. 2019, 489, 384–391. [Google Scholar] [CrossRef]
- Luan, V.H.; Tien, H.N.; Hur, S.H.; Han, J.H. Three-Dimensional Porous Nitrogen-Doped NiO Nanostructures as Highly Sensitive NO2 Sensors. Nanomaterials 2017, 7, 313. [Google Scholar] [CrossRef] [PubMed]
- Colak, H.; Karakose, E. Synthesis and characterization of different dopant (Ge, Nd, W)-doped ZnO nanorods and their CO2 gas sensing applications. Sens. Actuators B-Chem. 2019, 296, 126629. [Google Scholar] [CrossRef]
- Ganbavle, V.V.; Inamdar, S.I.; Agawane, G.L.; Kim, J.H.; Rajpure, K.Y. Synthesis of fast response, highly sensitive and selective Ni:ZnO based NO2 sensor. Chem. Eng. J. 2016, 286, 36–47. [Google Scholar] [CrossRef]
- Tomer, V.K.; Duhan, S. Ordered mesoporous Ag-doped TiO2/SnO2 nanocomposite based highly sensitive and selective VOCs sensor. J. Mater. Chem. A 2016, 4, 1033–1043. [Google Scholar] [CrossRef]
- Malik, R.; Tomer, V.K.; Dankwort, T.; Mishra, Y.K.; Kienle, L. Cubic mesoporous Pd–WO3 loaded graphitic carbon nitride (g-CN) nanohybrids: Highly sensitive and temperature dependent VOC sensors. J. Mater. Chem. A 2018, 6, 10718–10730. [Google Scholar] [CrossRef]
- Malik, R.; Tomer, V.K.; Joshi, N.; Dankwort, T.; Lin, L.; Kienle, L. Au–TiO2-Loaded Cubic g-C3N4 Nanohybrids for Photocatalytic and Volatile Organic Amine Sensing Applications. ACS Appl. Mater. Interfaces 2018, 10, 34087–34097. [Google Scholar] [CrossRef] [PubMed]
- Tomer, V.K.; Malik, R.; Chaudhary, V.; Mishra, Y.K.; Kienle, L.; Ahuja, R.; Lin, L. Superior visible light photocatalysis and low-operating temperature VOCs sensor using cubic Ag(0)-MoS2 loaded g-CN 3D porous hybrid. Appl. Mater. Today 2019, 16, 193–203. [Google Scholar] [CrossRef]
- Katoch, A.; Abideen, Z.U.; Kim, J.H.; Kim, S.S. Influence of hollowness variation on the gas-sensing properties of ZnO hollow nanofibers. Sens. Actuators B Chem. 2016, 232, 698–704. [Google Scholar] [CrossRef]
- Xue, D.P.; Wang, Y.; Cao, J.L.; Zhang, Z.Y. Hydrothermal Synthesis of CeO2-SnO2 Nanoflowers for Improving Triethylamine Gas Sensing Property. Nanomaterials 2018, 8, 1025. [Google Scholar] [CrossRef] [PubMed]
- Wang, Y.; Zhang, H.; Sun, X.H. Electrospun nanowebs of NiO/SnO2 p-n heterojunctions for enhanced gas sensing. Appl. Surf. Sci. 2016, 389, 514–520. [Google Scholar] [CrossRef]
- Gao, H.Y.; Zhao, L.P.; Wang, L.W.; Sun, P.; Lu, H.Y.; Liu, F.M.; Chuai, X.H.; Lu, G.Y. Ultrasensitive and low detection limit of toluene gas sensor based on SnO2-decorated NiO nanostructure. Sens. Actuators B-Chem. 2018, 255, 3505–3515. [Google Scholar] [CrossRef]
- Jayababu, N.; Poloju, M.; Shruthi, J.; Reddy, M.V.R. Semi shield driven p-n heterostructures and their role in enhancing the room temperature ethanol gas sensing performance of NiO/SnO2 nanocomposites. Ceram. Int. 2019, 45, 15134–15142. [Google Scholar] [CrossRef]
- Meng, D.; Liu, D.Y.; Wang, G.S.; Shen, Y.B.; San, X.G.; Li, M.; Meng, F.L. Low-temperature formaldehyde gas sensors based on NiO-SnO2 heterojunction microflowers assembled by thin porous nanosheets. Sens. Actuators B Chem. 2018, 173, 418–428. [Google Scholar] [CrossRef]
- Kou, X.Y.; Xie, N.; Chen, F.; Wang, T.S.; Guo, L.L.; Wang, C.; Wang, Q.J.; Ma, J.; Sun, Y.F.; Zhang, H.; et al. Superior acetone gas sensor based on electrospun SnO2 nanofibers by Rh doping. Sens. Actuators B Chem. 2018, 256, 861–869. [Google Scholar] [CrossRef]
- Katoch, A.; Choi, S.W.; Kim, H.W.; Kim, S.S. Highly sensitive and selective H2 sensing by ZnO nanofibers and the underlying sensing mechanism. J. Hazard. Mater. 2015, 186, 229–235. [Google Scholar] [CrossRef] [PubMed]
- Li, F.; Gao, X.; Wang, R.; Zhang, T.; Lu, G.Y. Study on TiO2-SnO2 core-shell heterostructure nanofibers with different work function and its application in gas sensor. Sens. Actuators B Chem. 2017, 248, 812–819. [Google Scholar] [CrossRef]
- Feng, C.H.; Kou, X.Y.; Chen, B.; Qian, G.B.; Sun, Y.F.; Lu, G.Y. One-pot synthesis of In doped NiO nanofibers and their gas sensing properties. Sens. Actuators B Chem. 2017, 253, 584–591. [Google Scholar] [CrossRef]
- Lu, Z.R.; Zhou, Q.; Xu, L.N.; Gui, Y.G.; Zhao, Z.Y.; Tang, C.; Chen, W.G. Synthesis and Characterization of Highly Sensitive Hydrogen (H-2) Sensing Device Based on Ag Doped SnO2 Nanospheres. Materials 2018, 11, 492. [Google Scholar] [CrossRef]
- Wei, Z.J.; Zhou, Q.; Wang, J.X.; Gui, Y.G.; Zeng, W. A novel porous NiO nanosheet and its H2 sensing performance. Mater. Lett. 2019, 245, 166–169. [Google Scholar] [CrossRef]
- Xiao, X.Y.; Zhou, X.R.; Ma, J.H.; Zhu, Y.H.; Cheng, X.W.; Luo, W.; Deng, Y.H. Rational synthesis and gas sensing performance of ordered mesoporous semiconducting WO3/NiO composites. ACS Appl. Mater. Interfaces 2019, 11, 26268–26276. [Google Scholar] [CrossRef] [PubMed]
- Liu, H.C.; Zhou, Q.; Zhang, Q.Y.; Hong, C.X.; Xu, L.N.; Jin, L.F.; Chen, W.G. Synthesis, characterization and enhanced sensing properties of a NiO/ZnO p-n junctions sensor for the SF6 decomposition byproducts SO2, SO2F2, and SOF2. Sensors 2017, 17, 4. [Google Scholar]
- Kalidoss, R.; Umapathy, S.; Anandan, R.; Ganesh, V.; Sivalingam, Y. Comparative study on the preparation and gas sensing properties of reduced graphene Oxide/SnO2 Binary nanocomposite for detection of acetone in exhaled breath. Anal. Chem. 2019, 91, 5116–5124. [Google Scholar] [CrossRef] [PubMed]
- Liu, L.; Zhang, Y.; Wang, G.G.; Li, S.C.; Wang, L.Y.; Han, Y.; Jiang, X.X.; Wei, A.G. High toluene sensing properties of NiO-SnO2 composite nanofiber sensors operating at 330 degrees C. Sens. Actuators B Chem. 2011, 160, 448–454. [Google Scholar] [CrossRef]
- Wang, D.; Wan, K.C.; Zhang, M.L.; Li, H.J.; Wang, P.; Wang, X.Y.; Yang, J.H. Constructing hierarchical SnO2 nanofiber/nanosheets for efficient formaldehyde detection. Sens. Actuators B Chem. 2019, 283, 714–723. [Google Scholar] [CrossRef]
- Park, J.Y.; Asokan, K.; Choi, S.W.; Kim, S.S. Growth kinetics of nanograins in SnO2 fibers and size dependent sensing properties. Sens. Actuators B Chem. 2011, 152, 254–260. [Google Scholar] [CrossRef]
- Bai, S.L.; Fu, H.; Zhao, Y.Y.; Tian, K.; Luo, R.X.; Li, D.Q.; Chen, A.F. On the construction of hollow nanofibers of ZnO-SnO2 heterojunctions to enhance the NO2 sensing properties. Sens. Actuators B Chem. 2018, 266, 692–702. [Google Scholar] [CrossRef]
- Lian, X.X.; Li, Y.; Zhu, J.W.; Zou, Y.L.; An, D.M.; Wang, Q. Fabrication of Au-decorated SnO2 nanoparticles with enhanced n-buthanol gas sensing properties. Mater. Sci. Semicon. Proc. 2019, 101, 198–205. [Google Scholar] [CrossRef]
- Gao, H.Y.; Yu, Q.; Zhang, S.F.; Wang, T.S.; Sun, P.; Lu, H.Y.; Liu, F.M.; Yan, X.; Liu, F.M.; Liang, X.S.; et al. Nanosheet-assembled NiO microspheres modified by Sn2+ ions isovalent interstitial doping for xylene gas sensors. Sens. Actuators B Chem. 2018, 269, 210–222. [Google Scholar] [CrossRef]
- Yang, X.H.; Fu, H.T.; Tian, Y.; Xie, Q.; Xiong, S.X.; Han, D.Z.; Zhang, H.; An, X.Z. Au decorated In2O3 hollow nanospheres: A novel sensing material toward amine. Sens. Actuators B Chem. 2019, 296, 126696. [Google Scholar] [CrossRef]
- Fu, H.T.; Yang, X.H.; Zhang, Z.K.; Wang, W.W.; An, X.Z.; Dong, Y.; Li, X. Preparation of plasmonic porous Au@AgVO3 belt-like nanocomposites with enhanced visible light photocatalytic activity. Nanotechnology 2018, 29, 295706. [Google Scholar] [CrossRef]
- Cheng, J.P.; Wang, B.B.; Zhao, M.G.; Liu, F.; Zhang, X.B. Nickel-doped tin oxide hollow nanofibers prepared by electrospinning for acetone sensing. Sens. Actuators B Chem. 2014, 190, 78–85. [Google Scholar] [CrossRef]
- George, G.; Anandhan, S. Synthesis and characterisation of nickel oxide nanofibre webs with alcohol sensing characteristics. RSC Adv. 2014, 4, 62009–62020. [Google Scholar] [CrossRef]
- Zhang, Q.P.; Chen, C.X.; Liu, Y.T.; Pan, H.; Du, H.F.; Su, Y.J.; Tai, H.L.; Xie, G.Z.; Xu, M.; Du, X.S. Improved response/recovery speeds of ZnO nanoparticle-based sensor toward NO2 gas under UV irradiation induced by surface oxygen vacancies. J. Mater. Sci.-Mater. El. 2019, 30, 11395–11403. [Google Scholar] [CrossRef]
- Chen, Q.; Wang, Y.H.; Wang, M.X.; Ma, S.Y.; Wang, P.Y.; Zhang, G.H.; Chen, W.J.; Jiao, H.Y.; Liu, L.W.; Xu, X.L. Enhanced acetone sensor based on Au functionalized In-doped ZnSnO3 nanofibers synthesized by electrospinning method. J. Colloid Interface Sci. 2019, 543, 285–299. [Google Scholar] [CrossRef] [PubMed]
- Anand, K.; Singh, O.; Singh, M.P.; Kaur, J.; Singh, R.C. Hydrogen sensor based on graphene/ZnO nanocomposite. Sens. Actuators B Chem. 2014, 195, 409–415. [Google Scholar] [CrossRef]
- Toan, N.V.; Chien, N.V.; Duy, N.V.; Hong, H.S.; Nguyen, H.; Hoa, N.D.; Hieu, N.V. Fabrication of highly sensitive and selective H2 gas sensor based on SnO2 thin film sensitized with microsized Pd islands. J. Hazard. Mater. 2016, 301, 433–442. [Google Scholar] [CrossRef] [PubMed]
- Mirzaei, A.; Sun, G.J.; Lee, J.K.; Lee, C.; Choi, S.; Kim, H.W. Hydrogen sensing properties and mechanism of NiO-Nb2O5 composite nanoparticle-based electrical gas sensors. Ceram. Int. 2017, 43, 5247–5254. [Google Scholar] [CrossRef]
- Park, S. Enhancement of hydrogen sensing response of ZnO nanowires for the decoration of WO3 nanoparticles. Mater. Lett. 2019, 234, 315–318. [Google Scholar] [CrossRef]
- Zhao, C.H.; Huang, B.Y.; Xie, E.Q.; Zhou, J.Y.; Zhang, Z.X. Improving gas-sensing properties of electrospun In2O3 nanotubes by Mg acceptor doping. Sens. Actuators B Chem. 2015, 207, 313–320. [Google Scholar] [CrossRef]
- Mirzaei, A.; Kang, S.Y.; Choi, S.W.; Kwon, Y.J.; Choi, M.S.; Bang, J.H.; Kim, S.S.; Kim, H.W. Fabrication and gas sensing properties of vertically aligned Si nanowires. Appl. Surf. Sci. 2018, 427, 215–226. [Google Scholar] [CrossRef]
- Lin, B.Z.; Jia, F.C.; Lv, B.J.; Qin, Z.L.; Liu, P.D.; Chen, Y.L. Facile synthesis and remarkable hydrogen sensing performance of Pt-loaded SnO2 hollow microspheres. Mater. Res. Bull. 2018, 106, 403–408. [Google Scholar]
- Wang, Z.J.; Li, Z.Y.; Sun, J.H.; Zhang, H.N.; Wang, W.; Zheng, W.; Wang, C. Improved hydrogen monitoring properties based on p-NiO/n-SnO2 heterojunction composite nanofibers. J. Phys. Chem. C. 2010, 114, 6100–6105. [Google Scholar] [CrossRef]
- Wei, C.; Bo, B.; Tao, F.B.; Lu, Y.C.; Peng, S.D.; Song, W.; Zhou, Q. Hydrothermal synthesis and structural characterization of NiO/SnO2 composites and hydrogen sensing properties. J. Spectrosc. 2015, 2015, 450485. [Google Scholar] [CrossRef]
- Soltabayev, B.; Yildirim, M.A.; Ates, A.; Acar, S. The effect of indium doping concentration on structural, morphological and gas sensing properties of IZO thin films deposited SILAR method. Mater. Sci. Semicon. Proc. 2019, 101, 28–36. [Google Scholar] [CrossRef]
- Lou, Z.; Wang, L.L.; Fei, T.; Zhang, T. Enhanced ethanol sensing properties of NiO-doped SnO2 polyhedra. New J. Chem. 2012, 36, 1003–1007. [Google Scholar] [CrossRef]
- Wei, Z.J.; Zhou, Q.; Wang, J.X.; Lu, Z.R.; Xu, L.N.; Zeng, W. Hydrothermal synthesis of SnO2 nanoneedle-anchored NiO microsphere and its gas sensing performances. Nanomaterials 2019, 9, 1015. [Google Scholar] [CrossRef]
- Kim, J.H.; Lee, J.H.; Kim, J.Y.; Mirzaei, A.; Kim, H.W.; Kim, S.S. Enhancement of CO and NO2 sensing in n-SnO2-p-Cu2O core-shell nanofibers by shell optimization. J. Hazard. Mater. 2019, 376, 68–82. [Google Scholar] [CrossRef]
- Qin, C.; Wang, Y.; Gong, Y.X.; Zhang, Z.Y.; Cao, J.L. CuO-ZnO hetero-junctions decorated graphitic carbon nitride hybrid nanocomposite: Hydrothermal synthesis and ethanol gas sensing application. J. Alloys Compd. 2019, 770, 972–980. [Google Scholar] [CrossRef]
- Zhou, Q.; Zeng, W.; Chen, W.G.; Xu, L.N.; Kumarc, R.; Umar, A. High sensitive and low-concentration sulfur dioxide (SO2) gas sensor application of heterostructure NiO-ZnO nanodisks. Sens. Actuators B Chem. 2019, 298, 126870. [Google Scholar] [CrossRef]
Figure 1.
Schematic diagram of electrospinning.
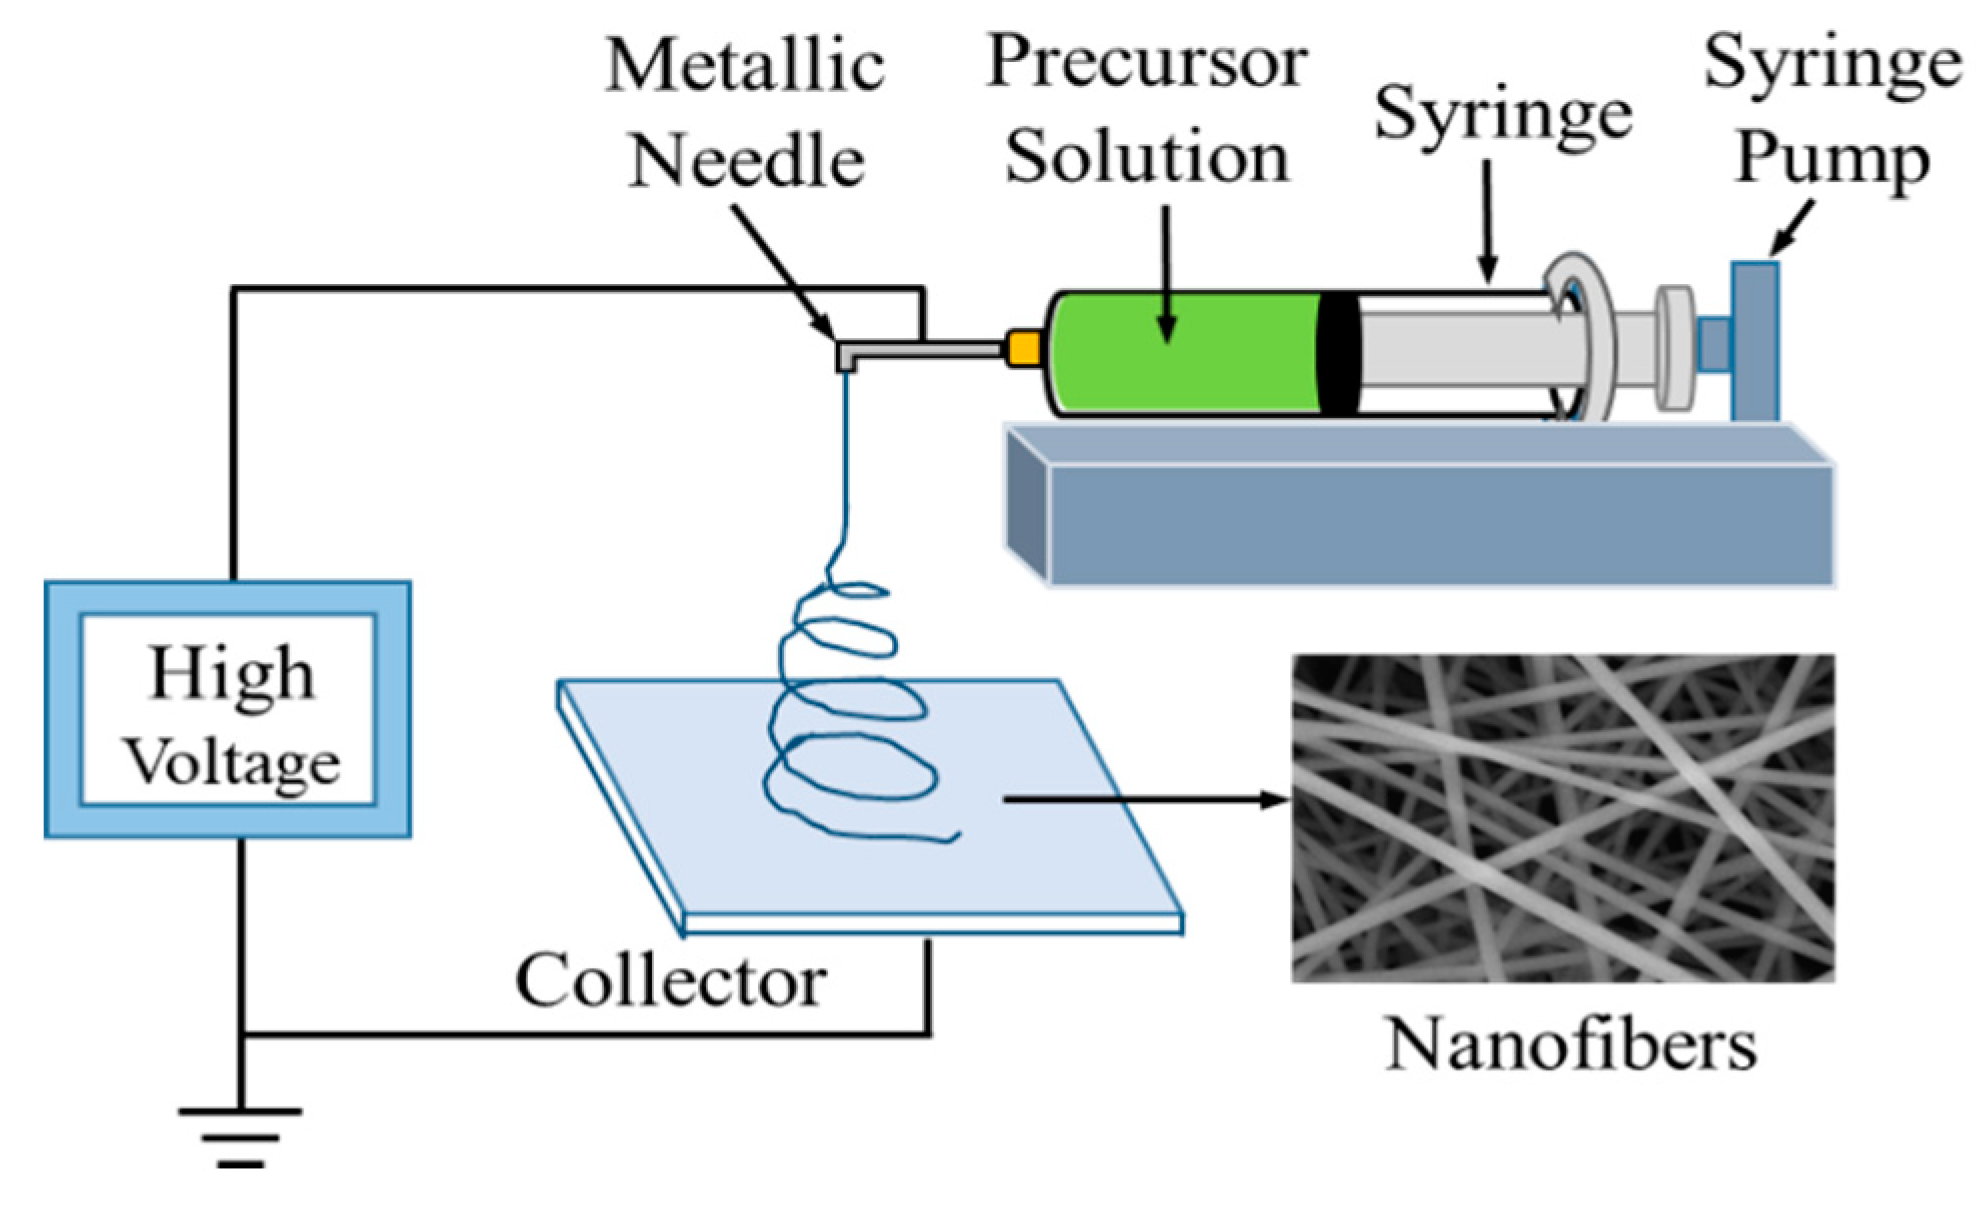
Figure 2.
X-ray diffraction (XRD) spectra of Sn/2, Sn/4 and NiSn/4 nanofibers.
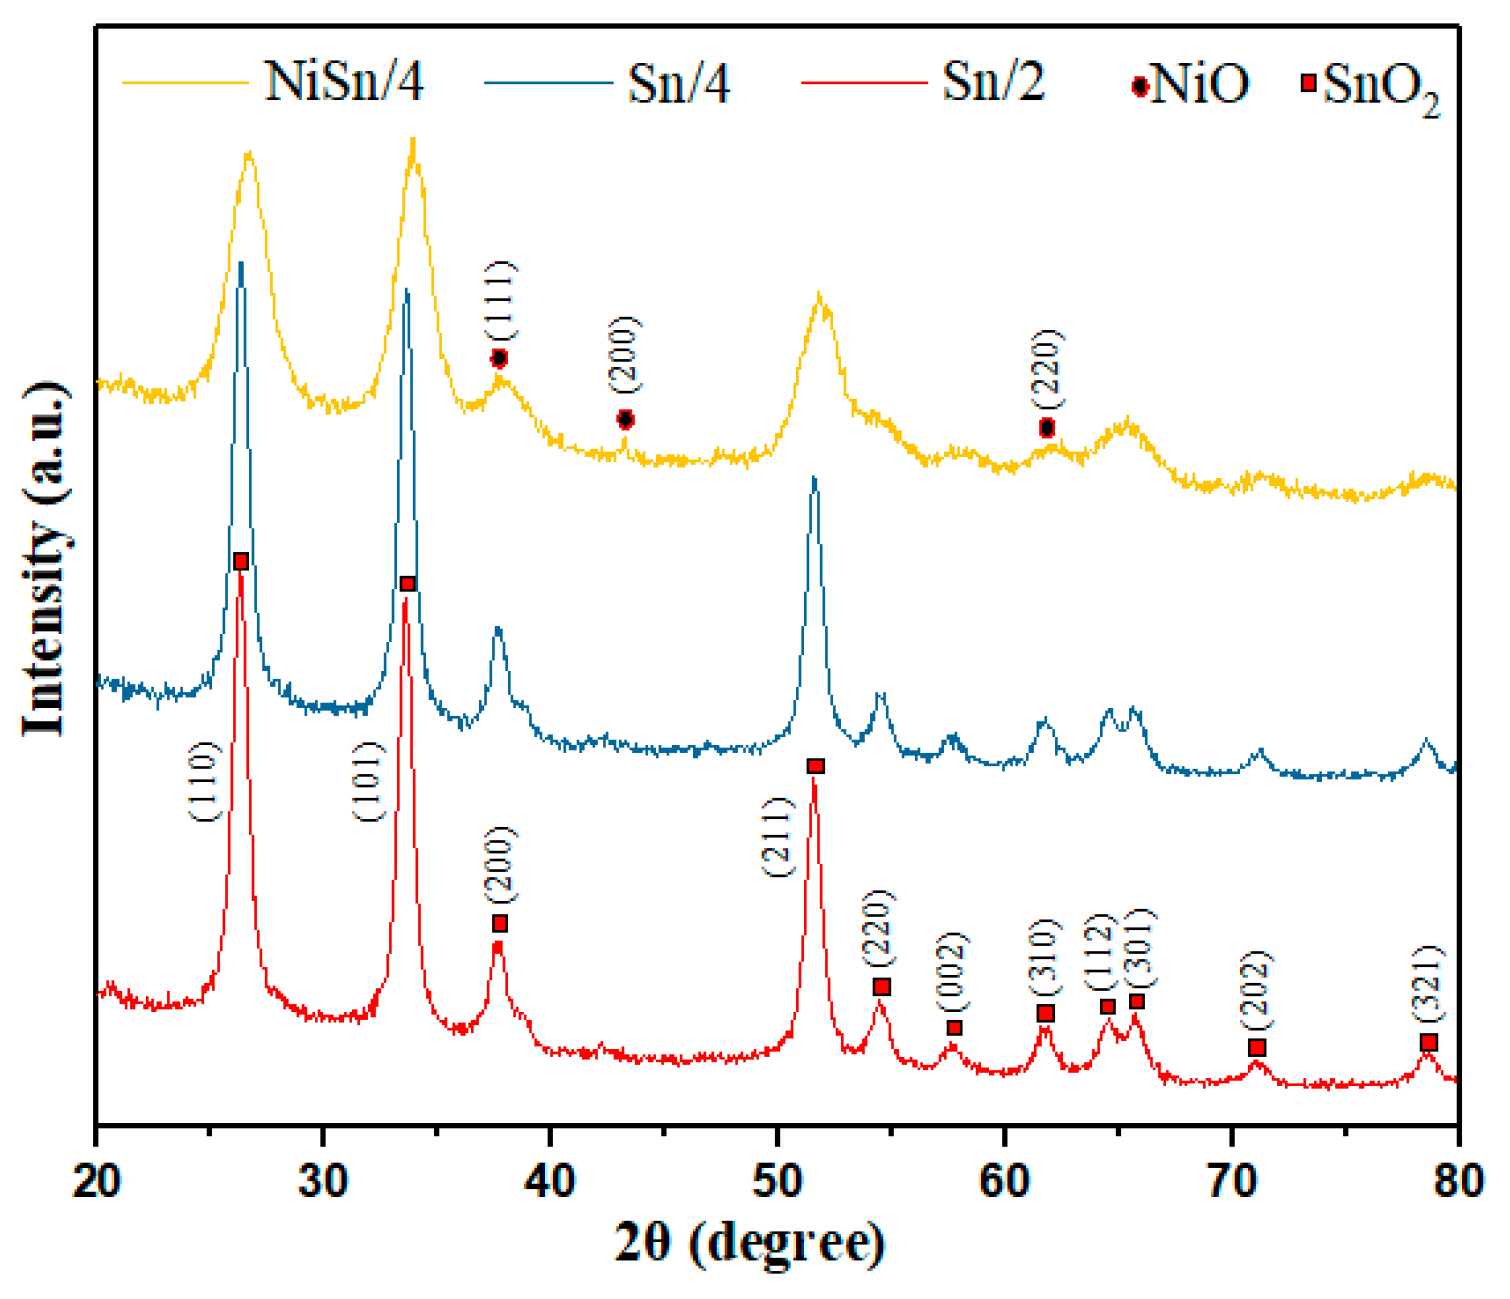
Figure 3.
Typical scanning electron microscopy (SEM) images of (a) Sn/0, (b) NiSn/0, (c) Sn/2, (e) Sn/4 and (g) NiSn/4 samples. (d,f,h) are the relative high-resolution images of (c,e,g), respectively.
Figure 3.
Typical scanning electron microscopy (SEM) images of (a) Sn/0, (b) NiSn/0, (c) Sn/2, (e) Sn/4 and (g) NiSn/4 samples. (d,f,h) are the relative high-resolution images of (c,e,g), respectively.
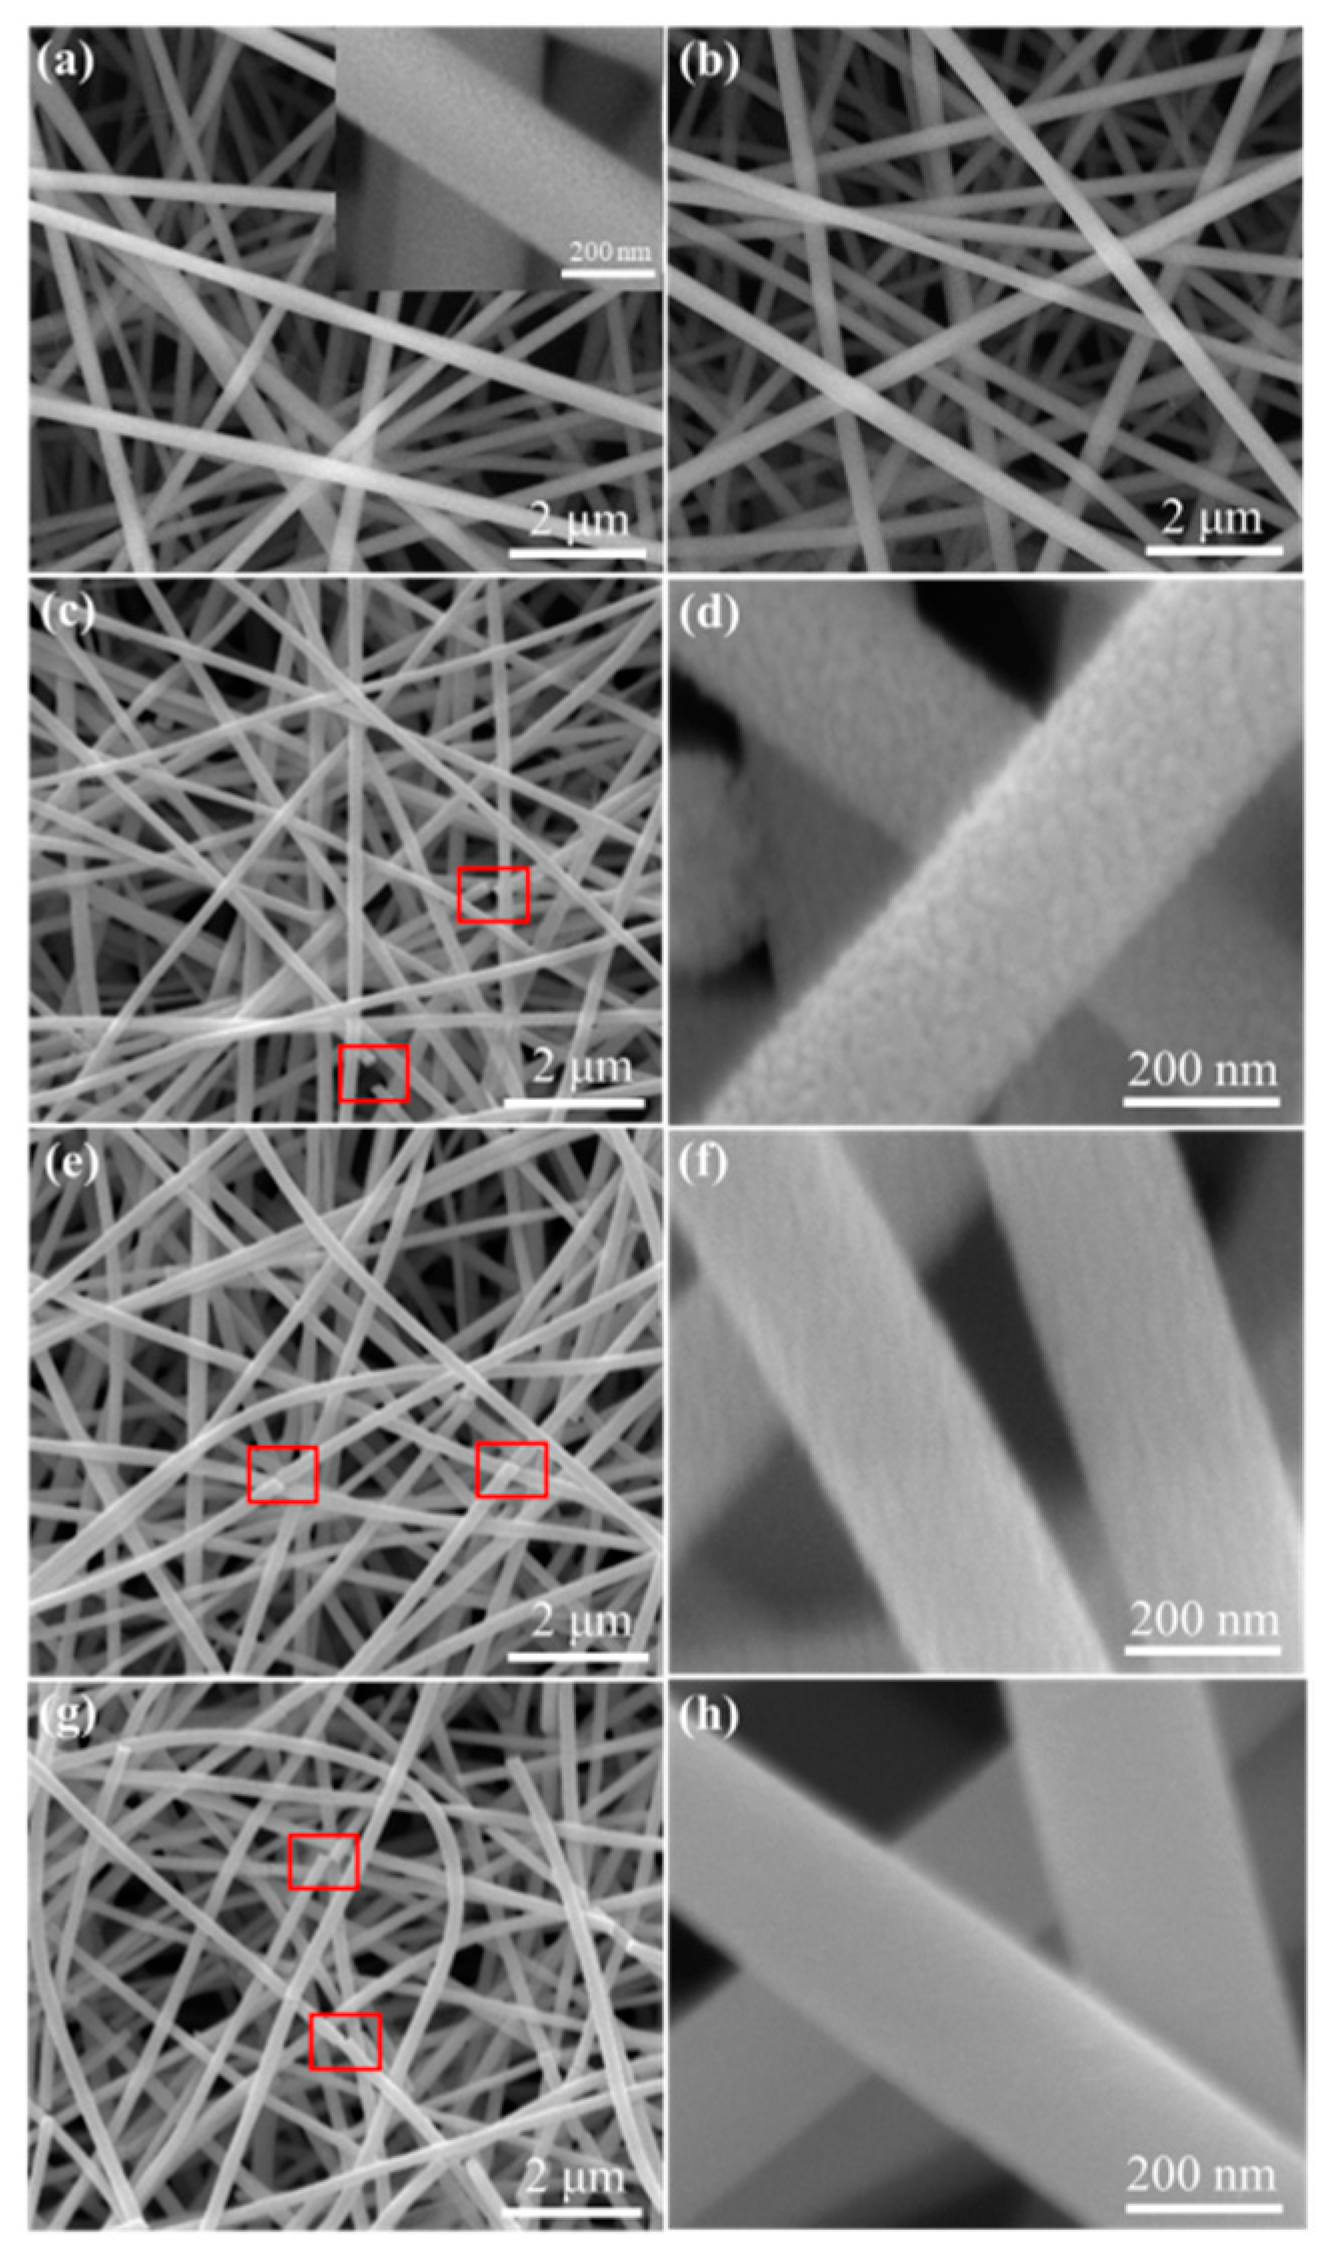
Figure 4.
(a,b) High resolution transmission electron microscopy (HRTEM) images of the NiSn/4; (c) high angle annular dark field (HAADF) image and element mapping of a single NiSn/4 nanofiber; (d) The energy dispersive X-ray spectroscopy (EDS) spectrum of NiSn/4 nanocomposite. (e) The N2 adsorption-desorption isotherm and pore size distribution curve (inset) of the NiSn/4 nanofibers.

Figure 5.
X-ray photoelectron spectroscopy (XPS) spectra of (a) total, (b) Sn, (c) Ni and (d) O for NiSn/4 sample.
Figure 5.
X-ray photoelectron spectroscopy (XPS) spectra of (a) total, (b) Sn, (c) Ni and (d) O for NiSn/4 sample.
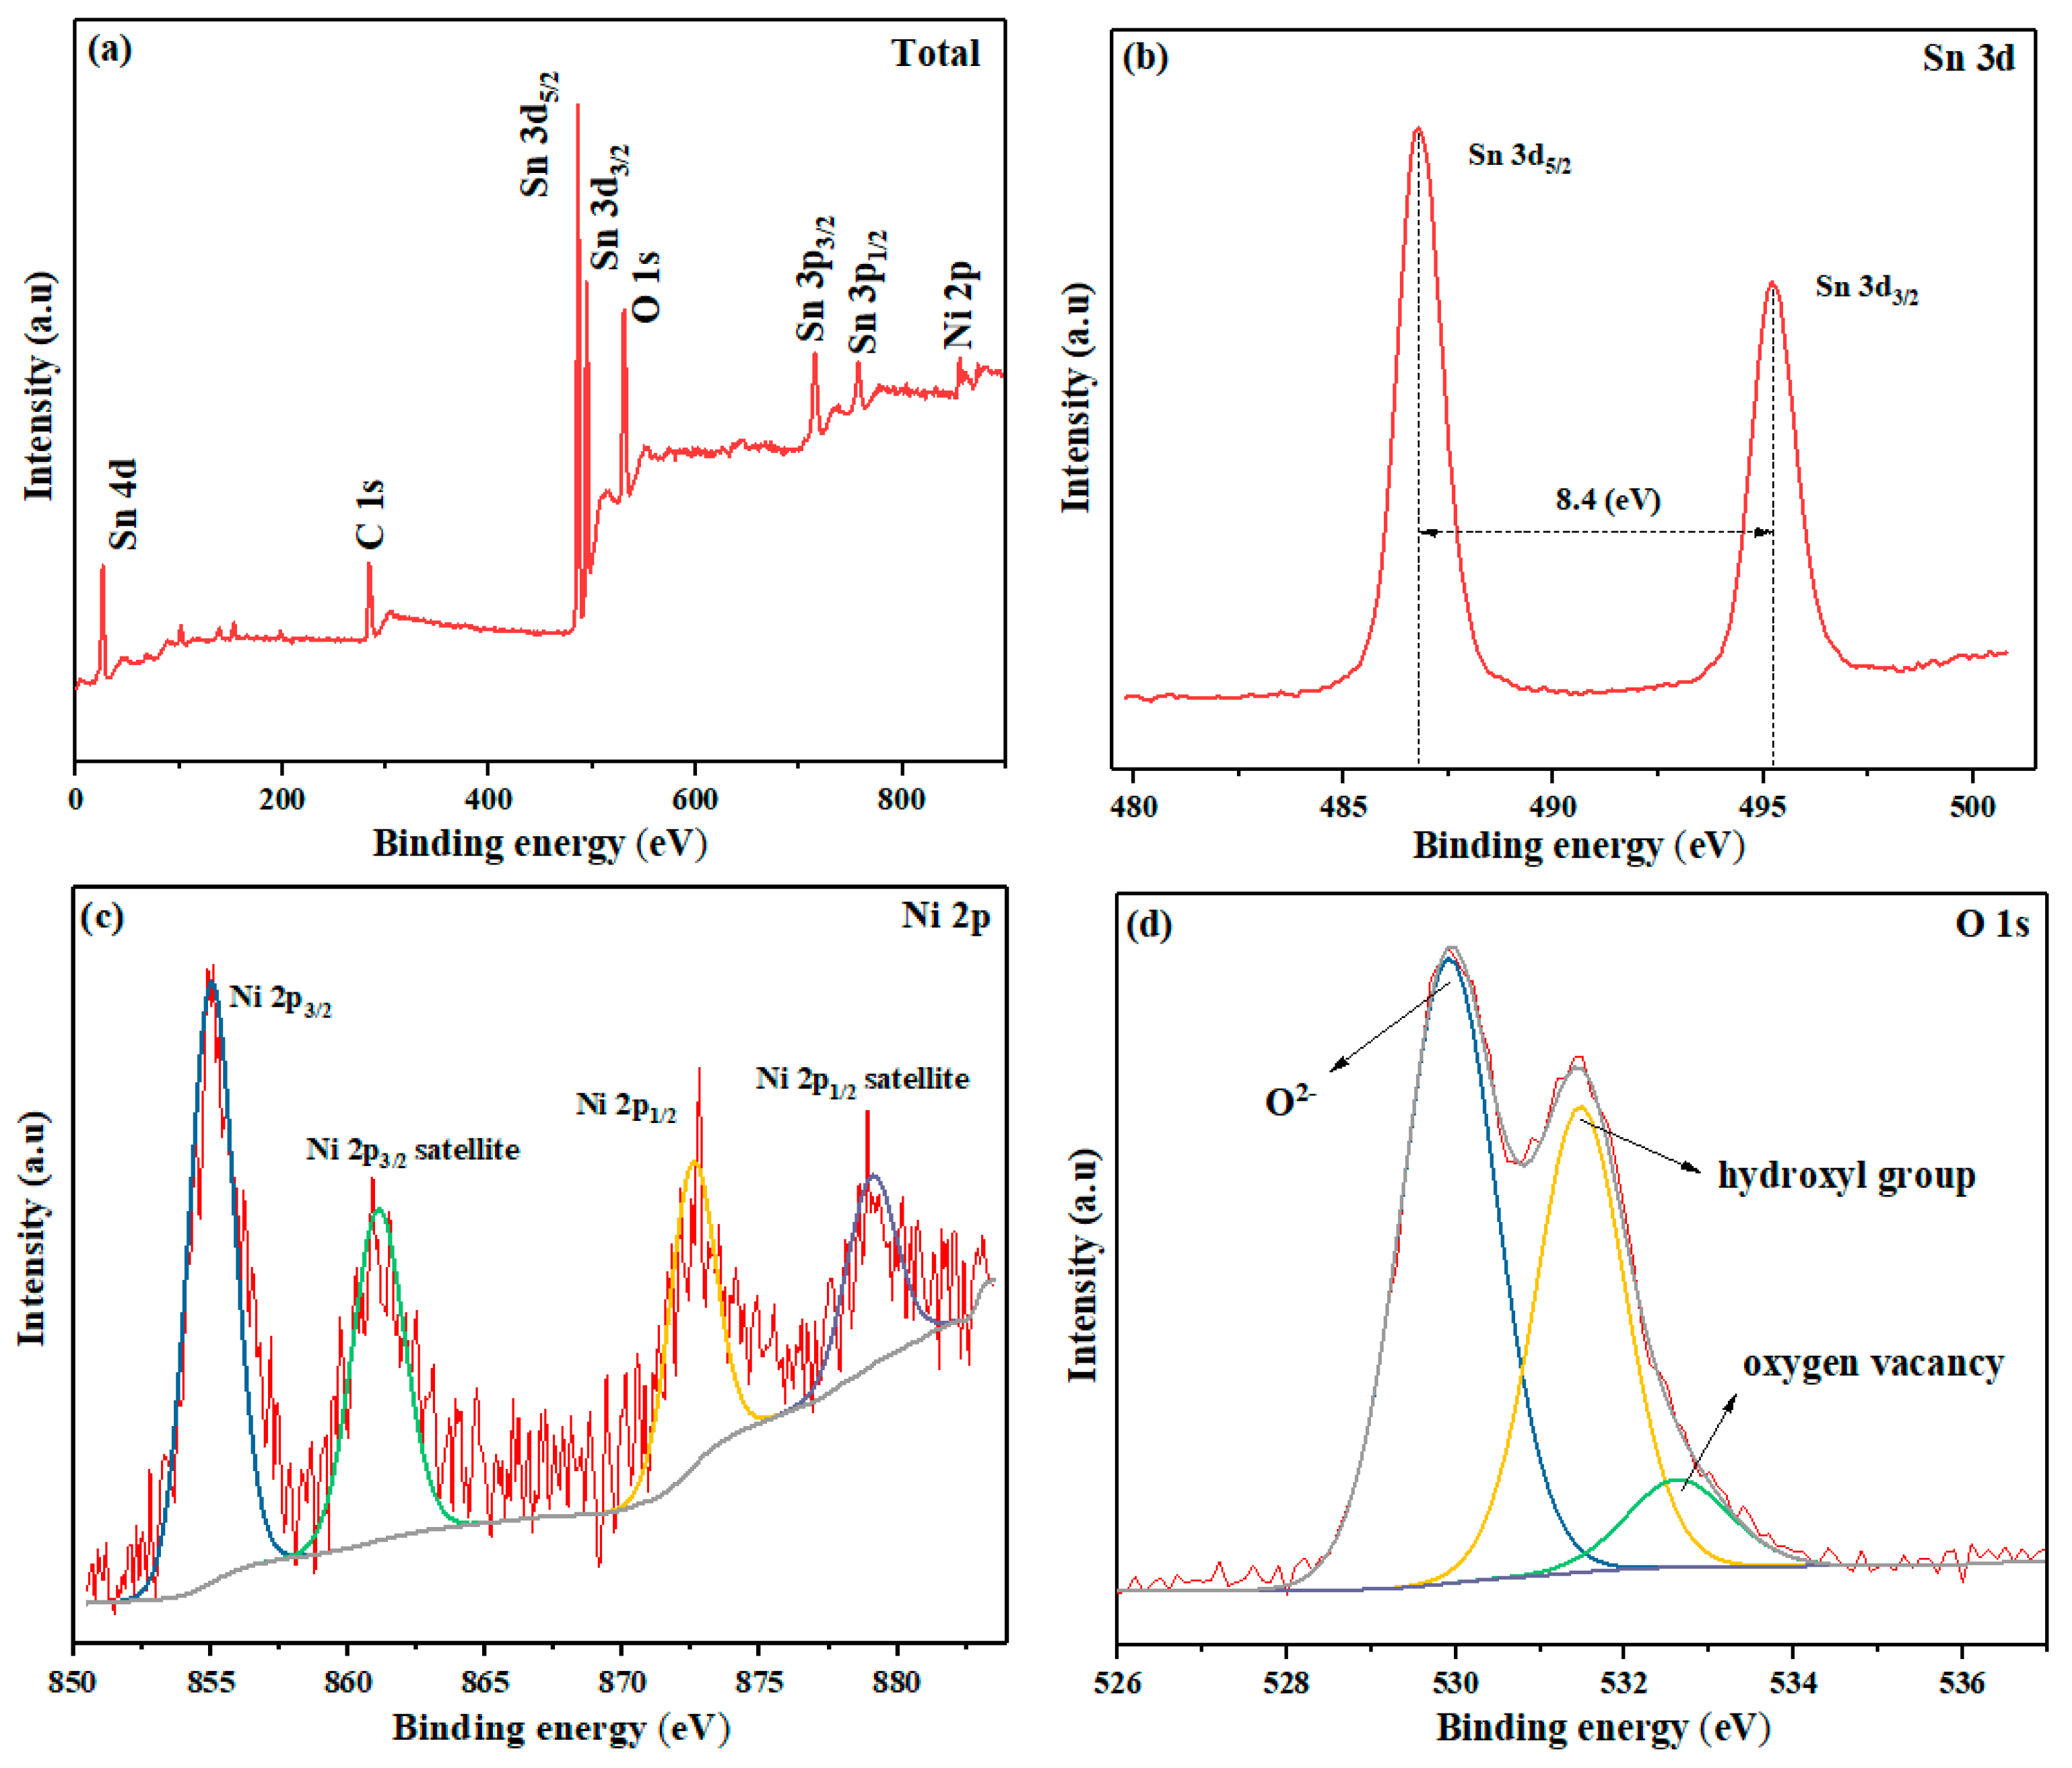
Figure 6.
Gas response of the Sn/0, Sn/2, Sn/4 and NiSn/4 sensor devices to 100 ppm H2 under different operation temperatures.
Figure 6.
Gas response of the Sn/0, Sn/2, Sn/4 and NiSn/4 sensor devices to 100 ppm H2 under different operation temperatures.

Figure 7.
(a) Gas response of Sn/2, Sn/4 and NiSn/4 sensors to H2 with various concentrations at their optimal operation temperatures, respectively; (b) the linear fitting curves of the sensor devices at low H2 concentrations (1–25 ppm).
Figure 7.
(a) Gas response of Sn/2, Sn/4 and NiSn/4 sensors to H2 with various concentrations at their optimal operation temperatures, respectively; (b) the linear fitting curves of the sensor devices at low H2 concentrations (1–25 ppm).
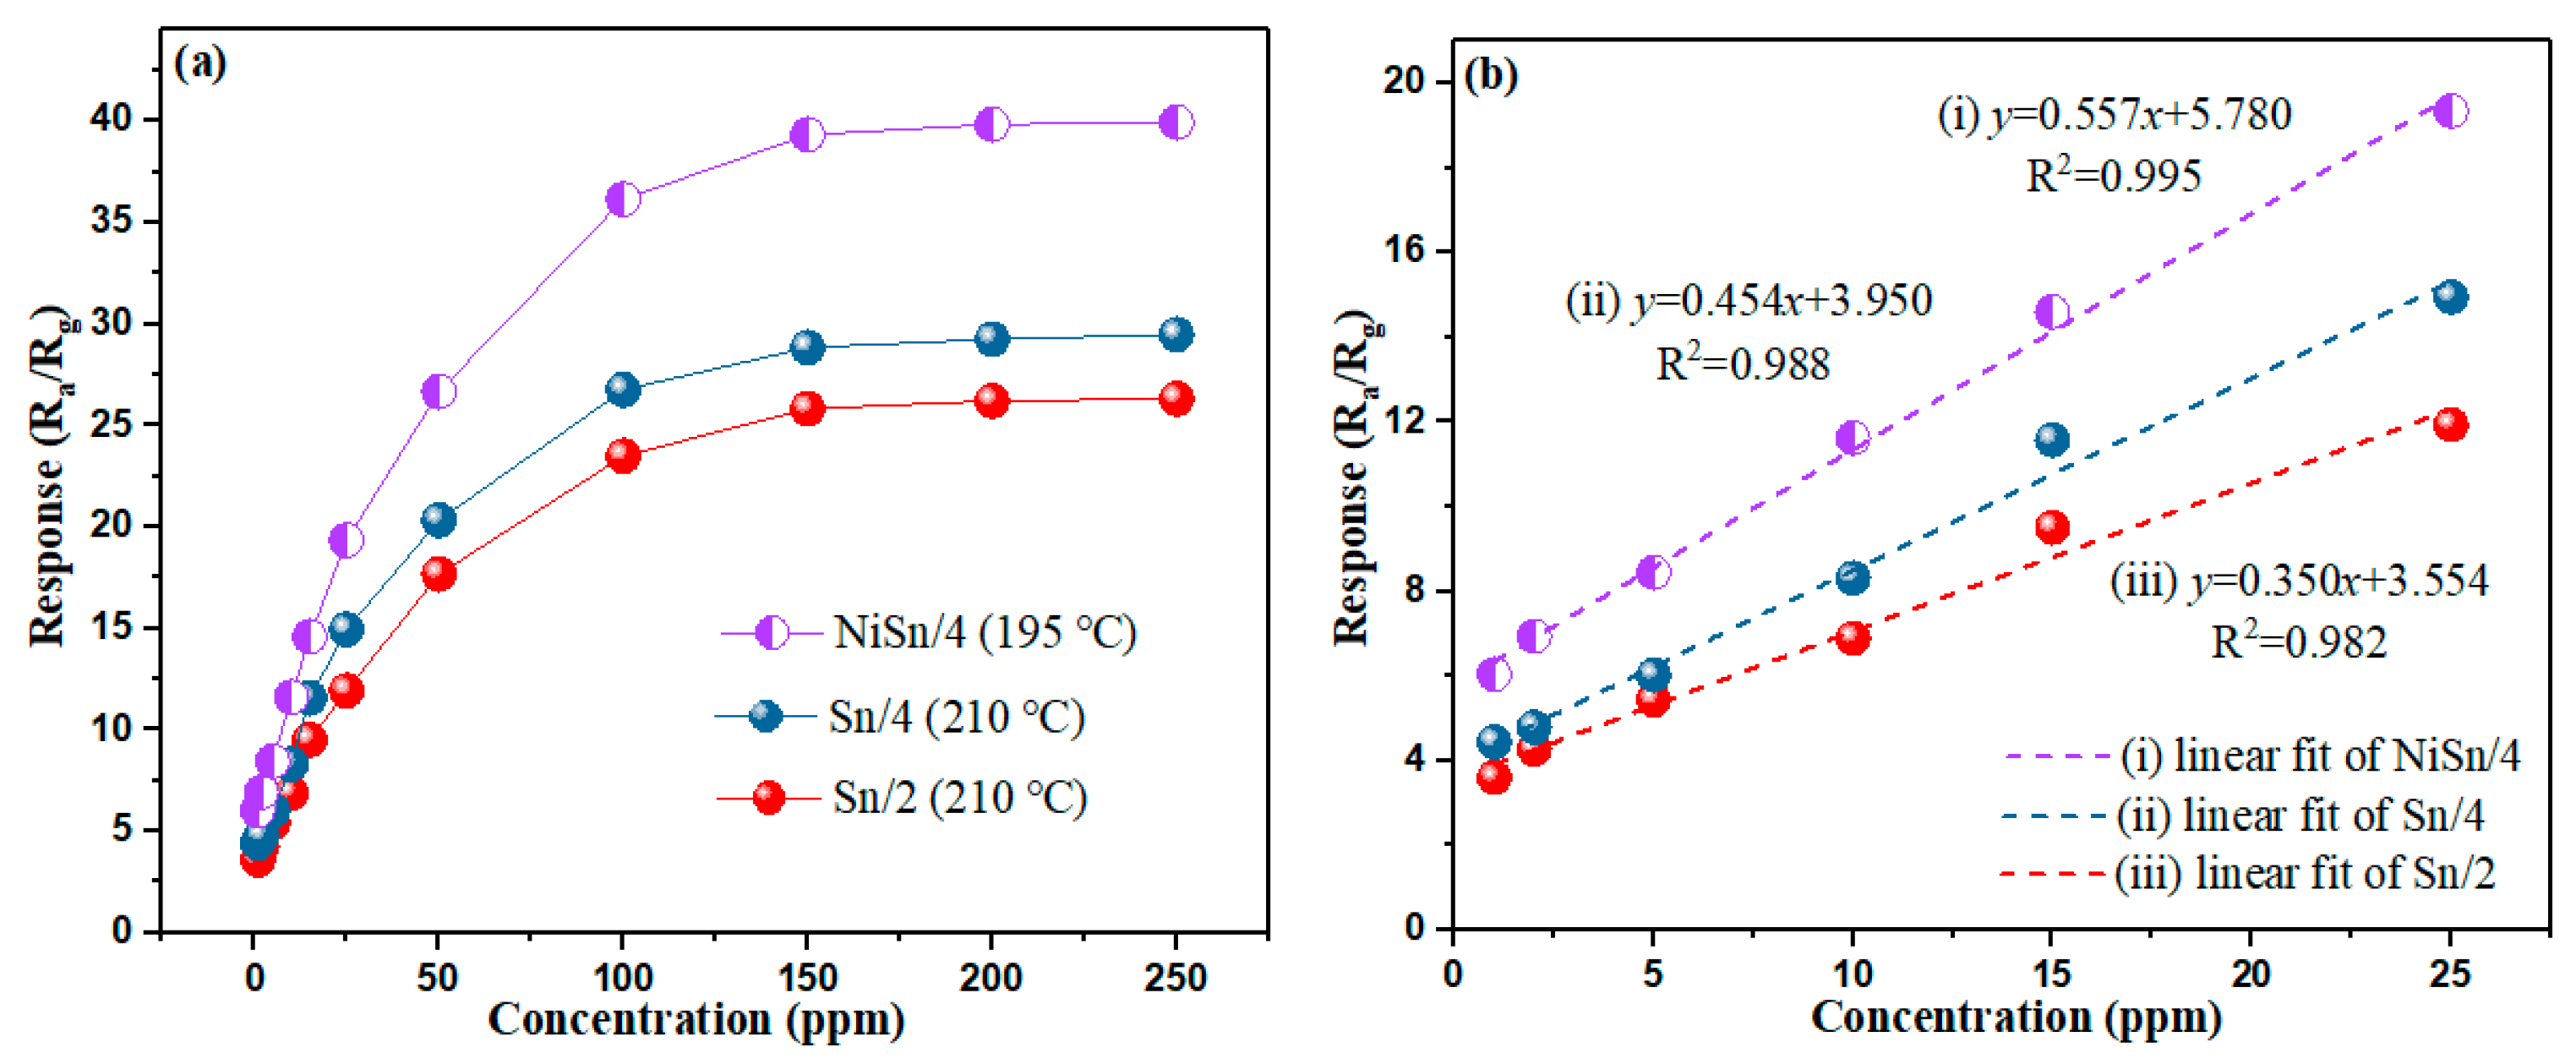
Figure 8.
Response and recovery curves to 25 ppm H2 of (a) Sn/2, (b) Sn/4 and (c) NiSn/4 sensors, and (d) the corresponding response and recovery times.
Figure 8.
Response and recovery curves to 25 ppm H2 of (a) Sn/2, (b) Sn/4 and (c) NiSn/4 sensors, and (d) the corresponding response and recovery times.
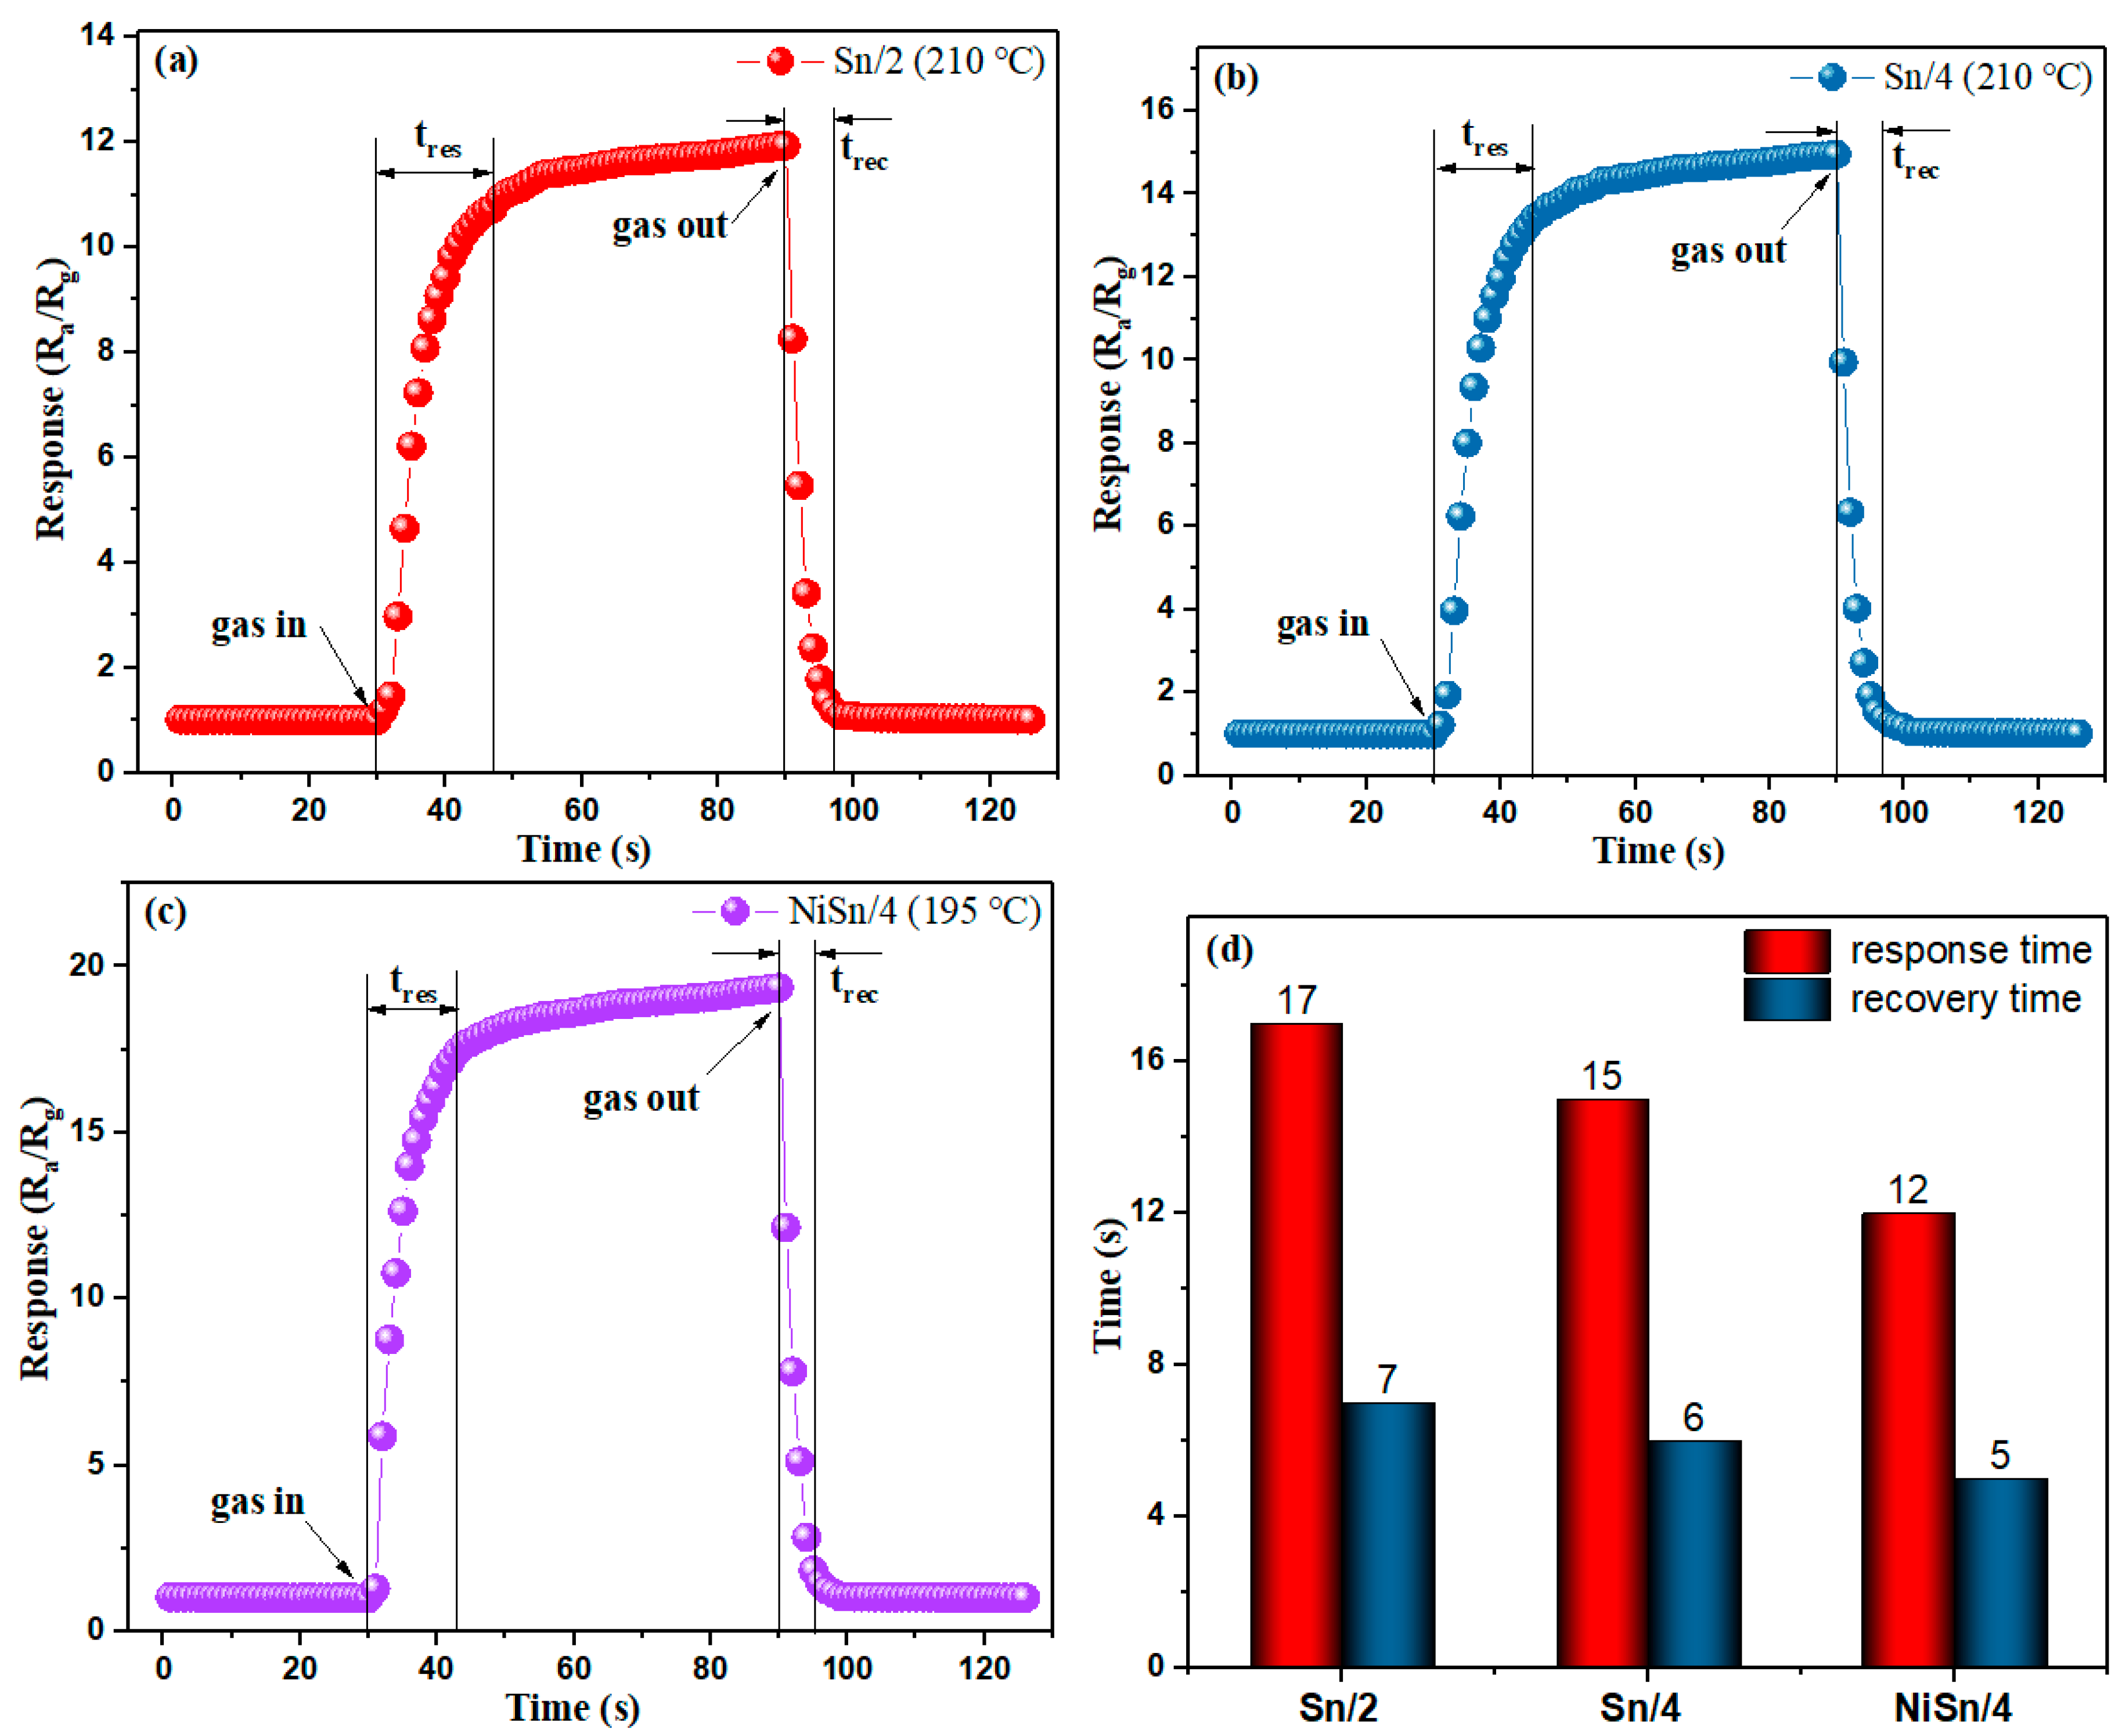
Figure 9.
(a) The electric resistance properties of NiSn/4 sensor to 50 ppm H2 at 195 °C and (b) the corresponding dynamic gas-sensing curve. (c) The long stability of NiSn/4 sensor to 50 ppm H2 at 195 °C.
Figure 9.
(a) The electric resistance properties of NiSn/4 sensor to 50 ppm H2 at 195 °C and (b) the corresponding dynamic gas-sensing curve. (c) The long stability of NiSn/4 sensor to 50 ppm H2 at 195 °C.
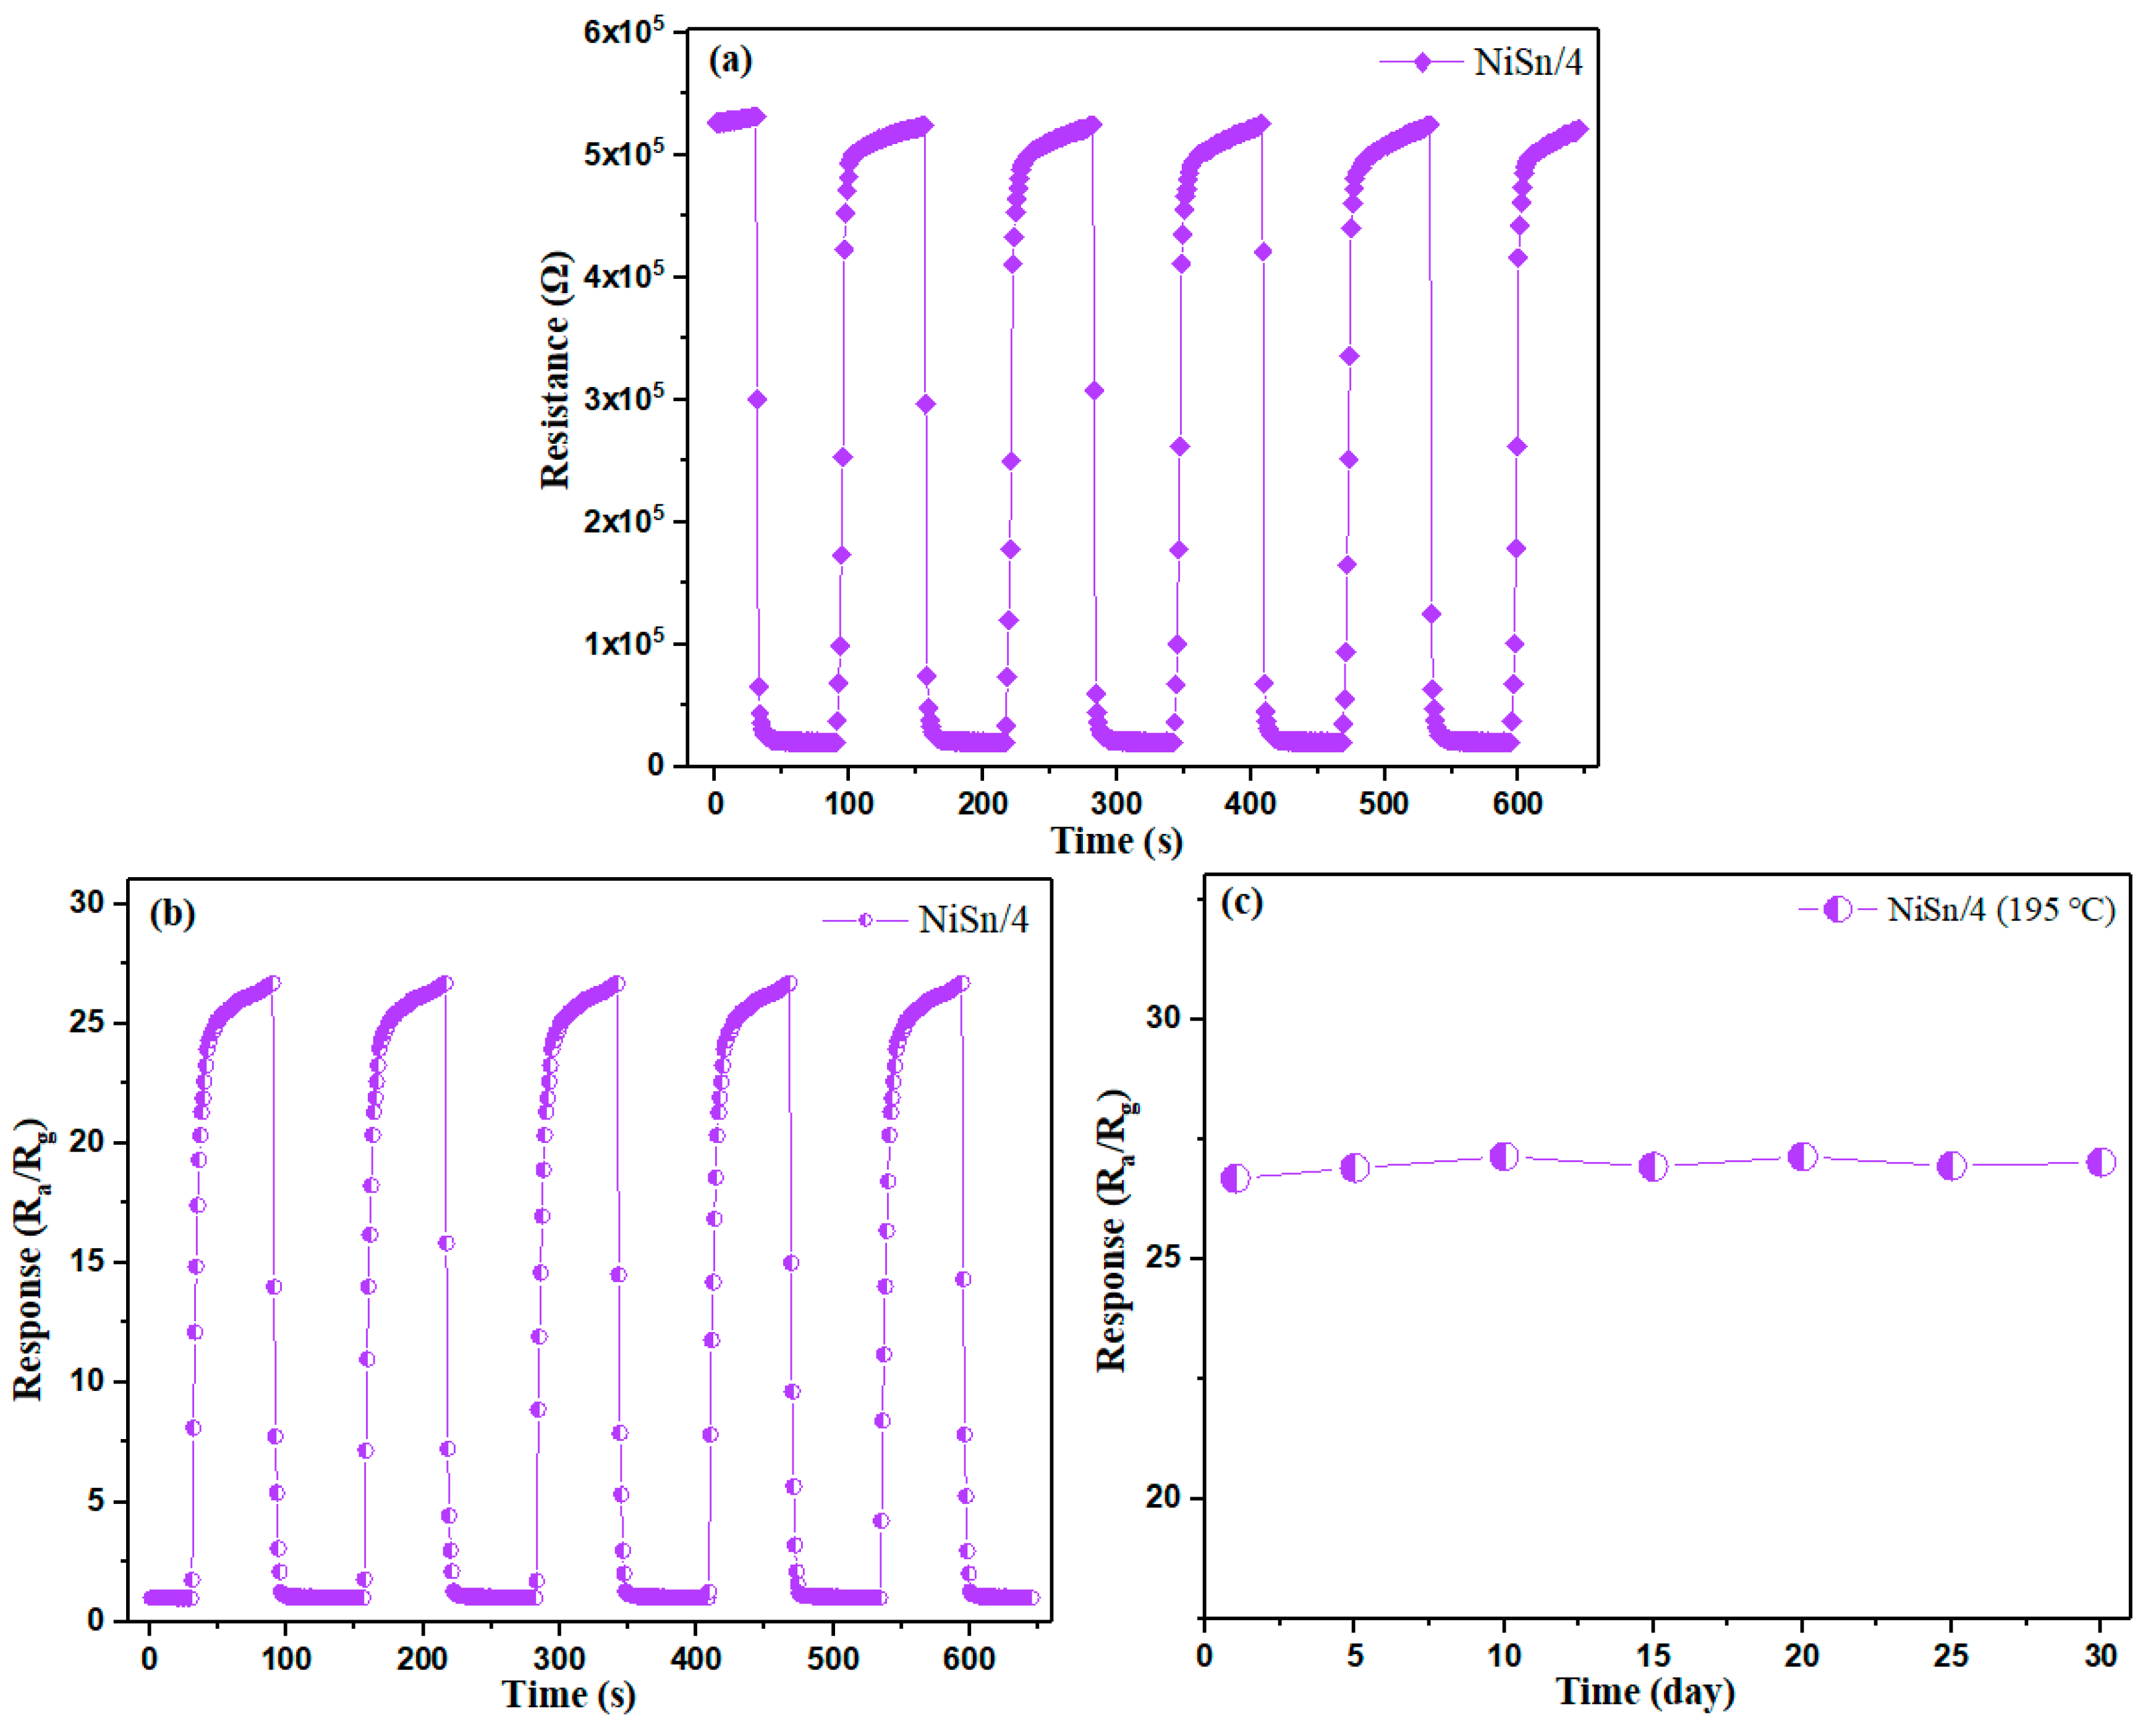
Figure 10.
Schematic diagrams of (a) the energy band for p-n heterojunctions of NiO/SnO2 and (b) the proposed H2 sensing mechanism for the NiO/SnO2 nanocomposite.
Figure 10.
Schematic diagrams of (a) the energy band for p-n heterojunctions of NiO/SnO2 and (b) the proposed H2 sensing mechanism for the NiO/SnO2 nanocomposite.

Table 1.
Comparison of the H2 sensing properties with different sensors.
| Materials | H2 (ppm) | Optimal Temperature (°C) | Response (Ra/Rg) | Year | Reference |
|---|---|---|---|---|---|
| rGO/ZnO composite | 200 | 150 | 3.5 | 2014 | [46] |
| Pd/SnO2 thin film | 250 | 300 | 28.0 | 2016 | [47] |
| Nb2O5-NiO nanocomposite | 500 | R.T. | 1.68 | 2017 | [48] |
| WO3-ZnO nanowire | 2000 | 200 | 12.6 | 2019 | [49] |
| Mg-In2O3 nanotubes | 100 | 150 | 1.55 | 2015 | [50] |
| Si nanowires | 50 | 100 | 17.1 | 2018 | [51] |
| Pt-SnO2 hollow microspheres | 200 | 50 | 21.0 | 2018 | [52] |
| NiO/SnO2 nanocomposite | 100 | 320 | 13.6 | 2010 | [53] |
| NiO/SnO2 nanospheres | 50 | 325 | 27.84 | 2015 | [54] |
| NiO/SnO2 nanofibers | 100 | 195 | 37.15 | This work |
© 2019 by the authors. Licensee MDPI, Basel, Switzerland. This article is an open access article distributed under the terms and conditions of the Creative Commons Attribution (CC BY) license (http://creativecommons.org/licenses/by/4.0/).
Share and Cite
MDPI and ACS Style
Liu, H.; Wang, F.; Hu, K.; Zhang, B.; He, L.; Zhou, Q. Superior Hydrogen Sensing Property of Porous NiO/SnO2 Nanofibers Synthesized via Carbonization. Nanomaterials 2019, 9, 1250. https://doi.org/10.3390/nano9091250
AMA Style
Liu H, Wang F, Hu K, Zhang B, He L, Zhou Q. Superior Hydrogen Sensing Property of Porous NiO/SnO2 Nanofibers Synthesized via Carbonization. Nanomaterials. 2019; 9(9):1250. https://doi.org/10.3390/nano9091250
Chicago/Turabian StyleLiu, Hongcheng, Feipeng Wang, Kelin Hu, Bin Zhang, Li He, and Qu Zhou. 2019. "Superior Hydrogen Sensing Property of Porous NiO/SnO2 Nanofibers Synthesized via Carbonization" Nanomaterials 9, no. 9: 1250. https://doi.org/10.3390/nano9091250
Note that from the first issue of 2016, this journal uses article numbers instead of page numbers. See further details here.