Proteomic and Metabolomic Analyses of a Tea-Tree Oil-Selected Staphylococcus aureus Small Colony Variant


Department of Biochemistry and Molecular Biology, Oklahoma State University, Stillwater, OK 74078, USA
*
Author to whom correspondence should be addressed.
Antibiotics 2019, 8(4), 248; https://doi.org/10.3390/antibiotics8040248
Submission received: 4 November 2019
/
Revised: 25 November 2019
/
Accepted: 27 November 2019
/
Published: 3 December 2019
(This article belongs to the Special Issue Staphylococci Antimicrobial Resistance)
Abstract
:Tea tree oil (TTO) is hypothesized to kill bacteria by indiscriminately denaturing membrane and protein structures. A Staphylococcus aureus small colony variant (SCV) selected with TTO (SH1000-TTORS-1) demonstrated slowed growth, reduced susceptibility to TTO, a diminutive cell size, and a thinned cell wall. Utilizing a proteomics and metabolomics approach, we have now revealed that the TTO-selected SCV mutant demonstrated defective fatty acid synthesis, an alteration in the expression of genes and metabolites associated with central metabolism, the induction of a general stress response, and a reduction of proteins critical for active growth and translation. SH1000-TTORS-1 also demonstrated an increase in amino acid accumulation and a decrease in sugar content. The reduction in glycolytic pathway proteins and sugar levels indicated that carbon flow through glycolysis and gluconeogenesis is reduced in SH1000-TTORS-1. The increase in amino acid accumulation coincides with the reduced production of translation-specific proteins and the induction of proteins associated with the stringent response. The decrease in sugar content likely deactivates catabolite repression and the increased amino acid pool observed in SH1000-TTORS-1 represents a potential energy and carbon source which could maintain carbon flow though the tricarboxylic acid (TCA) cycle. It is noteworthy that processes that contribute to the production of the TTO targets (proteins and membrane) are reduced in SH1000-TTORS-1. This is one of a few studies describing a mechanism that bacteria utilize to withstand the action of an antiseptic which is thought to inactivate multiple cellular targets.
1. Introduction
Staphylococcus aureus is a leading cause of hospital-acquired infections that demonstrates a propensity for acquiring resistance to antimicrobials [1]. One mechanism that enhances the ability of S. aureus to cause infections and tolerate antimicrobial challenge is the ability to produce small colony variants (SCVs) [2]. S. aureus SCVs are typically characterized by slow growth, reduced electron transport chain activity, decreased virulence factor production, reduced susceptibility to antimicrobials, and altered metabolism [3,4]. A number of transcriptional profiling and proteomic analysis studies have revealed that S. aureus SCVs display an altered expression of genes and proteins involved with both glycolysis and the tricarboxylic acid (TCA) cycle [5,6,7,8,9].
The SCV phenotype can result from mutations in a number of genes. Pioneering studies revealed that SCVs result from mutations in genes required for the biosynthesis of the electron transport chain components hemin and menadione (e.g., hemB, hemH, menD, ctaA) [10,11,12,13] or thymidine (e.g., thyA) [14]. Besides these mutations, other mutations in genes encoding a cold shock protein (cspB) [15], the stringent response (p)ppGpp synthetase RelA (rsh) [16], and an ATP-dependent helicase (cshA) [17], also supported SCV formation. Furthermore, the deletion of the gene encoding succinate dehydrogenase (sdh) also resulted in a SCV phenotype [18].
SCVs can also be selected with a variety of antimicrobials in the laboratory. Kanamycin-selected SCVs harbored a mutation in a chorismate biosynthetic gene (aroD) [19], fusidic acid-selected SCVs carried mutations in a gene that encodes ribosomal protein L6 (rplF) [20], and mutations in menadione biosynthetic genes (menB and menH) appear to be responsible for a H2O2-selected SCV phenotype [21].
Recently, SCVs were shown to evolve faster growth rates while maintaining aminoglycoside resistance, which suggests that infections with these organisms may pose an additional threat by maintaining antimicrobial resistance after the SCV phenotype is lost [22].
Tea tree oil (TTO) is a popular over-the-counter antiseptic produced from the steam distillation of the leaves and stems of tea trees, and demonstrates broad-spectrum in vitro antimicrobial activity [23,24]. TTO kills bacteria by inactivating multiple cellular targets via the denaturation of membrane and protein structures [25,26,27,28]. Challenge of S. aureus with TTO led to a near universal downregulation of genes encoding products required for transcription and translation, and the upregulation of genes required to maintain existing protein functions [29]. This study provided evidence to suggest that in order to survive, S. aureus shuts down energy-intensive metabolic pathways which become compromised during TTO challenge and attempts to maintain the function of pre-existing proteins. TTO can also select for S. aureus SCVs that display reduced susceptibility to TTO in addition to ethanol, isopropanol, and individual TTO antimicrobial terpenes. Compared to the parent strain, a TTO-selected SCV was also characterized by a small cell size and a thinned cell wall [30]. Genomic analysis of the TTO-selected SCV revealed the presence of two intragenic and 19 intergenic mutations [30]. One of the intragenic mutations was located in acpP [30], which encodes the essential acyl carrier protein (ACP) required for fatty acid biosynthesis [31]. To our knowledge, this is the first report of an antimicrobial-selected acpP mutation, and possibly the only reported example of an acpP mutation in S. aureus.
Bacteria contain the fatty acid type II synthase (FASII) system in which each reaction is catalyzed by a specific enzyme with reaction intermediates carried as thioesters of ACP [32]. ACP is a critical component of FASII which is modified on a conserved serine residue (S36) by the addition of a 4′-phosphopantetheine on which fatty acid chain elongation occurs [33,34]. The initiation and elongation steps of FASII fatty acid biosynthesis consists of multiple enzymatic reactions carried out by the “Fab” proteins. The acyltransferase module of bacterial lipid biosynthesis allows for the transfer of fatty acids to glycerol-3-phosphate. To carry out these reactions S. aureus utilizes the PlsX/Y/C system [35]. In Gram-positive bacteria, fatty acid and phospholipid biosynthesis are regulated by the transcriptional repressor FapR which is located within the fapR operon that contains the following order of genes: fapR, plsX, fabD, fabG, and acpP [36,37].
In this present study, we compared the proteome and metabolome of a TTO-selected SCV and its parent strain. The alterations observed provide insight into the altered physiology exhibited by a TTO-selected SCV that supports reduced susceptibility to a substance that inactivates multiple cellular targets.
This study was presented in part at the American Society for Biochemistry and Molecular Biology Meeting 2017 (22–26 April 2017, Chicago, IL, USA).
2. Results
2.1. General Proteomics Comparison
A total of 488 proteins were identified in both SH1000 and SH1000-TTORS-1 (Table S1). In comparison to parent strain SH1000, 39 proteins were increased and 73 proteins were decreased in the SH1000-TTORS-1 proteome (Table 1). In addition, nine proteins were only detected in SH1000-TTORS-1 and three proteins were only detected in SH1000 (Table 1). Uncharacterized proteins made up a large percentage of the proteins (47/112 or 42%) altered in SH1000-TTORS-1 (Table 1). Of these, 21 were increased and 26 were decreased in relative concentrations in SH1000-TTORS-1 compared to SH1000 (Table 1).
2.2. Alterations in Fatty Acid Biosynthesis in SH1000-TTORS-1
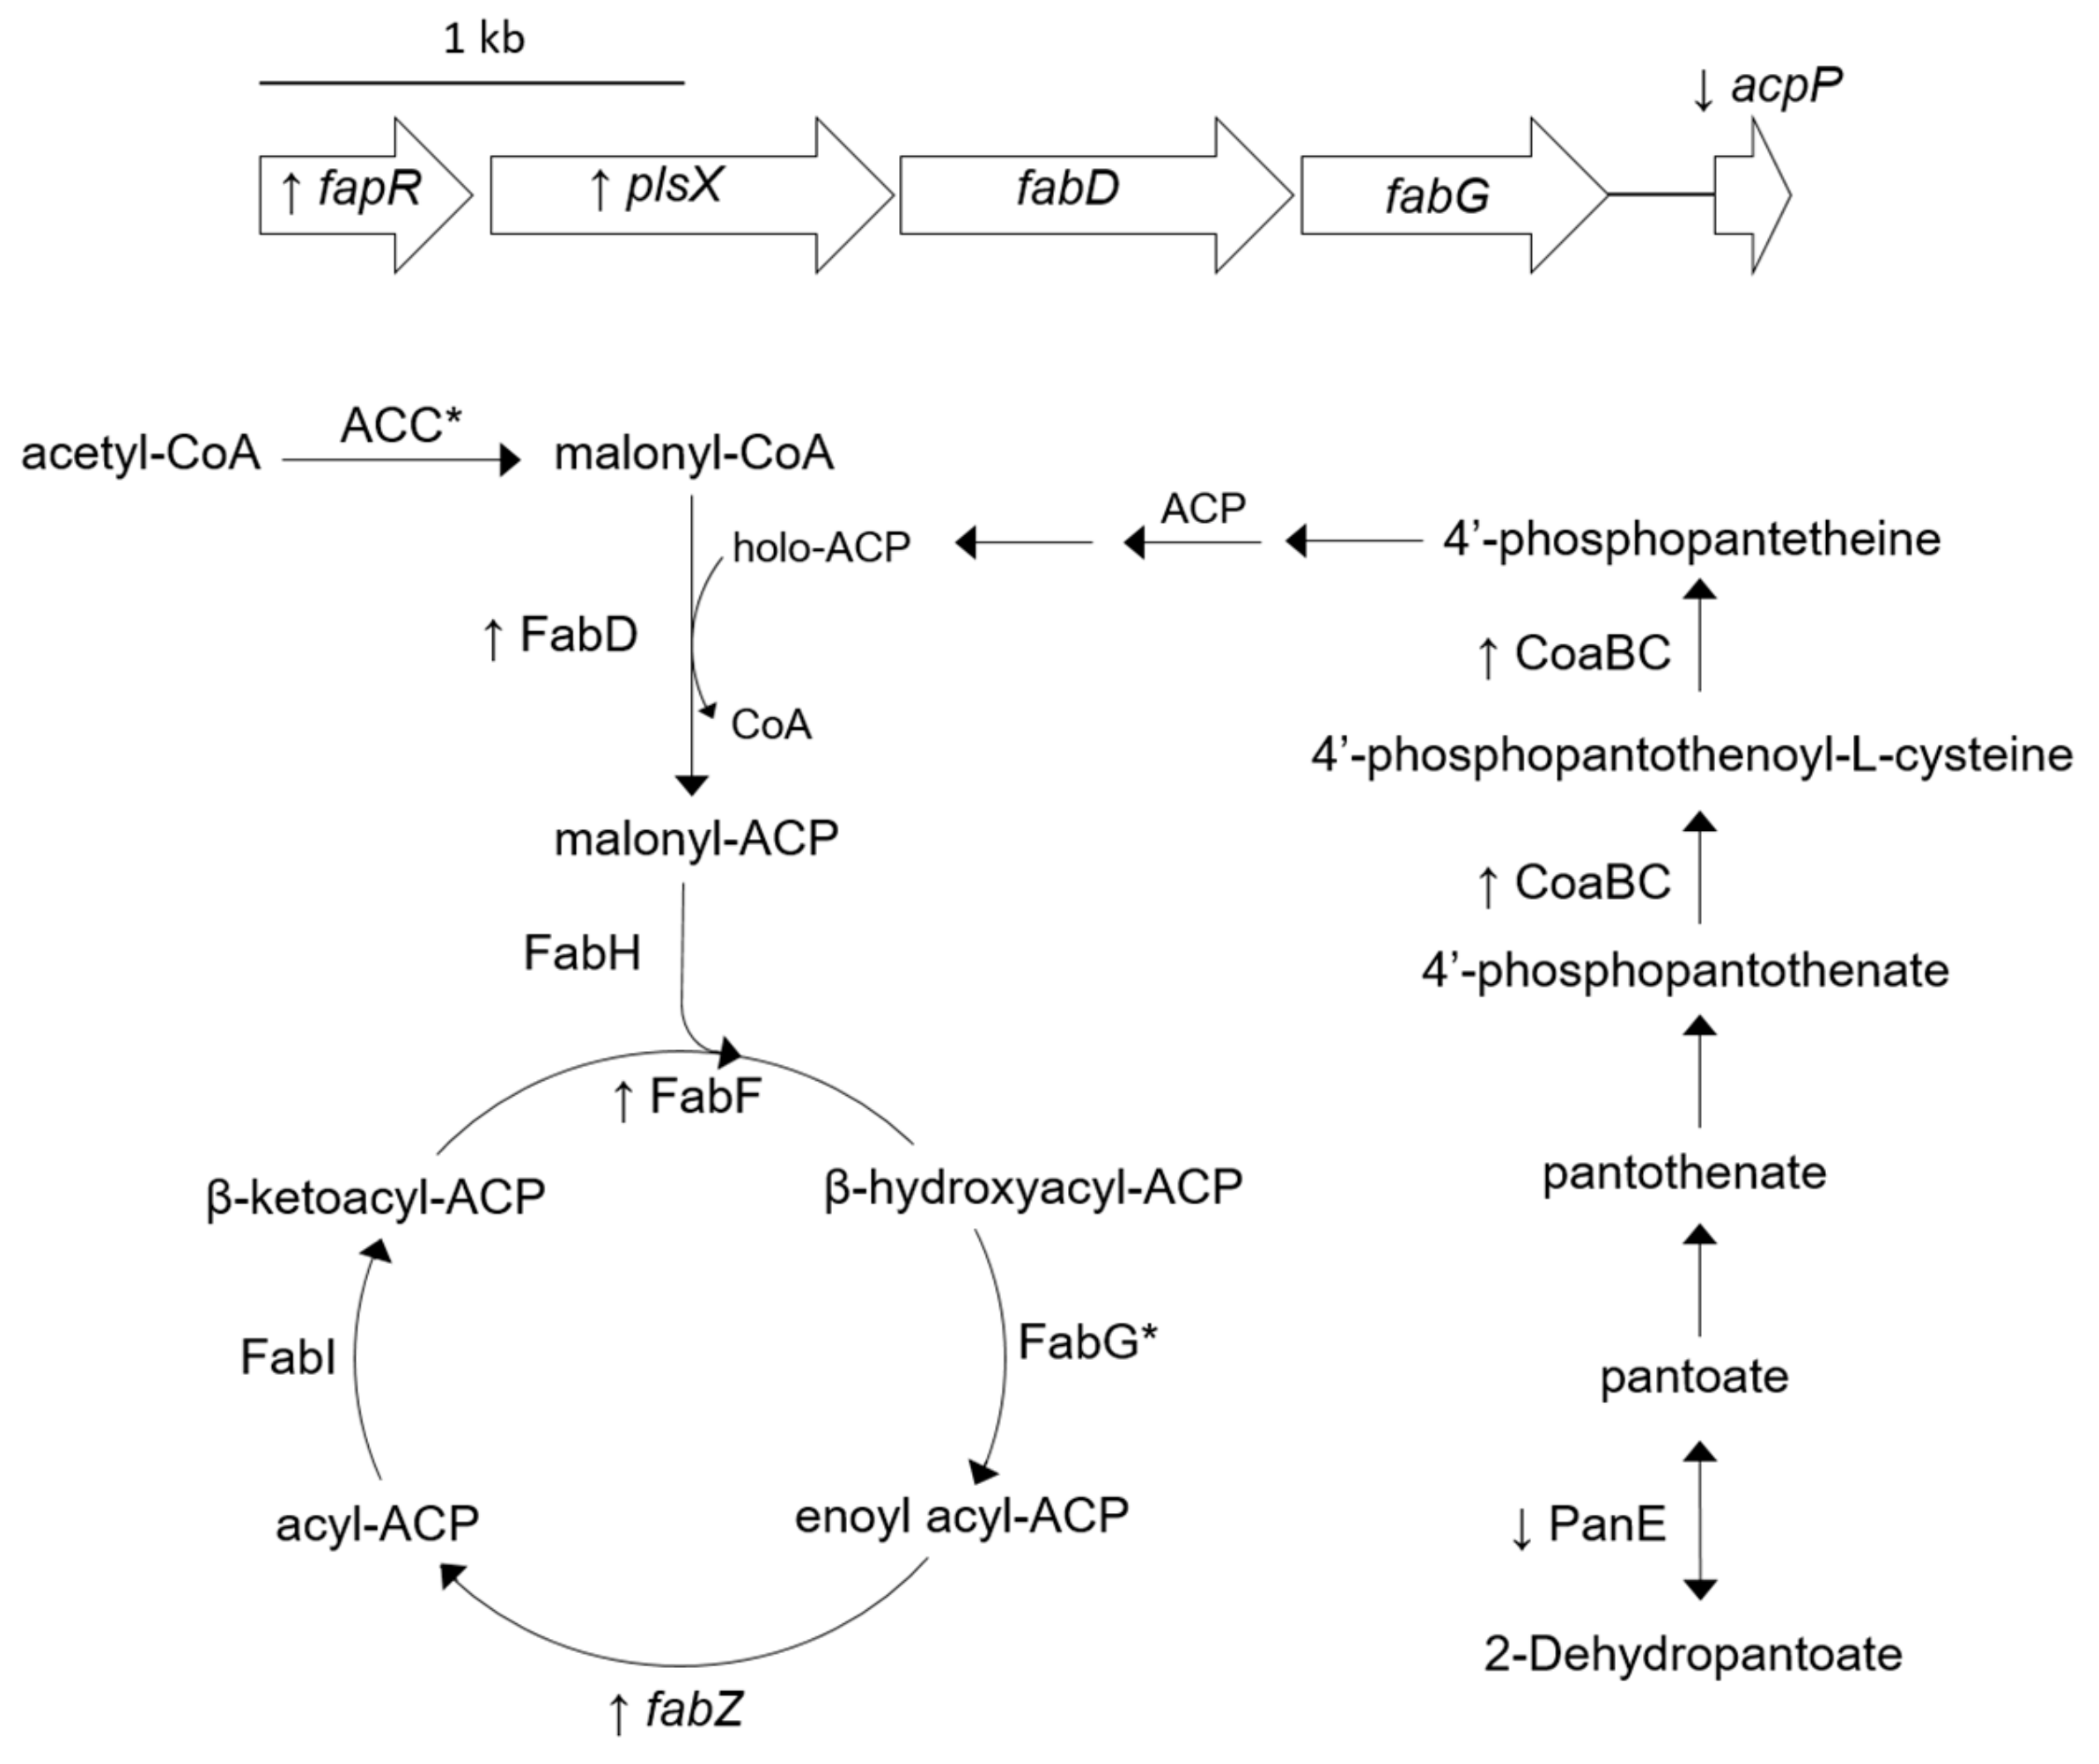
Despite the fact that relative FapR concentrations are the same in SH1000 and SH1000-TTORS-1 (Table S1), RT-PCR analysis revealed that fapR, plsX, and fabZ were all up-regulated, while the expression of acpP was decreased in SH1000-TTORS-1 (Table 2, Figure 1).
CoaBC is a bifunctional phosphopantothenoylcysteine decarboxylase/phosphopantothenate-cysteine ligase that catalyzes the final reaction in synthesizing 4′-phosphopantetheine [39,40] and PanE is a 2-dehydropantoate 2-reductase important in the biosynthesis of the 4′-phosphopantetheine precursor pantothenate [41] (Figure 1). CoaBC is increased and PanE is reduced in SH1000-TTORS-1 compared to SH1000 (Table 1, Figure 1). In addition, FabD (malonyl-CoA-ACP transacylase) and FabF (3-oxoacyl-synthase) were both increased in SH1000-TTORS-1 (Table 2, Figure 1).
The fatty acid biosynthesis inhibitor triclosan selected SCVs that harbored mutations in one or more genes encoding FabI and FabD, a teicoplanin resistance-associated protein, and a NADH-dependent flavin oxidoreductase [42]. Triclosan-selected SCVs were also reported to produce higher concentrations of FabF, as well as FabI and FabH (β-ketoacyl-ACP synthase); however, triclosan-selected SCVs demonstrated decreased concentrations of FabD [42].
Uncharacterized proteins SAOUHSC_01348 and SAOUHSC_2604 were increased in relative concentrations in SH1000-TTORS-1. SAOUHSC_01348 exhibited 50% amino acid identity with the Bacillus subtilis acyl-CoA thioesterase YneP, that is suspected to be involved with fatty acid degradation [43]. It has been reported however that under laboratory conditions, S. aureus cannot degrade fatty acids [44]. SAOUHSC_02604 is an uncharacterized oxidoreductase that has a conserved FabI superfamily domain and demonstrates 26% protein identity along the entire length of the S. aureus enoyl-ACP-reductase FabI, which is required for fatty acid biosynthesis [45].
Growth of the triclosan-selected SCVs on media containing the fatty acid supplement Tween 80 led to increased colony size, which demonstrated that the SCV mutants were deficient in fatty acid biosynthesis [42].
The addition of Tween 80 to MHA media also led to an increase in colony size for SH1000-TTORS-1 (from 0.29 mm ± 0.05 to 0.64 mm ± 0.04, n = 10, p = 3.2 × 10⁻¹²), but not to the same size as the parent strain (1.45 ± 0.05 mm) which was unaffected by Tween 80-addition (1.47 ± 0.05, n =10, p = 0.48).
2.3. Proteins Involved with Central Metabolism Are Altered in SH1000-TTORS-1
Our proteomics analysis revealed the presence of a number of proteins involved with central metabolism in both SH1000 and SH1000-TTORS-1 (Table S1) and the relative concentration of some of these proteins were altered in SH1000-TTORS-1 (Table 1, Figure 2). The glycolytic proteins glyceraldehyde-3-phosphate dehydrogenase (GapA1) and 2,3-bisphosphoglycerate-independent phosphoglycerate mutase (GpmI) were both decreased in SH1000-TTORS-1 (Table 1, Figure 2). Additional proteins that affect pyruvate metabolism (PycA, pyruvate carboxylase; MaeB, malate dehydrogenase; Lqo, L-lactate-quinone oxidoreductase; and PdhABD, pyruvate dehydrogenase complex) were also decreased in SH1000-TTORS-1 (Table 1, Figure 2). A reduction in Pdh levels in S. aureus SCVs has previously been reported on [8]. The pyruvate oxidase CidC which metabolizes pyruvate into acetate, was also increased in SH1000-TTORS-1 (Table 1, Figure 2). pta and ackA respectively encode a phosphotransacetylase and an acetate kinase, and the ability of Pta-AckA to metabolize acetyl-CoA into acetate is essential for S. aureus survival [46]. RT-PCR analysis revealed that the expression of both pta and ackA were elevated in SH1000-TTORS-1 (Table 2, Figure 2).
Only three TCA cycle proteins were not identified in either SH1000 or SH1000-TTORS-1: SucA (2-oxoglutarate dehydrogenase E1), SucB (dihydrolipoamide succinyl-transferase), and SucC (succinyl-CoA synthetase subunit beta) (Table S1). Of the identified TCA cycle proteins, only the succinyl-CoA synthetase subunit alpha (SucD) was increased in SH1000-TTORS-1 (Table 1, Figure 2).
2.4. Proteins Associated with Stress and Stringent Response Are Altered in SH1000-TTORS-1
The general stress response RNA polymerase sigma factor SigB is intimately involved with the general stress response of S. aureus, and plays an essential role in the formation of SCVs [47,48]. RsbU is a phosphatase that positively regulates SigB activity by releasing SigB from the anti-sigma factor RsbW [49]. The relative concentrations of both SigB and RsbU were both increased in SH1000-TTORS-1 (Table 1). In addition, a number of proteins produced by genes controlled by SigB were also altered in SH1000-TTORS-1. The genes that produce Cap5O (UDP-N-acetyl-D-mannosaminuronic acid dehydrogenase) and CidC are positively regulated by SigB [50], Cap50 was only detected in SH1000-TTORS-1, and CidC was increased in SH1000-TTORS-1 (Table 1). The genes that produce PycA, Hel (5′-nucleotidase), and SAOUHSC_02820 are negatively regulated by SigB [50], and the relative concentration of the proteins produced from these genes were decreased in SH1000-TTORS-1 (Table 1).
The stringent response in S. aureus is activated when nutrients such as amino acids are limited, which results in the accumulation of the alarmone guanosine 3′, 5′-bisdiphosphate and decreased expression of genes encoding products involved with protein biosynthesis [51]. RelA is an alarmone synthetase required for the stringent response that also demonstrates guanosine 3′, 5′-bisdiphosphate hydrolysis activity [51]. S. aureus has two additional (p)ppGpp synthetases, RelP and RelQ, that both lack the RelA C-terminal hydrolyzing domain [52]. The relative concentration of RelQ was increased in SH1000-TTORS-1 compared to SH1000 (Table 1). This finding suggests that a component that controls the stringent response in increased in SH1000-TTORS-1, supporting the suggestion that the stringent response is partially activated in this mutant.
Additional proteins previously reported to be reduced during the stringent response [53] were also reduced in SH1000-TTORS-1 compared to SH1000. These proteins included: PdhD, GpmI, SAOUHSC_02574 (an uncharacterized NAD/NADP octopine/nopaline dehydrogenase alpha-helical domain), TrxB (a thioredoxin reductase), and TypA (a GTP-binding protein) (Table 1). The protein SAOUHSC_02665 which encodes an uncharacterized general stress protein induced during a stringent response [53] was also increased in SH1000-TTORS-1 (Table 1). The altered expression of these proteins could be linked to the increased expression of RelQ in SH1000-TTORS-1.
2.5. Additional Proteins Altered in SH1000-TTORS-1
The relative concentration of a number of proteins involved with translation were decreased in SH1000-TTORS-1. These proteins included: PheT (phenylalanyl-tRNA synthetase subunit beta), TrpS (trytophanol tRNA synthetase), MetG (methionyl-tRNA synthetase), and RplY (50S ribosomal protein L25/general stress protein) (Table 1). MetG is responsible for the production of methionyl-tRNA which when formylated can be used to initiate translation [54]. The methionine aminopeptidase protein (Map) is then responsible for cleaving the N-terminal methionine following protein production [54], and the relative concentration of Map was also reduced in SH1000-TTORS-1 (Table 1).
Two different subunits of DNA polymerase, DnaN (DNA polymerase III β-subunit) and DnaX (DNA polymerase III γ and τ subunits), and nucleotide metabolism proteins PurA (adenylosuccinate synthetase) and Tdk (thymidine kinase) were all decreased in SH1000-TTORS-1 (Table 1). The production of AtpG (F0F1 ATP synthase γ-subunit) was also decreased in SH1000-TTORS-1 and an intergenic mutation was identified between the last gene of the ATP synthase operon (atpC) and the hypothetical gene SAOUHSC_02339 in SH1000-TTORS-1 [30] (Table 1).
S. aureus contains two copies of UDP-N-acetylglucosamine 1-carboxyvinyltransferase, MurA and MurZ, which catalyze the first committed step in peptidoglycan biosynthesis [55]. murZ expression is also increased in S. aureus exposed to peptidoglycan biosynthesis inhibitors [55]. Both MurA and MurZ were identified in the SH1000 and SH1000-TTORS-1 proteomes; however, MurZ levels were increased in SH1000-TTORS-1 (Table 1). Because SH1000-TTORS-1 demonstrated a thinned cell wall [29] and MurZ was increased in SH1000-TTORS-1, we determined the qualitative susceptibility of SH1000 and SH1000-TTORS-1 to antimicrobials that target peptidoglycan synthesis. The distance grown by SH1000-TTORS-1 on a 0 → 2 mg/L vancomycin gradient was greater (30.7 mm ± 1.15 mm, n = 3) than SH1000, which did not grow on this gradient at all. SH1000-TTORS-1 also grew to a greater distance on a 0 → 0.5 mg/L oxacillin gradient (52.7 mm ± 2.52 mm) compared to SH1000 (19.3 mm ± 1.15 mm, n = 3, p < 0.05).
2.6. Metabolomics Analysis
A total of 105 metabolites were identified in both strains: 16 amines and polyamines, 29 amino acids, 38 polar organic acids, and 22 sugars (Table S2). Out of these metabolites, 35 metabolites were found to be significantly altered in SH1000-TTORS-1 compared to SH1000, three metabolites were only identified in SH1000, and four metabolites were only identified in SH1000-TTORS-1 (Table 3; Table 4).
Eleven amino acids were found in higher relative concentrations (Table 3) and 10 sugars were found in lower concentrations (Table 4) in SH1000-TTORS-1 compared to SH1000.
Asparagine and aspartic acid are increased in SH1000-TTORS-1 and during the degradation of these amino acids they can enter the TCA cycle after being turned into oxaloacetate [56] (Figure 2), and aspartic acid is one of eight amino acids that is initially degraded by S. aureus during growth in media without a preferred carbon and energy source [56]. The relative concentration of RocD which is involved with ornithine and proline biosynthesis [57] was increased in SH1000-TTORS-1 (Table 1, Figure 2), and both ornithine and proline are increased in SH1000-TTORS-1 (Table 3, Figure 2). The increased proline accumulation could be attributed to the increased relative concentration of the proline/choline/glycine betaine transporter OpuD [58] in SH1000-TTORS-1 (Table 1). Ornithine is synthesized from arginine during the urea cycle and is a precursor needed in the synthesis of glutamate and proline (Figure 2) [57]. Both proline and ornithine can be metabolized into glutamate which can then enter the TCA cycle as α-ketogluterate (Figure 2).
The concentration of glucose 6-phosphate, fructose 6-phosphate, and fructose 1,6-bisphosphate were decreased in SH1000-TTORS-1 compared to SH1000 (Figure 2, Table 3) indicating that gluconeogenesis or sugar accumulation is reduced in this mutant.
The concentrations of TCA cycle intermediates fumarate and succinate were both increased in SH1000-TTORS-1 which occurs in conjunction with increased SucD expression (Table 1; Table 3).
Lactate is synthesized from pyruvate in the absence of oxygen via lactate dehydrogenase [59] and lactate concentrations were decreased in SH1000-TTORS-1, yet there was no difference in the D-lactate dehydrogenase levels in SH1000-TTORS-1 and SH1000 (Table S1). In conjunction with the reduced lactate level in SH1000-TTORS-1, we note that the relative concentration of a protein (Lqo) which is responsible for metabolizing lactate into pyruvate, was also decreased (Figure 2) [60].
3. Discussion
SH1000-TTORS-1 harbors a mutation in acpP [30], which leads to the production of an ACP with an amino acid alteration (A34D) that is 2 amino acids away from the highly conserved S36 that is modified with a 4′-phosphopantetheine moiety that acts as the site for fatty acid attachment during fatty acid elongation [34]. We now report that SH1000-TTORS-1 exhibits a number of other alterations that further supports the hypothesis that fatty acid biosynthesis in this mutant is defective (Figure 1). SH1000-TTORS-1 demonstrated the altered expression of genes required for the fatty acid and lipid biosynthesis (plsX, fabZ, and acpP) and the control of this process (fapR). SH1000-TTORS-1 also expressed an increased quantity of CoaBC and reduced quantity of PanE, which implied that the production of holo-ACP is altered in this mutant. Furthermore, the relative concentration of FabD (malonyl-CoA-ACP transacylase) and FabF (3-oxoacyl-synthase) (Figure 1) and two uncharacterized proteins (SAOUHSC_01348, SAOUHSC_02604) possibly involved with fatty acid biosynthesis and degradation, were all increased in SH1000-TTORS-1. Lastly, similar to triclosan-selected SCVs [42], growth of SH1000-TTORS-1 with the fatty acid supplement tween-80 led to an increase in colony size. We previously reported that the overall fatty acid content of SH1000 and SH1000-TTORS-1 were similar [30], so we propose that fatty acid biosynthesis is defective and slowed in SH1000-TTORS-1.
Similar to previously characterized S. aureus SCVs [5,6,7,8,9], SH1000-TTORS-1 also demonstrated alterations in central metabolism. The relative concentration of GapA1 and Gpm1 which are central to glycolysis and gluconeogenesis were reduced in SH1000-TTORS-1. Six proteins involved in pyruvate metabolism were also reduced in SH1000-TTORS-1. The defect in fatty acid biosynthesis observed in SH1000-TTORS-1 probably also contributes to altered acetyl-CoA metabolism. Collectively, this data implies that the flow of pyruvate and acetyl-CoA into the TCA cycle is altered in SH1000-TTORS-1. At the same time, the relative concentration of CidC and ackA and pta expression were increased in SH1000-TTORS-1, which indicated an alteration in acetate metabolism. ATP production via the Pta/AckA pathway is thought to be important for growth when glucose is not abundant [56]. Collectively, these findings indicate that pyruvate, acetyl-CoA and acetate metabolism are skewed within SH1000-TTORS-1. Surprisingly, metabolomic analysis revealed that the concentrations of pyruvic acid in both SH1000 and SH1000-TTORS-1, were not significantly different (Table S2).
In SH1000-TTORS-1 SucD, succinate, and fumarate, were all increased in SH1000-TTORS-1 indicating increased flow of carbon in this part of the TCA cycle in SH1000-TTORS-1. During carbon catabolite repression (CCR) in bacteria, the presence of preferred carbon sources leads to the repression of genes whose products are involved in the catabolism of non-preferred carbon sources [62]. S. aureus can readily degrade a number of amino acids and it was suggested that glutamate and amino acids that generate glutamate, particularly proline, serve as the major carbon source in defined media lacking a preferred carbon source [56]. We propose that the reduction in sugar content in SH1000-TTORS-1 alleviates carbon catabolite repression (CCR) allowing for the catabolism of amino acids (ornithine, proline, asparagine and aspartate), which are provided from the increased amino acid pool observed in SH1000-TTORS-1, to produce TCA intermediates and energy (Figure 2).
It has been previously reported that the production of ribosomal proteins can be altered in S. aureus SCVs [8] and an S. aureus SCV mutant harboring a relA mutation demonstrated increased expression of TCA cycle enzymes [16]. Protein synthesis and the expression of tRNA synthetases are also reduced during the stringent response [51]. SH1000-TTORS-1 demonstrated reduced production of proteins essential to translation, including tRNA-amino acid synthetases, increased RelQ production and the altered production of proteins affected by the stringent response. The increase in free amino acid pools in SH1000-TTORS-1 therefore likely results from downturned protein production and the activation of an aberrant stringent response.
The increased production of SigB and RsbU, and the altered expression of SigB-controlled proteins demonstrates that the general stress response is activated in SH1000-TTORS-1. Considering the altered metabolic state of SH1000-TTORS-1 overall, it is not surprising that SigB and RsbU are increased in an effort to deal with the stress this mutant is experiencing and it should be noted that SigB is required for SCV formation [47,48].
The thinned cell wall [30], increased expression of MurZ, increased N-acetylglucosamine content, and alteration in cell wall antimicrobial susceptibility reported in this study supports the notion that peptidoglycan biosynthesis is also compromised in SH1000-TTORS-1. Furthermore, the reduction in DNA polymerase III, the major DNA replicative complex of the cell, indicates that DNA replication is reduced in SH1000-TTORS-1. This reduction in adenosine and guanosine is likely linked to a reduced DNA replication and ATP production brought on by the slowed growth and the altered metabolism observed in this mutant.
4. Materials and Methods
4.1. Strains, Antibiotic Gradient Plate Analysis, Colony Size, and Chemicals
The strains employed in this study included methicillin-susceptible strain SH1000 [63] and a TTO-selected SCV, SH1000-TTORS-1 [30]. Mueller Hinton broth (MHB), Luria broth (LB), and bacteriological-grade agar were purchased from Becton Dickinson and Company (Franklin Lakes, NJ). All chemicals were purchased from Sigma Aldrich Co. (St. Louis, MO), unless otherwise noted. TTO utilized for this study was purchased from Aura Cacia (Urbana IA, Melaleuca alternifolia product code A191139) and contained 44.1% terpinen-4-ol and 3.9% α-terpineol (v/v) which complies with the TTO International Standard (ISO 4730).
Gradient plate analysis was performed with MHB overnight cultures and Mueller Hinton agar (MHA) as previously described [64], and confluent growth along the gradient was measured in mm ± standard deviation (n = 3). Colony size determination was carried out as previously described [29] by diluting overnight MHB cultures and plating on MHA and MHA containing 0.1% (v/v) Tween 80. Random colonies were then measured for each strain grown on both media using a caliper in mm ± standard deviation (n = 10).
4.2. Protein Extraction
Total proteins were isolated from S. aureus strains SH1000 and SH1000-TTORS-1 in triplicate following the procedure of Wolff et. al. 2008 [65]. Briefly, overnight cultures were used to inoculate 250 mL of LB (initial OD580 = 0.01) which were then incubated (37 °C, 200 rpm) until the cultures reached an OD580 = 0.7. The cells were then pelleted (8000× g, 10 min, 4 °C) and stored at −80 °C. These cell pellets were then thawed and washed twice with TBS buffer (50 mM Tris-HCl, 150 mM NaCl, pH 7.4) and re-suspended in 1 mL of lysis buffer (50 mM Tris-HCl, 150 mM NaCl, 1 mM EDTA, 1 mM DTT, 1 mM PMSF, pH = 7.4). These suspensions were then loaded into a 2-mL cryovial tube containing 1 g of 0.1 mm glass beads (Biospec Products, Bartlesville OK) and the cells were lysed by agitation using a Mini-Beadbeater (Biospec Products) (5 × 50 sec @ 4200 rpm) with 2-min resting periods on ice in between agitation cycles. The cell lysates were then pelleted (8000× g, 10 min, 4 °C) twice to remove whole cells and glass beads, and sodium azide was added (final concentration of 0.02% v/v) before samples were stored at −80 °C. Protein concentrations were determined using the Bradford method [66] using bovine serum albumin (Bio-rad, Hercules CA) as a standard.
4.3. Mass Spectrometry Analysis
Each protein sample was analyzed using two replicate LC-MS/MS analyses on a hybrid LTQ-Orbitrap mass spectrometer (LC-MS/MS) (Thermo Fisher Scientific, Waltham, MA) as previously described [67]. Proteins were identified by using the Andromeda application with MaxQuant [68,69] to search the MS data against a database of S. aureus proteins downloaded from Uniprot (S. aureus strain NCTC 8325, ID 9306). Alterations in protein expression were quantified on the basis of peptide peak intensities, via the LFQ algorithm [70] embedded in MaxQuant v. 1.5.3.8. Statistically significant differences in protein levels were calculated via the t-test algorithms embedded in Perseus 1.5.3.2 ([71,72]; Max Planck Institute of Biochemistry). A two-fold alteration in protein concentration and a Student’s t-test p-value of < 0.05 was used as the threshold criteria for significant differences in protein expression (Table 1).
4.4. Metabolite Extraction and Analysis
Metabolites were extracted from both SH1000 and SH1000-TTORS-1 in triplicate as previously described [73]. Briefly, overnight cultures were used to inoculate 125 mL of LB (initial OD580 = 0.01) and incubated (37 °C, 200 rpm) until an OD580 = 0.07 was reached. Cells from each sample were then collected by centrifugation (10,000× g, 5 min, 4 °C) and washed once with 1× PBS (137 mM NaCl, 2.7 mM KCl, 10 mM Na2HPO4, 2 mM KH2PO4, pH = 7.4) and re-pelleted (10,000× g, 5 min, 4 °C). Metabolic quenching was achieved by adding 500 μL of cold methanol (−20 °C) and all samples were stored at −80 °C. Metabolite analysis was carried out by the Roy J. Carver Biotechnology Center, University of Illinois at Urbana-Champaign, Urbana, IL, USA as previously described [73]. Metabolite relative concentrations were normalized using 100 mg of dry cell weight and statistically significant alterations in metabolite levels were based upon a Student’s t-test p-value < 0.05 and reported as the average ± standard error of the mean for all three biological replicates.
4.5. RNA Extraction and RT-PCR
Initially, exponentially-grown 50-mL LB cultures (see above) were pelleted (8000 rpm, 4 °C, 10 min), and re-suspended in 1 mL of TRIzol (Ambion-Thermo Fisher Scientific, Waltham, MA). Cell lysis was completed using a single cycle of bead beating as described above. The resulting supernatant was then extracted with chloroform (1/5 the total volume) with agitation, and then centrifuged (12,000× g, 4 °C, 15 min). The aqueous layer was then placed in a fresh microfuge tube and the RNA was then precipitated with ice cold isopropanol (2.5 × the total volume) on ice, followed by centrifugation (12,000× g, 4 °C, 20 min). The resulting RNA pellet was then washed with 70% ethanol, re-pelleted (7500× g, 4 °C, 10 min) and air-dried. All RNA samples were treated with the DNA-free Kit (Ambion-Thermo Fischer Scientific, Waltham, MA) and cDNA samples were produced utilizing SuperScript III Reverse Transcriptase per the manufacturer’s instructions (Invitrogen-Thermo Scientific, Waltham, MA).
cDNA samples were then interrogated by real-time PCR using the LightCycler 96 Real-Time PCR system (Roche, Indianapolis, IN) and FastStart Universal SYBR Green Master (ROX) (Roche). Gene-specific primers used in the RT-PCR analysis are found in Table S3. Critical threshold values were normalized using 16S rRNA and expression values were calculated using the 2−ΔΔCt method [74].
5. Conclusions
Overall this study provides additional insight into a mechanism that a bacterial pathogen utilizes to thwart the action of a popular “natural” antiseptic that inactivates multiple targets. We propose that the slowed or reduced production of the general targets of TTO (proteins and membranes) and altered metabolism allow SH1000-TTORS-1 to withstand the antimicrobial action of TTO better than the parent strain. This reduction in major biosynthetic pathway activity, stress response activation, and overall alteration in metabolism also likely contributes to the reduced growth and small colony phenotype observed in SH1000-TTORS-1.
Supplementary Materials
The following are available online at https://www.mdpi.com/2079-6382/8/4/248/s1. Table S1. All proteins identified in SH1000 and SH1000-TTORS-1. Protein values are reported as the average log2 transformation of each protein’s peak intensity (n = 3). Table S2. All metabolites (per 100 mg dry weight) detected in SH1000 and SH1000-TTORS-1, n = 3. Table S3. Primers used for RT-PCR analysis in SH1000-TTORS-1.
Author Contributions
Conceptualization, J.E.G. and N.J.T. Data acquisition, N.J.T, J.R., and S.D.H.; Data analysis, N.J.T., J.E.G., and S.D.H; Funding acquisition, J.E.G.; Supervision, J.E.G. and S.D.H.; Writing of original draft, J.E.G. and N.J.T.; Writing, review, and submission of draft, J.E.G., N.J.T., and S.D.H.
Funding
This work was supported by the Oklahoma Agricultural Experiment Station.
Conflicts of Interest
The authors declare no conflicts of interest.
References
- King, M.D.; Humphrey, B.J.; Wang, Y.F.; Kourbatova, E.V.; Ray, S.M.; Blumberg, H.M. Emergence of community-acquired methicillin-resistant Staphylococcus aureus USA 300 clone as the predominant cause of skin and soft-tissue infections. Ann. Intern. Med. 2006, 144, 309–317. [Google Scholar] [CrossRef] [PubMed] [Green Version]
- Proctor, R.A.; van Langevelde, P.; Kristjansson, M.; Maslow, J.N.; Arbeit, R.D. Persistent and relapsing infections associated with small-colony variants of Staphylococcus aureus. Clin. Infect. Dis. 1995, 20, 95–102. [Google Scholar] [CrossRef] [PubMed]
- Proctor, R.A.; Balwit, J.M.; Vesga, O. Variant subpopulations of Staphylococcus aureus as cause of persistent and recurrent infections. Infect. Agents Dis. 1994, 3, 302–312. [Google Scholar] [PubMed]
- Proctor, R.A.; von Eiff, C.; Kahl, B.C.; Becker, K.; McNamara, P.; Herrmann, M.; Peters, G. Small colony variants: A pathogenic form of bacteria that facilitates persistent and recurrent infections. Nat. Rev. Microbiol. 2006, 4, 295–305. [Google Scholar] [CrossRef] [PubMed]
- Kohler, C.; von Eiff, C.; Liebeke, M.; McNamara, P.J.; Lalk, M.; Proctor, R.A.; Hecker, M.; Engelmann, S. A defect in menadione biosynthesis induces global changes in gene expression in Staphylococcus aureus. J. Bacteriol. 2008, 190, 6351–6364. [Google Scholar] [CrossRef] [Green Version]
- Kohler, C.; von Eiff, C.; Peters, G.; Proctor, R.A.; Hecker, M.; Engelmann, S. Physiological characterization of a heme-deficient mutant of Staphylococcus aureus by a proteomic approach. J. Bacteriol. 2003, 185, 6928–6937. [Google Scholar] [CrossRef] [Green Version]
- Seggewiss, J.; Becker, K.; Kotte, O.; Eisenacher, M.; Yazdi, M.R.; Fischer, A.; McNamara, P.; Al Laham, N.; Proctor, R.; Peters, G.; et al. Reporter metabolite analysis of transcriptional profiles of a Staphylococcus aureus strain with normal phenotype and its isogenic hemB mutant displaying the small-colony-variant phenotype. J. Bacteriol. 2006, 188, 7765–7777. [Google Scholar] [CrossRef] [Green Version]
- Kriegeskorte, A.; Konig, S.; Sander, G.; Pirkl, A.; Mahabir, E.; Proctor, R.A.; von Eiff, C.; Peters, G.; Becker, K. Small colony variants of Staphylococcus aureus reveal distinct protein profiles. Proteomics 2011, 11, 2476–2490. [Google Scholar] [CrossRef]
- Kriegeskorte, A.; Grubmuller, S.; Huber, C.; Kahl, B.C.; von Eiff, C.; Proctor, R.A.; Peters, G.; Eisenreich, W.; Becker, K. Staphylococcus aureus small colony variants show common metabolic features in central metabolism irrespective of the underlying auxotrophism. Front. Cell Infect. Microbiol. 2014, 4, 141. [Google Scholar] [CrossRef]
- Von Eiff, C.; Heilmann, C.; Proctor, R.A.; Woltz, C.; Peters, G.; Gotz, F. A site-directed Staphylococcus aureus hemB mutant is a small-colony variant which persists intracellularly. J. Bacteriol. 1997, 179, 4706–4712. [Google Scholar] [CrossRef] [Green Version]
- Schaaff, F.; Bierbaum, G.; Baumert, N.; Bartmann, P.; Sahl, H.G. Mutations are involved in emergence of aminoglycoside-induced small colony variants of Staphylococcus aureus. Int. J. Med. Microbiol. 2003, 293, 427–435. [Google Scholar] [CrossRef] [PubMed]
- Bates, D.M.; von Eiff, C.; McNamara, P.J.; Peters, G.; Yeaman, M.R.; Bayer, A.S.; Proctor, R.A. Staphylococcus aureus menD and hemB mutants are as infective as the parent strains, but the menadione biosynthetic mutant persists within the kidney. J. Infect. Dis. 2003, 187, 1654–1661. [Google Scholar] [CrossRef] [PubMed] [Green Version]
- Clements, M.O.; Watson, S.P.; Poole, R.K.; Foster, S.J. CtaA of Staphylococcus aureus is required for starvation survival, recovery, and cytochrome biosynthesis. J. Bacteriol. 1999, 181, 501–507. [Google Scholar] [PubMed]
- Chatterjee, I.; Kriegeskorte, A.; Fischer, A.; Deiwick, S.; Theimann, N.; Proctor, R.A.; Peters, G.; Herrmann, M.; Kahl, B.C. In vivo mutations of thymidylate synthase (encoded by thyA) are responsible for thymidine dependency in clinical small-colony variants of Staphylococcus aureus. J. Bacteriol. 2008, 190, 834–842. [Google Scholar] [CrossRef] [PubMed] [Green Version]
- Duval, B.D.; Mathew, A.; Satola, S.W.; Shafer, W.M. Altered growth, pigmentation, and antimicrobial susceptibility properties of Staphylococcus aureus due to loss of the major cold shock gene cspB. Antimicrob. Agents Chemother. 2010, 54, 2283–2290. [Google Scholar] [CrossRef] [PubMed] [Green Version]
- Gao, W.; Chua, K.; Davies, J.K.; Newton, H.J.; Seemann, T.; Harrison, P.F.; Holmes, N.E.; Rhee, H.W.; Hong, J.I.; Hartland, E.L.; et al. Two novel point mutations in clinical Staphylococcus aureus reduce linezolid susceptibility and switch on the stringent response to promote persistent infection. PLoS Pathog. 2010, 6, e1000944. [Google Scholar] [CrossRef] [Green Version]
- Oun, S.; Redder, P.; Didier, J.P.; Francois, P.; Corvaglia, A.R.; Buttazzoni, E.; Giraud, C.; Girard, M.; Schrenzel, J.; Linder, P. The CshA DEAD-box RNA helicase is important for quorum sensing control in Staphylococcus aureus. RNA Biol. 2013, 10, 157–165. [Google Scholar] [CrossRef] [Green Version]
- Gaupp, R.; Schlag, S.; Liebeke, M.; Lalk, M.; Gotz, F. Advantage of upregulation of succinate dehydrogenase in Staphylococcus aureus biofilms. J. Bacteriol. 2010, 192, 2385–2394. [Google Scholar] [CrossRef] [Green Version]
- Zhang, P.; Wright, J.A.; Osman, A.A.; Nair, S.P. An aroD Ochre Mutation Results in a Staphylococcus aureus Small Colony Variant That Can Undergo Phenotypic Switching via Two Alternative Mechanisms. Front. Microbiol. 2017, 8, 1001. [Google Scholar] [CrossRef]
- Norstrom, T.; Lannergard, J.; Hughes, D. Genetic and phenotypic identification of fusidic acid-resistant mutants with the small-colony-variant phenotype in Staphylococcus aureus. Antimicrob. Agents Chemother. 2007, 51, 4438–4446. [Google Scholar] [CrossRef] [Green Version]
- Painter, K.L.; Strange, E.; Parkhill, J.; Bamford, K.B.; Armstrong-James, D.; Edwards, A.M. Staphylococcus aureus adapts to oxidative stress by producing H2O2-resistant small-colony variants via the SOS response. Infect. Immun. 2015, 83, 1830–1844. [Google Scholar] [CrossRef] [PubMed] [Green Version]
- Cao, S.; Huseby, D.L.; Brandis, G.; Hughes, D. Alternative Evolutionary Pathways for Drug-Resistant Small Colony Variant Mutants in Staphylococcus aureus. MBio 2017, 8. [Google Scholar] [CrossRef] [PubMed] [Green Version]
- Carson, C.F.; Hammer, K.A.; Riley, T.V. Melaleuca alternifolia (Tea Tree) oil: A review of antimicrobial and other medicinal properties. Clin. Microbiol. Rev. 2006, 19, 50–62. [Google Scholar] [CrossRef] [PubMed] [Green Version]
- Carson, C.F.; Cookson, B.D.; Farrelly, H.D.; Riley, T.V. Susceptibility of methicillin-resistant Staphylococcus aureus to the essential oil of Melaleuca alternifolia. J. Antimicrob. Chemother. 1995, 35, 421–424. [Google Scholar] [CrossRef]
- Cox, S.D.; Gustafson, J.E.; Mann, C.M.; Markham, J.L.; Liew, Y.C.; Hartland, R.P.; Bell, H.C.; Warmington, J.R.; Wyllie, S.G. Tea tree oil causes K+ leakage and inhibits respiration in Escherichia coli. Lett. Appl. Microbiol. 1998, 26, 355–358. [Google Scholar] [CrossRef]
- Gustafson, J.E.; Liew, Y.C.; Chew, S.; Markham, J.; Bell, H.C.; Wyllie, S.G.; Warmington, J.R. Effects of tea tree oil on Escherichia coli. Lett. Appl. Microbiol. 1998, 26, 194–198. [Google Scholar] [CrossRef]
- Cox, S.D.; Mann, C.M.; Markham, J.L.; Bell, H.C.; Gustafson, J.E.; Warmington, J.R.; Wyllie, S.G. The mode of antimicrobial action of the essential oil of Melaleuca alternifolia (tea tree oil). J. Appl. Microbiol. 2000, 88, 170–175. [Google Scholar] [CrossRef]
- Carson, C.F.; Mee, B.J.; Riley, T.V. Mechanism of action of Melaleuca alternifolia (tea tree) oil on Staphylococcus aureus determined by time-kill, lysis, leakage, and salt tolerance assays and electron microscopy. Antimicrob. Agents Chemother. 2002, 46, 1914–1920. [Google Scholar] [CrossRef] [Green Version]
- Cuaron, J.A.; Dulal, S.; Song, Y.; Singh, A.K.; Montelongo, C.E.; Yu, W.; Nagarajan, V.; Jayaswal, R.K.; Wilkinson, B.J.; Gustafson, J.E. Tea tree oil-induced transcriptional alterations in Staphylococcus aureus. Phytother. Res. PTR 2013, 27, 390–396. [Google Scholar] [CrossRef] [Green Version]
- Cuaron, J.A.; Dulal, S.; Cooke, P.H.; Torres, N.J.; Gustafson, J.E. The isolation of Staphylococcus aureus tea tree oil-reduced susceptibility mutants. Phytother. Res. PTR 2014, 28, 1240–1245. [Google Scholar] [CrossRef] [Green Version]
- Rawlings, M.; Cronan, J.E., Jr. The gene encoding Escherichia coli acyl carrier protein lies within a cluster of fatty acid biosynthetic genes. J. Biol. Chem. 1992, 267, 5751–5754. [Google Scholar] [PubMed]
- Majerus, P.W.; Alberts, A.W.; Vagelos, P.R. The Acyl Carrier Protein of Fatty Acid Synthesis: Purification, Physical Properties, and Substrate Binding Site. Proc. Natl. Acad. Sci. USA 1964, 51, 1231–1238. [Google Scholar] [CrossRef] [PubMed] [Green Version]
- Chan, D.I.; Vogel, H.J. Current understanding of fatty acid biosynthesis and the acyl carrier protein. Biochem. J. 2010, 430, 1–19. [Google Scholar] [CrossRef] [PubMed] [Green Version]
- Rock, C.O.; Cronan, J.E. Escherichia coli as a model for the regulation of dissociable (type II) fatty acid biosynthesis. Biochim. Biophys. Acta 1996, 1302, 1–16. [Google Scholar] [CrossRef]
- Paoletti, L.; Lu, Y.J.; Schujman, G.E.; de Mendoza, D.; Rock, C.O. Coupling of fatty acid and phospholipid synthesis in Bacillus subtilis. J. Bacteriol. 2007, 189, 5816–5824. [Google Scholar] [CrossRef] [Green Version]
- Schujman, G.E.; Guerin, M.; Buschiazzo, A.; Schaeffer, F.; Llarrull, L.I.; Reh, G.; Vila, A.J.; Alzari, P.M.; de Mendoza, D. Structural basis of lipid biosynthesis regulation in Gram-positive bacteria. EMBO J. 2006, 25, 4074–4083. [Google Scholar] [CrossRef]
- Schujman, G.E.; Paoletti, L.; Grossman, A.D.; de Mendoza, D. FapR, a bacterial transcription factor involved in global regulation of membrane lipid biosynthesis. Dev. Cell 2003, 4, 663–672. [Google Scholar] [CrossRef] [Green Version]
- Lannergard, J.; von Eiff, C.; Sander, G.; Cordes, T.; Seggewiss, J.; Peters, G.; Proctor, R.A.; Becker, K.; Hughes, D. Identification of the genetic basis for clinical menadione-auxotrophic small-colony variant isolates of Staphylococcus aureus. Antimicrob. Agents Chemother. 2008, 52, 4017–4022. [Google Scholar] [CrossRef] [Green Version]
- Strauss, E.; Kinsland, C.; Ge, Y.; McLafferty, F.W.; Begley, T.P. Phosphopantothenoylcysteine synthetase from Escherichia coli. Identification and characterization of the last unidentified coenzyme A biosynthetic enzyme in bacteria. J. Biol. Chem. 2001, 276, 13513–13516. [Google Scholar] [CrossRef] [Green Version]
- Kupke, T.; Uebele, M.; Schmid, D.; Jung, G.; Blaesse, M.; Steinbacher, S. Molecular characterization of lantibiotic-synthesizing enzyme EpiD reveals a function for bacterial Dfp proteins in coenzyme A biosynthesis. J. Biol. Chem. 2000, 275, 31838–31846. [Google Scholar] [CrossRef] [Green Version]
- Zheng, R.; Blanchard, J.S. Kinetic and mechanistic analysis of the E. coli panE-encoded ketopantoate reductase. Biochemistry 2000, 39, 3708–3717. [Google Scholar] [CrossRef]
- Bazaid, A.S.; Forbes, S.; Humphreys, G.J.; Ledder, R.G.; O’Cualain, R.; McBain, A.J. Fatty Acid Supplementation Reverses the Small Colony Variant Phenotype in Triclosan-Adapted Staphylococcus aureus: Genetic, Proteomic and Phenotypic Analyses. Sci. Rep. 2018, 8, 3876. [Google Scholar] [CrossRef]
- Nie, L.; Ren, Y.; Schulz, H. Identification and characterization of Escherichia coli thioesterase III that functions in fatty acid beta-oxidation. Biochemistry 2008, 47, 7744–7751. [Google Scholar] [CrossRef] [PubMed]
- Parsons, J.B.; Frank, M.W.; Subramanian, C.; Saenkham, P.; Rock, C.O. Metabolic basis for the differential susceptibility of Gram-positive pathogens to fatty acid synthesis inhibitors. Proc. Natl. Acad. Sci. USA 2011, 108, 15378–15383. [Google Scholar] [CrossRef] [Green Version]
- Heath, R.J.; Rock, C.O. Enoyl-acyl carrier protein reductase (fabI) plays a determinant role in completing cycles of fatty acid elongation in Escherichia coli. J. Biol. Chem. 1995, 270, 26538–26542. [Google Scholar] [CrossRef] [Green Version]
- Sadykov, M.R.; Thomas, V.C.; Marshall, D.D.; Wenstrom, C.J.; Moormeier, D.E.; Widhelm, T.J.; Nuxoll, A.S.; Powers, R.; Bayles, K.W. Inactivation of the Pta-AckA pathway causes cell death in Staphylococcus aureus. J. Bacteriol. 2013, 195, 3035–3044. [Google Scholar] [CrossRef] [Green Version]
- Tuchscherr, L.; Bischoff, M.; Lattar, S.M.; Noto Llana, M.; Pfortner, H.; Niemann, S.; Geraci, J.; Van de Vyver, H.; Fraunholz, M.J.; Cheung, A.L.; et al. Sigma Factor SigB Is Crucial to Mediate Staphylococcus aureus Adaptation during Chronic Infections. PLoS Pathog. 2015, 11, e1004870. [Google Scholar] [CrossRef]
- Tuchscherr, L.; Geraci, J.; Loffler, B. Staphylococcus aureus Regulator Sigma B is Important to Develop Chronic Infections in Hematogenous Murine Osteomyelitis Model. Pathogens 2017, 6, 31. [Google Scholar] [CrossRef] [Green Version]
- Vijay, K.; Brody, M.S.; Fredlund, E.; Price, C.W. A PP2C phosphatase containing a PAS domain is required to convey signals of energy stress to the sigmaB transcription factor of Bacillus subtilis. Mol. Microbiol. 2000, 35, 180–188. [Google Scholar] [CrossRef]
- Bischoff, M.; Dunman, P.; Kormanec, J.; Macapagal, D.; Murphy, E.; Mounts, W.; Berger-Bachi, B.; Projan, S. Microarray-based analysis of the Staphylococcus aureus sigmaB regulon. J. Bacteriol. 2004, 186, 4085–4099. [Google Scholar] [CrossRef] [Green Version]
- Dalebroux, Z.D.; Svensson, S.L.; Gaynor, E.C.; Swanson, M.S. ppGpp conjures bacterial virulence. Microbiol. Mol. Biol. Rev. 2010, 74, 171–199. [Google Scholar] [CrossRef] [PubMed] [Green Version]
- Geiger, T.; Kastle, B.; Gratani, F.L.; Goerke, C.; Wolz, C. Two small (p)ppGpp synthases in Staphylococcus aureus mediate tolerance against cell envelope stress conditions. J. Bacteriol. 2014, 196, 894–902. [Google Scholar] [CrossRef] [PubMed] [Green Version]
- Reiss, S.; Pane-Farre, J.; Fuchs, S.; Francois, P.; Liebeke, M.; Schrenzel, J.; Lindequist, U.; Lalk, M.; Wolz, C.; Hecker, M.; et al. Global analysis of the Staphylococcus aureus response to mupirocin. Antimicrob. Agents Chemother. 2012, 56, 787–804. [Google Scholar] [CrossRef] [PubMed] [Green Version]
- Meinnel, T.; Mechulam, Y.; Blanquet, S. Methionine as translation start signal: A review of the enzymes of the pathway in Escherichia coli. Biochimie 1993, 75, 1061–1075. [Google Scholar] [CrossRef]
- Blake, K.L.; O’Neill, A.J.; Mengin-Lecreulx, D.; Henderson, P.J.; Bostock, J.M.; Dunsmore, C.J.; Simmons, K.J.; Fishwick, C.W.; Leeds, J.A.; Chopra, I. The nature of Staphylococcus aureus MurA and MurZ and approaches for detection of peptidoglycan biosynthesis inhibitors. Mol. Microbiol. 2009, 72, 335–343. [Google Scholar] [CrossRef]
- Halsey, C.R.; Lei, S.; Wax, J.K.; Lehman, M.K.; Nuxoll, A.S.; Steinke, L.; Sadykov, M.; Powers, R.; Fey, P.D. Amino Acid Catabolism in Staphylococcus aureus and the Function of Carbon Catabolite Repression. mBio 2017, 8. [Google Scholar] [CrossRef] [Green Version]
- Townsend, D.E.; Kaenjak, A.; Jayaswal, R.K.; Wilkinson, B.J. Proline is biosynthesized from arginine in Staphylococcus aureus. Microbiology 1996, 142 Pt 6, 1491–1497. [Google Scholar] [CrossRef] [Green Version]
- Wetzel, K.J.; Bjorge, D.; Schwan, W.R. Mutational and transcriptional analyses of the Staphylococcus aureus low-affinity proline transporter OpuD during in vitro growth and infection of murine tissues. FEMS Immunol. Med. Microbiol. 2011, 61, 346–355. [Google Scholar] [CrossRef]
- Stockland, A.E.; San Clemente, C.L. Lactate dehydrogenase activity in certain strains of Staphylococcus aureus. J. Bacteriol. 1968, 95, 74–80. [Google Scholar]
- Fuller, J.R.; Vitko, N.P.; Perkowski, E.F.; Scott, E.; Khatri, D.; Spontak, J.S.; Thurlow, L.R.; Richardson, A.R. Identification of a lactate-quinone oxidoreductase in Staphylococcus aureus that is essential for virulence. Front. Cell Infect. Microbiol. 2011, 1, 19. [Google Scholar] [CrossRef] [Green Version]
- Kim, S.J.; Chang, J.; Singh, M. Peptidoglycan architecture of Gram-positive bacteria by solid-state NMR. Biochim. Biophys. Acta 2015, 1848, 350–362. [Google Scholar] [CrossRef] [PubMed] [Green Version]
- Stulke, J.; Hillen, W. Carbon catabolite repression in bacteria. Curr. Opin. Microbiol. 1999, 2, 195–201. [Google Scholar] [CrossRef]
- Horsburgh, M.J.; Aish, J.L.; White, I.J.; Shaw, L.; Lithgow, J.K.; Foster, S.J. sigmaB modulates virulence determinant expression and stress resistance: Characterization of a functional rsbU strain derived from Staphylococcus aureus 8325-4. J. Bacteriol. 2002, 184, 5457–5467. [Google Scholar] [CrossRef] [PubMed] [Green Version]
- O’Leary, J.O.; Langevin, M.J.; Price, C.T.; Blevins, J.S.; Smeltzer, M.S.; Gustafson, J.E. Effects of sarA inactivation on the intrinsic multidrug resistance mechanism of Staphylococcus aureus. FEMS Microbiol. Lett. 2004, 237, 297–302. [Google Scholar] [CrossRef]
- Wolff, S.; Hahne, H.; Hecker, M.; Becher, D. Complementary analysis of the vegetative membrane proteome of the human pathogen Staphylococcus aureus. Mol. Cell Proteom. 2008, 7, 1460–1468. [Google Scholar] [CrossRef] [Green Version]
- Bradford, M.M. A rapid and sensitive method for the quantitation of microgram quantities of protein utilizing the principle of protein-dye binding. Anal. Biochem. 1976, 72, 248–254. [Google Scholar] [CrossRef]
- Voruganti, S.; Lacroix, J.C.; Rogers, C.N.; Rogers, J.; Matts, R.L.; Hartson, S.D. The anticancer drug AUY922 generates a proteomics fingerprint that is highly conserved among structurally diverse Hsp90 inhibitors. J. Proteome Res. 2013, 12, 3697–3706. [Google Scholar] [CrossRef] [Green Version]
- Cox, J.; Mann, M. MaxQuant enables high peptide identification rates, individualized p.p.b.-range mass accuracies and proteome-wide protein quantification. Nat. Biotechnol. 2008, 26, 1367–1372. [Google Scholar] [CrossRef]
- Cox, J.; Neuhauser, N.; Michalski, A.; Scheltema, R.A.; Olsen, J.V.; Mann, M. Andromeda: A peptide search engine integrated into the MaxQuant environment. J. Proteome Res. 2011, 10, 1794–1805. [Google Scholar] [CrossRef]
- Zhang, W.; Zhang, J.; Xu, C.; Li, N.; Liu, H.; Ma, J.; Zhu, Y.; Xie, H. LFQuant: A label-free fast quantitative analysis tool for high-resolution LC-MS/MS proteomics data. Proteomics 2012, 12, 3475–3484. [Google Scholar] [CrossRef]
- Tyanova, S.; Cox, J. Perseus: A Bioinformatics Platform for Integrative Analysis of Proteomics Data in Cancer Research. Methods Mol. Biol. 2018, 1711, 133–148. [Google Scholar] [CrossRef] [PubMed] [Green Version]
- Tyanova, S.; Temu, T.; Sinitcyn, P.; Carlson, A.; Hein, M.Y.; Geiger, T.; Mann, M.; Cox, J. The Perseus computational platform for comprehensive analysis of (prote)omics data. Nat. Methods 2016, 13, 731–740. [Google Scholar] [CrossRef] [PubMed]
- Hattangady, D.S.; Singh, A.K.; Muthaiyan, A.; Jayaswal, R.K.; Gustafson, J.E.; Ulanov, A.V.; Li, Z.; Wilkinson, B.J.; Pfeltz, R.F. Genomic, Transcriptomic and Metabolomic Studies of Two Well-Characterized, Laboratory-Derived Vancomycin-Intermediate Staphylococcus aureus Strains Derived from the Same Parent Strain. Antibiotics 2015, 4, 76–112. [Google Scholar] [CrossRef] [PubMed]
- Livak, K.J.; Schmittgen, T.D. Analysis of relative gene expression data using real-time quantitative PCR and the 2(-Delta Delta C(T)) Method. Methods 2001, 25, 402–408. [Google Scholar] [CrossRef]
Figure 1.
Cartoon indicating protein concentrations and gene expressions associated with fatty acid biosynthesis that are altered in SH1000-TTORS-1 compared to SH1000. Up and down arrows next to protein symbols or gene names denote increased and decreased concentration/expression in SH1000-TTORS-1 compared to SH1000. Proteins that were detected in both SH1000-TTORS-1 and SH1000 at insignificantly different (p ≥ 0.05) concentrations are labeled with an asterisk (*). Genes shown and the products they encode are: fapR, fatty acid biosynthesis transcriptional regulator; plsX, glycerol-3-phosphate acyltransferase; fabD, malonyl-CoA-acyl carrier protein transacylase; acpP, acyl carrier protein; and fabZ, 3-hydroxyacyl-acyl carrier protein dehydratase. Proteins shown are: FabD, malonyl-CoA-acyl carrier protein transacylase; fabG/FabG, 3-oxoacyl-acyl-carrier-protein reductase; ACP, acyl carrier protein; ACC = AccB, acetyl-CoA carboxylase biotin carboxyl carrier protein subunit, and AccC, acetyl-CoA carboxylase biotin carboxyl carrier protein subunit; FabH, β-ketoacyl-acyl carrier protein synthase; FabI, enoyl-ACP reductase; PanE, 2-dehydropantoate 2-reductase; and CoaBC, bifunctional phosphopantothenoylcysteine decarboxylase/phosphopantothenate-cysteine ligase.

Figure 2.
Diagram indicating protein and metabolite concentrations and gene expressions associated with central metabolism that are altered in SH1000-TTORS-1 compared to SH1000. Up and down arrows next to protein symbols, gene names or metabolites denote increased and decreased concentration/expression in SH1000-TTORS-1 compared to SH1000. Proteins and metabolites that were detected in both SH1000-TTORS-1 and SH1000 at insignificantly different (p ≥ 0.05) concentrations are labeled with an asterisk (*). Genes shown and the products they encode are: pta, phosphotransacetylase; and ackA, acetate kinase. Proteins shown are: Glk, glucokinase; FbaA, fructose-bisphosphate aldolase class II; GapA1, glyceraldehyde-3-phosphate dehydrogenase; GapA2, glyceraldehyde-3-phosphate dehydrogenase 2; GpmI, 2,3-bisphosphoglycerate-independent phosphoglycerate mutase; Lqo, lactate:quinone oxidoreductase; MaeB, malate dehydrogenase; PycA, pyruvate carboxylase; CidC, pyruvate oxidase; PdhA, pyruvate dehydrogenase complex, E1 component subunit alpha; PdhB, pyruvate dehydrogenase complex, E1 component subunit beta; PdhC, branched-chain alpha-keto acid dehydrogenase subunit E2; PdhD, dihydrolipoamide dehydrogenase; AcnA, citrate synthase; CitB, aconitate hydratase; Icd, isocitrate dehydrogenase; SucD, succinyl-CoA synthetase subunit alpha; SdhC, succinate dehydrogenase cytochrome β-558 subunit; Sdh, succinate dehydrogenase flavoprotein subunit; SdhB, succinate dehydrogenase iron-sulfur subunit; FumC, fumarate hydratase class II; Mqo-1, malate:quinone oxidoreductase; AnsA, L-asparaginase; AspA, uncharacterized aspartate/methionine/tyrosine aminotransferase; RocD, ornithine-oxo-acid transaminase; ProC, pyrroline-5-carboxylate reductase.


Table 1.
Proteins altered in SH1000-TTORS-1 compared to SH1000 (p ≤ 0.05), and those only detected in SH1000-TTORS-1 or SH1000.
Table 1.
Proteins altered in SH1000-TTORS-1 compared to SH1000 (p ≤ 0.05), and those only detected in SH1000-TTORS-1 or SH1000.
| a Locus ID | Protein Symbol | Description | Functional Category | Log2-Fold Change |
|---|---|---|---|---|
| Increased in SH1000-TTORS-1 compared to SH1000 | ||||
| SAOUHSC_00356 | YkoI | membrane protein | uncharacterized | 2.1 |
| SAOUHSC_00452 | YaaQ | cyclic-di-AMP receptor | uncharacterized | 1.4 |
| SAOUHSC_00468 | reactive intermediate/imine deaminase | uncharacterized | 1.5 | |
| SAOUHSC_00604 | WrbA | multimeric flavodoxin | uncharacterized | 2.5 |
| SAOUHSC_00833 | nitroreductase | uncharacterized | 1.9 | |
| SAOUHSC_00850 | SUF system FeS assembly protein | uncharacterized | 1.6 | |
| SAOUHSC_00894 | RocD | ornithine-oxo-acid transaminase | amino acid metabolism | 1.8 |
| SAOUHSC_00921 | FabF | 3-Oxoacyl-synthase | lipid metabolism | 1.8 |
| SAOUHSC_00942 | RelQ | GTP pyrophosphokinase | nucleotide metabolism | 1.4 |
| SAOUHSC_01178 | CoaBC | bifunctional phosphopantothenoylcysteine decarboxylase/phosphopantothenate-cysteine ligase | cofactors and secondary metabolites | 1.3 |
| SAOUHSC_01186 | PrpC | serine/threonine protein phosphatase | uncharacterized | 1.1 |
| SAOUHSC_01198 | FabD | malonyl CoA-acyl carrier protein transacylase | lipid metabolism | 3.0 |
| SAOUHSC_01218 | SucD | succinyl-CoA synthetase subunit alpha | carbohydrate metabolism | 4.0 |
| SAOUHSC_01261 | CinA | competence-damage inducible protein | stress response | 2.6 |
| SAOUHSC_01264 | 71 aa protein | uncharacterized | 18.4 | |
| SAOUHSC_01346 | OpuD | proline/choline/glycine betaine transporter | transporter | 3.0 |
| SAOUHSC_01348 | YneP | acyl-CoA thioesterase | uncharacterized | 6.1 |
| SAOUHSC_01401 | LysA | diaminopimelate decarboxylase | amino acid metabolism | 1.2 |
| SAOUHSC_01490 | Hup | DNA-binding protein HU | DNA replication, recombination and repair | 1.3 |
| SAOUHSC_01594 | predicted oxidoreductase | uncharacterized | 1.9 | |
| SAOUHSC_01768 | Tag | 3-methyladenine DNA glycosylase | DNA replication, recombination and repair | 1.7 |
| SAOUHSC_01814 | universal stress protein | uncharacterized | 1.4 | |
| SAOUHSC_02029 | phi ETA orf 56-like protein | uncharacterized | 1.3 | |
| SAOUHSC_02150 | thioredoxin | uncharacterized | 2.5 | |
| SAOUHSC_02298 | SigB | RNA polymerase sigma factor | stress response | 1.3 |
| SAOUHSC_02301 | RsbU | SigmaB regulation protein | stress response | 1.7 |
| SAOUHSC_02365 | MurZ | UDP-N-acetylglucosamine 1-carboxyvinyltransferase | cell wall metabolism | 1.2 |
| SAOUHSC_02370 | acetyltranferase GNAT family | uncharacterized | 2.1 | |
| SAOUHSC_02390 | lytic regulatory protein | uncharacterized | 1.7 | |
| SAOUHSC_02447 | CurA | NADPH-dependent curcumin reductase | uncharacterized | 5.7 |
| SAOUHSC_02604 | oxidoreductase | uncharacterized | 9.2 | |
| SAOUHSC_02626 | 139 aa protein | uncharacterized | 1.3 | |
| SAOUHSC_02665 | general stress protein 26 | uncharacterized | 2.1 | |
| SAOUHSC_02689 | YndB | conserved protein | uncharacterized | 1.8 |
| SAOUHSC_02737 | epimerase/dehydratase | uncharacterized | 1.7 | |
| SAOUHSC_02774 | alkylhydroperoxidase family enzyme | uncharacterized | 3.5 | |
| SAOUHSC_02827 | GNAT superfamily predicted acetyltransferase | uncharacterized | 2.6 | |
| SAOUHSC_02849 | CidC | pyruvate oxidase | carbohydrate metabolism | 1.8 |
| SAOUHSC_02980 | cysteine hydrolase | uncharacterized | 1.4 | |
| Decreased in SH1000-TTORS-1 compared to SH1000 | ||||
| SAOUHSC_00002 | DnaN | DNA polymerase III subunit beta | DNA replication, recombination and repair | −1.4 |
| SAOUHSC_00019 | PurA | adenylosuccinate synthetase | nucleotide metabolism | −1.4 |
| SAOUHSC_00074 | periplasmic binding protein | transporter | −2.6 | |
| SAOUHSC_00200 | PrsW | membrane proteinase | uncharacterized | −1.7 |
| SAOUHSC_00204 | Hmp | globin domain-containing protein | uncharacterized | −1.4 |
| SAOUHSC_00284 | Hel | 5′-Nucleotidase | nucleotide metabolism | −3.4 |
| SAOUHSC_00362 | 208 aa protein | uncharacterized | −1.9 | |
| SAOUHSC_00369 | prolipoprotein diacylglyceryl transferase | uncharacterized | −1.7 | |
| SAOUHSC_00417 | esterase/lipase | uncharacterized | −2.2 | |
| SAOUHSC_00442 | DnaX | DNA polymerase III subunits gamma and tau | DNA replication, recombination and repair | −1.6 |
| SAOUHSC_00461 | MetG | methionyl-tRNA synthetase | protein synthesis | −1.3 |
| SAOUHSC_00474 | RplY | 50S ribosomal protein L25/general stress protein Ctc | protein synthesis | −1.5 |
| SAOUHSC_00483 | 133 aa protein | uncharacterized | −1.5 | |
| SAOUHSC_00513 | 23S rRNA (guanosine(2251)-2′-O)-methyltransferase RlmB | protein synthesis | −1.6 | |
| SAOUHSC_00542 | phosphatase | uncharacterized | −1.5 | |
| SAOUHSC_00578 | MvaD | mevalonate diphosphate decarboxylase | cofactors and secondary metabolites | −1.2 |
| SAOUHSC_00634 | MntC | ABC transporter substrate binding protein | transporter | −2.5 |
| SAOUHSC_00637 | MntA | uncharacterized ABC-type Mn2+/Zn2+ transport system, ATPase component | transporter | −2.3 |
| SAOUHSC_00669 | YkaA | conserved protein | uncharacterized | −1.5 |
| SAOUHSC_00717 | electron transfer DM13 | uncharacterized | −3.0 | |
| SAOUHSC_00785 | TrxB | thioredoxin reductase | amino acid metabolism | −1.8 |
| SAOUHSC_00795 | GapA1 | glyceraldehyde-3-phosphate dehydrogenase | carbohydrate metabolism | −1.6 |
| SAOUHSC_00798 | GpmI | 2,3-Bisphosphogylcerate-independent phosphoglycerate mutase | carbohydrate metabolism | −1.6 |
| SAOUHSC_00819 | CspC | cold shock protein | stress response | −4.6 |
| SAOUHSC_00838 | YwqG | 292 aa protein | uncharacterized | −1.9 |
| SAOUHSC_00933 | TrpS | tryptophanyl-tRNA synthetase | protein synthesis | −1.2 |
| SAOUHSC_00985 | MenB | 1,4-dihydroxy-2-naphthoyl-CoA synthase | cofactors and secondary metabolites | −1.4 |
| SAOUHSC_01040 | PdhA | pyruvate dehydrogenase complex, E1 subunit alpha | carbohydrate metabolism | −1.5 |
| SAOUHSC_01041 | PdhB | pyruvate dehydrogenase complex, E1 subunit beta | carbohydrate metabolism | −1.5 |
| SAOUHSC_01043 | PdhD | dihydrolipoamide dehydrogenase | carbohydrate metabolism | −1.3 |
| SAOUHSC_01058 | TypA | GTP-binding protein | unclassified | −1.7 |
| SAOUHSC_01064 | PycA | pyruvate carboxylase | carbohydrate metabolism | −1.7 |
| SAOUHSC_01091 | SpoU | tRNA G18 (ribose-2′-O)-methylase | uncharacterized | −1.4 |
| SAOUHSC_01093 | PheT | phenylalanyl-tRNA synthetase subunit beta | protein synthesis | −1.4 |
| SAOUHSC_01110 | Ecb | extracellular complement-binding protein | virulence factor | −4.3 |
| SAOUHSC_01163 | RluA family pseudouridine synthase | uncharacterized | −1.7 | |
| SAOUHSC_01488 | heptaprenyl diphosphate synthase subunit 1 | uncharacterized | −1.3 | |
| SAOUHSC_01525 | phage tail tape measure protein | uncharacterized | −2.2 | |
| SAOUHSC_01587 | RluB | ribosomal large subunit pseudouridine synthase B | protein synthesis | −1.3 |
| SAOUHSC_01661 | tRNA A22 N-methylase | uncharacterized | −1.6 | |
| SAOUHSC_01679 | MiaB | tRNA A37 methylthiotransferase | uncharacterized | −1.8 |
| SAOUHSC_01698 | YbhY | RNA-binding protein | uncharacterized | −1.3 |
| SAOUHSC_01716 | PrtC family collagenase-like protease | uncharacterized | −2.7 | |
| SAOUHSC_01735 | tRNA A37 threonylcarbamoyladenosine dehydratase | uncharacterized | −1.6 | |
| SAOUHSC_01810 | MaeB | malate dehydrogenase | carbohydrate metabolism | −2.0 |
| SAOUHSC_01858 | phenylalanyl-tRNA synthetase subunit beta | uncharacterized | −1.5 | |
| SAOUHSC_01901 | Tal | transaldolase | carbohydrate metabolism | −1.4 |
| SAOUHSC_01979 | DNA-binding transcriptional regulator | uncharacterized | −2.0 | |
| SAOUHSC_02096 | 91 aa protein | uncharacterized | −1.6 | |
| SAOUHSC_02102 | Map | methionine aminopeptidase | protein fate | −1.8 |
| SAOUHSC_02133 | PncB | nicotinate phosphoribosyltransferase | cofactors and secondary metabolites | −1.3 |
| SAOUHSC_02139 | pyrazinamidase/nicotinamidase | cofactors and secondary metabolites | −1.5 | |
| SAOUHSC_02258 | fatty acid repression mutant protein/oxidoreductase | uncharacterized | −2.1 | |
| SAOUHSC_02268 | ScrB | sucrose-6-phosphate hydrolase | carbohydrate metabolism | −1.3 |
| SAOUHSC_02343 | AtpG | F0F1 ATP synthase subunit gamma | energy metabolism | −1.3 |
| SAOUHSC_02360 | Tdk | thymidine kinase | nucleotide metabolism | −2.0 |
| SAOUHSC_02525 | AcrB | multidrug efflux pump subunit | uncharacterized | −1.4 |
| SAOUHSC_02544 | MoaB | molybdopterin precursor biosynthesis | cofactors and secondary metabolites | −1.6 |
| SAOUHSC_02549 | ModA | molybdenum ABC transporter substrate-binding protein | transporter | −1.7 |
| SAOUHSC_02574 | NAD/NADP octopine/nopaline Dehydrogenase, alpha-helical domain | uncharacterized | −1.6 | |
| SAOUHSC_02627 | Acetyl esterase/lipase | Uncharacterized | −1.9 | |
| SAOUHSC_02652 | YhdH/YhfP family putative quinone oxidoreductase | Uncharacterized | −1.3 | |
| SAOUHSC_02697 | YecC | amino acid ABC transporter ATP-binding protein | transporter | −1.4 |
| SAOUHSC_02699 | FliY | substrate binding domain of ABC transporters involved in cystine import | transporter | −1.5 |
| SAOUHSC_02739 | PanE | 2-dehydropantoate 2-reductase | cofactors and secondary metabolites | −1.9 |
| SAOUHSC_02767 | NikA | peptide ABC transporter substrate binding protein | transporter | −2.2 |
| SAOUHSC_02791 | pyrophosphohydrolase | DNA replication, recombination and repair | −1.5 | |
| SAOUHSC_02820 | ATP-binding cassette domain of the bacitracin-resistance transporter | uncharacterized | −14.1 | |
| SAOUHSC_02834 | SrtA | sortase | protein fate | −1.7 |
| SAOUHSC_02911 | adenine nucleotide alpha hydrolase superfamily predicted ATPase | uncharacterized | −4.5 | |
| SAOUHSC_02927 | Lqo | lacatate:quinone oxidoreductase | carbohydrate metabolism | −1.7 |
| SAOUHSC_02976 | ManA | mannose-6-phosphate isomerase | carbohydrate metabolism | −2.0 |
| SAOUHSC_03045 | CspB | cold shock protein | stress response | −4.8 |
| Proteins only detected in SH1000-TTORS-1 | ||||
| SAOUHSC_00077 | diderophore synthetase component | uncharacterized | ||
| SAOUHSC_00128 | Cap5O | cap5O protein/UDP-N-acetyl-D- mannosaminuronic acid dehydrogenase | virulence factor | |
| SAOUHSC_00668 | VraG | ABC transporter permease | transporter | |
| SAOUHSC_01279 | hydrolase alpha/beta fold domain-containing protein | uncharacterized | ||
| SAOUHSC_01258 | protein of unknown function | uncharacterized | ||
| SAOUHSC_02460 | aldo/keto reductase | uncharacterized | ||
| SAOUHSC_02866 | YdfJ | membrane protein | uncharacterized | |
| SAOUHSC_02908 | fructosamine-3-kinase | uncharacterized | ||
| SAOUHSC_02935 | GbsR | DNA binding transcriptional regulator | stress response | |
| Proteins only detected in SH1000 | ||||
| SAOUHSC_00197 | glutaryl-CoA dehydrogenase | lipid metabolism | ||
| SAOUHSC_01128 | ArgF | ornithine carbamoyltransferase | amino acid metabolism | |
| SAOUHSC_02648 | L-lactate permease | transporter | ||
a Numbers represent strain NCTC 8325 locus IDs.
Table 2.
Comparison of SH1000-TTORS-1- and SH1000-specific gene expression measured by RT-qPCR.
| Locus ID | Gene Symbol | Function | Fold-Change in Gene Expression in SH1000-TTORS-1 |
|---|---|---|---|
| SAOUHSC_00574 | pta | Phosphate acetyltransferase | 2.7 |
| SAOUHSC_01196 | fapR | Fatty acid biosynthesis transcriptional regulator | 6.3 |
| SAOUHSC_01197 | plsX | Glycerol-3-phosphate acyltransferase | 2.3 |
| SAOUHSC_01201 | acpP | Acyl carrier protein | −2.0 |
| SAOUHSC_01820 | ackA | Acetate kinase | 3.2 |
| SAOUHSC_02336 | fabZ | 3-Hydroxyacyl-(acyl carrier protein) dehydratase | 9.1 |
Table 3.
Metabolites increased (p ≤ 0.05) in SH1000-TTORS-1 compared to SH1000.
| Metabolite Relative Concentration Per Gram Dry Weight (Mean ± SE) | ||||
|---|---|---|---|---|
| Metabolite Class | Metabolite | SH1000 | SH1000-TTORS-1 | Fold Increase SH1000-TTORS-1/SH1000 |
| Amino acids | 3-Hydroxyproline | *N.D. | 18.9 ± 1.0 | |
| Asparagine | 2698.8 ± 211.5 | 38,678.1 ± 4325.2 | 14.3 | |
| Aspartate | 120,734.5 ± 3382.8 | 193,201.1 ± 19,069.7 | 1.6 | |
| Homoserine | 12.1 ± 3.6 | 40.9 ± 4.3 | 3.3 | |
| Lysine | 531.8 ± 236.9 | 1928.6 ± 79.5 | 3.6 | |
| Methyl-lysine | 1163.5 ± 140.8 | 1830 ± 94.7 | 1.6 | |
| N-acetyltryptophan | 343.9 ± 18.5 | 945.1 ± 157.5 | 2.7 | |
| ornithine | 46.1 ± 3.5 | 1058.9 ± 269.4 | 23.0 | |
| Phenylalanine | 3017.4 ± 501.1 | 6954.5 ± 1149.9 | 2.3 | |
| Proline | 7579.6 ± 515.8 | 20,362 ± 2232.6 | 2.7 | |
| Tyrosine | 578 ± 39.3 | 1073.2 ± 78.1 | 1.9 | |
| Polar organic acids | 2-Hydroxyglutaric acid | 35.2 ± 7.6 | 75.4 ± 9.3 | 2.1 |
| 3-Hydroxypropanoic acid | N.D. | 78.05 ± 15.7 | ||
| Fumarate | 44.1 ± 4.2 | 63.8 ± 0.8 | 1.4 | |
| Malonic acid | N.D. | 7.8 ± 2.3 | ||
| Succinate | 431.7 ± 43.7 | 735.6 ± 72.9 | 1.7 | |
| Sugars | N-acetylglucosamine | N.D. | 124.1 ± 15.5 | |
*N.D., not detected.
Table 4.
Metabolites decreased (p ≤ 0.05) in SH1000-TTORS-1 compared to SH1000.
| Metabolite Relative Concentration Per Gram Dry Weight (Mean ± SE) | ||||
|---|---|---|---|---|
| Metabolite Class | Metabolite | SH1000 | SH1000-TTORS-1 | Fold Decrease SH1000/SH1000-TTORS-1 |
| Amines and polyamines | Adenosine | 2358 ± 110.1 | 1251.9 ± 102 | −1.9 |
| Guanosine | 1051.8 ± 127.9 | *N.D. | ||
| Lactamide | 46.2 ± 5.3 | 6.8 ± 2.3 | −6.8 | |
| Amino acids | Cysteine | 130.4 ± 17.1 | 61.2 ± 3.1 | −2.1 |
| Glycine | 8735.5 ± 164.5 | 5519.1 ± 613.2 | −1.6 | |
| N-acetyl-L-serine | 3464.6 ± 323.1 | 482.4 ± 49.4 | −7.2 | |
| Polar organic acids | 2,4-Dihydroxybutaonic acid | 116.0 ± 3.2 | 37.1 ± 3.4 | −3.1 |
| 2-Methyl-2,3-dihydroxypropanoic acid | 1588.6 ± 90.0 | 389.4 ± 50.1 | −4.1 | |
| Aminomalonic acid | 240.0 ± 5.7 | 118.4 ± 18.2 | −2.0 | |
| Gluconic acid | 195.4 ± 31.7 | 27.3 ± 3.7 | −7.2 | |
| Glucuronic acid-6-phosphate | 191.7 ± 73.3 | N.D. | ||
| Glycolic acid | 1430.8 ± 61.4 | 374.2 ± 52.7 | −3.8 | |
| Lactic acid | 15,550.8 ± 896.5 | 9663.5 ± 1296.1 | −1.6 | |
| N-acetylneuraminic acid | 1295.1 ± 113.2 | 307.9 ± 95.8 | −4.2 | |
| Oxamic acid | 93.7 ± 19.6 | 9 ± 7.1 | −10.4 | |
| Sugars | Fructose-1,6-bisphosphate | 657.3 ± 61.7 | 262.4 ± 53.8 | −2.5 |
| Fructose-6-phosphate | 1422.4 ± 271.7 | 523.5 ± 44.6 | −2.7 | |
| Glucose-6-phosphate | 3539.3 ± 770.5 | 485.5 ± 63.2 | −7.3 | |
| Glyceraldehyde | 3.3 ± 1.1 | N.D. | ||
| Mannitol | 17,749.6 ± 749.9 | 8271.7 ± 941.2 | −2.1 | |
| Mannitol-6-phosphate | 36,039.4 ± 347.6 | 16,171 ± 3376.65 | −2.2 | |
| Mannose | 831.2 ± 70.4 | 74.7 ± 14.2 | −11.1 | |
| Sedoheptulose | 138.9 ± 11.8 | 67.8 ± 14.2 | −2.0 | |
| Sedoheptulose-7-phosphate | 722.7 ± 122 | 186 ± 25.3 | −3.9 | |
| Trehalose | 3243.3 ± 892.6 | 127.6 ± 13.2 | −25.4 | |
*N.D., not detected.
© 2019 by the authors. Licensee MDPI, Basel, Switzerland. This article is an open access article distributed under the terms and conditions of the Creative Commons Attribution (CC BY) license (http://creativecommons.org/licenses/by/4.0/).
Share and Cite
MDPI and ACS Style
Torres, N.J.; Hartson, S.D.; Rogers, J.; Gustafson, J.E. Proteomic and Metabolomic Analyses of a Tea-Tree Oil-Selected Staphylococcus aureus Small Colony Variant. Antibiotics 2019, 8, 248. https://doi.org/10.3390/antibiotics8040248
AMA Style
Torres NJ, Hartson SD, Rogers J, Gustafson JE. Proteomic and Metabolomic Analyses of a Tea-Tree Oil-Selected Staphylococcus aureus Small Colony Variant. Antibiotics. 2019; 8(4):248. https://doi.org/10.3390/antibiotics8040248
Chicago/Turabian StyleTorres, Nathanial J., Steven D. Hartson, Janet Rogers, and John E. Gustafson. 2019. "Proteomic and Metabolomic Analyses of a Tea-Tree Oil-Selected Staphylococcus aureus Small Colony Variant" Antibiotics 8, no. 4: 248. https://doi.org/10.3390/antibiotics8040248
Note that from the first issue of 2016, this journal uses article numbers instead of page numbers. See further details here.