Article

Sonophotocatalytic Degradation of Malachite Green by Nanocrystalline Chitosan-Ascorbic Acid@NiFe2O4 Spinel Ferrite

1
Environmental Research Laboratory, Department of Chemistry, Chandigarh University, Gharuan, Mohali 140301, Punjab, India
2
Department of Chemistry, Science and Arts College, Rabigh Campus, King Abdulaziz University, Jeddah 21911, Saudi Arabia
3
Department of Chemistry, College of Science, King Saud University, Riyadh 11451, Saudi Arabia
*
Author to whom correspondence should be addressed.
Coatings 2020, 10(12), 1200; https://doi.org/10.3390/coatings10121200
Submission received: 29 October 2020 / Revised: 1 December 2020 / Accepted: 1 December 2020 / Published: 9 December 2020
(This article belongs to the Special Issue Environmental Coatings on Nano-surfaces and Interfaces)

Abstract

:
Statistics show that more than 700 thousand tons of dye are produced annually across the globe. Around 10–20% of this is used in industrial processes such as printing and dyeing, while about 50% of the dye produced is discharged into the environment without proper physicochemical treatment. Even trace amounts of dye in water can reduce oxygen solubility and have carcinogenic, mutagenic, and toxic effects on aquatic organisms. Therefore, before dye-containing wastewater is discharged into the environment, it must be properly treated. The present study investigates the green synthesis of nickel ferrite NiFe2O4 (NIFE) spinel magnetic nanoparticles (MNPs) via chemical coprecipitation of a solution of Ni2+/Fe3+ in the presence of a biopolymer blend of chitosan (CT) and ascorbic acid (AS). The magnetic nanomaterial was characterized by Fourier transform infrared spectroscopy (FTIR), X-ray diffraction (XRD), scanning electron microscopy–energy dispersive X-ray analysis (SEM-EDX), transmission electron microscopy (TEM), ultraviolet-visible spectroscopy (UV-Vis), differential scanning calorimetry (DSC), and vibrating-sample magnetometry (VSM). The material was further explored as a catalyst for the photocatalytic degradation of malachite green (MG) under visible light irradiation coupled with ultrasonic waves. The combination of 90 min of visible solar light irradiation with 6.35 W·mL−1 ultrasonic power at pH 8 resulted in 99% of the photocatalytic efficiency of chitosan-ascorbic acid@NIFE (CTAS@NIFE) catalyst for 70 mg·L−1 MG. The quenching of the photocatalytic efficiency from 98% to 64% in the presence of isopropyl alcohol (IPA) suggested the involvement of hydroxy (OH) radicals in the mineralization process of MG. The high regression coefficients (R2) of 0.99 for 35, 55, and 70 mg·L−1 MG indicated the sonophotocatalysis of MG by CTAS@NIFE was best defined by a pseudo first-order kinetic model. The mechanism involves the adsorption of MG on the catalyst surface in the first step and thereby mineralization of the MG by the generated hydroxyl radicals (OH) under the influence of visible radiation coupled with 6.34 W·mL−1 ultrasonic power. In the present study the application of photodegradation process with sonochemistry results in 99% of MG mineralization without effecting the material structure unlike happens in the case adsorption process. So, the secondary pollution (generally happens in case of adsorption) can be avoided by reusing the spent material for another application instead of disposing it. Thus, the ecofriendly synthesis protocol, ease in design of experimentation like use of solar irradiation instead of electric power lamps, reusability and high efficiency of the material suggested the study to be potentially economical for industrial development at pilot scale towards wastewater remediation.

Graphical Abstract

1. Introduction

Malachite green (C23H25N2Cl), also known as Basic Green and by the IUPAC name 4-[(4-dimethylaminophenyl)-phenylmethyl]-N,N-dimethylaniline, is a cationic dye generally used as a colorant and disinfectant in a number of food processing and textile industries [1,2,3,4]. Conservation bodies and research organizations have suggested removing it from aquatic systems due to its genotoxicity, carcinogenicity, reproductive toxicity, and immunotoxicity for human and marine life [5,6,7]. Methods of removing dyes from industrial effluents include various physiochemical and biological approaches, such as adsorption [5], ion-exchange [8], fungal decolorization, aerobic-anaerobic degradation [9], and photocatalytic degradation [7]. Among these methods, photocatalytic degradation was found to be most efficient because it involves bombarding the dye solution with light (photons) using a catalyst [10]. This collision excites an electron from the valence band (VB) to the conduction band (CB), triggering the formation of superoxide (O2) and hydroxyl radicals (OH), which attack the dye molecule to mineralize it into small non–toxic entities [11,12]. In association with advanced oxidation processes (AOPs), another rapidly growing field, known as environmental sonochemistry, has been found to be highly effective for tackling toxic organic pollutants in aqueous system [11,13]. In this technique, ultrasonic/pressure waves are generated by the cavitating bubbles inside the organic molecule in a chemical reaction [14,15]. Three mechanisms, namely, pyrolytic degradation, supercritical water reactions, and hydroxyl radical oxidation, have been proposed for the degradation of organic molecules upon interaction with ultrasonic irradiation [16,17]. Thus, to increase the efficiency of the photocatalytic process, sonochemistry was explored further, leading to a technique known as sonophotocatalysis, which requires high ultrasonic power (minimum of 80 W) to have an effect on the degradation process [14].
In the past two decades, nanocrystalline forms of magnetic spinel ferrites (MFe2O4, where M represents a divalent ion, such as Mn2+, Ni2+, Co2+) have been studied due to their size, shape, purity, surface area, and catalytic, magnetic and chemical properties [18,19]. Various spinel ferrites with variable aspect ratios, e.g., CoFe2O4 [20], MgFeO4/Bi2MoO6 [21], NiFe2O4:Mg2+ [22], ZnO/ZnFe2O4 [23], and ZrxMg0.2−xCo0.8−xFe2O4 [24] have been utilized for the photocatalysis of MG dye. In the present study, we synthesized the nanocrystalline NiFe2O4 spinel ferrites by the chemical coprecipitation method using the environmentally friendly synthesis protocols termed as green route via utilization of the reducing capacity of chitosan-ascorbic acid (CT-AS) biopolymer blend. Nickel ferrite is an important spinel ferrite material with distinctive applications, such as in microwave devices, catalysts, photomagnetic materials, drug delivery, and magnetic storage systems [22,25,26]. Nickel ferrite has an inverse spinel cubic structure with Fe3+ ions at tetrahedral sites and Ni2+ ions at octahedral sites. Following a change in size and shape, it shows paramagnetic, super-paramagnetic, and ferromagnetic behavior [27]. Because of their low bandgap energy values (Eg = 1.87 eV) and high magnetic properties, these nanoparticles could be used as a potential photocatalyst for environmental decontamination and are easily separable by an external magnet after use [25,27].
However, at the nanoscale the photocatalytic efficiencies of nanoparticles are hindered to a greater extent by process of agglomeration. To overcome this problem, a green route was investigated to synthesize them using the reducing capacity of the chitosan and ascorbic acid biopolymer blend. This not only stabilized the magnetic nanoparticles (MNPs) but also increased the surface functional density and the photocatalytic efficiency by contracting the band gap energy (Eg = 1.32 eV) and particle size (5.76 nm). Chitosan is a biodegradable, non-toxic biopolymer extracted from naturally abundant chitin, and is used as a biosorbent and biosensor, and in the delivery of drugs, and has a wide range of applications for the treatment of wastewater [28,29]. It is composed of D-glucosamine and N-acetyl-D-glucosamine linked by β-(1,4)-glycosidic bonds associated with a large number of hydroxyl and amino groups [29]. These functional groups provide a large number of chelation sites for the number of metal ions to reduce them in nanoparticles and demineralization of organic molecules under UV-Vis radiation [30]. Furthermore, to increase the rate of hydroxyl radical generation in the presence of light, chitosan was grafted with L-ascorbic acid (vitamin C) [31]. L-Ascorbic acid is a naturally occurring water-soluble organic acid that is present in various foodstuffs and biological systems [32,33]. The chemical formula of ascorbic acid is 2-oxo-L-thero-hexono-1,4-lactone-2,3-enediol, which is a γ-lactone structure with an L-enantiomer with both reducing agent and stabilizing properties [33]. It was found to be highly unstable when exposed to light and converts to dehydroascorbic acid by releasing hydroxyl radicals. Thus, it was derivatized by chitosan to induce greater stability in the chemical structure with enhanced photo effects [34].
The novelty of this work is the fabrication of spinel nickel ferrite (NIFE) MNPs using green synthesis via a chemical coprecipitation method. For the first time, this work reports the utilization of the enhanced reducing capacity of a blend of chitosan and ascorbic acid. The effect of surface functionalization of NIFE MNPs by a CT-AS blend on spinel formation, plane location, enthalpy of fusion, enthalpy of crystallization energy band gap, and magnetic properties was studied and explored in an ordered manner. The characteristics of the material were further explored as a catalyst for the effective degradation of MG dye under visible solar irradiation with ultrasonic waves, which has also been rarely investigated in the literature.

2. Methods and Material

2.1. Chemicals and Reagents

Nickel nitrate (Ni (NO3)2·6H2O, 290.81 g·mol−1 ACS grade) and ferric nitrate (Fe(NO3)3·9H2O, 403.95 g·mol−1 reagent grade) were purchased from Merck Millipore (Mumbai, MH, India). Chitosan (low molecular weight) and L-ascorbic acid (>99%) were purchased from Sigma Aldrich (Bangalore, KA, India). Malachite green was purchased from Loba Chemie (Mumbai, MH, India). All of the chemicals were used without further refinement and deionized water was used for the preparation of the solutions.

2.2. Synthesis of CTAS@NIFE Nanocomposite

An environmentally friendly synthesis protocol involving chemical coprecipitation method was utilized to synthesize the nanocomposite material with some modification as reported elsewhere [25,27]. In this method we did not use any external reducing agent; instead, we utilized the reducing power of chitosan and ascorbic acid for the nucleation and stabilization of the ferrite nanoparticles. First, a biopolymer blend was prepared by mixing aqueous solutions of 1.5% (w/v) ascorbic acid and 3% (w/v) chitosan in a three-necked round-bottom flask at 40 °C under 800 rpm stirring for 120 min. To this solution, 1 mM Ni(NO3)2·6H2O and 2 mM Fe(NO3)3·9H2O in a molar ratio of 1:2 were added and left stirring at 90 °C under observance at a variable time interval. UV-Vis spectroscopy (UV-1900, Shimadzu, Kyoto, Japan, 10 mm path length, volume 3.5 mL with PTFE lid) was employed to check the progress of the reaction with respect to the time profile given in Figure S1. The first aliquot was taken after 10 min of mixing for an absorbance check because a very light blackish color appeared. Following the same trend, samples were taken every 60 min for absorbance checks until 900 min when a pale brownish-black color appeared with precipitate. The nanostructured spinel ferrite was filtered (Whatman qualitative filter paper, Grade 1 of 11 μm pore size) and washed 7–8 times using deionized water to remove unreacted species. The product was dried in a hot air oven at 60 °C for 4 h and stored in borosilicate glass sample vials at 25 °C in dry environment for further characterization and chemical experiments.

2.3. Characterization of Nickel Ferrite Nanoparticles

The properties and structure of NIFE MNPs functionalized by a blend of chitosan and ascorbic acid were examined by FTIR, XRD, SEM–EDX, TEM, DSC, UV-Vis and VSM. The different types of bonding and functional groups present in the material were investigated using a PE 1600 Fourier transform infrared (FTIR) spectrometer (Perkin Elmer, Waltham, MA, USA). The frequency range of FTIR is 400–4000 cm−1 with transmission mode. An Ultima XRD diffractometer (Rigaku, Tokyo, Japan) was used to determine the crystalline structure of the nanocomposite and predictable particles in correlation with TEM. The size of the particles and dispersal of the nanocomposite material in the polymer matrix of the combined nanocomposite were investigated using a JEM 2100 transmission electron microscope (JEOL, Tokyo, Japan). Surface morphology and composition of the synthesized nanocomposite material was observed through scanning electron microscope (SEM; GSM 6510LV, JEOL) in association with EDX. To identify the chemical composition and homogeneity of CTAS@NIFE, an energy dispersive X-ray system was used (EDX-SEM; GSM 6510LV, JEOL). Differential scanning colorimetry (DSC (822e), Mettler Toledo, Columbus, OH, USA) was used to investigate the oxidation and other chemical reactions. A 20 kHz ultrasonic probe Q1375 with power of 1375 W was used as the ultrasound source. It was equipped with a titanium probe (diameter 6 mm) with voltage of 220 V/60 Hz. A UV-1900 UV-Vis spectrophotometer was used for the analysis of CTAS@NIFE samples after the photocatalytic reaction. The vibrating sample magnetometry (VSM, PAR 155 Quantum Design, Manchester, UK) technique was utilized to observe the changes in the magnetic properties of the NIFE MNPs before and after functionalization with biopolymer blend CT-AS. The pH of the solution was adjusted using 0.1 M HCl and 0.1 M NaOH with an Elico Li 120 pH meter (Hyderabad, India).

2.4. Sonophotocatalysis Experiment

The photocatalytic technique coupled with ultrasound waves was used to observe the degradation of MG under the batch method. A 20 mL aliquot was prepared of variable concentration of MG (10–70 mg·L−1), solution pH (1–8), ultrasonic power intensity (4.15–6.35 W·mL−1), and sonication time (5–90 min) under visible light irradiation using a probe sonicator and 20 mg of nanocatalyst at 25 °C. The efficiency of the photocatalyst was analyzed by the extent of MG degraded (%) in aqueous solution. The MG effluents collected after the sonophotocatalytic reaction were analyzed using a UV-Vis spectrophotometer at maximum absorption wavelength (λmax = 617 nm). The percentage of MG degradation was evaluated by Equation (1):
% degradation = C o C t C o × 100
where Co is the initial MG concentration and Ct is the concentration of MG after the sonophotocatalysis reaction. The experimental data obtained was processed using Origin 9.1 and MS Excel software (2019).

3. Results and Discussion

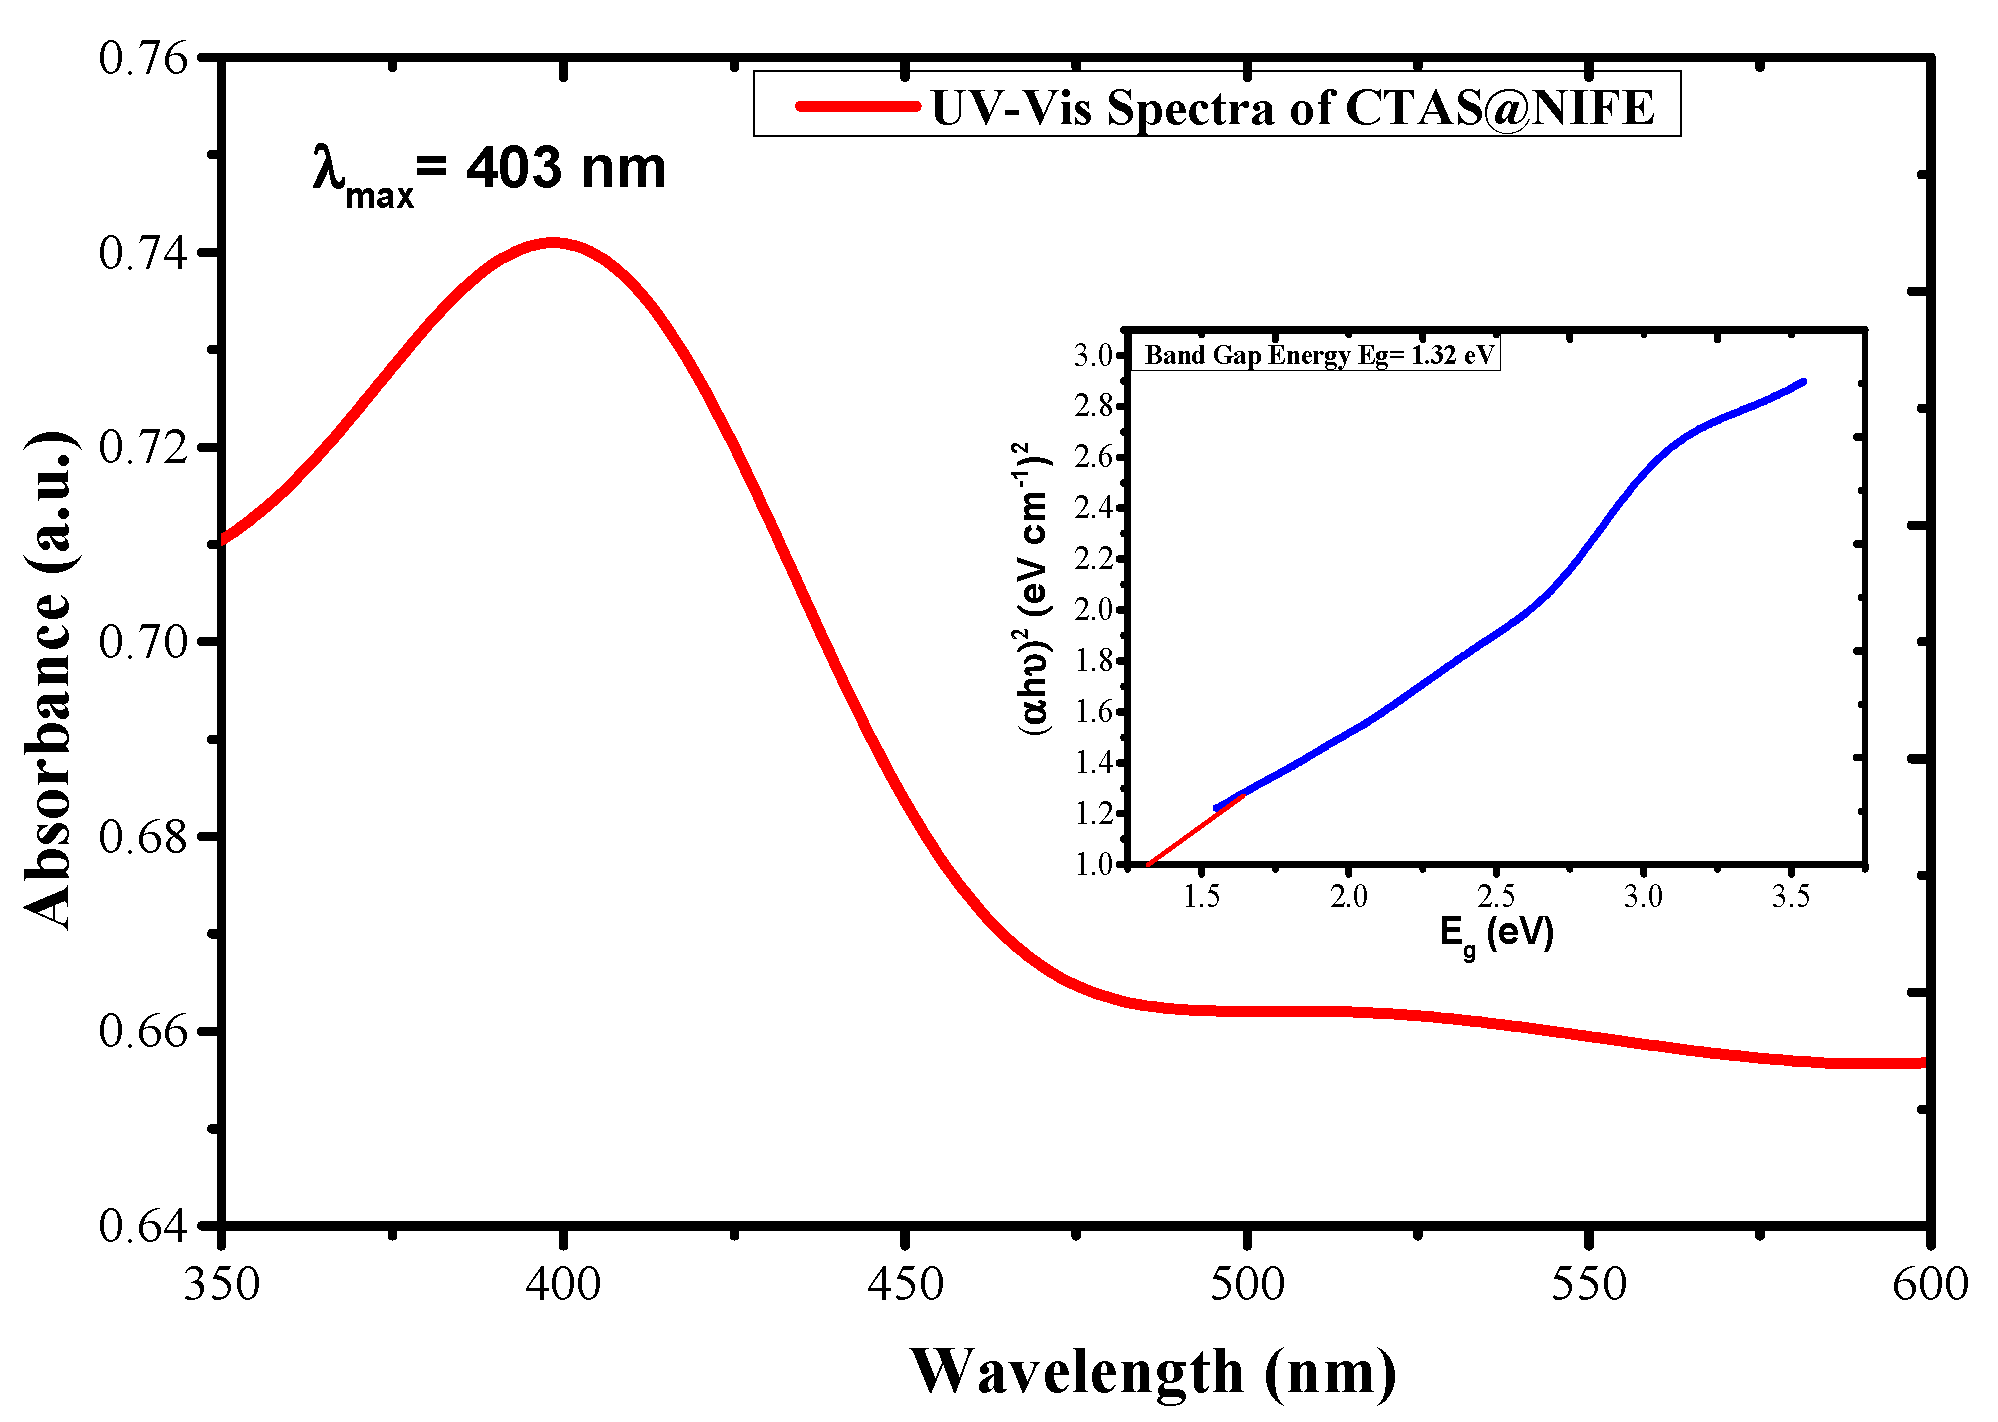
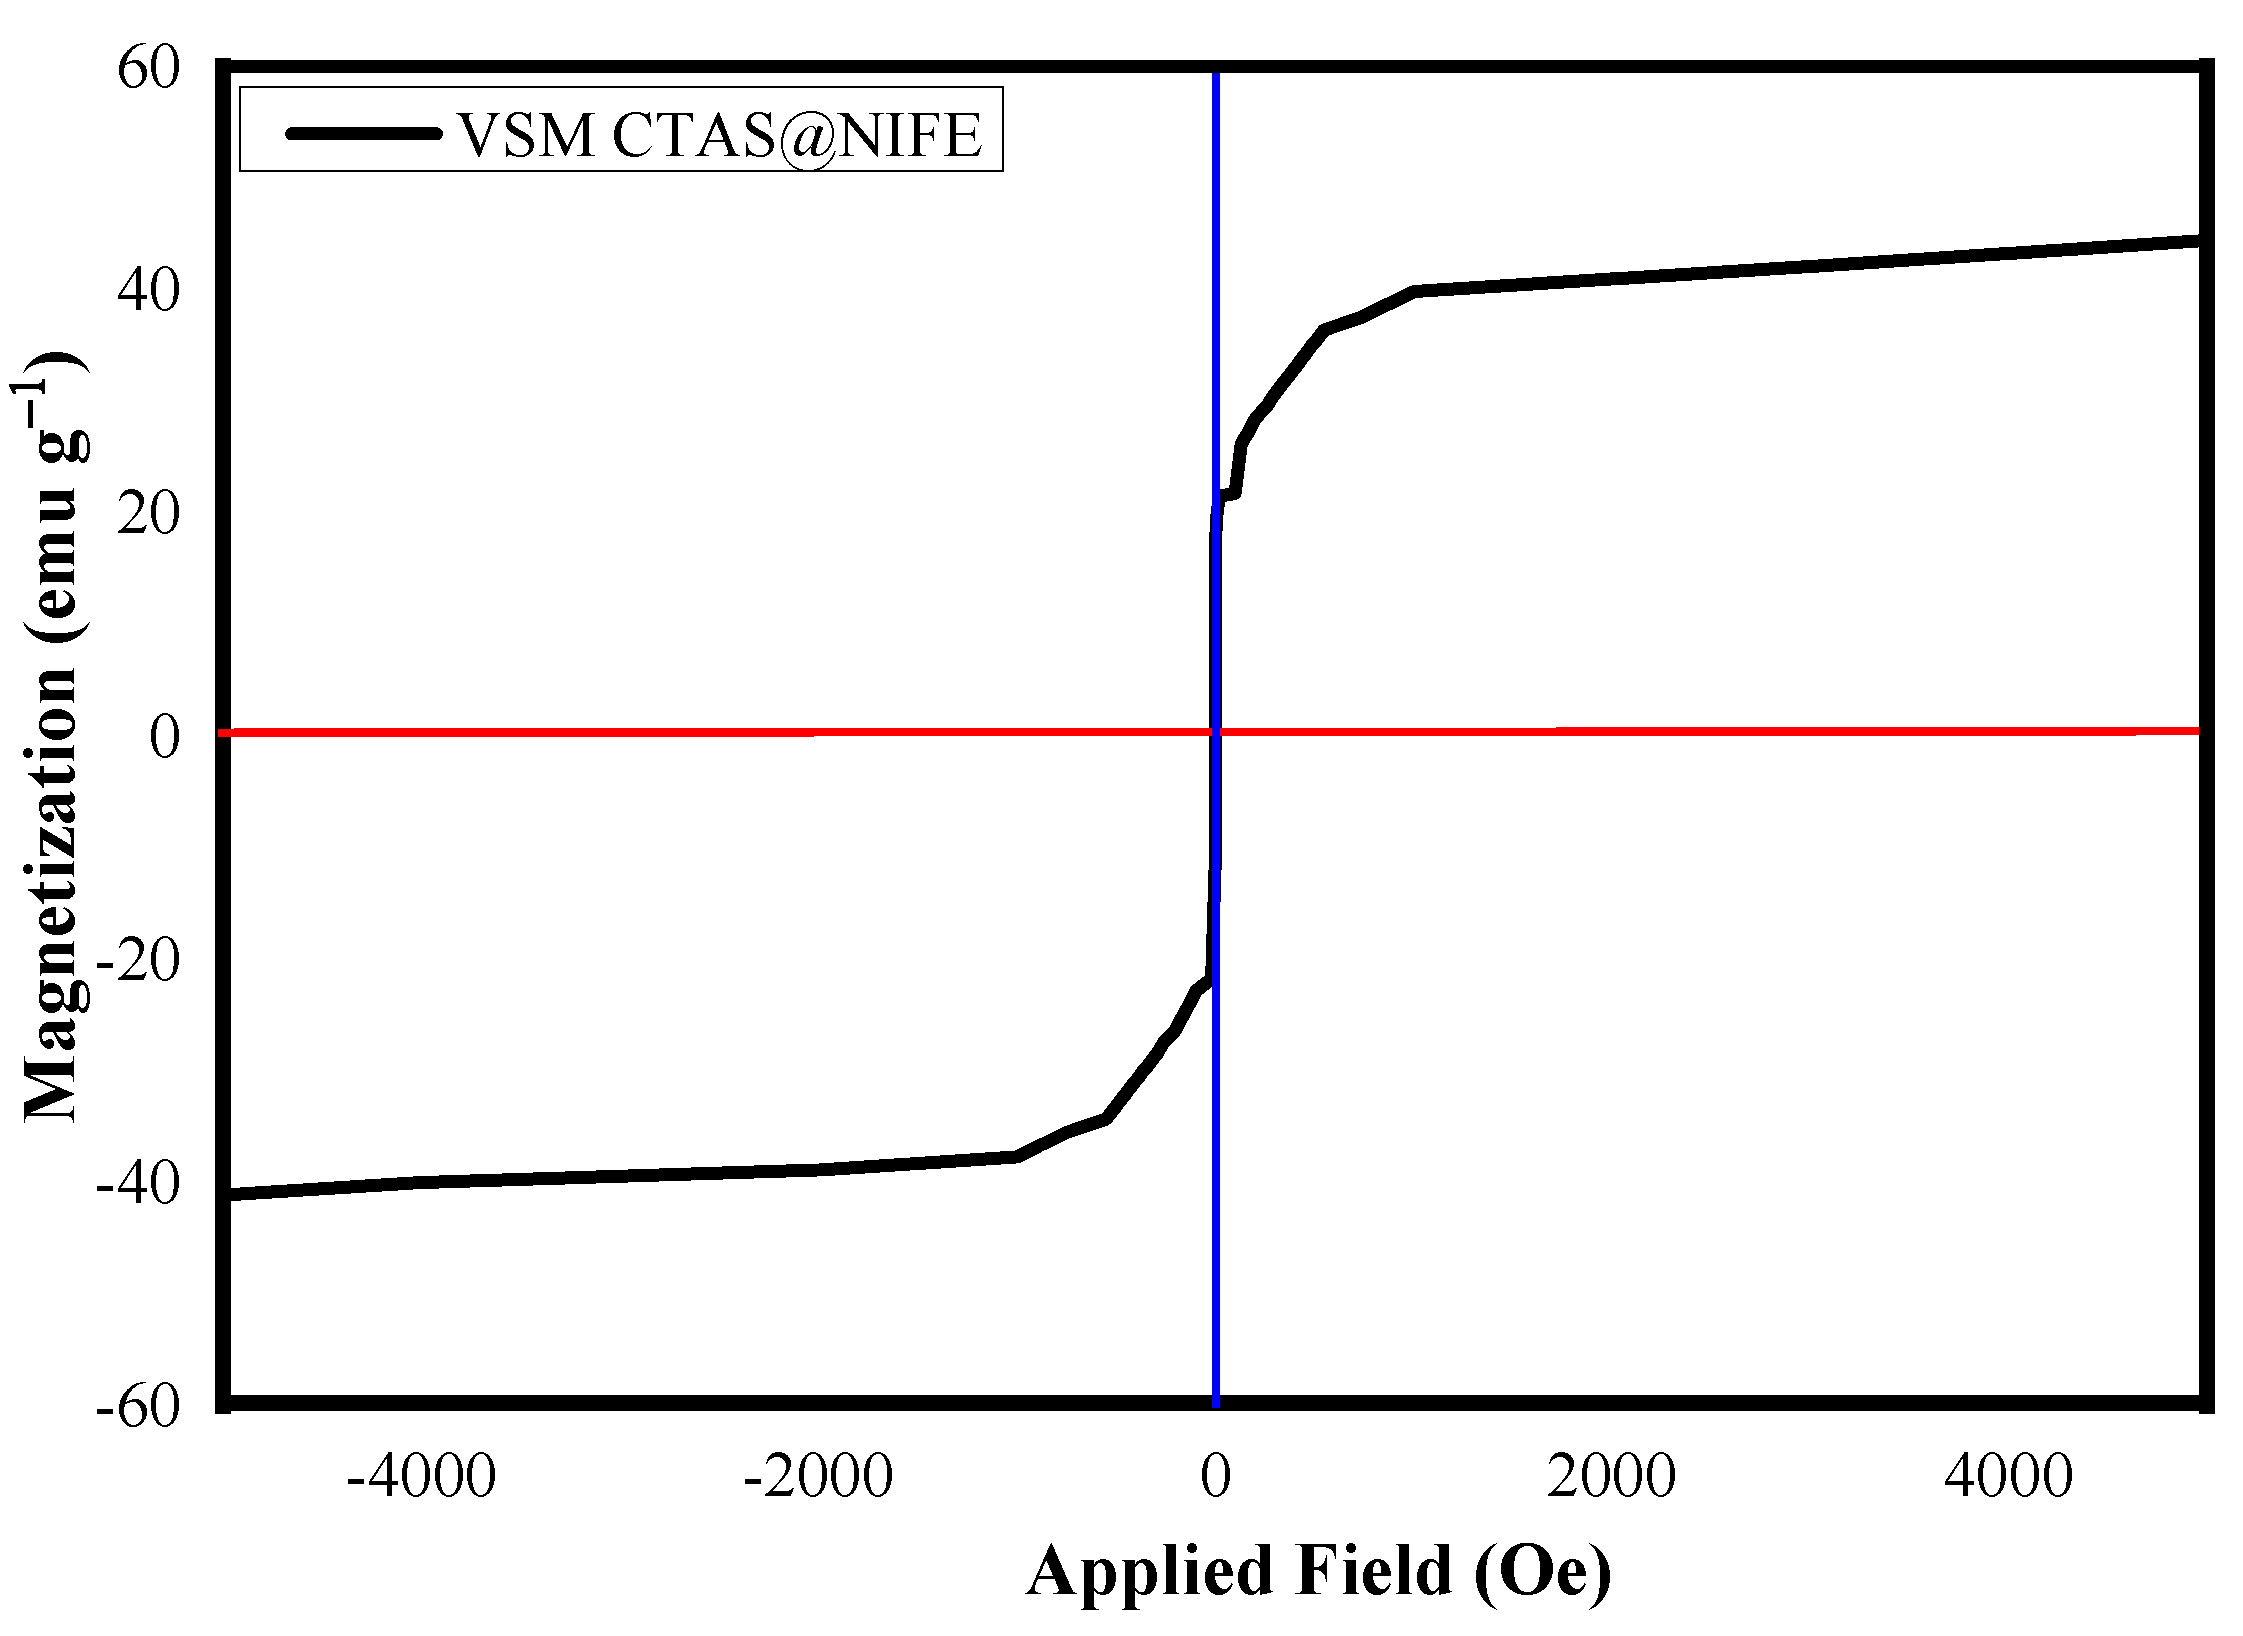
3.1. Analytical Techniques for Material Characterization

Characterization and analytical techniques were used to identify, isolate or quantify materials to explain the various structural, thermal, mechanical and chemical change when different chemical entities react with each other to form a new material.
Figure 1 shows the FTIR spectra of CTAS@NIFE and its individual constituents. The FTIR spectra of NIFE MNPs (black line) shows two characteristic peaks at 461 cm−1 tetrahedral mode and 552 cm−1 octahedral mode of vibrations corresponding with the lattice structure of NIFE [26]. The characteristic absorption peaks of chitosan (red line) belong to 3439 cm−1 (N–H stretching broadly with mix of –OH group), 2885 cm−1 (aliphatic –CH2 stretching), 1659 cm−1 (CO–NH bending), 1575 cm−1 (–N–H bending), and 1159 cm−1 (C–O–C pyranoid ring) [28]. The FTIR spectra ascorbic acid (blue line) shows peaks at 3207–3790 cm−1 (–OH stretching of four different –OH groups), 2733, 3003 cm−1 (–CH in aliphatic and ring stretching), 1752 cm−1 (–C=O carbonyl stretching), 1659 cm−1 (C–O stretching), 1107 cm−1, 1116 cm−1 (C–O–C stretching), and 675 and 751 cm−1 (–OH out of plane deformation) [35]. The FTIR spectra of CTAS@NIFE (magenta line) represent all of the characteristic peaks from individual constituents with reduced intensity and new peaks at 2164 cm−1 (R–N–C stretching due to bonding between chitosan and ascorbic acid) and 2288 cm−1 (–NH–O oxime stretching due to bonding between NIFE and chitosan-ascorbic acid biopolymer matrix) [31].
Differential scanning calorimetry provides information about the type of process (fusion or crystallization) involved in solid state reactions. Figure 2 shows the DSC curve for CTAS@NIFE in a temperature range of 50–350 °C and the inset shows the fusion and crystallization process occurring in the solid-state matrix with the temperature.
The first endothermic trough appearing at 85 °C is the glass transition temperature (Tg) of the biopolymer matrix of CT-AS functionalized with NIFE MNPs. There is continued weight loss of the material until the temperature reaches 292 °C (crystallization of NIFE MNPs). No further peaks appear after 304 °C, which suggest that decomposition of all of the carbonaceous content of the precursor occurred below 304 °C. Table 1 provides the important solid phase information that can be extracted from the DSC curve, such as initial melting/fusion temperature (Ti) of 276 °C, final melting/fusion temperature (Tf) of 292 °C, enthalpy of fusion (ΔHF) of 186.68 J·g−1, enthalpy of crystallization (ΔHC) of 650.43 J·g−1, and heat capacity at initial temperature (Ti) of 9.91 J·g−1·°C−1.
The crystalline structure and change in solid phase with respect to the fusion reaction was observed by XRD. Figure S2 presents the XRD spectra of CTAS@NIFE showing the peaks at 2θ values of 30.75°, 32.29°, 35.28°, 38.41°, 43.11°, 46.92°, 48.35°, 52.57°, 57.13°, 60.67°, 64.97°, and 67.11 which are consistent with the Miller index values of (220), (300), (311), (320), (400), (411), (420), (422), (333), (521), (433), and (442). From the literature, it was found that the characteristic peak for bulk NIFE MNPs appeared at 2θ values of 31.29°, 35.58°, 38.13°, 43.21°, 52.32°, 58.76°, and 63.78°, corresponding to Miller index values of (220), (311), (222), (400), (422), (333), and (440) (PDF 54-0964) [22]. Thus, based on the observed deviation in the Miller index values from bulk NIFE MNPs to CTAS@NIFE, we can confirm that NiFe2O4 MNPs are successfully functionalized by the biopolymer blend of CT–AS. The green route mechanism using the reducing properties of both CT and AS upon functionalization with the surface of spinel ferrite leads to significant deformation in the solid-state matrix, which is reflected in the semi crystalline structure shown by the XRD spectra.
Further information about the crystallite size and %crystallinity can be obtained using Equations (2) and (3) [36]:
D = 0.9 λ β cos θ
% Crystallinity = AreaUndertheCrystallinePeaks TotalArea × 100
where β is the half width of the highest intensity peak, λ is the wavelength used, i.e., 1.54 A°, θ is the angle of diffraction, and D is the crystalline size. The average size of CTAS@NIFE is 5.78 nm with percentage crystallinity of 70%, which is also in close concurrence with the TEM results (5.15 nm).
SEM was used to observe the surface morphological changes in the material during the solid-state reactions. Figure 3a presents the SEM image of chitosan, which appears as large-sized granules with irregular geometry, whereas the SEM image of CTAS@NIFE (Figure 3b) exhibits a highly porous surface with a loosely agglomerated distribution of particles on the surface (white dots); the CT-AS biopolymer matrix is represented by black dots. Figure 3c was used to obtain the average particle size of NIFE MNPs in the biopolymer matrix of CT-AS using statistical domain tools, such as the Gaussian distribution. With a frequency of 35%, the average particle size was estimated to be 4.65 nm, which is in close concurrence with XRD and TEM results. Furthermore, the atomic percentage of individual constituents used for the formation of CTAS@NIFE was observed by the energy dispersive X-ray (EDX) method shown in Figure 3d. Based on the total output of the EDX analysis, it can be concluded that the composition of CTAS@NIFE was C (15.04% ± 0.87%), N (2.86% ± 1.76%), O (41.26% ± 2.14%), Fe (23.96% ± 0.90%), and Ni (12.62% ± 0.69%), which also supports the 2:1 ratio of Fe3+ and Ni2+ taken as a precursor.
TEM was used for the elucidation of the optimized diameters and their variation in the CT-AS biopolymer matrix. Figure S3 presents the TEM image of the green synthesized CTAS@NIFE nanocomposite in which spherical elongated small-sized particles can be observed. In other regions of the image, segregated and agglomerated particles appear in the material. Using TEM analysis, the optimum average size of the NIFE MNPs in the biopolymer matrix was found to be around 5.15 nm, which is in close concurrence with the value calculated from XRD and SEM analysis using a Gaussian distribution.
Optical absorption and the energy band gap profile of synthesized CTAS@NIFE was assessed via UV-Vis spectroscopy in the wavelength range of 350–600 nm, and is shown in Figure 4, in which the absorption maxima (λmax) of CTAS@NIFE can be observed around 403 nm. From the literature it was found that the absorption maxima for bulk NIFE MNPs mostly lie in the range of 355–360 nm [37]. Thus, a red shift from 355 to 403 nm clearly suggests that NIFE MNPs are surface functionalized by a biopolymer blend of CT-AS. The surface functionalization resulted in contraction of the band gap by providing the lone pairs from O/N of the polymer blend to the empty d orbital of the Ni2+/Fe3+ matrix involving a n π* transition with the R band [38]. The inset in Figure 4 shows Tauc’s plot, which is used for the determination of band gap energy (Eg) of the semiconductor using Equation (4) [39]:
( α h ν ) = A ( h ν E g ) n
where α = absorption coefficient, h = Planck constant, ν = frequency of radiations, A = a constant, and n is a constant of transition variations, i.e., n = 1/2 for direct transitions and n = 2 for indirect transitions. In a graph of (αhν)2 vs. Eg, the intercept indicates the value of the energy band gap. Tauc’s plot specified the value of Eg as 1.32 eV for the synthesized CTAS@NIFE nanocomposite. In the literature, Eg for bulk NIFE MNPs was found to be around 1.87 eV, thus, reduction in the value of the energy band gap is due to the contraction in quantum confinement by the functionalization of NIFE with the CT-AS polymer blend [38,40].
The VSM technique was used to observe the changes in the magnetic properties of the NIFE MNPs before and after functionalization with the biopolymer blend of CT-AS. The shape of the hysteresis loop of M–H curve shown in Figure 5 suggests that NIFE MNPs functionalized by CT-AS bear a typical characteristic of very soft ferromagnetic material [41].
Depending on the different synthesis protocol, such as the sol gel, combustion, and coprecipitation methods, the values of saturation magnetization (ms) of NIFE MNPs vary [42]. Following the coprecipitation method, the reported saturation magnetization values of bulk NIFE MNPs in the literature were found to be 50 emu·g−1 [43], 44.22 emu·g−1 [44], and 47.4 emu·g−1 [45]. From the M–H curve of CTAS@NIFE given in Figure 5, the ms value was found to be 43.57 emu g−1. The contraction in the reported ms values of bulk NIFE MNPs to 43.57 emu·g−1 is due to attachment of a non-magnetic moiety CT-AS biopolymer blend on the surface [46]. Thus, VSM studies suggest that there is an antagonistic effect of the CT-AS biopolymer blend on the surface to decrease the magnetization power by reducing the size of the particle. The coercive field (Hc) values for bulk NIFE MNPs was reported to be 158 Oe at room temperature, whereas in the case of CTAS@NIFE it was found to be 52.74 Oe [38]. The reduction in Hc values after surface functionalization can be explained by the anisotropy constant (K1), which is equal to −0.0069 MJ/m3 for bulk NIFE MNPs [47]. The anisotropy constant (K1) is defined as the energy required to transform the magnetization property from easy to hard magnetization axes, which is given as Ea = K1V·sin2θ, where V is the volume of the particle and θ is the angle between the easy and hard magnetization axes [47,48]. Because the NIFE MNPs in CTAS@NIFE have a smaller size (~5.15 ± 1.02 nm) and the K1 value for the bulk NIFE MNPs is specified as being smaller (~25.67 ± 5.17 nm), the Hc value for CTAS@NIFE is substantially smaller than that for bulk NIFE MNPs.

3.2. Sonophotocatalysis and Optimization of Reaction Parameters

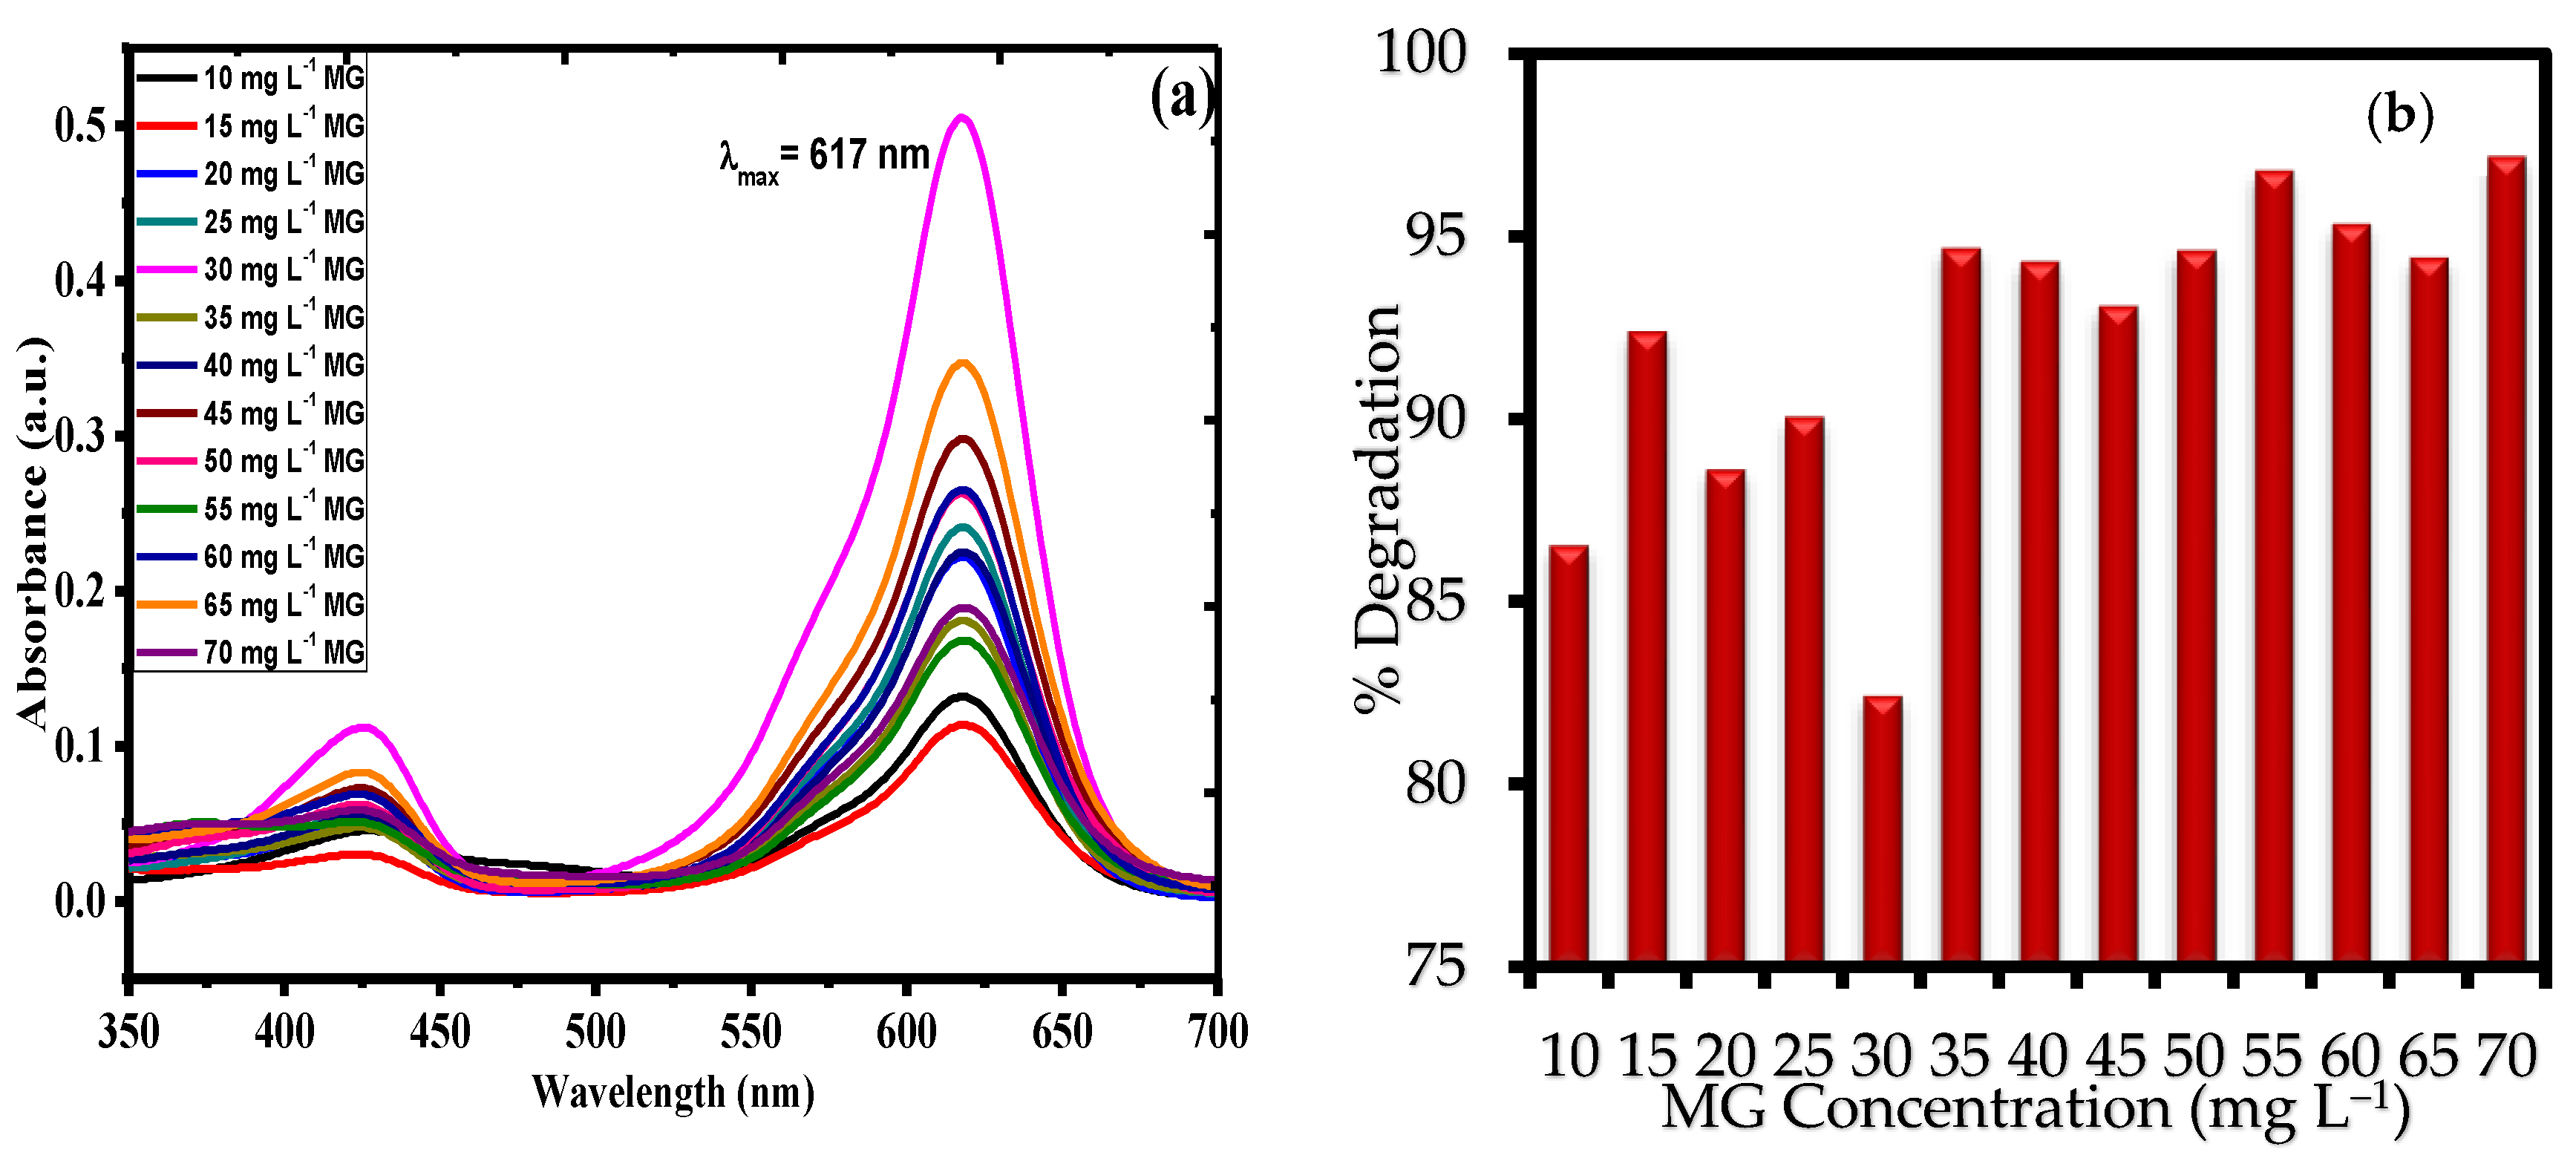
3.2.1. Sonophotocatalysis with Variable MG Concentration

The effect of variable concentrations of MG on sonophotocatalysis efficiency of the catalyst was studied by taking 20 mL aliquot of 10–70 mg·L−1 MG under 6.35 W·mL−1 ultrasonic power using 20 mg catalyst at 120 rpm. The obtained results are summarized in Figure 6a,b and Table S1 with standard deviation. It was observed that, with an increase in the MG concentration from 10 to 70 mg·L−1, abnormal behavior with respect to %degradation of MG by the catalyst was exhibited. As can be determined from the UV-Vis action curve and the %degradation curve, %degradation obtained for given levels of MG concentration were: 10 mg·L−1 MG, 86.5%; 15 mg·L−1 MG, 92.42%; 20 mg·L−1 MG, 88.63%; 25 mg·L−1 MG, 90.08%; 30 mg·L−1 MG, 82.43%; 35 mg·L−1 MG, 94.68%; 40 mg·L−1 MG, 94.32%; 45 mg·L−1 MG, 93.11%; 50 mg·L−1 MG, 94.62%; 55 mg·L−1 MG, 96.81%; 60 mg·L−1 MG, 95.32%; 65 mg·L−1 MG, 94.43%; and 70 mg·L−1 MG, 97.19%. Thus, based on the results obtained, three interval dye concentrations, namely, 35, 55, and 70 mg·L−1 were chosen to observe the minimum screening effect and the maximum degradation of MG [49].

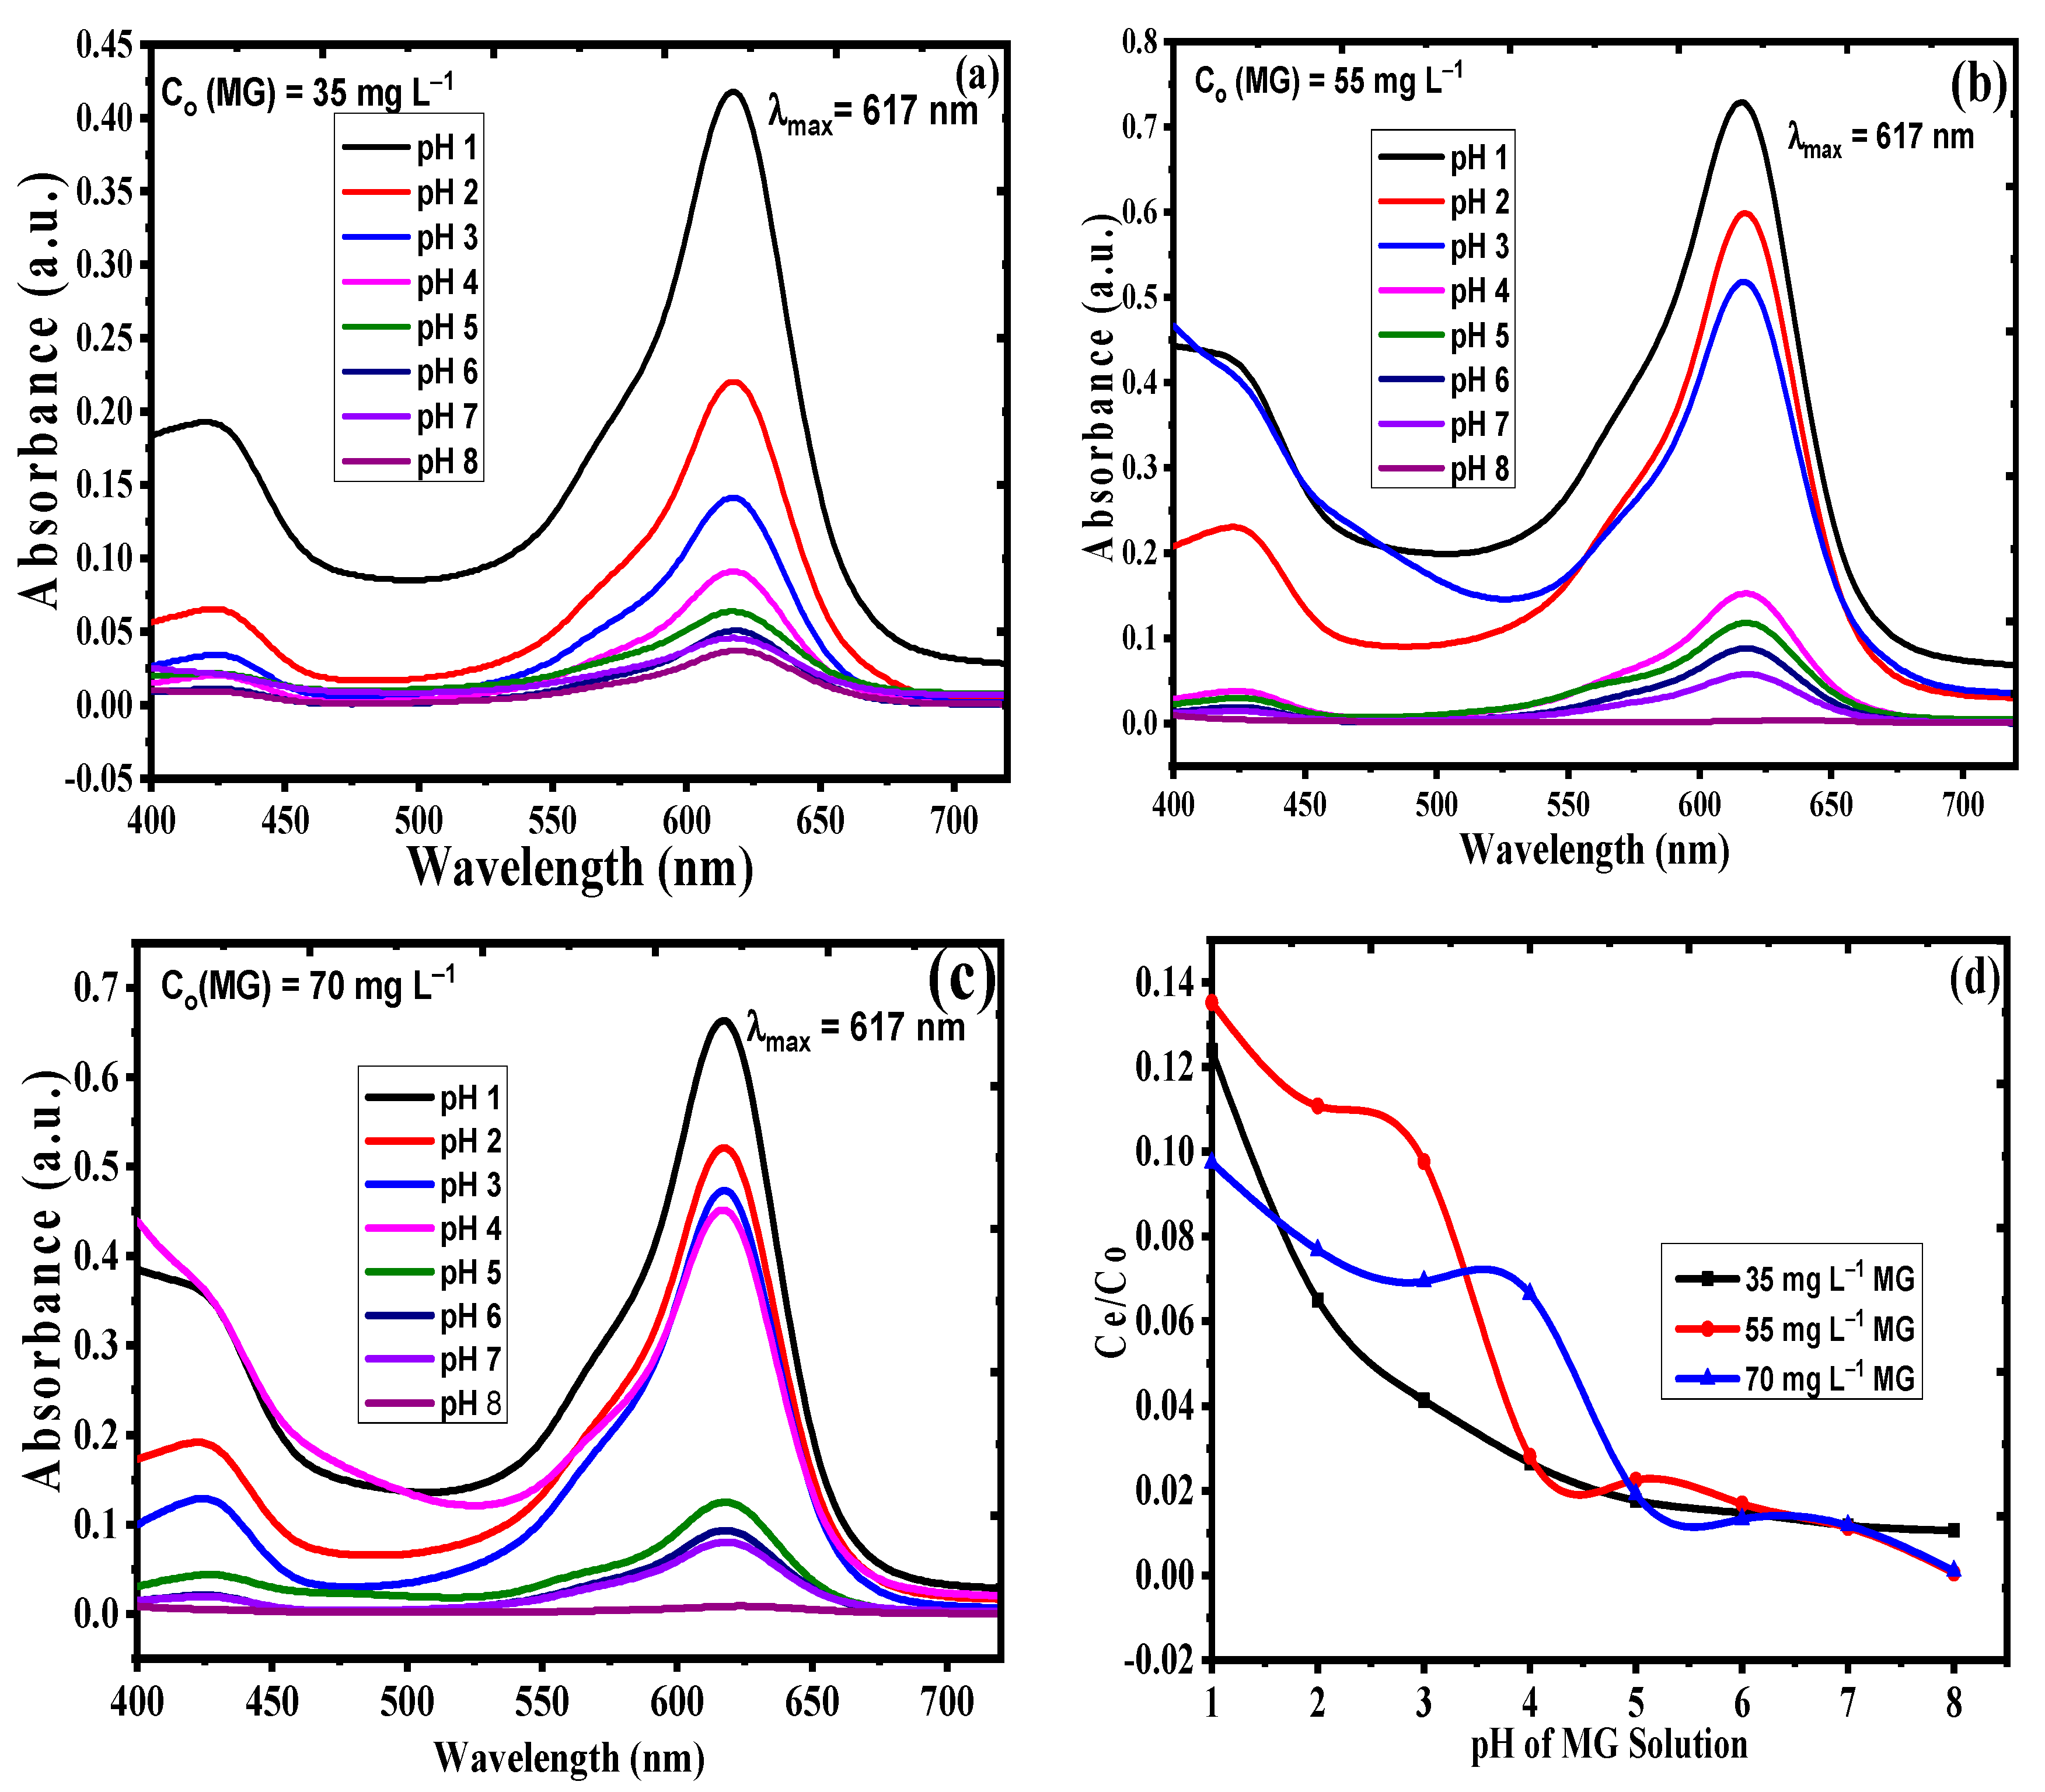
3.2.2. Sonophotocatalysis with Variable MG Solution pH

After examining the effect of concentration, the effect of variable pH of MG solution was studied at 35, 55, and 70 mg·L−1 MG concentrations under the same conditions applied in the previous experiment. Because the process of photocatalysis involves the accumulation of guest molecules on the exterior interface of the catalyst, the pH of the solution/medium plays a vital role in the binding process. Figure 7a–d shows the UV-Vis curves for MG degradation at 35, 55, and 70 mg·L−1 concentrations, and Figure 7d shows the Ce/Co vs. pH profile. In the acidic medium, i.e., pH = 1–3, the %degradation was slow due to the low percentage of hydroxyl radicals because of the formation of hydronium ions on the surface of CTAS@NIFE. As the solution pH increased (pH > 3), a greater number of substrate molecules accumulated on the surface of the catalyst, which exerted a perturbation on the electron transfer between the excited dye molecules and the catalyst surface, thus influencing the degradation rate of MG. The rate was found to increase with the increase in pH (4–8), as shown by Figure 7d. The is due to the formation of a greater number of OH radicals at high pH values and the presence of high negative charge density on the surface of the catalyst, which readily attracts the cationic MG molecule via electrostatic interactions [50,51]. Thus, the results obtained suggest that, at a high pH of 8, the nano spinel ferrite CTAS@NIFE is negatively charged, causing the MG molecules to accumulate on the exterior surface through electrostatic interactions using positively charged amino groups. In the presence of OH radicals, mineralization occurs with maximum %degradation for 35, 55, and 70 mg·L−1 MG of 99%, 99.88%, and 99.92%, respectively. The data obtained for the pH effect on MG degradation has been given in Table S2 with standard deviation.

3.2.3. Sonophotocatalysis with Variable Irradiation Time

After examination of concentration and pH, the effect of variable sonication time on MG degradation was studied with 35, 55, and 70 mg·L−1 under ultrasonic power of 6.35 W·mL−1, pH of 8, and catalyst amount of 20 mg. The results obtained after the experiments reveal that with gradual increase in the irradiation time from 5 to 90 min, the photocatalytic degradation of MG also increases. This trend is due to the excitation of valence electrons from the ground state of CTAS@NIFE to the excited state, generating photoelectrons via the absorption of visible and ultrasonic radiation. The catalyst surface has the rich density of the –OH group which, on coupling with these high energy electrons, turns into •OH radicals that are responsible for the photodegradation of MG [51,52]. From the results given in Figure 8a–d, it can be seen that the degradation rate continuously increases with the increase in irradiation time until the change in color from blue to the colorless solution due to the rupture of chromophoric groups in MG [51]. The photocatalytic efficiencies of nanocrystalline spinel ferrite CTAS@NIFE were found to be 98.22% for 35 mg·L−1, 98.65% for 55 mg·L−1, and 99.05% for 70 mg·L−1 MG, which is directly proportional to the visible coupled ultrasonic irradiation time of 90 min. The data obtained for the effect of irradiation time on MG degradation has been given in Table S3 with standard deviation.

3.2.4. Sonophotocatalysis with Variable Ultrasonic Power Intensities

Figure 9a–d and Table S4 show the UV-Vis action curve and data for the effect of ultrasonic power density on photocatalysis of MG by CTAS@NIFE. A quantity of 20 mL of 35, 55, and 70 mg·L−1 MG dye was investigated at pH 8 under 4.15, 5.05, 5.85, and 6.35 W·mL−1 power densities for 90 min visible light irradiation. From the results obtained, the % MG degradation steadily increases with increasing ultrasonic power density for each aliquot of MG dye taken for experimentation. Upon interacting with organic molecules, the ultrasonic waves degrade the dye via three mechanisms: (i) pyrolytic degradation; (ii) supercritical water reactions; and (iii) hydroxyl radical oxidation [16]. In our scavenging experiment it was found that hydroxyl radicals were involved in the degradation mechanism of MG, as discussed in Section 3.4. Thus, increasing the ultrasonic power density from 4.15 to 6.35 W·mL−1 causes a greater number of hydroxyl radicals to be produced on the surface of the catalyst. High photocatalytic efficiency can therefore be obtained at high ultrasonic power density.

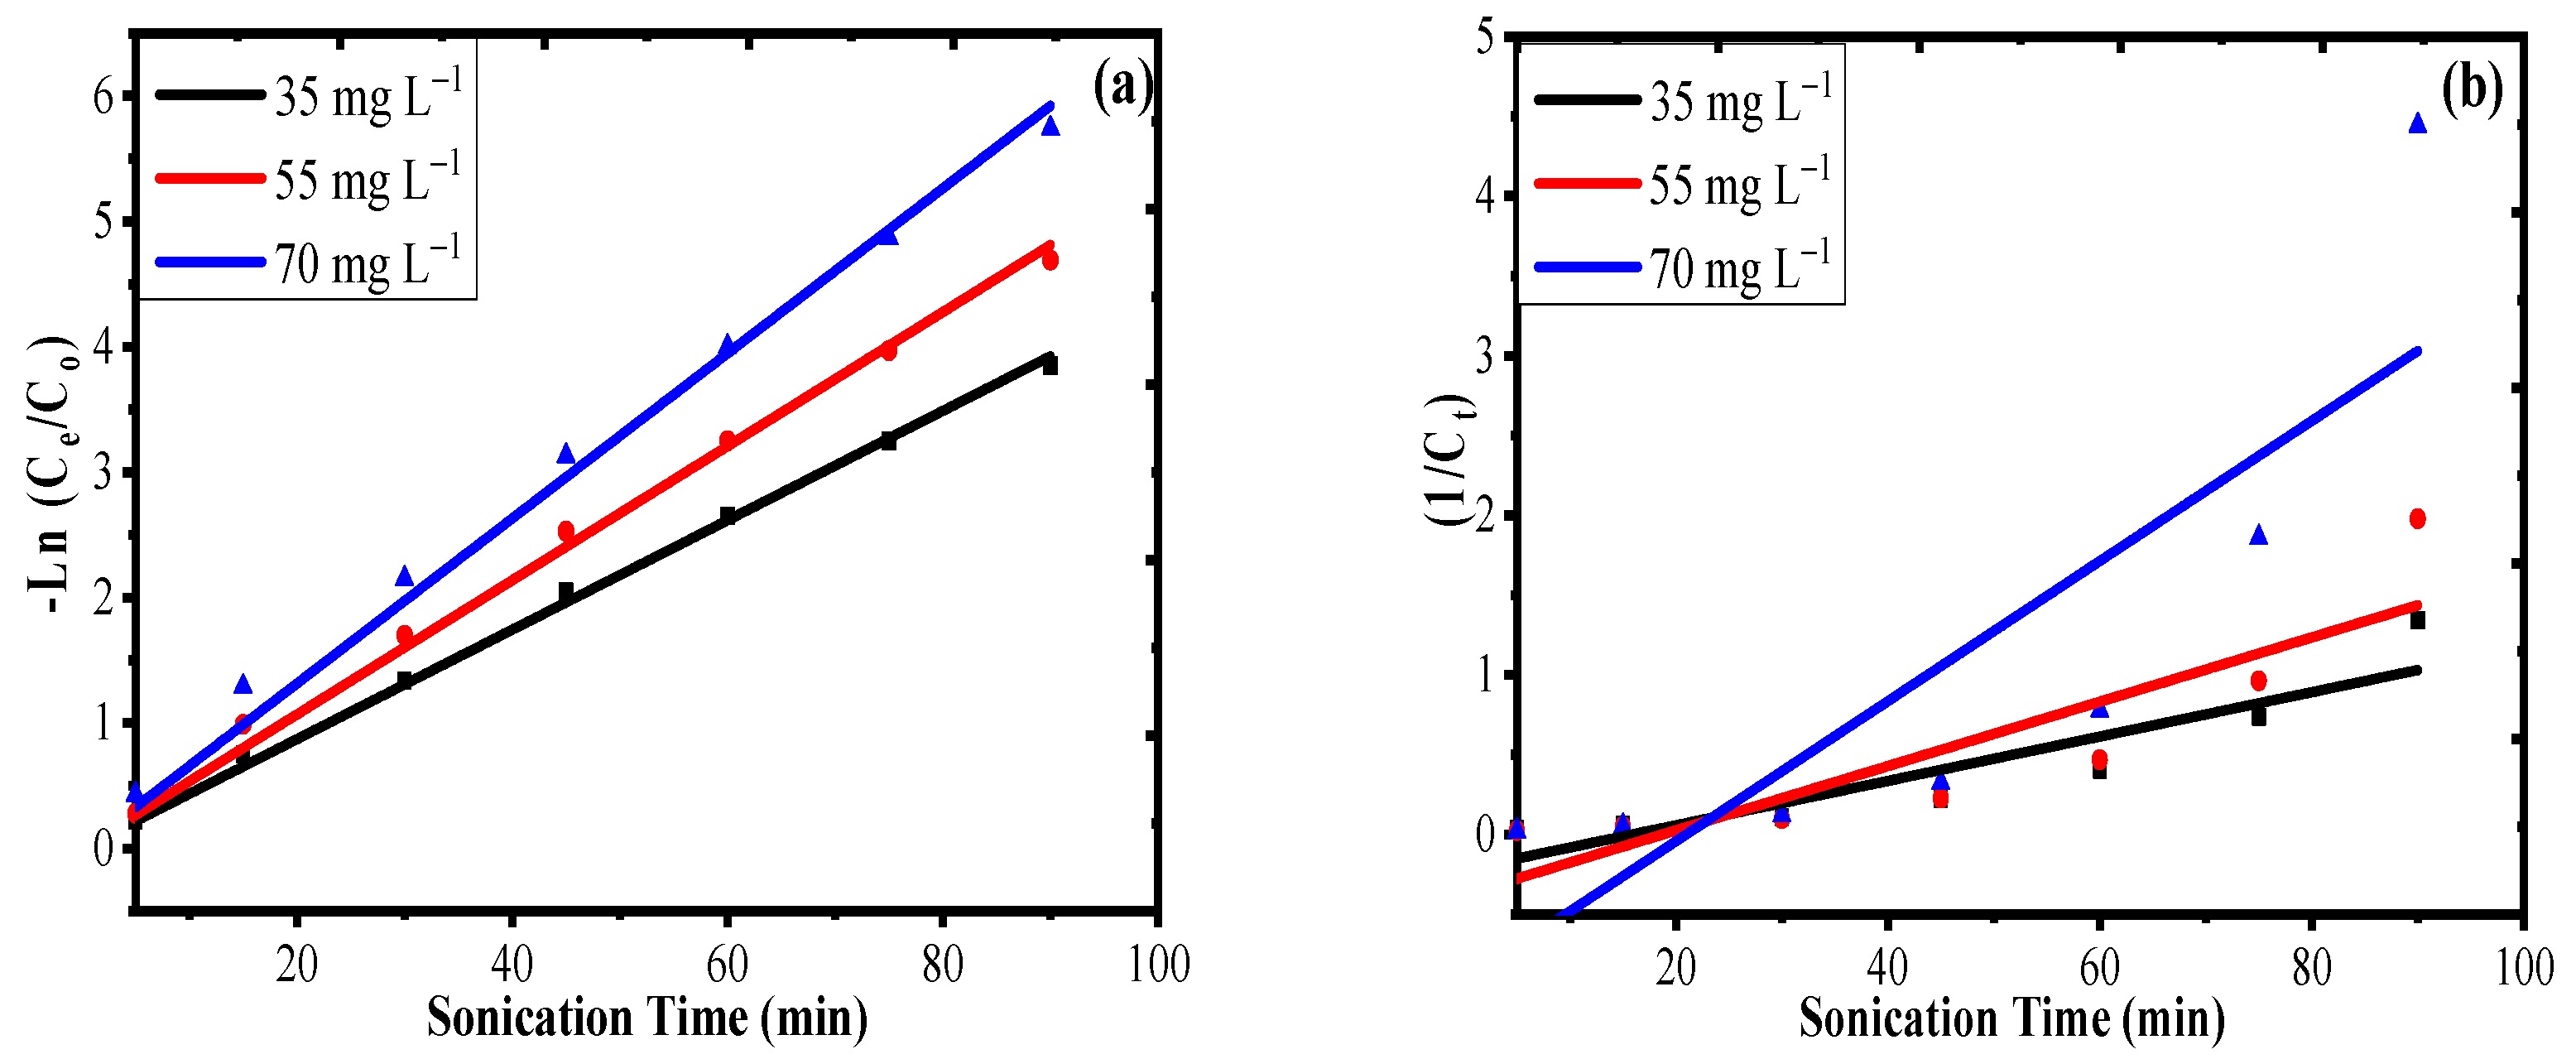
3.3. Sonophotocatalysis Kinetics

The data obtained from the irradiation time experiment were utilized to determine the type of kinetics reaction that is followed by the degradation process. The data given in Tables S5 and S6 with standard deviation for 35, 55, and 70 mg·L−1 MG degradation at pH 8 for a time irradiation range of 5–90 min was applied to pseudo first-order and pseudo second-order kinetic models [53,54]. The mathematical equations and corresponding half-life period of the model is given by Equations (5)–(8):
ln ( C t C o ) = kt
t 1 / 2 = 0.693 k 1
1 C t = kt + 1 C o
t 1 / 2 = 1 k 2 C O
where k1 (min−1) and k2 (l mg−1·min−1) are the pseudo first-order and pseudo second-order rate constants, and Ce and Ct (mg·L−1) are the substrate concentrations at equilibrium and after time t (min), respectively. t1/2 is the half-life of the reaction.
The kinetic plots of the pseudo first-order and pseudo second-order models are presented in Figure 10a,b. The calculated reaction rate constants from the slope of a straight line for plots of -Ln (Ce/Co) vs. t, and 1/Ce vs. t, with their half-life values, are summarized in Table 2. The values of the rate constants for the pseudo first-order model (k1) were calculated to be 0.04, 0.05, and 0.06 min−1, whereas for the pseudo second-order model they were 0.013, 0.020, and 0.044 L·mg−1·min−1 for 35, 55, and 70 mg·L−1 MG concentrations, respectively. The combination of a statistical error analysis tool with the obtained data was used to more precisely determine the kinetic model that plays a critical role during the photodegradation reaction. Thus, the root mean square error (RMSE) was used with the regression coefficient to optimize the data values for the most preferential model. The calculation of RMSE is given by Equation (9):
RMSE = i = 1 n ( q e , cal q e , exp ) i 2
Thus, the high regression coefficient R2 and low RMSE ((0.99, 0.06), (0.99, 0.11), and (0.99, 0.18) at 35, 55, and 70 mg·L−1 MG, respectively) indicated the sonophotocatalysis degradation reaction of MG on the CTAS@NIFE surface was best defined by the pseudo first-order kinetic model. The mechanism involves, first, the adsorption of MG on the catalyst surface and thereby degradation of the substrate (MG) by the generated hydroxyl radicals under the influence of visible radiation coupled with 6.34 W·mL−1 ultrasonic power. On interaction with the surface of the catalyst, the radiation coupled with ultrasonic waves results in transition of electrons from the valence band (VB) to the conduction band (CB). The energy of the photon is dependent on the light intensity. In addition, the greater the radiation falling on the catalyst surface, the more hydroxyl radicals (OH) are produced, which results in a higher degradation rate of MG [10]. The half-life (t1/2) for the pseudo first- and second-order models was found to be (17.32, 2.05 min), (13.86, 0.90 min), and (11.55, 0.33 min) for 35, 55, and 70 mg·L−1 Mg concentrations, respectively. The kinetic data also suggest that the sonophotocatalysis of MG is more efficient at the higher concentration (70 mg·L−1) compared to the lower concentrations due to the masking effect, which results in greater hydroxyl radical generation in the presence of a higher number of dye molecules at the solid–liquid interface.

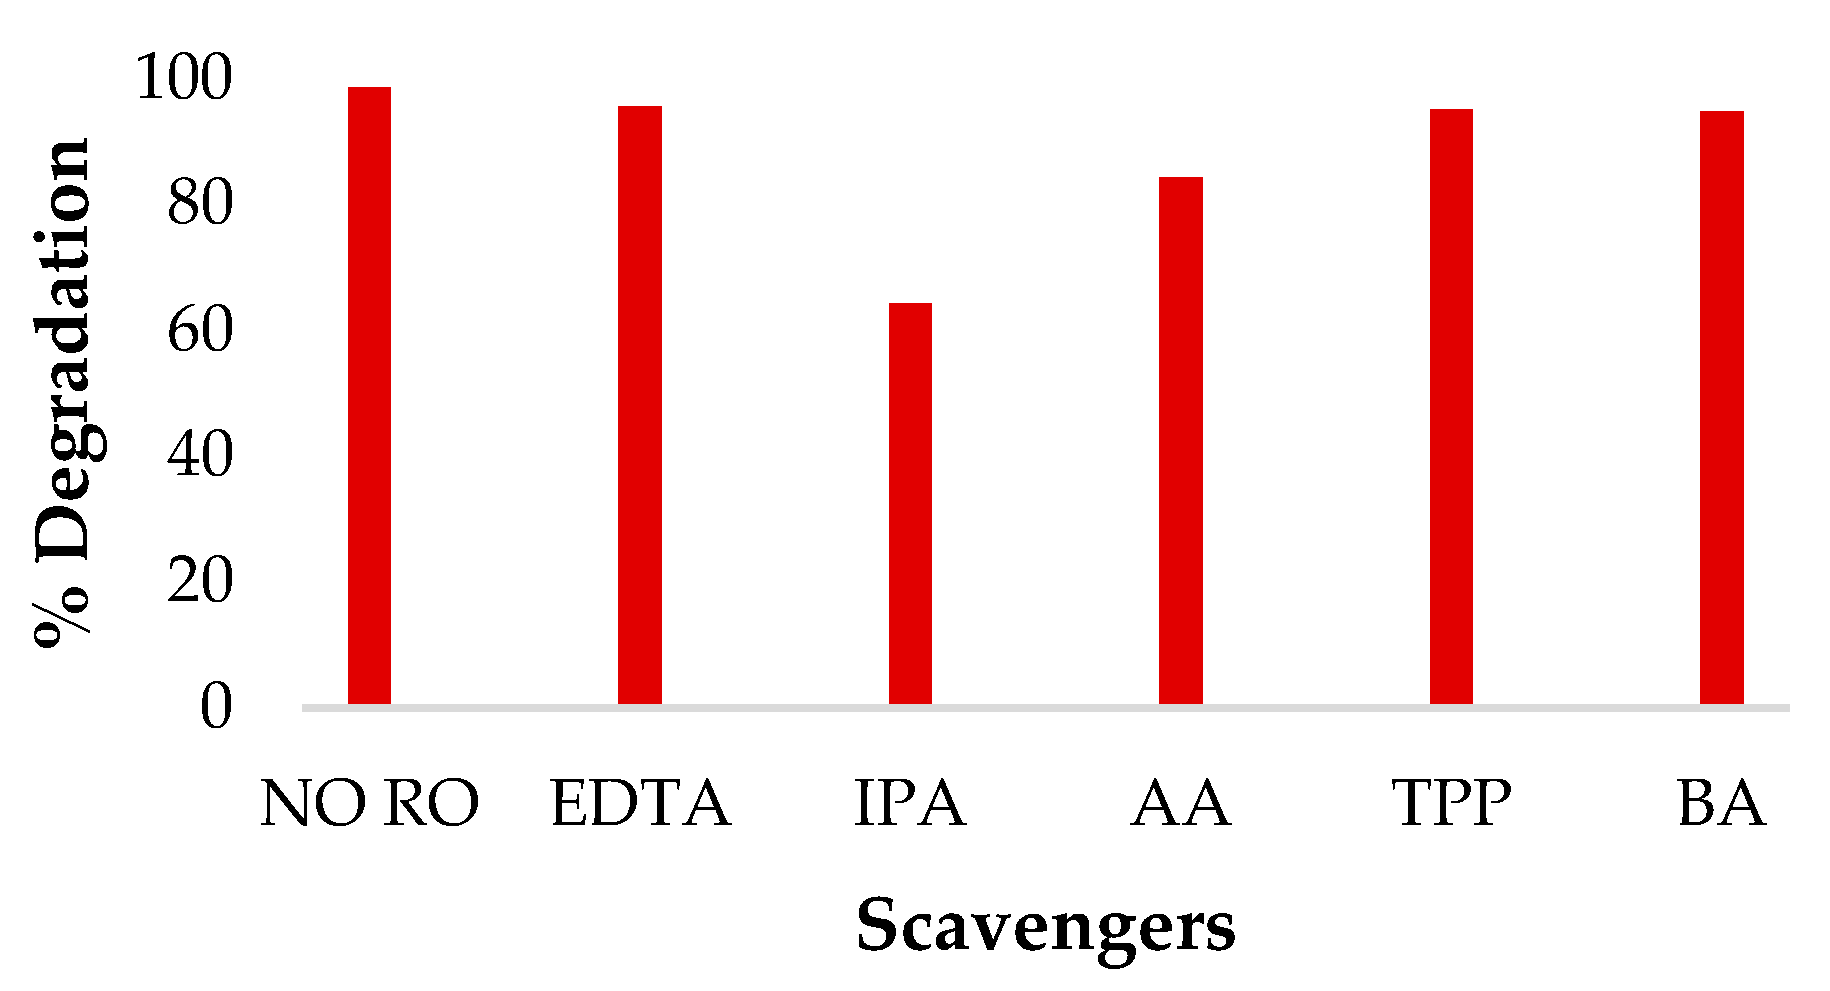
3.4. Effect of Scavengers and Mechanism of Sonophotocatalysis

Reactive oxidants are the typical active species that are responsible for the degradation of toxic organic molecules into small non-toxic entities. To investigate, experiments were performed by taking 20 mL aliquot of 70 mg·L−1 MG at pH 8 with 20 mg CTAS@NIFE under 90 min of visible irradiation and 6.35 W·mL−1 ultrasonic irradiation. Individual aliquot samples were mixed with a 3 mM solution of different scavengers, such as benzoic acid (BA), isopropyl alcohol (IPA), EDTA, triphenyl phosphene (TPP), and acrylamide (AA). The results are given in Figure 11 suggested that the rate of photodegradation was most affected with an antagonistic trend in the presence of isopropyl alcohol (IPA). Isopropyl alcohol (IPA) is known as a scavenger for the trapping of OH radicals from the reaction medium and, as a result, decreased photocatalytic efficiency was observed. Thus, it was concluded that the OH radicals are the key reactive oxidants during the whole course of the sonophotocatalysis reaction of MG with CTAS@NIFE [55]. A proposed hypothesis for the reaction mechanism based on the results obtained by scavenging tests is presented in Equations (10)–(15) [56]:
CTAS @ NIFE + h v CTAS @ NIFE ( h v b + + e c b )
CTAS @ NIFE ( e c b ) + O 2 PCTAS @ NIFE @ Ag + O 2
O 2 + H + H O 2
CTAS @ NIFE ( e c b ) + H O 2 + H + H 2 O 2
H 2 O 2 + CTAS @ NIFE ( e c b ) O H + OH
O Hor h v b + + MG DegradedMG
On mixing CTAS@NIFE with MG under solar light radiation (hν), an electron ( e c b ) is excited from the VB to the CB, which leads to the concurrent creation of a hole in the VB ( h v b + ) . The electrons present on the surface of the catalyst inhibit the molecular oxygen and, therefore, generation of the first superoxide radical anion (O2) takes place. Then, hydrogen ions (H+) and (O2) radicals existing in the solution recombine to form (OH) radicals. Furthermore, (OH) radicals are generated by the attack of trapped electrons on (HO2) radicals, which results in the effective photocatalytic degradation of MG via Equations (10)–(15). It may be inferred that, during the mineralization process of MG, the attack of (OH) or ( h v b + ) results in the ring opening of the MG, resulting in aliphatic compounds that are further converted into CO2, H2O, and other inorganic compounds [57].

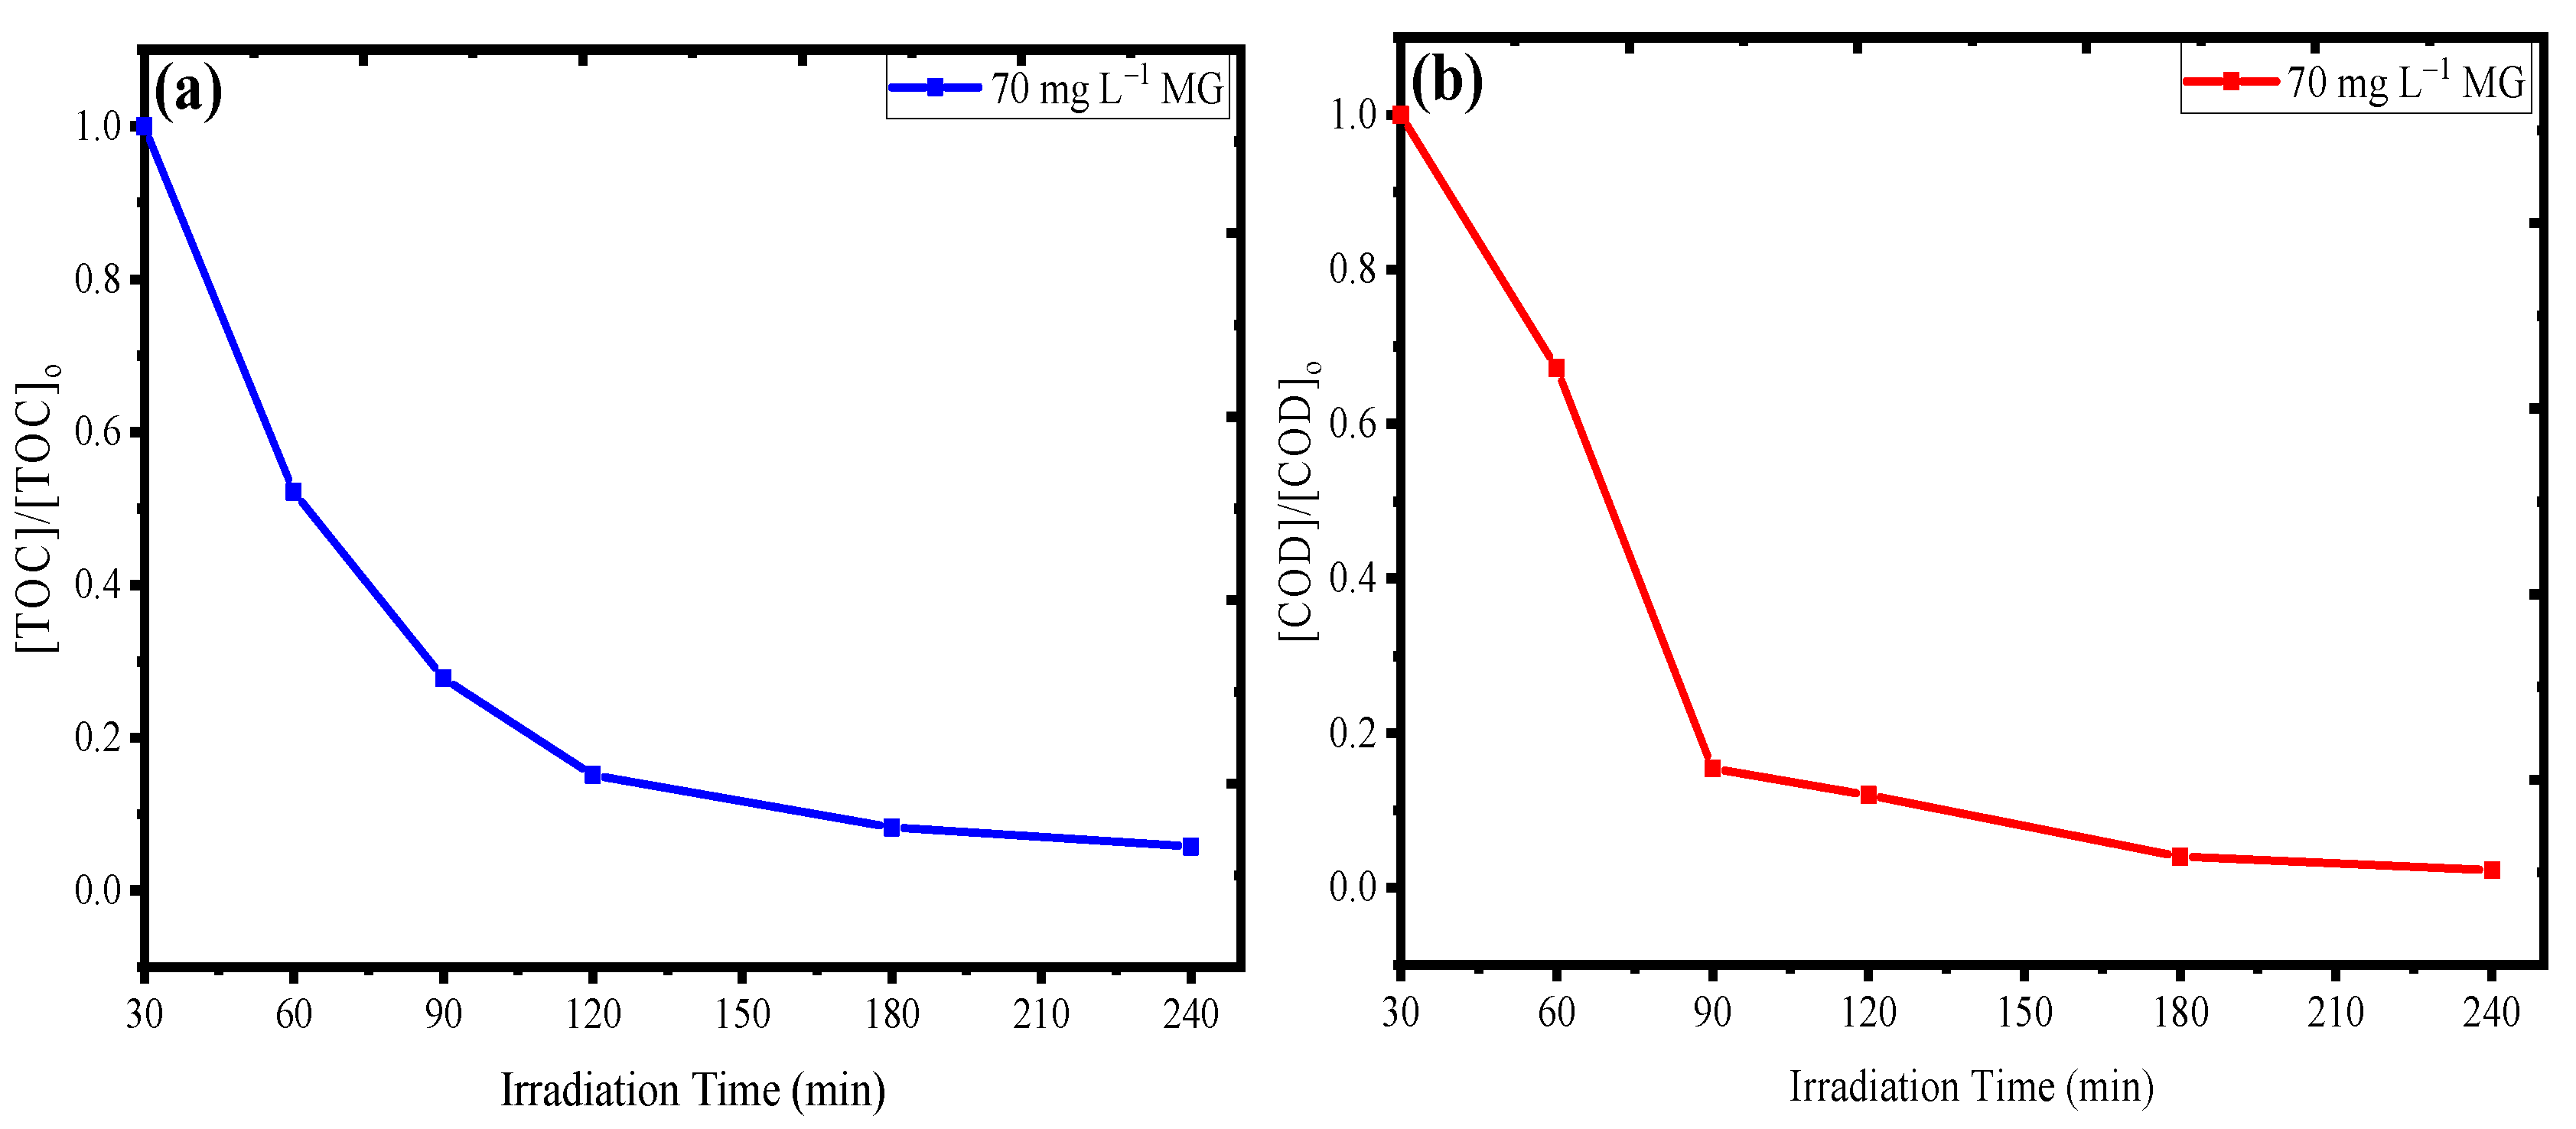
3.5. Mineralization of MG

The conversion of MG into nontoxic entities like CO2, H2O etc. was observed by measuring the total organic carbon (TOC) and chemical oxygen demand (COD) studies. Figure 12a represents the TOC plot for the sonophotocatalytic degradation of MG under direct solar irradiation in which it was inferred that after 120 min of irradiation time the TOC value rapidly decreased up to 87%. Further increase in irradiation time up to 240 min results in a total of 95% reduction in TOC value for photodegradation of MG using CTAS@NIFE. Figure 12b represents the variation in chemical oxygen demand (COD) with respect to the photodegradation of MG. The purpose of the test was to analyse the amount of oxygen needed for the conversion of MG into CO2 and H2O. It can be inferred from the Figure 12b that with increase in solar irradiation time from 30 to 240 min the COD value decreased with an extent of 97% indicating the complete mineralization of MG by CTAS@NIFE. The results obtained by both the experiments are completely in favor of mineralization of MG as if was not mineralized there be not so much change in TOC value occur. Secondly mineralization leads to formation of non–toxic species which is clearly can be seen by COD values.

4. Conclusions

In the present study, NIFE MNPs were synthesized via a green coprecipitation method by using a biopolymer blend of chitosan and ascorbic acid (CT-AS) as the reducing and stabilizing agent. The magnetic nanomaterial was characterized by FTIR, XRD, SEM-EDX, TEM, UV-Vis, DSC, and VSM. The nanocrystalline spinel ferrite was found to have a soft ferromagnetic nature with an ms value of 43.57 emu·g−1. Furthermore, the material was investigated for the photodegradation of malachite green (MG) dye using the advance oxidative process (AOP). Visible solar light coupled with 6.35 W·mL−1 ultrasonic waves was used for the degradation of MG dye under pH 8 conditions, resulting in 99.92% photocatalytic efficiency of the CTAS@NIFE catalyst for a 90 min irradiation time. The sonophotocatalysis reaction was best defined by the pseudo first-order kinetics, which involve the adsorption of the MG molecule on the surface of the catalyst, thereby demineralizing it in the presence of advance active OH radicals. The values of the rate constant for the pseudo first-order model (k1) were calculated as 0.04, 0.05, and 0.06 min−1, with half-lives of 17.32, 13.86, and 11.55 min, for 35, 55, and 70 mg·L−1 MG concentrations, respectively. As a trapping agent for OH radicals, isopropyl alcohol (IPA) had a negative effect on the photodegradation rate, thus supporting the major involvement of OH radicals in MG degradation. It was concluded that the decrement in the energy band gap (Eg) value of the NIFE MNPs upon functionalization with the CT-AS blend was reflected in the high degradation rate. The association with ultrasonic waves further enhanced the generation of reactive oxidative radicals for the mineralization process. The authors are further exploring the properties of nanocrystalline NIFE spinel ferrites under varying conditions, such as different synthesis routes and annealing temperatures, doping with other photocatalytic metals/semiconductors (Zn2+, Co2+, Ag+, Mg2+, etc.), and their photocatalytic efficiencies under UV and Vis light radiations.

Supplementary Materials

The following are available online at https://www.mdpi.com/2079-6412/10/12/1200/s1, Figure S1: UV-Vis Spectra with time profile to observe the growth of NiFe2O4 spinel nuclei under the influence of CT-AS biopolymer blend, Figure S2: XRD spectra CTAS@NIFE nanocomposite, Figure S3: TEM image of CTAS@NIFE bio nanocomposite at 50 nm magnification, Table S1: Concentration vs. percent degradation data with standard deviation for MG degradation using 20 mg catalyst under 6.35 W·mL−1 ultrasonic power, Table S2: Ce/Co values with standard deviation with respect to variable pH conditions for MG degradation using 20 mg catalyst under 6.35 W·mL−1 ultrasonic power, Table S3: Ce/Co values with standard deviation with respect to variable pH conditions for MG degradation using 20 mg catalyst under 6.35 W·mL−1 ultrasonic power, Table S4: Ultrasonic power vs. % MG degradation with standard deviation data for MG degradation using 20 mg catalyst at 90 min of irradiation, pH 8 for 35, 55 and 70 mg·L−1 MG concentration, Table S5: -Ln (Ce/Co) values with standard deviation with respect to irradiation time for pseudo first order kinetics for 35, 55 and 70 mg·L−1 MG concentration using 20 mg catalyst at pH 8 and 6.35 W·mL−1 ultrasonic power, Table S6: 1/Ce values with standard deviation with respect to irradiation time for pseudo second order kinetics for 35, 55 and 70 mg·L−1 MG concentration using 20 mg catalyst at pH 8 and 6.35 W·mL−1 ultrasonic power.

Author Contributions

Conceptualization, I.H.; methodology, I.H., A.B., and I.I.B; software, I.H., and K.H.A.; validation, I.H., R.A.K., and A.A.; formal analysis, I.H. and A.B.; investigation, I.H. and A.B.; data curation, I.H., A.B..; writing—original draft preparation, I.H., A.B., K.H.A., I.I.B., R.A.K., and A.A.; writing—review and editing, I.H., A.B., K.H.A., I.I.B., R.A.K., and A.A.; supervision, I.H. and A.A. project administration, A.A. and R.A.K.; funding acquisition, A.A. All authors have read and agreed to the published version of the manuscript.

Funding

The authors extend their appreciation to the Saudi Arabia Ministry of Education Deputyship for Research & Innovation for funding this research work through project no. IFKSURG-1438-006.

Conflicts of Interest

The authors declare no conflict of interest.

References

  1. Mohanta, J.; Dey, B.; Dey, S. Sucrose-triggered, self-sustained combustive synthesis of magnetic nickel oxide nanoparticles and efficient removal of malachite green from water. ACS Omega 2020, 5, 16510–16520. [Google Scholar] [CrossRef]
  2. Hasan, I.; Bhatia, D.; Walia, S.; Singh, P. Removal of malachite green by polyacrylamide-g-chitosan γ-Fe2O3 nanocomposite—An application of central composite design. Groundw. Sustain. Dev. 2020, 11, 100378. [Google Scholar] [CrossRef]
  3. Bakhshi Nejad, S.; Mohammadi, A. Epoxy-triazinetrione-functionalized magnetic nanoparticles as an efficient magnetic nanoadsorbent for the removal of malachite green and Pb(II) from aqueous solutions. J. Chem. Eng. Data 2020, 65, 2731–2742. [Google Scholar] [CrossRef]
  4. Ali, I.; Peng, C.; Ye, T.; Naz, I. Sorption of cationic malachite green dye on phytogenic magnetic nanoparticles functionalized by 3-marcaptopropanic acid. RSC Adv. 2018, 8, 8878–8897. [Google Scholar] [CrossRef] [Green Version]
  5. Zhang, M.; Mao, Y.; Wang, W.; Yang, S.; Song, Z.; Zhao, X. Coal fly ash/CoFe2O4 composites: A magnetic adsorbent for the removal of malachite green from aqueous solution. RSC Adv. 2016, 6, 93564–93574. [Google Scholar] [CrossRef]
  6. Adeyi, A.A.; Jamil, S.N.A.M.; Abdullah, L.C.; Choong, T.S.Y.; Lau, K.L.; Alias, N.H. Simultaneous adsorption of malachite green and methylene blue dyes in a fixed-bed column using poly(acrylonitrile-co-acrylic acid) modified with thiourea. Molecules 2020, 25, 2650. [Google Scholar] [CrossRef]
  7. Podasca, V.E.; Damaceanu, M.D. Photopolymerized films with ZnO and doped ZnO particles used as efficient photocatalysts in malachite green dye decomposition. Appl. Sci. 2020, 10, 1954. [Google Scholar] [CrossRef] [Green Version]
  8. Tayade, R.J.; Surolia, P.K.; Lazar, M.A.; Jasra, R.V. Enhanced photocatalytic activity by silver metal ion exchanged nay zeolite photocatalysts for the degradation of organic contaminants and dyes in aqueous medium. Ind. Eng. Chem. Res. 2008, 47, 7545–7551. [Google Scholar] [CrossRef]
  9. Sudha, M.; Saranya, A.; Selvakumar, G.; Sivakumar, N. Microbial degradation of azo dyes: A review. Int. J. Curr. Microbiol. Appl. Sci. 2014, 3, 670–690. [Google Scholar]
  10. Hasan, I.; Walia, S.; Alharbi, K.H.; Khanjer, M.A.; Alsalme, A.; Khan, R.A. Multi-walled carbon nanotube coupled β-cyclodextrin/pani hybrid photocatalyst for advance oxidative degradation of crystal violet. J. Mol. Liq. 2020, 317, 114216. [Google Scholar] [CrossRef]
  11. Kumar, A.; Sharma, G.; Naushad, M.; Singh, P.; Kalia, S. Polyacrylamide/Ni0.02Zn0.98O nanocomposite with high solar light photocatalytic activity and efficient adsorption capacity for toxic dye removal. Ind. Eng. Chem. Res. 2014, 53, 15549–15560. [Google Scholar] [CrossRef]
  12. Wang, Q.; Cai, C.; Wang, M.; Guo, Q.; Wang, B.; Luo, W.; Wang, Y.; Zhang, C.; Zhou, L.; Zhang, D.; et al. Efficient photocatalytic degradation of malachite green in seawater by the hybrid of zinc-oxide nanorods grown on three-dimensional (3D) reduced graphene oxide (RGO)/Ni foam. Materials 2018, 11, 1004. [Google Scholar] [CrossRef] [PubMed] [Green Version]
  13. Charanpahari, A.; Ghugal, S.G.; Umare, S.S.; Sasikala, R. Mineralization of malachite green dye over visible light responsive bismuth doped TiO2–ZrO2 ferromagnetic nanocomposites. New J. Chem. 2015, 39, 3629–3638. [Google Scholar] [CrossRef]
  14. Minero, C.; Lucchiari, M.; Vione, D.; Maurino, V. Fe(III)-enhanced sonochemical degradation of methylene blue in aqueous solution. Environ. Sci. Technol. 2005, 39, 8936–8942. [Google Scholar] [CrossRef] [PubMed]
  15. Cabello-Alvarado, C.; Andrade-Guel, M.; Pérez-Alvarez, M.; Cadenas-Pliego, G.; Cortés-Hernández, D.A.; Bartolo-Pérez, P.; Ávila-Orta, C.A.; Cruz-Delgado, V.J.; Zepeda-Pedreguera, A. Graphene nanoplatelets modified with amino-groups by ultrasonic radiation of variable frequency for potential adsorption of uremic toxins. Nanomaterials 2019, 9, 1261. [Google Scholar] [CrossRef] [PubMed] [Green Version]
  16. Bejarano-Pérez, N.J.; Suárez-Herrera, M.F. Sonochemical and sonophotocatalytic degradation of malachite green: The effect of carbon tetrachloride on reaction rates. Ultrason. Sonochem. 2008, 15, 612–617. [Google Scholar] [CrossRef]
  17. Bazrafshan, A.A.; Hajati, S.; Ghaedi, M. Synthesis of regenerable Zn(OH)2 nanoparticle-loaded activated carbon for the ultrasound-assisted removal of malachite green: Optimization, isotherm and kinetics. RSC Adv. 2015, 5, 79119–79128. [Google Scholar] [CrossRef]
  18. Kim, J.H.; Kim, H.E.; Kim, J.H.; Lee, J.S. Ferrites: Emerging light absorbers for solar water splitting. J. Mater. Chem. A 2020, 8, 9447–9482. [Google Scholar] [CrossRef]
  19. Diodati, S.; Walton, R.I.; Mascotto, S.; Gross, S. Low-temperature wet chemistry synthetic approaches towards ferrites. Inorg. Chem. Front. 2020, 7, 3282–3314. [Google Scholar] [CrossRef]
  20. Riaz, U.; Ashraf, S.M.; Raza, R.; Kohli, K.; Kashyap, J. Sonochemical facile synthesis of self-assembled poly(o-phenylenediamine)/cobalt ferrite nanohybrid with enhanced photocatalytic activity. Ind. Eng. Chem. Res. 2016, 55, 6300–6309. [Google Scholar] [CrossRef]
  21. Jia, J.; Du, X.; Zhang, Q.; Liu, E.; Fan, J. Z-scheme MgFe2O4/Bi2MoO6 heterojunction photocatalyst with enhanced visible light photocatalytic activity for malachite green removal. Appl. Surf. Sci. 2019, 492, 527–539. [Google Scholar] [CrossRef]
  22. Nadumane, A.; Shetty, K.; Anantharaju, K.S.; Nagaswarupa, H.P.; Rangappa, D.; Vidya, Y.S.; Nagabhushana, H.; Prashantha, S.C. Sunlight photocatalytic performance of Mg-doped nickel ferrite synthesized by a green sol-gel route. J. Sci. Adv. Mater. Devices 2019, 4, 89–100. [Google Scholar] [CrossRef]
  23. Kaneva, N.V.; Dushkin, C.D. Tuning of the UV Photocatalytic activity of ZnO using zinc ferrite(III): Powders and thin films prepared of powders. Colloids Surfaces A Physicochem. Eng. Asp. 2011, 382, 211–218. [Google Scholar] [CrossRef]
  24. Shabbir, A.; Ajmal, S.; Shahid, M.; Shakir, I.; Agboola, P.O.; Warsi, M.F. Zirconium substituted spinel nano-ferrite Mg0.2Co0.8Fe2O4 particles and their hybrids with reduced graphene oxide for photocatalytic and other potential applications. Ceram. Int. 2019, 45, 16121–16129. [Google Scholar] [CrossRef]
  25. Kefeni, K.K.; Mamba, B.B. Photocatalytic application of spinel ferrite nanoparticles and nanocomposites in wastewater treatment: Review. Sustain. Mater. Technol. 2020, 23, e00140. [Google Scholar] [CrossRef]
  26. Reddy, D.H.K.; Yun, Y.S. Spinel ferrite magnetic adsorbents: Alternative future materials for water purification? Coord. Chem. Rev. 2016, 315, 90–111. [Google Scholar] [CrossRef]
  27. Liu, S.Q.; Xiao, B.; Feng, L.R.; Zhou, S.S.; Chen, Z.G.; Liu, C.B.; Chen, F.; Wu, Z.Y.; Xu, N.; Oh, W.C.; et al. Graphene oxide enhances the fenton-like photocatalytic activity of nickel ferrite for degradation of dyes under visible light irradiation. Carbon N. Y. 2013, 64, 197–206. [Google Scholar] [CrossRef]
  28. Hasmath Farzana, M.; Meenakshi, S. Synergistic effect of chitosan and titanium dioxide on the removal of toxic dyes by the photodegradation technique. Ind. Eng. Chem. Res. 2014, 53, 55–63. [Google Scholar] [CrossRef]
  29. Zhang, S.; Li, J.; Li, J.; Du, N.; Li, D.; Li, F.; Man, J. Application status and technical analysis of chitosan-based medical dressings: A review. RSC Adv. 2020, 10, 34308–34322. [Google Scholar] [CrossRef]
  30. Foszpańczyk, M.; Bilińska, L.; Gmurek, M.; Ledakowicz, S. Heterogeneous oxidation of phenolic compounds with photosensitizing catalysts incorporated into chitosan. Catalysts 2019, 9, 891. [Google Scholar] [CrossRef] [Green Version]
  31. Othman, N.; Masarudin, M.; Kuen, C.; Dasuan, N.; Abdullah, L.; Md. Jamil, S. Synthesis and optimization of chitosan nanoparticles loaded with l-ascorbic acid and thymoquinone. Nanomaterials 2018, 8, 920. [Google Scholar] [CrossRef] [Green Version]
  32. Todorov, A.R.; Aikonen, S.; Muuronen, M.; Helaja, J. Visible-light-photocatalyzed reductions of N-heterocyclic nitroaryls to anilines utilizing ascorbic acid reductant. Org. Lett. 2019, 21, 3764–3768. [Google Scholar] [CrossRef] [PubMed]
  33. D’Amato, C.A.; Giovannetti, R.; Zannotti, M.; Rommozzi, E.; Minicucci, M.; Gunnella, R.; Di Cicco, A. Band gap implications on nano-TiO2 surface modification with ascorbic acid for visible light-active polypropylene coated photocatalyst. Nanomaterials 2018, 8, 599. [Google Scholar] [CrossRef] [PubMed] [Green Version]
  34. Gioria, E.; Marchesini, F.A.; Soldati, A.; Giorello, A.; Hueso, J.L.; Gutierrez, L. Green synthesis of a Cu/SiO2 catalyst for efficient H2-SCR of NO. Appl. Sci. 2019, 9, 4075. [Google Scholar] [CrossRef] [Green Version]
  35. Leybo, D.; Tagirov, M.; Permyakova, E.; Konopatsky, A.; Firestein, K.; Tuyakova, F.; Arkhipov, D.; Kuznetsov, D. Ascorbic acid-assisted polyol synthesis of iron and Fe/Go, Fe/h-BN Composites for Pb2+ removal from wastewaters. Nanomaterials 2020, 10, 37. [Google Scholar] [CrossRef] [PubMed] [Green Version]
  36. Scherrer, P. Estimation of the size and internal structure of colloidal particles by means of rontgen rays. Nachr. Ges. Wiss. Göttingen 1918, 26, 98–100. [Google Scholar]
  37. Rodrigues, A.R.O.; Gomes, I.T.; Almeida, B.G.; Araújo, J.P.; Castanheira, E.M.S.; Coutinho, P.J.G. Magnetic liposomes based on nickel ferrite nanoparticles for biomedical applications. Phys. Chem. Chem. Phys. 2015, 17, 18011–18021. [Google Scholar] [CrossRef]
  38. Ortiz-Quiñonez, J.L.; Pal, U.; Villanueva, M.S. Structural, magnetic, and catalytic evaluation of spinel Co, Ni, and Co–Ni ferrite nanoparticles fabricated by low-temperature solution combustion process. ACS Omega 2018, 3, 14986–15001. [Google Scholar] [CrossRef]
  39. Xia, Y.; He, Z.; Su, J.; Tang, B.; Hu, K.; Lu, Y.; Sun, S.; Li, X. Fabrication of magnetically separable NiFe2O4/BiOI nanocomposites with enhanced photocatalytic performance under visible-light irradiation. RSC Adv. 2018, 8, 4284–4294. [Google Scholar] [CrossRef] [Green Version]
  40. Ramezani, S.; Ghazitabar, A.; Sadrnezhaad, S.K. Synthesis and characterization of chitosan coating of NiFe2O4 nanoparticles for biomedical applications. J. Iran. Chem. Soc. 2016, 13, 2069–2076. [Google Scholar] [CrossRef]
  41. Zhang, H.Y.; Hao, X.P.; Mo, L.P.; Liu, S.S.; Zhang, W.B.; Zhang, Z.H. A magnetic metal-organic framework as a highly active heterogeneous catalyst for one-pot synthesis of 2-Substituted alkyl and aryl(indolyl)kojic acid derivatives. New J. Chem. 2017, 41, 7108–7115. [Google Scholar] [CrossRef]
  42. Bindra Narang, S.; Pubby, K. Nickel spinel ferrites: A review. J. Magn. Magn. Mater. 2020, 167163. [Google Scholar]
  43. Kombaiah, K.; Vijaya, J.J.; Kennedy, L.J.; Kaviyarasu, K. Catalytic studies of NiFe2O4 nanoparticles prepared by conventional and microwave combustion method. Mater. Chem. Phys. 2019, 221, 11–28. [Google Scholar] [CrossRef]
  44. Sivakumar, P.; Ramesh, R.; Ramanand, A.; Ponnusamy, S.; Muthamizhchelvan, C. Synthesis and characterization of NiFe2O4 nanoparticles and nanorods. J. Alloys Compd. 2013, 563, 6–11. [Google Scholar] [CrossRef]
  45. Iacovita, C.; Stiufiuc, G.F.; Dudric, R.; Vedeanu, N.; Tetean, R.; Stiufiuc, R.I.; Lucaciu, C.M. Saturation of specific absorption rate for soft and hard spinel ferrite nanoparticles synthesized by polyol process. Magnetochemistry 2020, 6, 23. [Google Scholar] [CrossRef]
  46. Shi, Z.; Zhang, J.; Gao, D.; Zhu, Z.; Yang, Z.; Zhang, Z. Giant magnetoelectric coupling observed at high frequency in NiFe2O4–BaTiO3 particulate composite. RSC Adv. 2020, 10, 27242–27248. [Google Scholar] [CrossRef]
  47. Sellmyer, D.; Skomski, R. Advanced Magnetic Nanostructures; Springer: New York, NY, USA, 2006. [Google Scholar]
  48. Skomski, R.; Zhou, J. Nanomagnetic Models. In Advanced Magnetic Nanostructures; Springer: New York, NY, USA, 2006; pp. 41–90. [Google Scholar]
  49. Hasan, I.; Khan, R.A.; Alharbi, W.; Alharbi, K.H.; Abu Khanjer, M.; Alslame, A. Synthesis, characterization and photo-catalytic activity of guar-gum: G-aliginate@silver bionanocomposite material. RSC Adv. 2020, 10, 7898–7911. [Google Scholar] [CrossRef] [Green Version]
  50. Ahmad, A.; Wei, Y.; Syed, F.; Imran, M.; Khan, Z.U.H.; Tahir, K.; Khan, A.U.; Raza, M.; Khan, Q.; Yuan, Q. Size dependent catalytic activities of green synthesized gold nanoparticles and electro-catalytic oxidation of catechol on gold nanoparticles modified electrode. RSC Adv. 2015, 5, 99364–99377. [Google Scholar] [CrossRef]
  51. Maria Magdalane, C.; Kaviyarasu, K.; Judith Vijaya, J.; Jayakumar, C.; Maaza, M.; Jeyaraj, B. Photocatalytic degradation effect of malachite green and catalytic hydrogenation by UV–Illuminated CeO2/CdO multilayered nanoplatelet arrays: Investigation of antifungal and antimicrobial activities. J. Photochem. Photobiol. B Biol. 2017, 169, 110–123. [Google Scholar] [CrossRef]
  52. Kaviyarasu, K.; Ayeshamariam, A.; Manikandan, E.; Kennedy, J.; Ladchumananandasivam, R.; Umbelino Gomes, U.; Jayachandran, M.; Maaza, M. Solution Processing of CuSe quantum dots: Photocatalytic activity under RhB for UV and visible-light solar irradiation. Mater. Sci. Eng. B Solid-State Mater. Adv. Technol. 2016, 210, 1–9. [Google Scholar] [CrossRef]
  53. Yong, L.; Zhanqi, G.; Yuefei, J.; Xiaobin, H.; Cheng, S.; Shaogui, Y.; Lianhong, W.; Qingeng, W.; Die, F. Photodegradation of malachite green under simulated and natural irradiation: Kinetics, products, and pathways. J. Hazard. Mater. 2015, 285, 127–136. [Google Scholar] [CrossRef] [PubMed]
  54. Kundu, A.; Mondal, A. Kinetics, isotherm, and thermodynamic studies of methylene blue selective adsorption and photocatalysis of malachite green from aqueous solution using layered Na-intercalated Cu-doped Titania. Appl. Clay Sci. 2019, 183, 105323. [Google Scholar] [CrossRef]
  55. Deivasigamani, P.; Maheswari, M.A. Soft synthesis of potassium Co-Doped Al-ZnO nanocomposites: A comprehensive study on their visible-light driven photocatalytic activity on dye degradation. Artic. J. Mater. Sci. 2016, 51, 8187–8208. [Google Scholar]
  56. Shandilya, P.; Mittal, D.; Soni, M.; Raizada, P.; Lim, J.H.; Jeong, D.Y.; Dewedi, R.P.; Saini, A.K.; Singh, P. Islanding of EuVO4 on high-dispersed fluorine doped few layered graphene sheets for efficient photocatalytic mineralization of phenolic compounds and bacterial disinfection. J. Taiwan Inst. Chem. Eng. 2018, 93, 528–542. [Google Scholar] [CrossRef]
  57. Thejaswini, T.V.L.; Prabhakaran, D.; Maheswari, M.A. Ultrasound assisted synthesis of nano-rod embedded petal designed α-bi2o3-zno nanoparticles and their ultra-responsive visible light induced photocatalytic properties. J. Photochem. Photobiol. A Chem. 2017, 335, 217–229. [Google Scholar] [CrossRef]
Figure 1. FTIR spectra of chitosan-ascorbic acid@NiFe2O4 (magenta line) with its individual constituents NiFe2O4 (black line), chitosan CT (red line), and ascorbic acid AS (blue line).
Coatings 10 01200 g001
Figure 2. Differential scanning calorimetry plot for chitosan-ascorbic acid@NiFe2O4 (inset showing the fusion and crystallization process) within the temperature range of 50–350 °C.
Coatings 10 01200 g002
Figure 3. Scanning electron microscopy images of: (a) chitosan at 10 μm scale, (b) chitosan-ascorbic acid@NiFe2O4 at 5 μm scale, (c) the Gaussian distribution of particle size, and (d) energy dispersive X-ray spectrum of chitosan-ascorbic acid@NiFe2O4 in the 0–10 KeV range.
Coatings 10 01200 g003aCoatings 10 01200 g003b
Figure 4. UV-Vis plot of chitosan-ascorbic acid@NiFe2O4 in wavelength range of 350–600 nm (inset shows Tauc’s plot for calculating the band gap energy (Eg) of the material).
Coatings 10 01200 g004
Figure 5. Magnetization vs. applied magnetic field curve for chitosan-ascorbic acid@NiFe2O4 at 25 °C.
Coatings 10 01200 g005
Figure 6. (a) UV-Vis action curve for the effect of variable concentration of MG (10–70 mg·L−1) and (b) MG concentration vs. percent degradation graph using 20 mg catalyst under 6.35 W·mL−1 ultrasonic power.
Coatings 10 01200 g006
Figure 7. UV-Vis action curve for the effect of variable pH of MG solution at (a) 35 mg·L−1, (b) 55 mg·L−1, and (c) 70 mg·L−1 MG concentration, and (d) Ce/Co curve with respect to variable pH conditions using 20 mg catalyst under 6.35 W mL−1 ultrasonic power.
Coatings 10 01200 g007
Figure 8. UV-Vis action curve for the effect of variable sonication time for visible irradiation at (a) 35 mg·L−1, (b) 55 mg·L−1, and (c) 70 mg·L−1 MG concentration, and (d) Ce/Co curve with respect to sonication time using 20 mg catalyst under 115 W ultrasonication and pH 8.
Coatings 10 01200 g008
Figure 9. UV-Vis action curve for the effect of variable ultrasonication power density under visible irradiation for (a) 35 mg·L−1, (b) 55 mg·L−1, and (c) 70 mg·L−1 MG concentration, and (d) percent MG degradation vs. MG concentration plot using 20 mg catalyst, pH 8, and 90-min irradiation time.
Coatings 10 01200 g009
Figure 10. (a) Linear regression plot of pseudo first-order fit and (b) pseudo second-order fit at 35, 55, and 70 mg·L−1 MG concentrations using 20 mg catalyst, pH 8, 5–90-min irradiation time and 6.35 W mL−1 ultrasonic power.
Coatings 10 01200 g010
Figure 11. Examination of the effect of various scavengers to observe the type of reactive oxidant (RO) involved in photocatalytic degradation using 20 mg catalyst with 20 mL of 70 mg·L−1 MG and 3 mM solution of each scavenger at pH 8, 90 min irradiation time, and 6.35 W·mL−1 ultrasonic power.
Coatings 10 01200 g011
Figure 12. Mineralization of MG during the sonophotocatalysis with CTAS@NIFE for (a) total organic carbon (TOC) study and (b) chemical oxygen demand (COD) study.
Coatings 10 01200 g012
Table 1. Differential scanning calorimetry analysis results for chitosan-ascorbic acid@NiFe2O4 within the temperature range of 50–350 °C.
Initial Temperature (°C)Final Temperature (°C)Enthalpy of Fusion (J/g)Heat Capacity at Ti (J/g·°C)Enthalpy of Crystallization (J/g)
276292186.689.91650.43
Table 2. Pseudo first- and second-order kinetic parameters for photodegradation of malachite green by chitosan-ascorbic acid@NiFe2O4 for 35, 55, and 70 mg·L−1 MG degradation at pH 8 for a time irradiation range of 5–90 min at 25 °C.
S.N.Concentration (mg·L−1)Pseudo First OrderPseudo Second Order
Rate Constant (K1) (min−1)Half-Life t1/2 (min)R2RMSERate Constant (K2) (L·mg−1·min−1)Half-Life t1/2 (min)R2RMSE
1350.0417.320.990.060.0132.050.800.21
2550.0513.860.990.110.0200.900.740.37
3700.0611.550.940.180.0440.330.670.93
Publisher’s Note: MDPI stays neutral with regard to jurisdictional claims in published maps and institutional affiliations.

