Measuring the Wall Thickness of a Trailing Arm Using Ultrasonic Measurement Model

1
School of Traffic and Transportation Engineering, Central South University, Changsha 410075, China
2
Inner Mongolia Metallic Materials Research Institute of China, Ningbo 315103, China
3
Railway Infrastructure Inspection Center, China State Railway Group Co., Ltd., No.2, Beijing 100081, China
4
School of Mechanical and Electrical Engineering, Central South University of Forestry and Technology, Changsha 410004, China
*
Author to whom correspondence should be addressed.
Coatings 2020, 10(8), 773; https://doi.org/10.3390/coatings10080773
Submission received: 19 June 2020
/
Revised: 4 August 2020
/
Accepted: 6 August 2020
/
Published: 8 August 2020
(This article belongs to the Special Issue Advanced Nondestructive Evaluation and Characterization of Surface)
Abstract
:Trailing arms are widely used in the automobiles’ suspension system, and effective detection of their wall thickness is essential to ensure their mechanical properties and to evaluate the casting process. In this work, an ultrasonic measurement model (UMM) is firstly established with consideration of the curvature and thickness of the trailing arm, then the UMM is introduced to predict the theoretical ultrasonic waveforms with different hypothetical thicknesses of the trailing arm. Next, the experimental ultrasonic waveforms are collected and matched with the predicted theoretical waveforms by using the correlation matching algorithm. The hypothetical thickness with the best match is regarded as the wall thickness of the trailing arm. Finally, an automatic ultrasonic experiment was conducted on a trailing arm with a 5-degrees of freedom (DOF) manipulator, in which the ultrasonic beam can radiate into a trailing arm at normal incidence. The results are compared with those determined by the micrometer and microscope, showing that their relative errors are controlled within 0.08 mm, which reveals the effectiveness of the present method. The method can also work for wall thickness measurements of curved components with CAD models.
1. Introduction
The trailing arm is an important casting in the suspension system that connects the vehicle’s axle to its chassis; the wall thickness has a great impact on its quality in practical application [1,2]. The thickness tolerance can show the casting performance in manufacturing. Therefore, it is essential to accurately measure the thickness distribution of trailing arms.
Several methods can be adopted in thickness measurement [3], such as micrometer, eddy current, ultrasonic pulse-echo method [4], ultrasonic resonance method [5], etc. The micrometer measurement accuracy is high, but it cannot measure the wall thickness before destroying a trailing arm. Eddy current thickness gauge is mainly used for the thickness determination of the nonmagnetic coating upon the ferromagnetic material [3]. At present, commercial thickness gauges with the ultrasonic pulse-echo method have been widely used for thickness measurement [5,6]. Where a component with a curved surface is concerned, the thickness measurement accuracy is poor because the ultrasonic transducer cannot be coupled well with the component surface. The measurement accuracy is also affected by operators, while non-contact ultrasonic methods can overcome this limit because water can act as couplant between the transducer and component [4], and the non-contact ultrasonic method can determine the thickness automatically with the ultrasonic measurement system. Where the ultrasonic resonance method is concerned, the calculation of theoretical resonance frequencies of double-curved components is complicated and sensitive to the inputs, and the matching errors of resonance frequencies are unavoidable in experiments.
It is well known that the accurate result of ultrasonic thickness measurement depends on both velocity and time of flight (TOF) [7]. However, the wall of a trailing arm has a double-curved surface, and the varying curvature can heavily distort the echoes of ultrasound, meaning that how to compensate and determine TOF is key to the problem. Although many papers regarding ultrasonic thickness measurement have been published, they cannot be directly applied to wall thickness measurement for double-curved components because they have not considered the curvatures.
In this work, an ultrasonic measurement model is introduced to predict theoretical waveforms for trailing arms in Section 2, and a correlation matching algorithm is developed to obtain the wall thickness by matching theoretical waveforms with the experimental waveform. Experiments with the 5-DOF ultrasonic testing system are presented in Section 3; the analysis is also included to show the validity of the present method. Finally, the conclusions are drawn in Section 4.
2. Method
2.1. The Overall Scheme
The overall scheme of the method is shown in Figure 1. The curvature, velocity, density and hypothetical wall thickness of the trailing arm are included to develop the ultrasonic measurement model; the theoretical ultrasonic waveform can be predicted for the trailing arm; ultrasonic experiment is conducted to obtain a real waveform, and then it is matched with the predicted waveform by using a correlation coefficient, which will be shown in Section 2.3. The hypothetical thickness is output as the measurement result if the correlation coefficient is a maximum.
2.2. An Ultrasonic Measurement Model for Trailing Arm
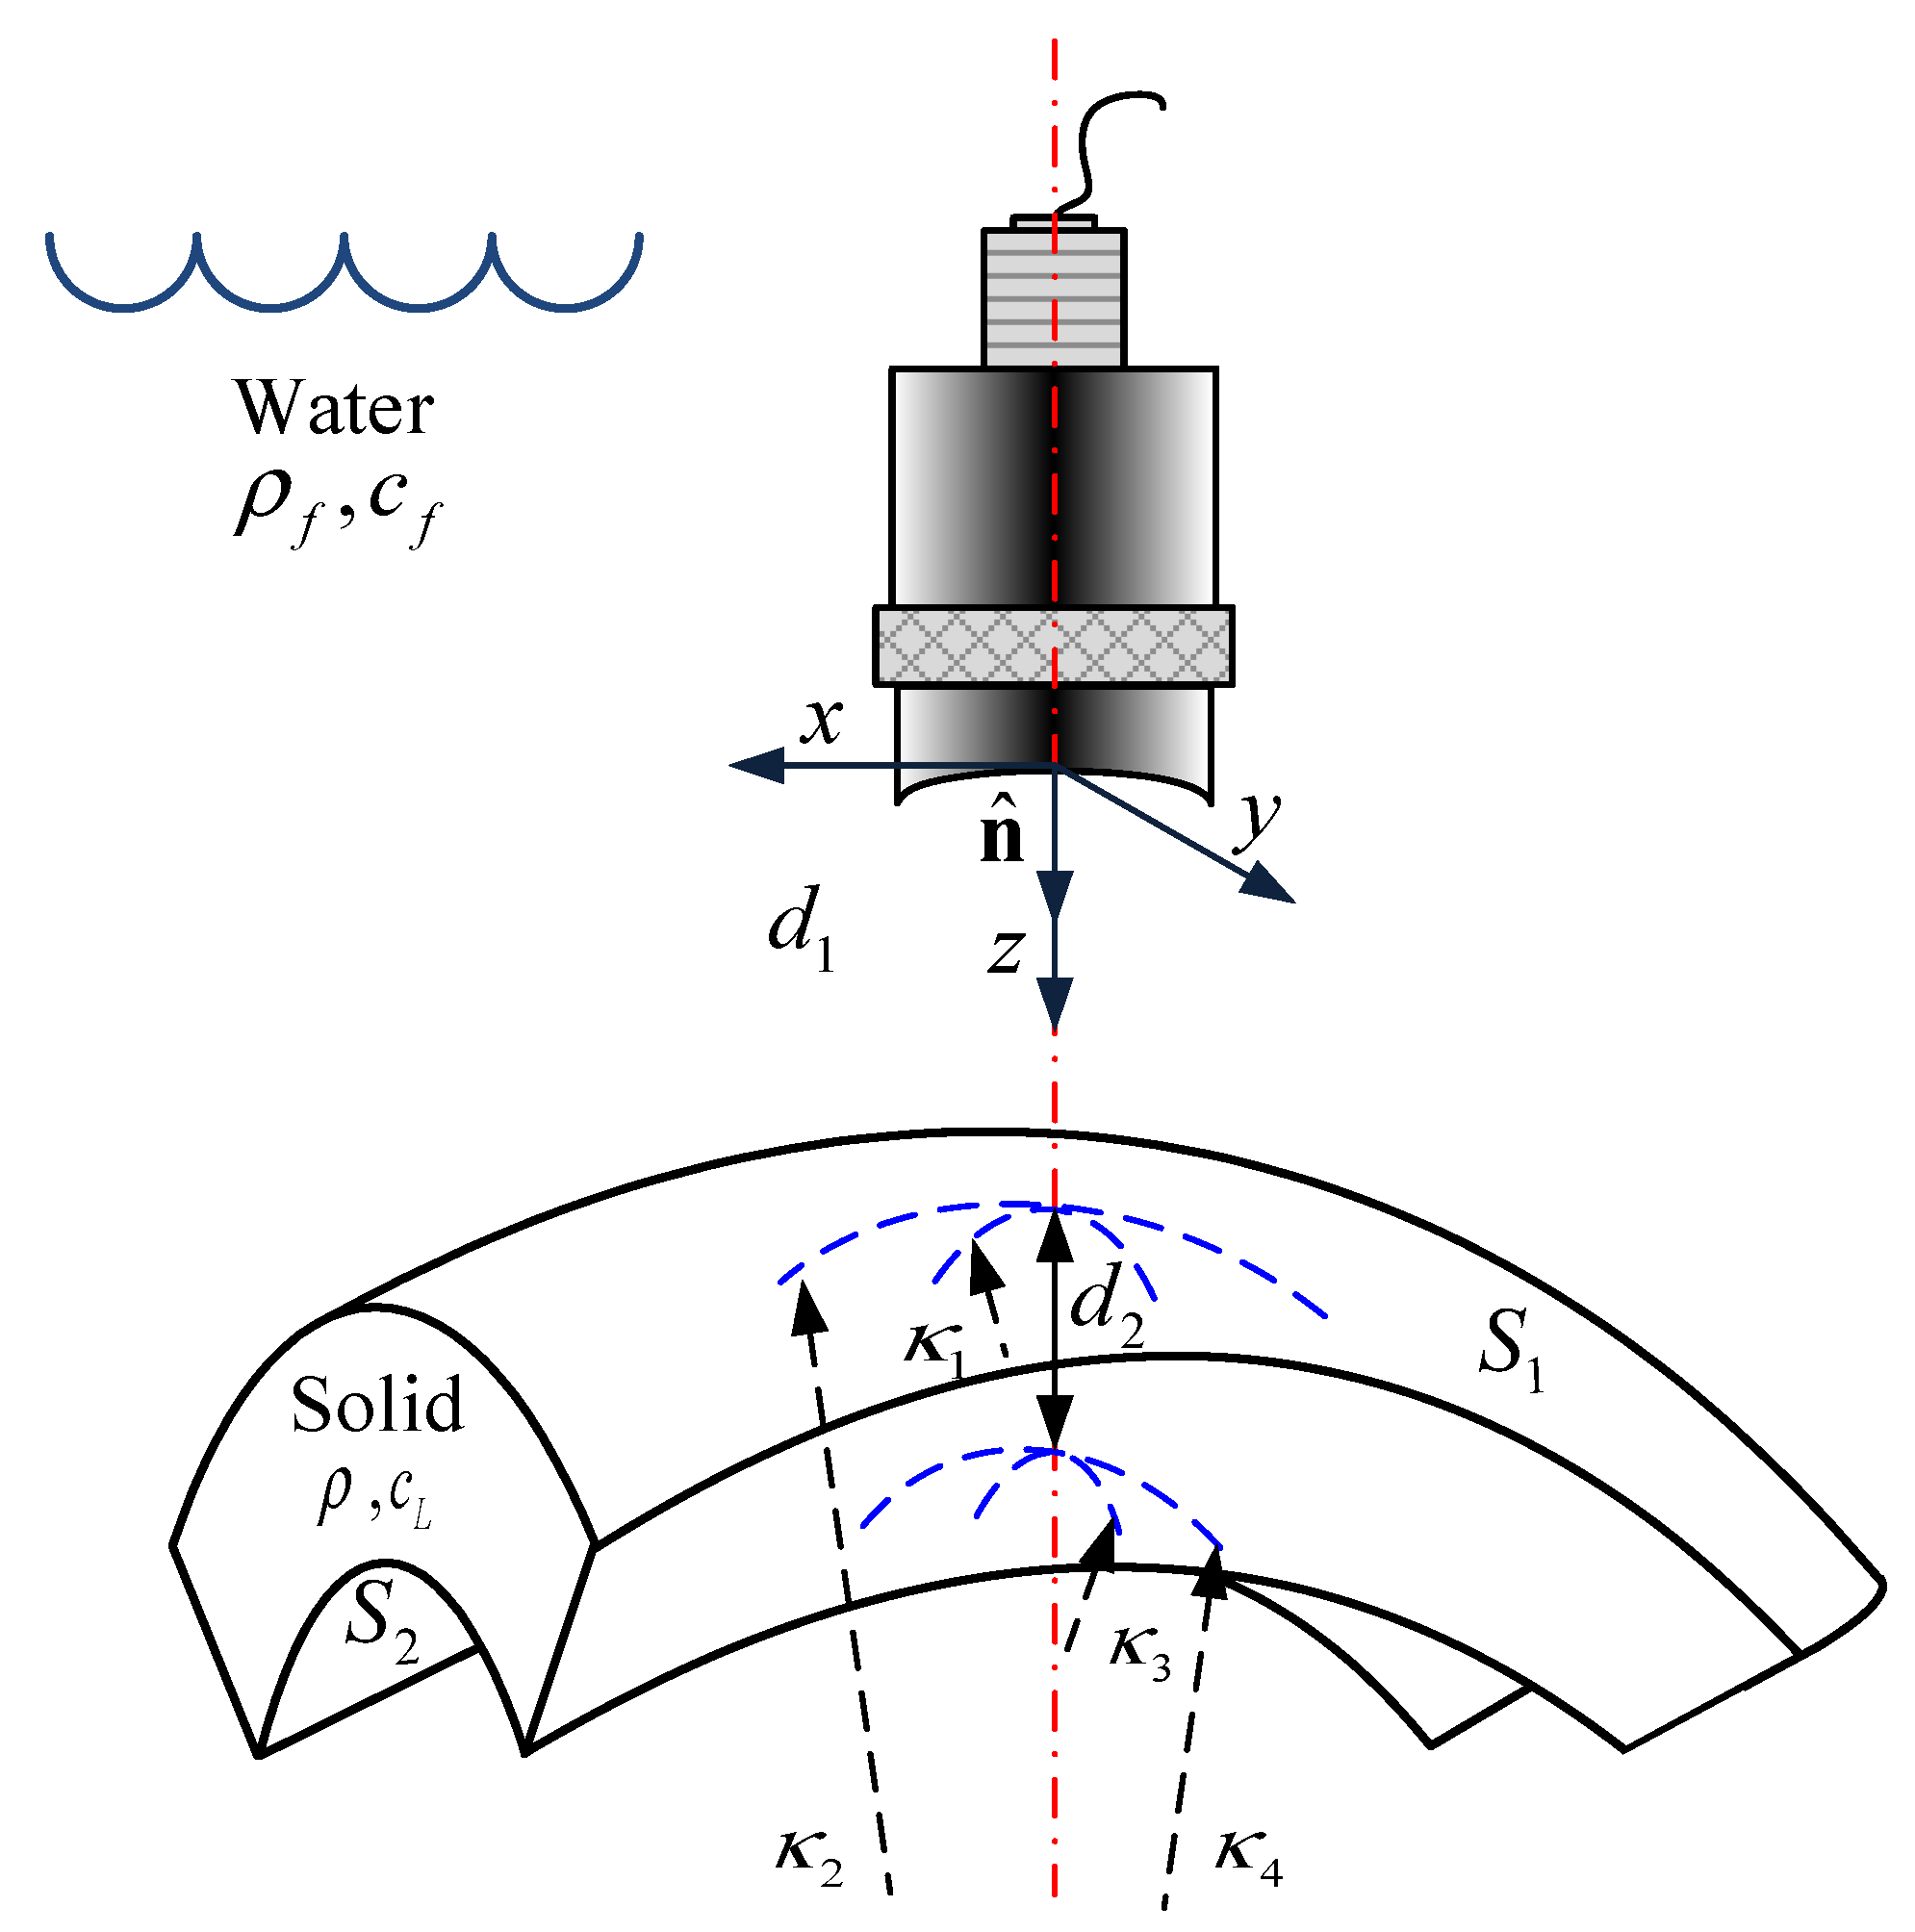
Figure 2 shows a pulse-echo ultrasonic measurement system with a focused transducer interrogating a trailing arm immersed in water. The sound beam emitted from the transducer T is incident on the outer surface S1 of the trailing arm along the normal direction of the interface. Some energy is reflected; the rest passes through the interface and propagates into the inner surface S2. Reflection, refraction, and mode conversion will also occur at the S2. Finally, part of the sound beam returns to the transducer T along the original path. The sound beam direction follows Snell’s law. The sound field is modeled to study the influence of the curvature and thickness on the waveform. In this work, the ABCD matrix and Multi-Gaussian beam [8] superposition method are used to establish the spatial sound field distribution model from transducer to the trailing arm. The sound field distribution of frontwall and backwall can be written as [8,9,10]
and
where , , is Gaussian coefficient, is the serial number of the Gaussian coefficient, is the beam frequency, is the spatial distribution of the sound field at the receiver, is a section perpendicular to the direction of sound beam propagation , is the surface velocity of the transducer, is the density of water, is the velocity of sound in water, is the velocity of sound in solid, is the unit vector of sound beam propagation direction, is water path, is the sound beam propagation distance in the trailing arm, which is the wall thickness of the target incident point. and are transmission coefficients, which are related to curvature , , and . is the reflection coefficient. and are the matrixes related to the amplitude and phase of the sound beam in sound beam propagation.
The derivation and calculation of the above parameters can be found in Reference [11]. In a linear ultrasonic testing system, the strength of the received signal depends on the strength of the sound field received by the transducer, and the sound field received by the transducer is the response of each particle on the surface of the transducer. The average sound pressure on the surface of the transducer is used to indicate the strength of the received sound field, also known as transfer function, expressed as [9,12]:
Ultrasonic measurement model includes two main parts: one is the system function, , which only considers all the electrical and electromechanical parts in the measurement system; and the other is the elastic/acoustic transfer function, , which describes the propagation, reflection, scattering, and reception processes of ultrasonic acoustics. The ultrasonic measurement model can be written as [9,12]
In practical applications, the system influence factor is usually obtained by a direct measurement in a calibration setup, where the pulse-echo wave from a front planar surface at normal incidence is measured [13]. Combing the system function and transfer function, the frontwall and backwall echo can be predicted according to Equation (4).
2.3. Thickness Matching Algorithm
Assuming that the coefficient is introduced to correlate the waveform x(t) with the waveform as [14].
Thus, the approximate error of these two waveforms is obtained.
According to the minimum mean square error criterion, we know that:
when is minimum, these two waveforms match best, and we can get.
Substituting Equation (8) into Equation (7), the minimum approximation error can be obtained as:
Use waveform to normalize the minimum error,
Define that [15],
is the correlation coefficient of waveforms and , and the integral is converted into a numerical operation to obtain [15].
means two waveforms are completely correlated, means the two signals are completely uncorrelated and means partially correlated. These two waveforms match better when is bigger [16].
Where the hypothetical wall thickness is concerned, the time of flight of the experimental waveform y(t) is used to calculate the approximate thickness, and a gap of 0.01 mm is introduced to create the hypothetical wall thicknesses based on the approximate thickness with ±30% range.
3. Experiments and Analysis
3.1. Ultrasonic Measurement Setup
Figure 3a depicts the setup for ultrasonic experiments [17]. A DPR 300 ultrasonic pulse generator/receiver was employed to drive a spherically focused transducer (Panametrics V327, 2-inch focal length, Olympus Panametrics, Inc., Waltham, MA, USA) with the center frequency of , the effective element radius of and the pulse width of . Then, a computer-controlled 5-DOF manipulator was used to hold and adjust the transducer so that the ultrasonic beam can radiate into the trailing arm in the water tank at normal incidence [18]. Finally, a 200 MHz DAQ data acquisition card ADLINK PCIe-9852 was adopted to obtain the ultrasonic waveforms. The density and longitudinal velocity of the trailing arm were measured as , . The density and longitudinal velocity of water were measured as, . Curvature parameters are determined by the CAD model of the trailing arm.
As shown in Figure 3b, twelve points are selected from the trailing arm for thickness measurement, and three experimental waveforms are collected at each point. Since ultrasonic has a strong directivity, the incident direction of the acoustic beam shall be in agreement with the direction of normal vector of the point when ultrasonic signals are acquired [18], thus, the kinematic equation [19] for the 5-DOF manipulator is established according to the Denavit–Hartenberg parameters [20] and the CAD model of the trailing arm. All the joint variables can be inversely resolved from the kinematic equation of the manipulator [20]. The acoustic beam is then aligned with the points on the trailing arm by adjusting the attitude of the transducer. Please refer to the published work for details [18].
3.2. Measurement Results Analysis
According to the above-mentioned method, the ultrasonic waveforms obtained in the experiments are used to match with predicted waveforms, and three measurement results are averaged for the wall thickness of a certain point to suppress the random error, Table 1 shows the measurement results for a trailing arm.
To further illustrate the matching process of the proposed method, Figure 4 indicates an experimental waveform and two predicted waveforms when are 5.74 and 5.85 mm, and their correlation coefficients are 0.92 and 0.81, respectively. One can see from Figure 4 that the predicted waveform matches with experimental waveform better when the correlation coefficient is bigger. Note that these two predicted waveforms are calculated using the same parameters with different angles of incidence (2° and 0°), which shows that it is necessary for the ultrasonic beam to radiate into the trailing arm at normal incidence.
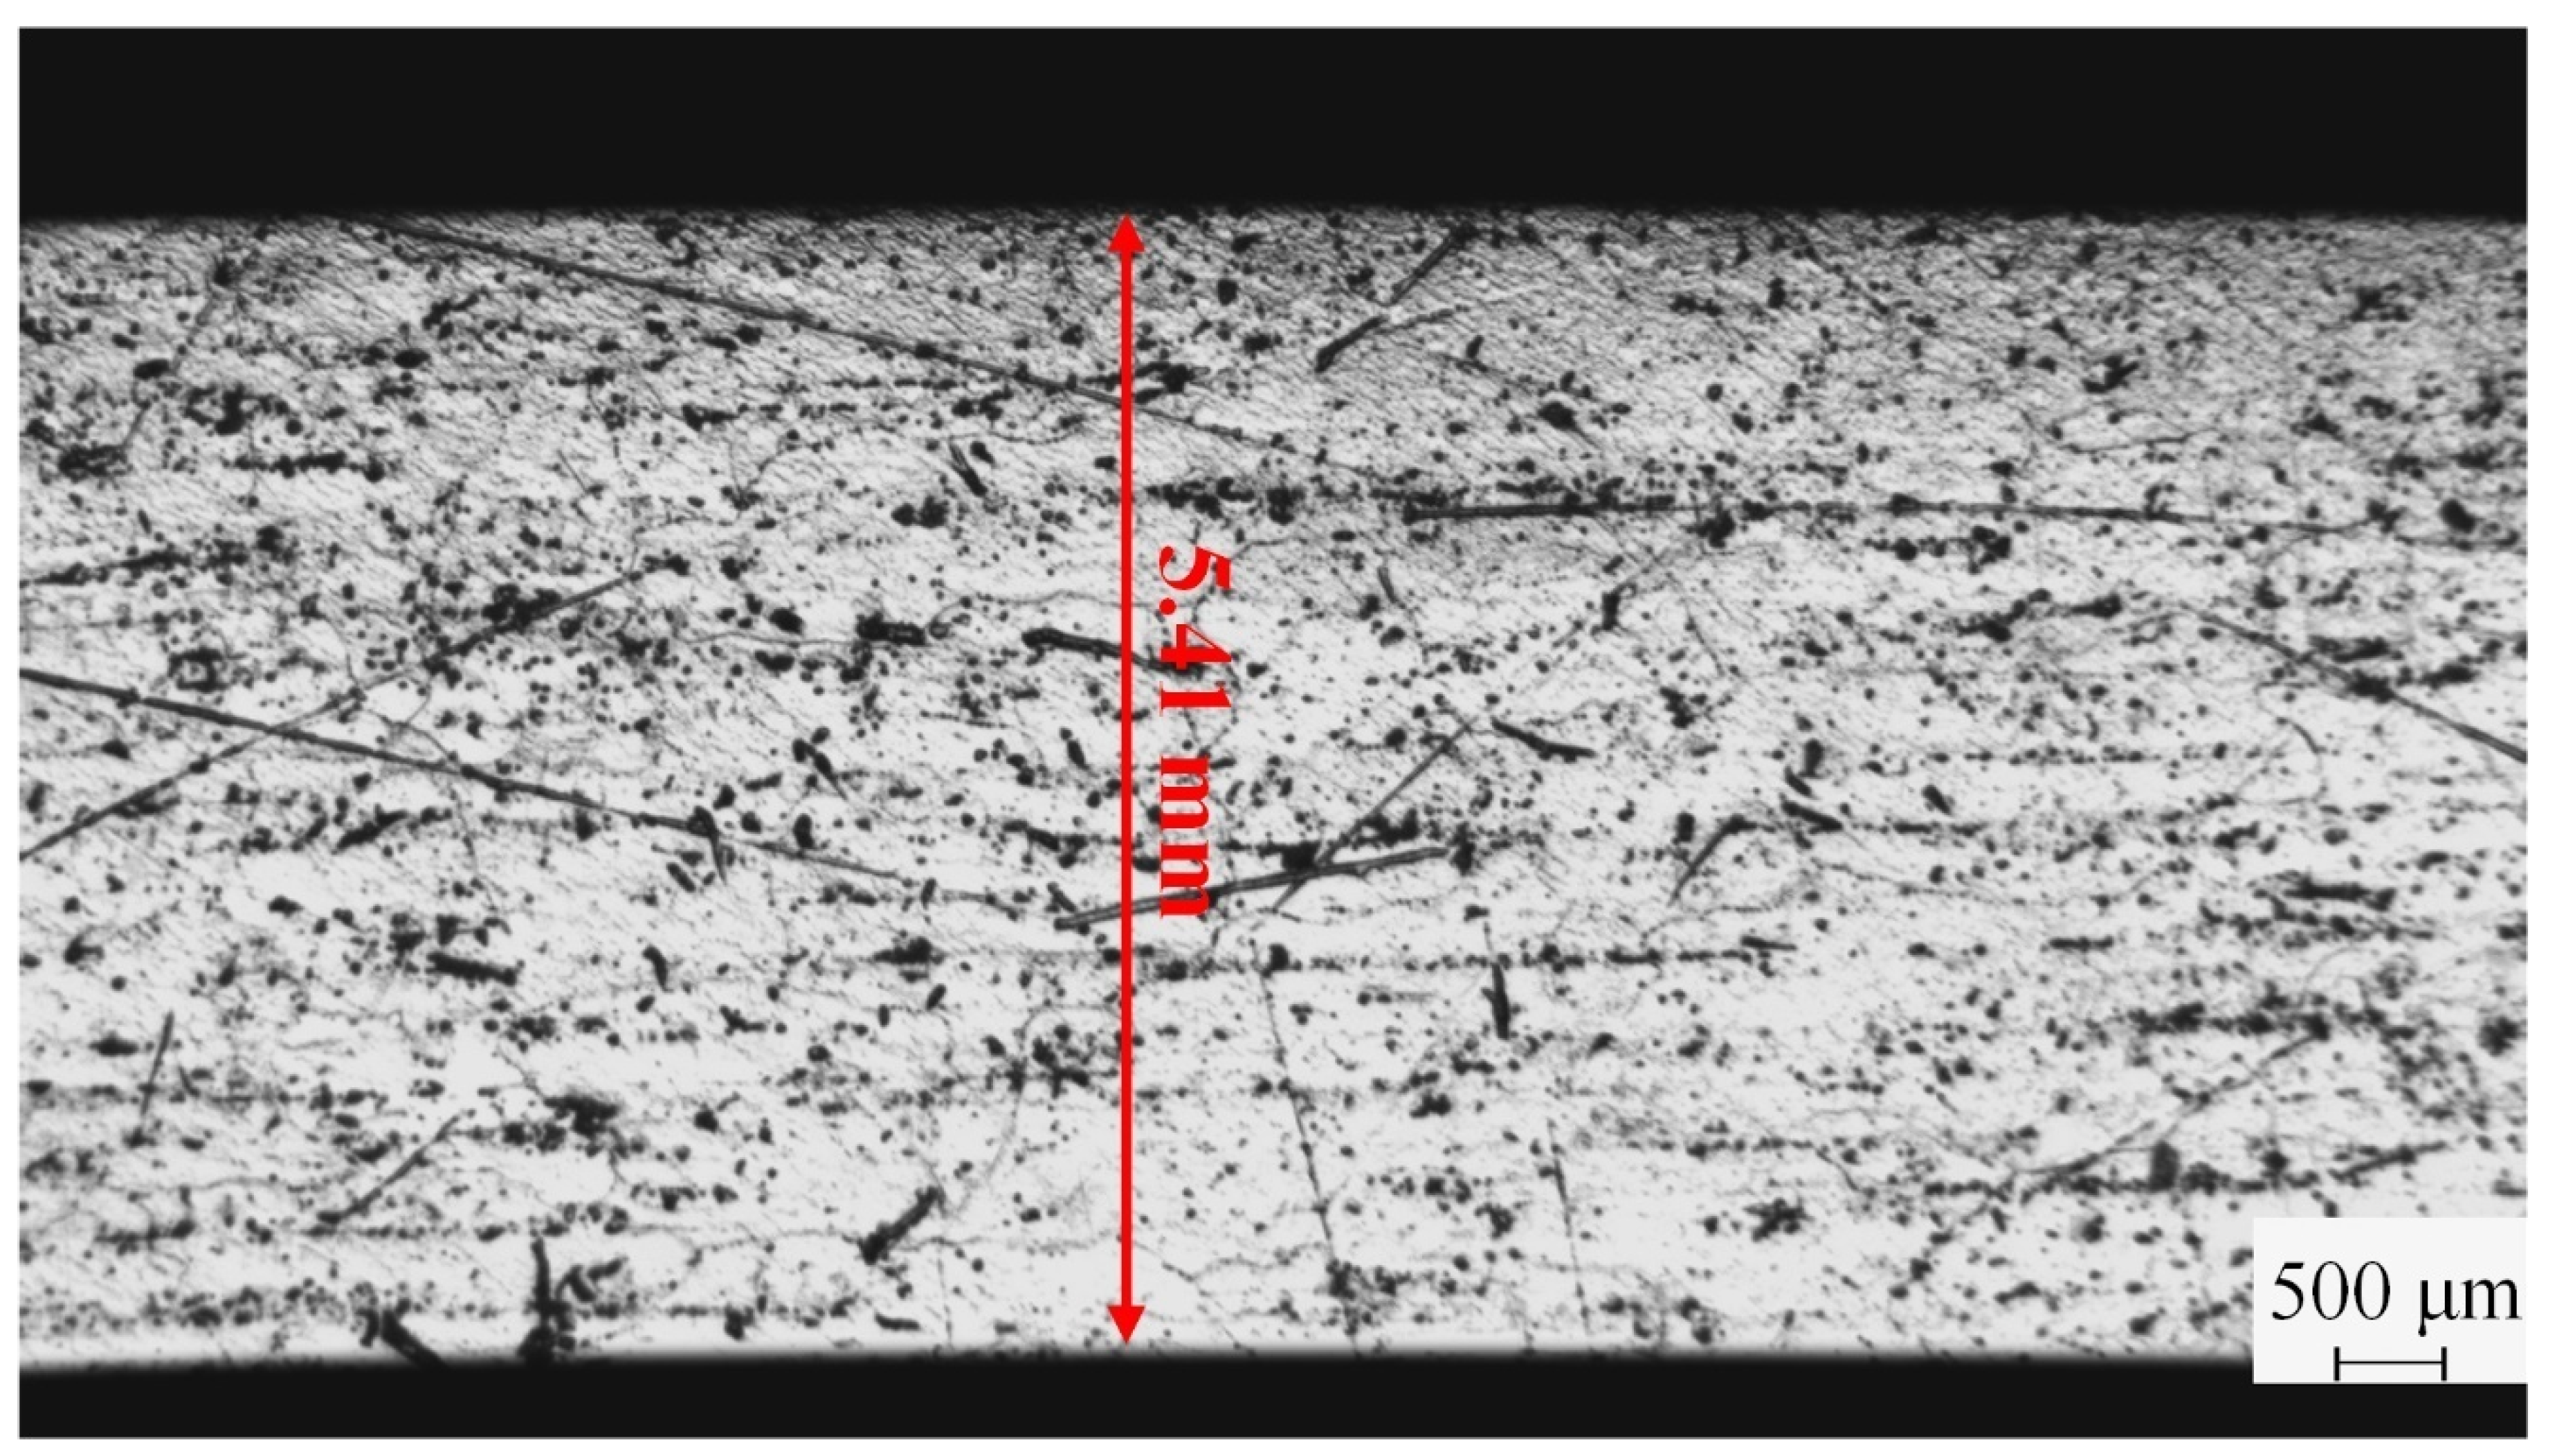
To verify the validity of automatic ultrasonic measurement, the trailing arm undergoes subdivision, stripping, and slicing, then the thickness measurement is performed on the planned points with a micrometer (Mitutoyo, M110-25), whose specification of measurement error is 0.01 mm. Table 2 shows the results measured with different methods and their relative errors. As this shows, the relative errors between the results measured with micrometer and the present method are within 0.08 mm, which meets the measurement requirement of a trailing arm manufactured by casting. Because the relative errors between the results measured with micrometer and the conventional ultrasonic thickness measurement method are much higher, the ultrasonic measurement accuracy will degrade if the curvature is not taken into consideration. In addition, Measurement with an Olympus SZX16 stereomicroscope is performed; Figure 5 indicates its measurement result of point 3, which agrees well the result determined by the present method.
The limitations for the applicability of the used approach include: CAD model of the component to be measured is required, the transducer must be carefully controlled so that ultrasonic beam radiates into the trailing arm at normal incidence, otherwise the experimental waveform cannot be obtained accurately, which results in measurement error. The measurement efficiency of the present method is not high; it generally takes 25 min to finish a trailing arm measurement.
4. Conclusions
In this work, an automatic measurement method was developed to measure the wall thickness of trailing arms nondestructively; the method can also work for wall thickness measurement of curved components with CAD models. The conclusions are drawn as follows:
- Both the curvature and thickness of the trailing arm are both introduced to calculate the predicted waveforms, so the present method has obvious advantages over the conventional ultrasonic thickness measurement method;
- A waveform matching method is developed to calculate the measured thickness;
- The relative errors between the results determined by the present method and micrometer are within 0.08 mm, but the present method does not need to destroy the trailing arm.
Author Contributions
Conceptualization, L.G.; methodology, F.C. and R.Z.; software, S.C.; validation, S.C. and Y.S.; formal analysis, Y.S.; investigation, S.C.; resources, F.C.; data curation, R.Z.; writing—original draft preparation, S.C.; writing—review and editing, F.C., L.G., and Y.S.; visualization, R.Z.; supervision, L.G.; project administration, L.G.; funding acquisition, F.C. All authors have read and agreed to the published version of the manuscript.
Funding
This research was funded by Natural Science Foundation of Hunan Province (grant no. 2020JJ4112) and Basic public welfare research project of Zhejiang Province (grant no. LGC19E010001).
Conflicts of Interest
The authors declare no conflict of interest.
References
- Kang, O.; Park, Y.; Park, Y.S.; Suh, M. Look-ahead preview control application to the high-mobility tracked vehicle model with trailing arms. J. Mech. Sci. Technol. 2009, 23, 914–917. [Google Scholar] [CrossRef]
- Margolis, D. The stability of trailing arm suspensions in heavy trucks. Int. J. Veh. Des. 2001, 25, 211–229. [Google Scholar] [CrossRef]
- Lian, M.; Liu, H.; Zhang, T.; Bo, Q.; Li, T.; Wang, Y. Ultrasonic on-machine scanning for thickness measurement of thin-walled parts: Modeling and experiments. Int. J. Adv. Manuf. Technol. 2019, 104, 2061–2072. [Google Scholar] [CrossRef]
- Han, Z.R.; Fan, Z.J.; Xiao, Y.; Jia, Z. A research on thickness distribution of oblique cone in dieless shear spinning. Int. J. Adv. Manuf. Technol. 2017, 90, 2901–2912. [Google Scholar] [CrossRef]
- Huang, N.; Yin, C.; Liang, L.; Hu, J.; Wu, S. Error compensation for machining of large thin-walled part with sculptured surface based on on-machine measurement. Int. J. Adv. Manuf. Technol. 2018, 96, 4345–4352. [Google Scholar] [CrossRef]
- Cong, S.; Gang, T. Ultrasonic thickness measurement for aluminum alloy irregular surface parts based on spectral analysis. Trans. Nonferr. Met. Soc. China 2012, 22, S323–S328. [Google Scholar] [CrossRef]
- Zhou, L.J.; Liu, H.B.; Lian, M.; Ying, Y.W.; Li, T.; Wang, Y.Q. Highly accurate adaptive TOF determination method for ultrasonic thickness measurement. Meas. Sci. Technol. 2018, 29, 045002. [Google Scholar] [CrossRef]
- Huang, R.J.; Schmerr, L.W.; Sedov, A. Multi-Gaussian ultrasonic beam modeling for multiple curved interfaces-An ABCD matrix approach. Res. Nondestruct. Eval. 2005, 16, 143–174. [Google Scholar] [CrossRef]
- Zhang, S.; Hu, P.; Li, X.; Jeong, H. Calibration of focused circular transducers using a multi-Gaussian beam model. Appl. Acoust. 2018, 133, 182–185. [Google Scholar] [CrossRef]
- Schmerr Jr, L.W.; Song, S.-J. Ultrasonic Nondestructive Evaluation Systems; Springer: New York, NY, USA, 2007; pp. 154–196. [Google Scholar]
- Kim, H.J.; Schmerr, L.W.; Sedov, A. Generation of the basis sets for multi-Gaussian ultrasonic beam models. In Review of Progress in Quantitative Nondestructive Evaluation, Proceedings of the 31st Annual Review of Progress in Quantitative Nondestructive Evaluation, Colorado Sch Mines, Golden, CO, USA, 25–30 July 2004; Thompson, D.O., Chimenti, D.E., Eds.; American Institute of Physics: New York, NY, USA, 2005. [Google Scholar] [CrossRef]
- Zhang, S.; Li, X.; Jeong, H. Analytical Diffraction Corrections for Circular Focused Transducers Expressed Using the Multi-Gaussian Beam Model. Acta Acust. United Acust. 2017, 103, 717–720. [Google Scholar] [CrossRef]
- Wang, W.; Liu, X.; Li, X.; Xu, G.; Zhang, S. Modeling Flaw Pulse-Echo Signals in Cylindrical Components Using an Ultrasonic Line-Focused Transducer with Consideration of Wave Mode Conversion. Sensors 2019, 19, 2744. [Google Scholar] [CrossRef] [PubMed] [Green Version]
- MacCoss, M.J.; Wu, C.C.; Liu, H.B.; Sadygov, R.; Yates, J.R. A correlation algorithm for the automated quantitative analysis of shotgun proteomics data. Anal. Chem. 2003, 75, 6912–6921. [Google Scholar] [CrossRef] [PubMed]
- Tsui, P.H. Minimum Requirement of Artificial Noise Level for Using Noise-Assisted Correlation Algorithm to Suppress Artifacts in Ultrasonic Nakagami Images. Ultrason. Imaging 2012, 34, 110–124. [Google Scholar] [CrossRef] [PubMed]
- Taylor, R. Interpretation of the Correlation Coefficient: A Basic Review. J. Diagn. Med Sonogr. 1990, 6, 35–39. [Google Scholar] [CrossRef]
- Li, X.B.; Zhou, X.J.; Zheng, H.F. Data compression for ultrasonic inspection. J. Zhejiang Univ. (Eng. Sci.) 2008, 42, 1251–1254. [Google Scholar] [CrossRef]
- Li, X.; Hu, H.; Yang, Y.; Ni, P.; Yang, C. Automatic ultrasonic inspection of flaws in a propeller-blade. Nondestruct. Test. Eval. 2010, 25, 341–351. [Google Scholar] [CrossRef]
- Balkan, T.; Ozgoren, M.K.; Arikan, M.A.S.; Baykurt, H.M. A kinematic structure-based classification and compact kinematic equations for six-dof industrial robotic manipulators. Mech. Mach. Theory 2001, 36, 817–832. [Google Scholar] [CrossRef]
- Lee, B.J. Differential Kinematics of Flexible Manipulator for Calibration of Model Parameters. Adv. Intell. Syst. Comput. 2013, 208, 359–373. [Google Scholar] [CrossRef]
Figure 1.
The overall flow chart of the thickness measurement.

Figure 2.
System composition of an ultrasonic measurement model.

Figure 3.
Automatic ultrasonic measurement: (a) experimental setup; (b) a trailing arm.

Figure 4.
Waveform matches at different correlation coefficients.

Figure 5.
Workpiece thickness measured by experiment.


Table 1.
Wall thickness measurement values of the trailing arms.
| Measurement No. | Point No. | |||||||||||
|---|---|---|---|---|---|---|---|---|---|---|---|---|
| 1 | 2 | 3 | 4 | 5 | 6 | 7 | 8 | 9 | 10 | 11 | 12 | |
| 1 | 4.15 | 5.18 | 4.98 | 6.22 | 5.73 | 4.83 | 5.14 | 5.45 | 6.32 | 5.70 | 5.01 | 5.22 |
| 2 | 4.17 | 5.23 | 5.03 | 6.28 | 5.74 | 4.82 | 5.10 | 5.49 | 6.28 | 5.66 | 4.97 | 5.26 |
| 3 | 4.16 | 5.22 | 5.02 | 6.25 | 5.69 | 4.84 | 5.15 | 5.44 | 6.33 | 5.65 | 4.99 | 5.27 |
| mean | 4.16 | 5.21 | 5.01 | 6.25 | 5.72 | 4.83 | 5.13 | 5.46 | 6.31 | 5.67 | 4.99 | 5.25 |
Table 2.
Comparisons between results measured with three different methods.
| No. | Results Measured with Micrometer (mm) | Results of Present Method (mm) | Relative ErrorI (mm) | Results of Conventional Ultrasonic Method (mm) | Relative ErrorII (mm) |
|---|---|---|---|---|---|
| 1 | 4.20 | 4.16 | 0.04 | 3.98 | 0.22 |
| 2 | 5.15 | 5.21 | 0.06 | 5.03 | 0.12 |
| 3 | 5.06 | 5.01 | 0.05 | 4.93 | 0.13 |
| 4 | 6.17 | 6.25 | 0.08 | 6.34 | 0.17 |
| 5 | 5.79 | 5.72 | 0.07 | 5.47 | 0.32 |
| 6 | 4.76 | 4.83 | 0.07 | 4.92 | 0.25 |
| 7 | 5.18 | 5.13 | 0.05 | 5.09 | 0.09 |
| 8 | 5.53 | 5.46 | 0.07 | 5.39 | 0.14 |
| 9 | 6.23 | 6.31 | 0.08 | 6.34 | 0.11 |
| 10 | 5.75 | 5.67 | 0.08 | 5.88 | 0.13 |
| 11 | 4.93 | 4.99 | 0.06 | 5.01 | 0.08 |
| 12 | 5.33 | 5.25 | 0.08 | 5.21 | 0.12 |
P.S.: Relative Error I denotes relative error between the present ultrasonic method and micrometer method. Relative Error II denotes relative error between the conventional ultrasonic method and micrometer method.
© 2020 by the authors. Licensee MDPI, Basel, Switzerland. This article is an open access article distributed under the terms and conditions of the Creative Commons Attribution (CC BY) license (http://creativecommons.org/licenses/by/4.0/).
Share and Cite
MDPI and ACS Style
Chen, F.; Chen, S.; Zhang, R.; Shi, Y.; Gu, L. Measuring the Wall Thickness of a Trailing Arm Using Ultrasonic Measurement Model. Coatings 2020, 10, 773. https://doi.org/10.3390/coatings10080773
AMA Style
Chen F, Chen S, Zhang R, Shi Y, Gu L. Measuring the Wall Thickness of a Trailing Arm Using Ultrasonic Measurement Model. Coatings. 2020; 10(8):773. https://doi.org/10.3390/coatings10080773
Chicago/Turabian StyleChen, Feng, Siqi Chen, Rongfan Zhang, Yongsheng Shi, and Liangyao Gu. 2020. "Measuring the Wall Thickness of a Trailing Arm Using Ultrasonic Measurement Model" Coatings 10, no. 8: 773. https://doi.org/10.3390/coatings10080773
Note that from the first issue of 2016, this journal uses article numbers instead of page numbers. See further details here.