
Denoising of LCR Wave Signal of Residual Stress for Rail Surface Based on Lifting Scheme Wavelet Packet Transform


Key Laboratory of Fundamental Science for Advanced Machining, School of Mechanical Engineering, Beijing Institute of Technology, Beijing 100081, China
*
Author to whom correspondence should be addressed.
Coatings 2021, 11(5), 496; https://doi.org/10.3390/coatings11050496
Submission received: 24 March 2021
/
Revised: 17 April 2021
/
Accepted: 19 April 2021
/
Published: 23 April 2021
(This article belongs to the Special Issue Advanced Nondestructive Evaluation and Characterization of Surface)
Abstract
:According to the acousto elastic effect, the residual stress on the surface of the rail can be evaluated by measuring the change in the propagation velocity of ultrasonic waves, such as longitudinal critically refracted (LCR) waves on the surface of the rail. The LCR wave signal is often polluted by a variety of noise sources, coupled with the influence of the poor surface condition of the inspected component, which greatly reduces the detectability and online measurement ability of the LCR wave signal. This paper proposes the application of the lifting scheme wavelet packet transform (LSWPT) denoising method to solve the noise suppression problem of LCR wave signal. The traditional wavelet transform (WT), wavelet packet transform (WPT), as well as the lifting scheme wavelet transform (LSWT) and lifting scheme wavelet packet transform are compared and analyzed in the soft thresholding and hard thresholding processing of denoising ability and efficiency of the noisy LCR wave signal. The experimental results show that the LSWPT method has the characteristics of fast calculation speed and a good denoising effect, and it is an efficient method of denoising signals for on-line ultrasonic measurement of residual stress on the rail surface.
1. Introduction
Residual stresses in the surface layer of steel rails are generated during production and use. In particular, the residual stresses in the protective coating [1] of steel rails are created at a specific technological process. Excessive residual stresses affect the stability, wear resistance, fatigue strength, and fracture resistance of the rails during use, and even cause the rails to break, which constitutes a huge impact on driving safety and potential threat. Studies have shown that there are usually longitudinal tensile residual stresses at the head and base of the rail, and longitudinal compressive residual stresses at the rail web. The ultrasonic measurement of residual stress is based on the theory of acoustoelasticity, using the ideal linear relationship between the velocity of ultrasonic wave in the elastic medium or the change of the frequency spectrum and the internal stress of the elastic medium to measure [2,3,4]. In order to relate ultrasonic velocities to residual stress, the ultrasonic method generally requires higher-order elastic constants [5]. These constants which are also dependent on the metallurgical texture [6], the type of wave and the direction of wave propagation relative to the direction of stress [7] must be experimentally determined for a particular material being examined. The influence of the texture on the measured transition times should be considered during data analysis.
The key to the ultrasonic measurement of residual stress lies in the ability to use advanced electronic measuring systems and special ultrasonic probe systems to accurately measure changes in wave pulse transit times or time-of-flight (TOF) to reduce the impact of acoustic coupling on the accuracy of measurements. The ultrasonic wave can reach the receiving probe in various ways which depend on the probe’s geometry and the thickness of the element. However, the ultrasonic testing signal is often polluted by a variety of noise sources, even under ideal conditions such as surface texture conditions, environmental temperature changes, acoustic coupling, and more, the testing signal contains a lot of noise, which greatly reduces the detectability of residual stress and restricts online detection ability. Therefore, to achieve accurate measurement of TOF, it is very necessary to reduce the noise of the ultrasonic signal to improve the signal-to-noise ratio (SNR) of the signal and effectively suppress the influence of noise on the testing signal.
Denoising for the ultrasonic signal is essentially a process of suppressing the useless part of the signal and enhancing the useful part. At present, the denoising methods of ultrasonic signals mainly include Fourier Analysis, wavelet transform-based multiresolution analysis [8], Principal Component Analysis (PCA) [9], Empirical Mode Decomposition (EMD) [10], Independent Component Analysis (ICA) [11], high order statistics-based denoising [12], Adaptive Filtering [13], etc. Among them, wavelet transform (WT) denoising can suppress the interference of high-frequency noise, effectively distinguish high-frequency information from high-frequency noise and protect the spikes and sudden changes of useful signals. It is suitable for the denoising of transient signals. However, because the orthogonal wavelet transforms only further decomposes the low-frequency part of the signal, and no longer decomposes the high-frequency part, that is, the detailed part of the signal. Therefore, wavelet transform can only represent a large class of signals with low-frequency information as the main component, but cannot decompose and represent signals containing a large amount of detailed information, such as non-stationary mechanical vibration signals, biomedical signals, and seismic signals.
Wavelet packet transform (WPT) [14] can divide the frequency band into multiple layers, which provides a more refined analysis method for signal analysis. This transformation can not only further decompose the high-frequency parts that are not subdivided in the multi-resolution analysis, but also can adaptively select the corresponding frequency band according to the characteristics of the analyzed signal to match it with the signal spectrum, thereby Improved time-frequency resolution. The WPT has neither redundancy nor omission in the finer decomposition of the high-frequency part, so the signal containing a large amount of medium and high-frequency information can be better localized in time-frequency analysis. The WPT also has the characteristics of adaptive narrowband filtering, full frequency domain taper resolution capability, complete reconstruction characteristics, and optimal time-frequency representation of signals under different criteria. Therefore, it has been widely used in ultrasonic detection signal denoising [15,16], the signal-to-noise ratio (SNR) of the ultrasonic testing signal has been significantly improved [17].
Yan et al. [18] used the wavelet denoising method of the best wavelet base to denoise the ultrasonic echo signal of the internal defect of the steel plate and extracted the feature of the size and location information of the defect. Lang et al. [19] used the WPT to denoise the ultrasonic velocity signal used to measure the leakage of oil pipelines. Muthumari et al. [20] performed WPT to denoising on ultrasonic TOFD signals and applied it to the inspection of internal defects in welds. Liang et al. [21] applied WPT denoising to ultrasonic flow monitoring. Li et al. [22] proposed a wavelet packet singular-value decomposition (WPSD) denoising method to reduce the noise of the ultrasonic echo signal of the thick-walled oil pipeline, which effectively improves the SNR of the signal. Zheng et al. [23] proposed an automatic positioning algorithm for wheel defects in ultrasound images based on cross-correlation and wavelet packet denoising. This algorithm can effectively locate defects with an average positioning accuracy higher than 96%.
However, the WPT is only performed in the frequency domain, and its structure depends on the Fourier transform. This transform requires a large number of convolution operations, which is slower, more complicated to implement in hardware, takes up a large amount of memory, and cannot meet real-time requirements for online denoising processing. Sweldens and Daubechies [24] proposed the lifting scheme wavelet transform (LSWT) that does not depend on the Fourier transform, also known as the second-generation wavelet transform. The coefficients after LSWT are integers and can be introduced into the wavelet packet construction, which is called lifting wavelet packet transform (LSWPT). On the one hand, this transformation inherits the multi-resolution characteristics of classic wavelets and is performed in the time domain, so wavelet bases can also be constructed on non-translation invariant regions. On the other hand, it inherits the good time-frequency positioning characteristics of WPT and the ability of adaptive narrowband filtering of signals, so it can quickly and effectively decompose various time-varying signals and obtain the optimal time–frequency representation of the signal under different criteria, to more comprehensively separate the noise.
2. Basic Theory
2.1. Lifting Scheme Wavelet Analysis
The lifting scheme wavelet transform (LSWT) is based on the traditional Laurent polynomial and Euclidean algorithm. By improving wavelet and scaling functions with known characteristics, a new set of wavelet and scaling functions with certain desired characteristics are obtained. The lifting scheme algorithm uses a simple and effective way to construct biorthogonal wavelets. First, basic polynomial interpolation is used to obtain the high-frequency components of the information, and then a scaling function is constructed to obtain the low-frequency components. The theme of this LSWT algorithm is to decompose the existing wavelet filter into basic building blocks and then complete the wavelet transform according to the corresponding steps. LSWT divides the wavelet transform into three steps: Split, Predict, and Update. The two-stage decomposition is shown in Figure 1.
- split
The original input signal is split into two wavelet disjoint sets including the even indexed samples and the odd indexed samples as given below:
which is called Lazy Wavelet by this kind of split and these two samples are closely correlated.
- Predict
Using adjacent N (N = 2D, D is a positive integer) even samples to predict the odd samples, the predicted error can be defined as the wavelet detail signal, as follows:
In the above equation, is the definition of the N-point predictor algorithm.
- Update
Based on the detail signal d, when updating the even samples, (, is a positive integer) detail signals are used. This set is the approximation signal of the wavelet given by:
In the above equation, is the definition of the -point updater algorithm.
For example, when the predictor coefficient is and the updater coefficient is , the LSWT decomposition process based on the principle of interpolation and subdivision is shown in Figure 2.
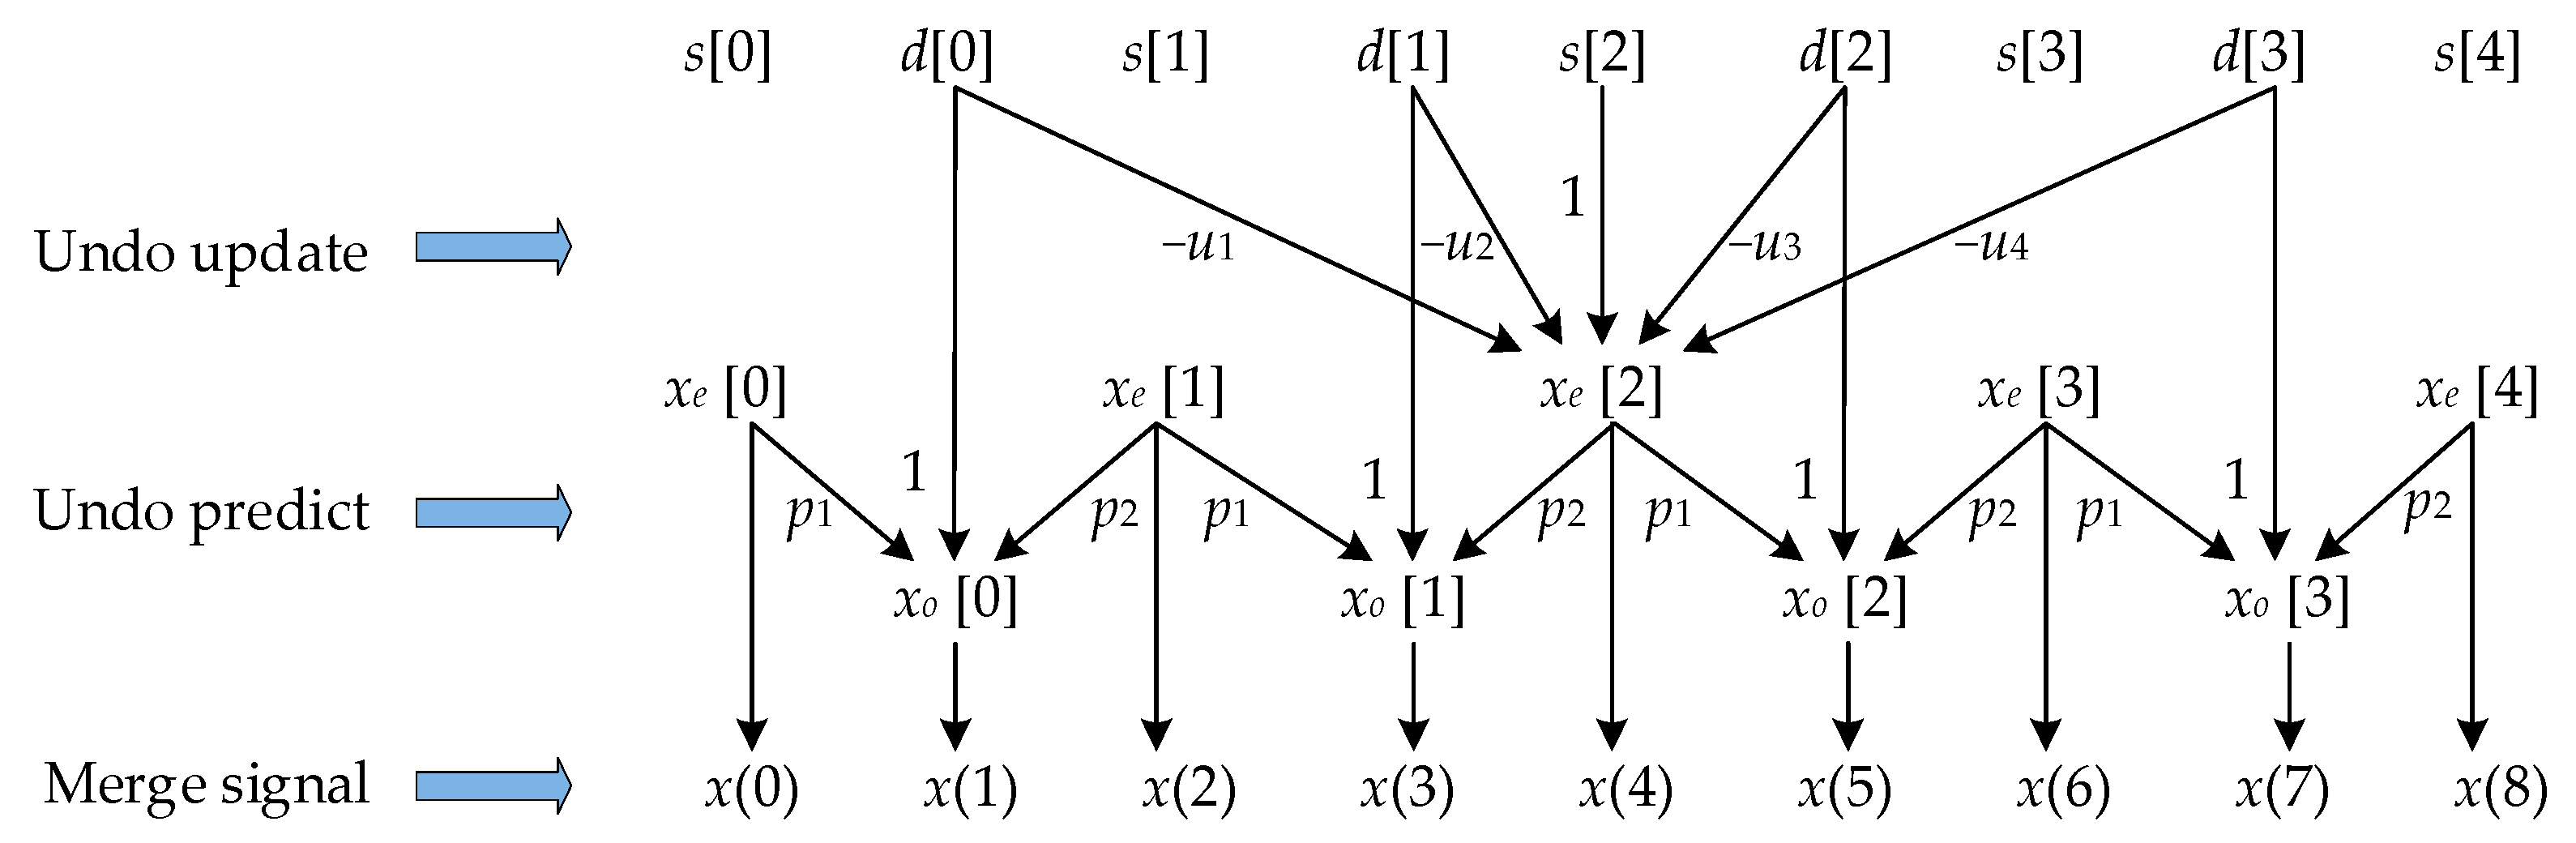
The reconstruction process of LSWT also includes three steps: Undo update, Undo predict and Merge. The reconstruction after 2-level decomposition is shown in Figure 3.
- Undo update
Combine the approximation signal s and the detail signal d to restore the even sample sets :
- Undo predict
The odd sample set is recovered from the even sample set and the detail signal d expressed as:
- Merge
From the even sample set and the odd sample set , the original signal s is restored, expressed as:
Similarly, when the predictor coefficient is and the updater coefficient is , the LSWT reconstruction based on the principle of interpolation and subdivision is shown in Figure 4.
2.2. Lifting Scheme Wavelet Packet Analysis
The scaling function and wavelet function of the lifting scheme wavelet (LSW) are symmetrical and tightly supported, and their curves have the characteristics of oscillating attenuation, which is similar to the waveform of pulsed ultrasonic waves propagating on the surface and inside of the material. Therefore, using them as basis functions, based on lifting scheme wavelet transform, a lifting scheme wavelet packet (LSWP) decomposition and reconstruction algorithm is constructed, which can be used to quantify and identify ultrasound signals.
Lifting scheme wavelet packet transform (LSWPT) includes decomposition algorithm and reconstruction algorithm. The steps are as follows:
- Same as LSWT, the original signal is split into even sample sets and odd sample sets , as shown in Equation (1).Through the following formulas, the signals of each frequency band decomposed in the first layer of the boosted wavelet packet are calculated:
- Calculate the signals of each frequency band decomposed in the L-th level of the LSWP through the following equations:
- When the signals in Equation (7) are reconstructed by LSWPT, the corresponding frequency band signal will be retained, and the rest will be set to zero. The signals are reconstructed according to the following equations:
2.3. Denoising Based on LSWPT
The denoising method based on LSWPT is similar to LSWT, both of which achieve the purpose of denoising by threshold quantization of the high-frequency coefficients of the wavelet decomposition. LSWPT can decompose the low-frequency part and high-frequency part of the upper level at the same time and has more accurate local analysis capabilities.
Apply LSWPT analysis to denoise the signal according to the following steps:
- Lifting wavelet packet decomposition.
Choose a wavelet packet and determine the level of decomposition required, and then perform LSWP decomposition on the signal.
- Determination of the optimal lifting wavelet packet base.
For a given entropy, calculate the best tree.
- Threshold quantization of LSWP decomposition coefficients.
For each LSWP decomposition coefficient, an appropriate soft threshold or hard threshold is selected to threshold quantize the coefficients.
- Signal LSWP reconstruction.
According to the LSWP decomposition coefficients of the lowest level and the quantized coefficients, the LSWP reconstruction is carried out.
It can be seen from the above steps that, first, different wavelet packets have different time–frequency localization capabilities, reflecting different signal characteristics. Secondly, the choice of threshold and the threshold quantization strategy determine the degree and way of reducing signal energy. The denoising effect of the signal is determined by the combination of them.
Among them, how to choose a threshold for threshold quantification is the most important, which is directly related to the quality of signal denoising to a certain extent. Donoho and John Stone [25] proposed two wavelet threshold processing methods, soft thresholding, and hard thresholding, which are expressed as follows:
where w and are respectively the wavelet coefficient values before and after the threshold is applied. is the threshold. The hard threshold function is discontinuous when which is likely to cause the obvious Pseudo–Gibbs phenomenon near the singular point of the denoised signal. Therefore, the soft threshold function is usually selected as the threshold processing function.
3. Experiment on the Measurement of Rail Surface Residual Stress
3.1. Method Principle of Measurement for Residual Stress Using Ultrasound
The longitudinal critically refracted (LCR) waves which are the most sensitive to stress and especially suitable for measuring residual stress parallel to the direction of ultrasonic propagation. Residual stress (hereinafter abbreviated as stress) in materials affects the velocity of the LCR wave. Generally, when the stress direction is parallel to the direction of propagating, tensile stress reduces the velocity of the LCR wave, while compressive stress increases the velocity of the LCR wave. As shown in Figure 5. The stress measurement probe is composed of two wedged ultrasonic transducers, the distance L between the transmitting and receiving transducers is fixed. If the time-of-flight (TOF) corresponding to zero stress and those for the stress to be determined are and t respectively, then the stress along the LCR wave direction in the rail surface can be calculated as:
where, K is defined as the stress coefficient, and calibrated for rail steel (U75V); is the stress difference; is the transit time.
As shown in Figure 5, the rail residual stress ultrasonic measurement system consists of an ultrasonic pulser-receivers (Olympus 5073PR, Waltham, MA, US), a pair of ultrasonic longitudinal wave transducers with the same frequency (SISU, Shantou, China), an acoustic wedge, and an oscilloscope (TeKtronix DPO 4014, OH, US). The wedge is well coupled with the surface of the rail through ultrasound couplants.
3.2. LCR Wave Signal Acquisition
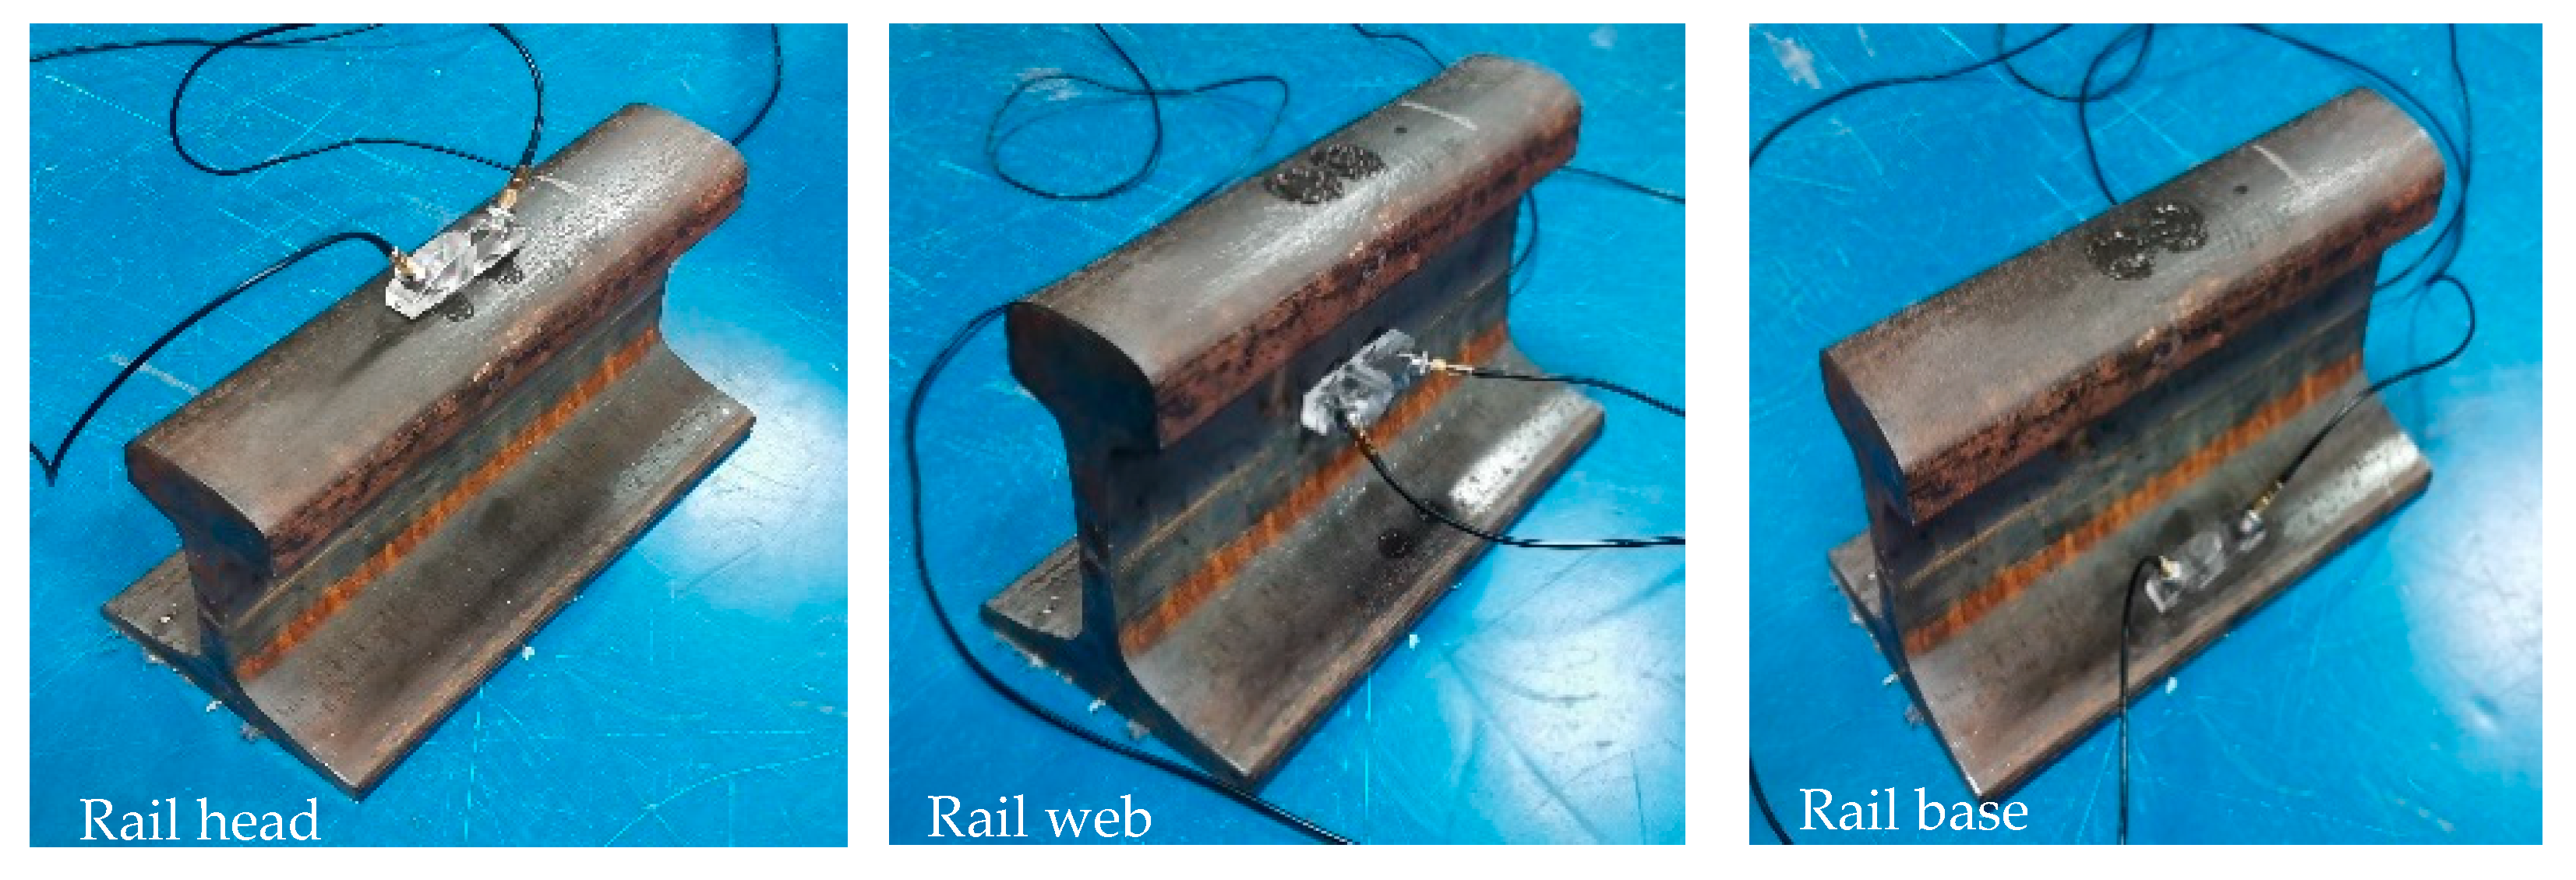
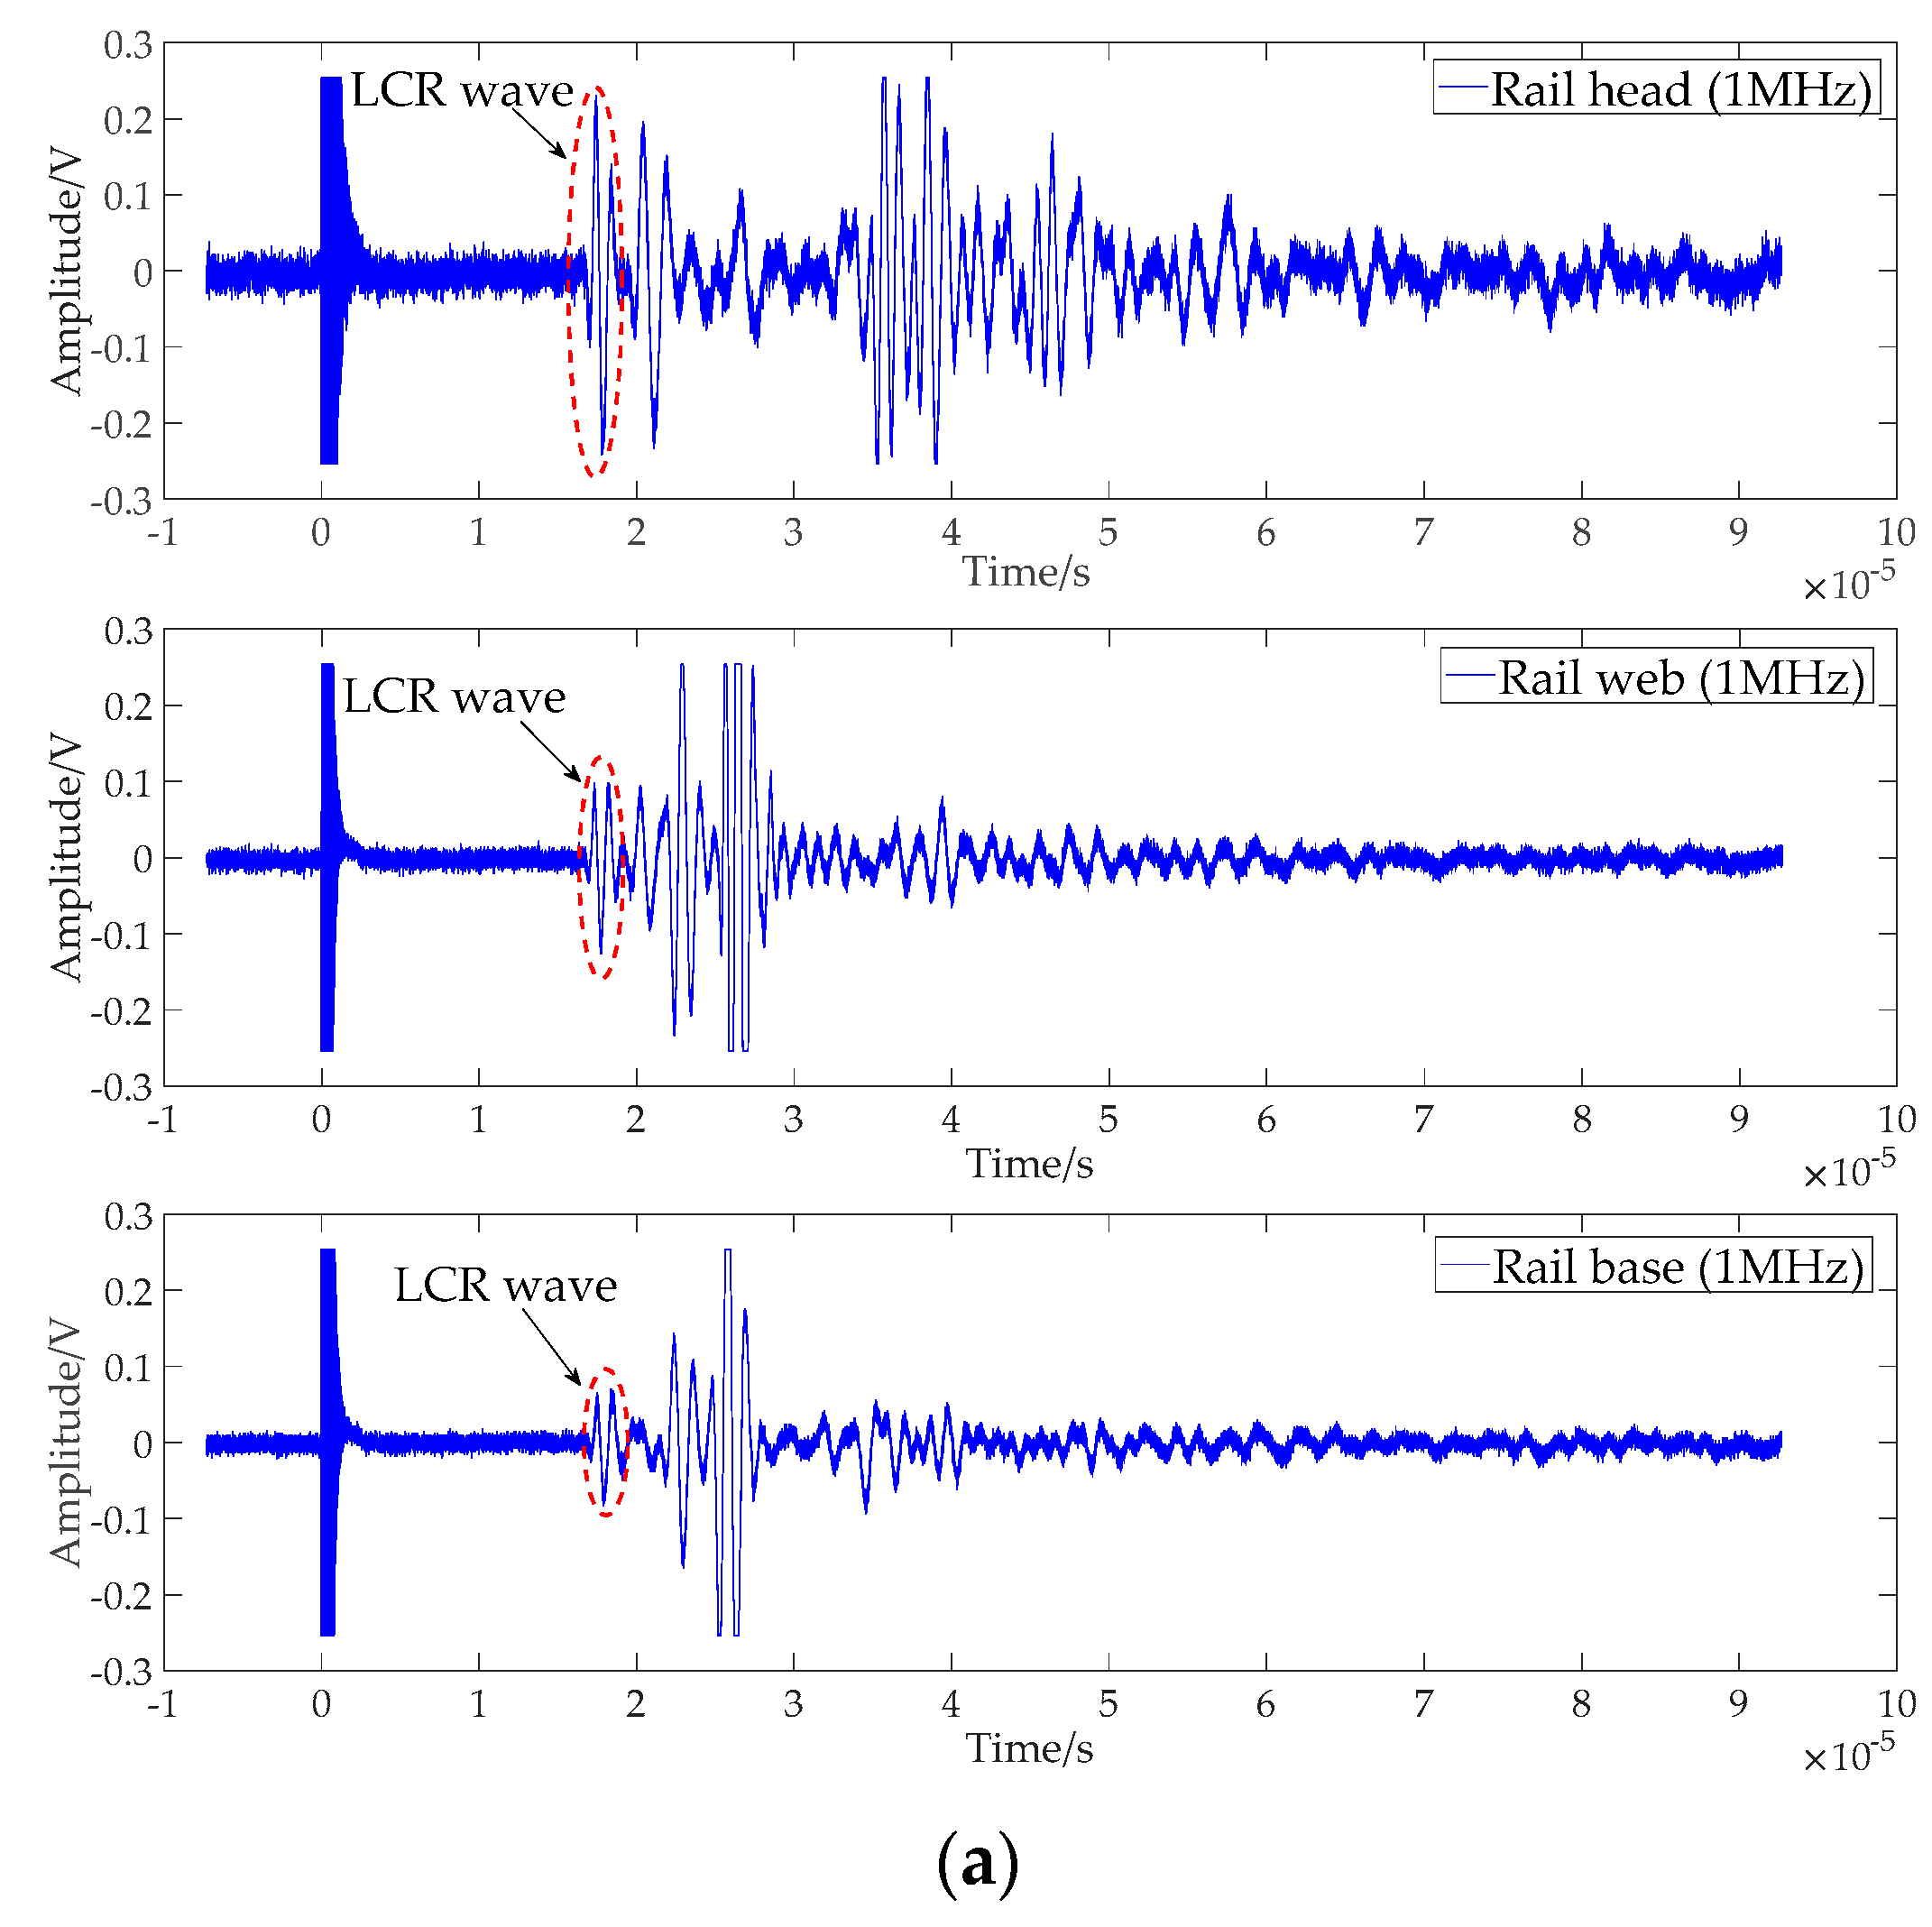
As shown in Figure 6, the ultrasonic probes of 1 MHz, 2.5 MHz, and 5 MHz are used to measure the residual stress at the rail head, rail web, and rail base respectively. The high-pass filter (HPF) of the ultrasonic pulser-receivers is set to “OUT”, and the low-pass filter (LPF) is set to “20 MHz”. The “Acquisition” of the oscilloscope is set to “sampling” and no averaging is performed. The sampling frequency is 2.5 GHz, the data length is 250,000, and the nine groups of original signals collected are shown in Figure 7. In each group of signals in Figure 7, the leftmost waveform is the trigger signal sent by the transmitting transducer, and the right waveform is the signal received by the receiving transducer. Since the LCR wave is a longitudinal wave that propagates parallel to the surface of the rail as shown in Figure 6, it has the fastest propagation velocity and first reaches the receiving transducer, so it will appear on the leftmost (front end) of the right waveform. The following series of waveforms are transverse waves or longitudinal waves that reach the receiving transducer after being reflected by reflection interfaces such as the bottom and sides of the rail.
4. Results and Discussion
4.1. LCR Wave Signal Preprocessing
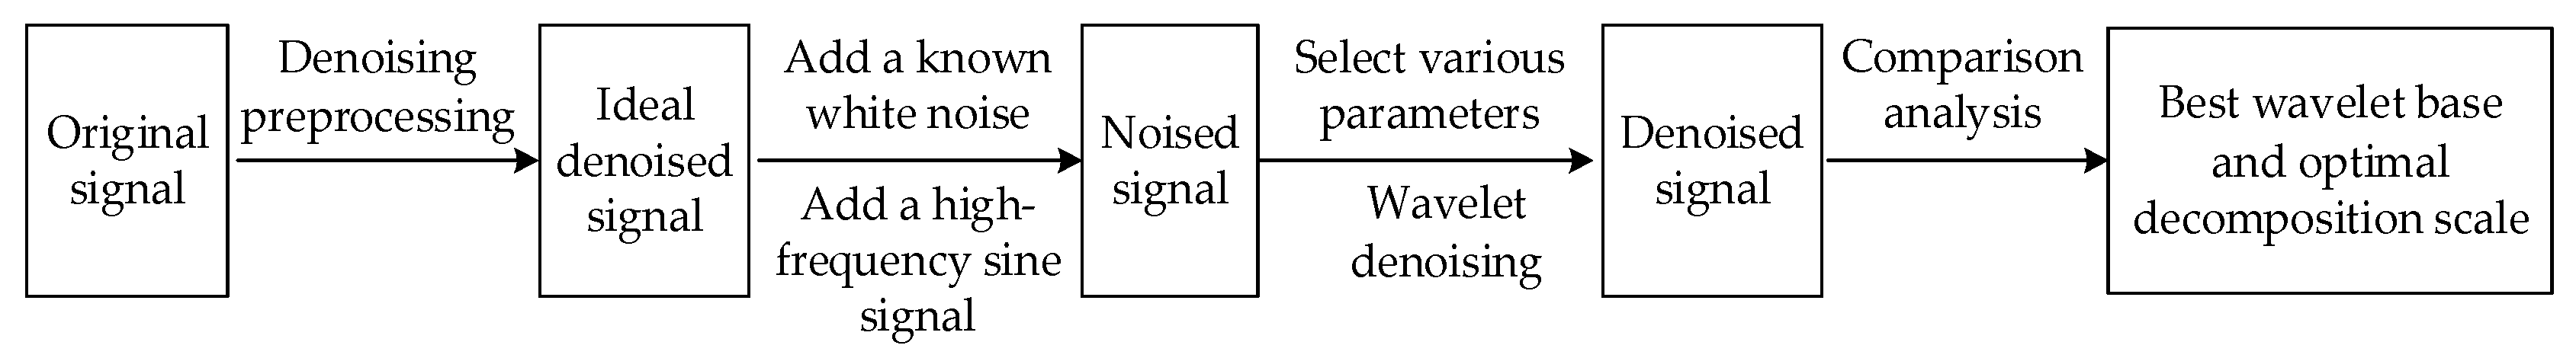
The selection of the optimal wavelet base is mainly based on the comparison of the results before and after the LSWPT denoising processing. However, in practical applications, the LCR wave signals collected as shown in Figure 7 are usually noise-containing signals, and it is impossible to obtain a real signal without noise. Therefore, it is difficult to accurately evaluate the quality of the wavelet base. An ideal signal can be constructed by preprocessing a noisy LCR wave signal, for example, smoothing the noised signal. Then superimpose a known white noise and a high-frequency sinusoidal signal on this ideal signal. The finally formed signal will be used as the original signal for evaluating the denoising ability of the combination of wavelet base and decomposition levels. The specific implementation method is shown in Figure 8. The reason for adding a high-frequency sinusoidal signal is to consider the nonlinear effect of LCR wave propagation in materials with residual stress [26]. The LCR wave contains high-frequency harmonic signal components.
The LCR wave signal (2.5 MHz) with a smaller amplitude and measuring the residual stress at the rail base is selected as the original signal for verification and analysis. As shown in Figure 9a, we can take the 10–40 μs part of the original signal with the length of 75,000 out, the perform 32-time average filter processing on this original signal to obtain an ideal signal with LCR wave for residual stress measurement at the rail base, as shown in Figure 9b. A standard Gaussian white noise is superimposed on the entire original signal, and a high-frequency sinusoidal signal with a frequency of 5 MHz is superimposed on the LCR wave separately to construct a test signal containing noise and high-frequency information, as shown in Figure 9c. The SNR of the test signal is 4.3208 dB.
4.2. Selection of the Optimal Wavelet Base and Decomposition Level of LCR Wave Signal
In the ultrasonic measurement of residual stress, according to the characteristics of the LCR wave signal, the selected wavelet base should have tight support in the time domain [27]. Besides, to ensure the local analysis ability of the wavelet base in the frequency domain, the wavelet base is also required to have a fast attenuation in the frequency domain. The better the correlation between the wavelet base and the signal, the more the wavelet transform can extract features of the signal, and the more accurate the analysis of the signal’s features using the wavelet base [28]. Obviously, the ultrasonic LCR wave signal usually appears as a kind of waveform signal with an exponential decay in the time domain. Therefore, the selected wavelet base should also have exponential decay or approximate exponential decay in the time domain. When performing wavelet denoising on LCR wave signals, the distortion of the signal should be minimized, and a wavelet base with symmetry or approximate symmetry should be selected as far as possible. From the high-order vanishing moment characteristics of the ideal wavelet, it can be seen that the LCR wave signal in the ultrasonic signal should be highlighted in the denoising process, and the wavelet base should have a certain order of vanishing moments [29]. Among the common wavelets, the Daubechies, Symlets, Coiflets, and Biorthogonal wavelet families are suitable for ultrasonic signal analysis.
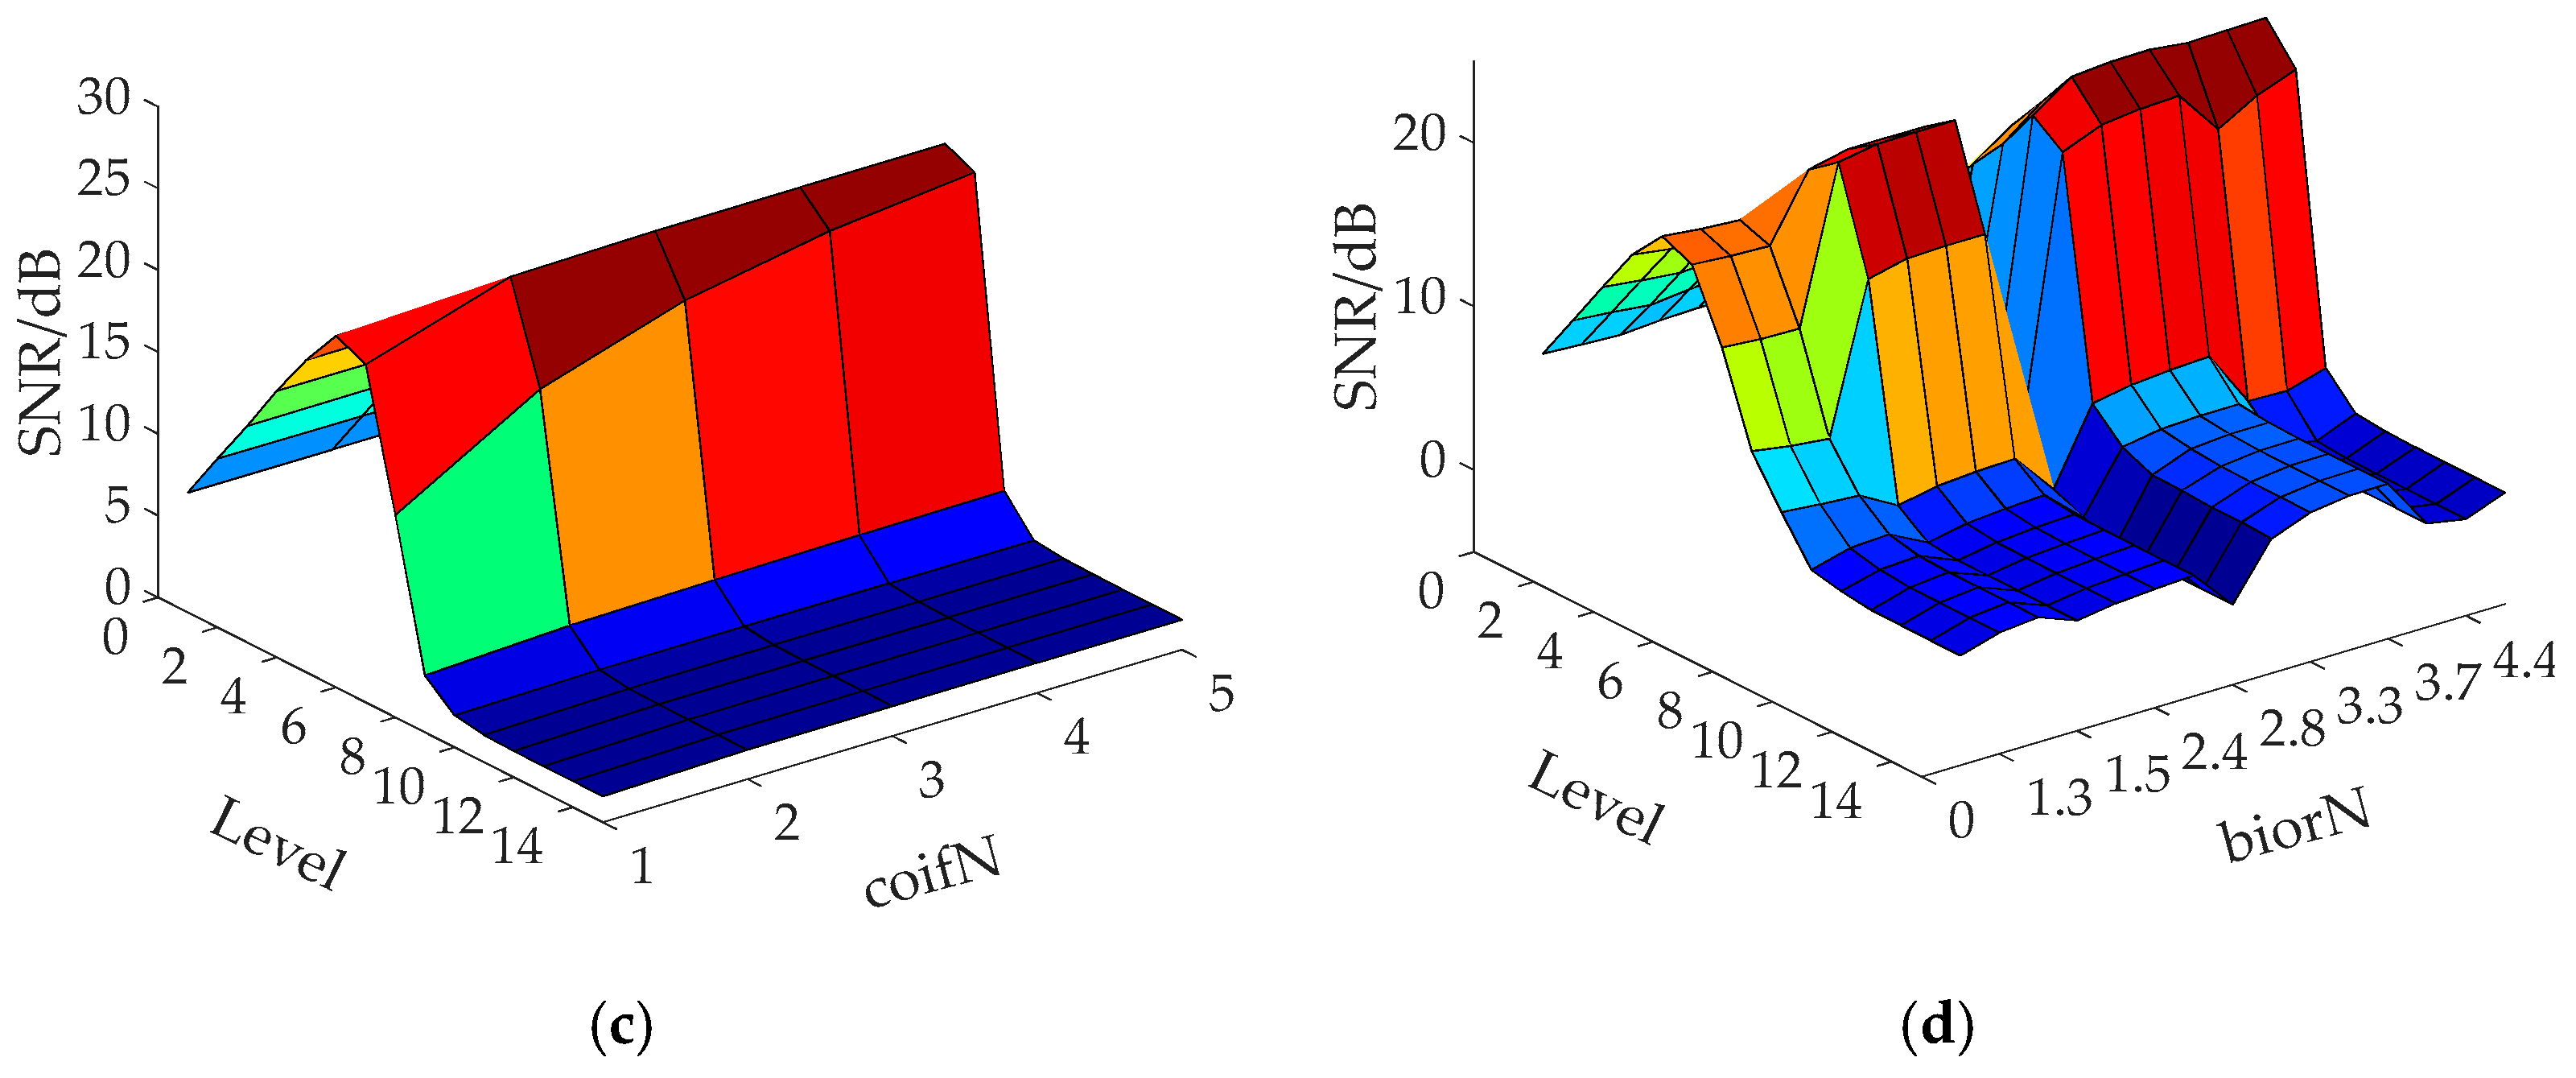
In this section, we will use the method of combining the above four wavelet functions and different decomposition levels to denoise the constructed noisy signal. According to the results before and after processing, find the optimal wavelet base and the best decomposition level. From the SNR results of the four wavelet denoising shown in Figure 10, it can be seen that sym8 can be used as the best wavelet base, and the best decomposition level is 8. The scaling function and wavelet function of sym8 are shown in Figure 11. It should be noted that the number of levels of wavelet decomposition and reconstruction is not the more the better. More levels will lose some details, while fewer levels will not be able to effectively remove noise.
4.3. Performance Verification of LSWPT for LCR Wave
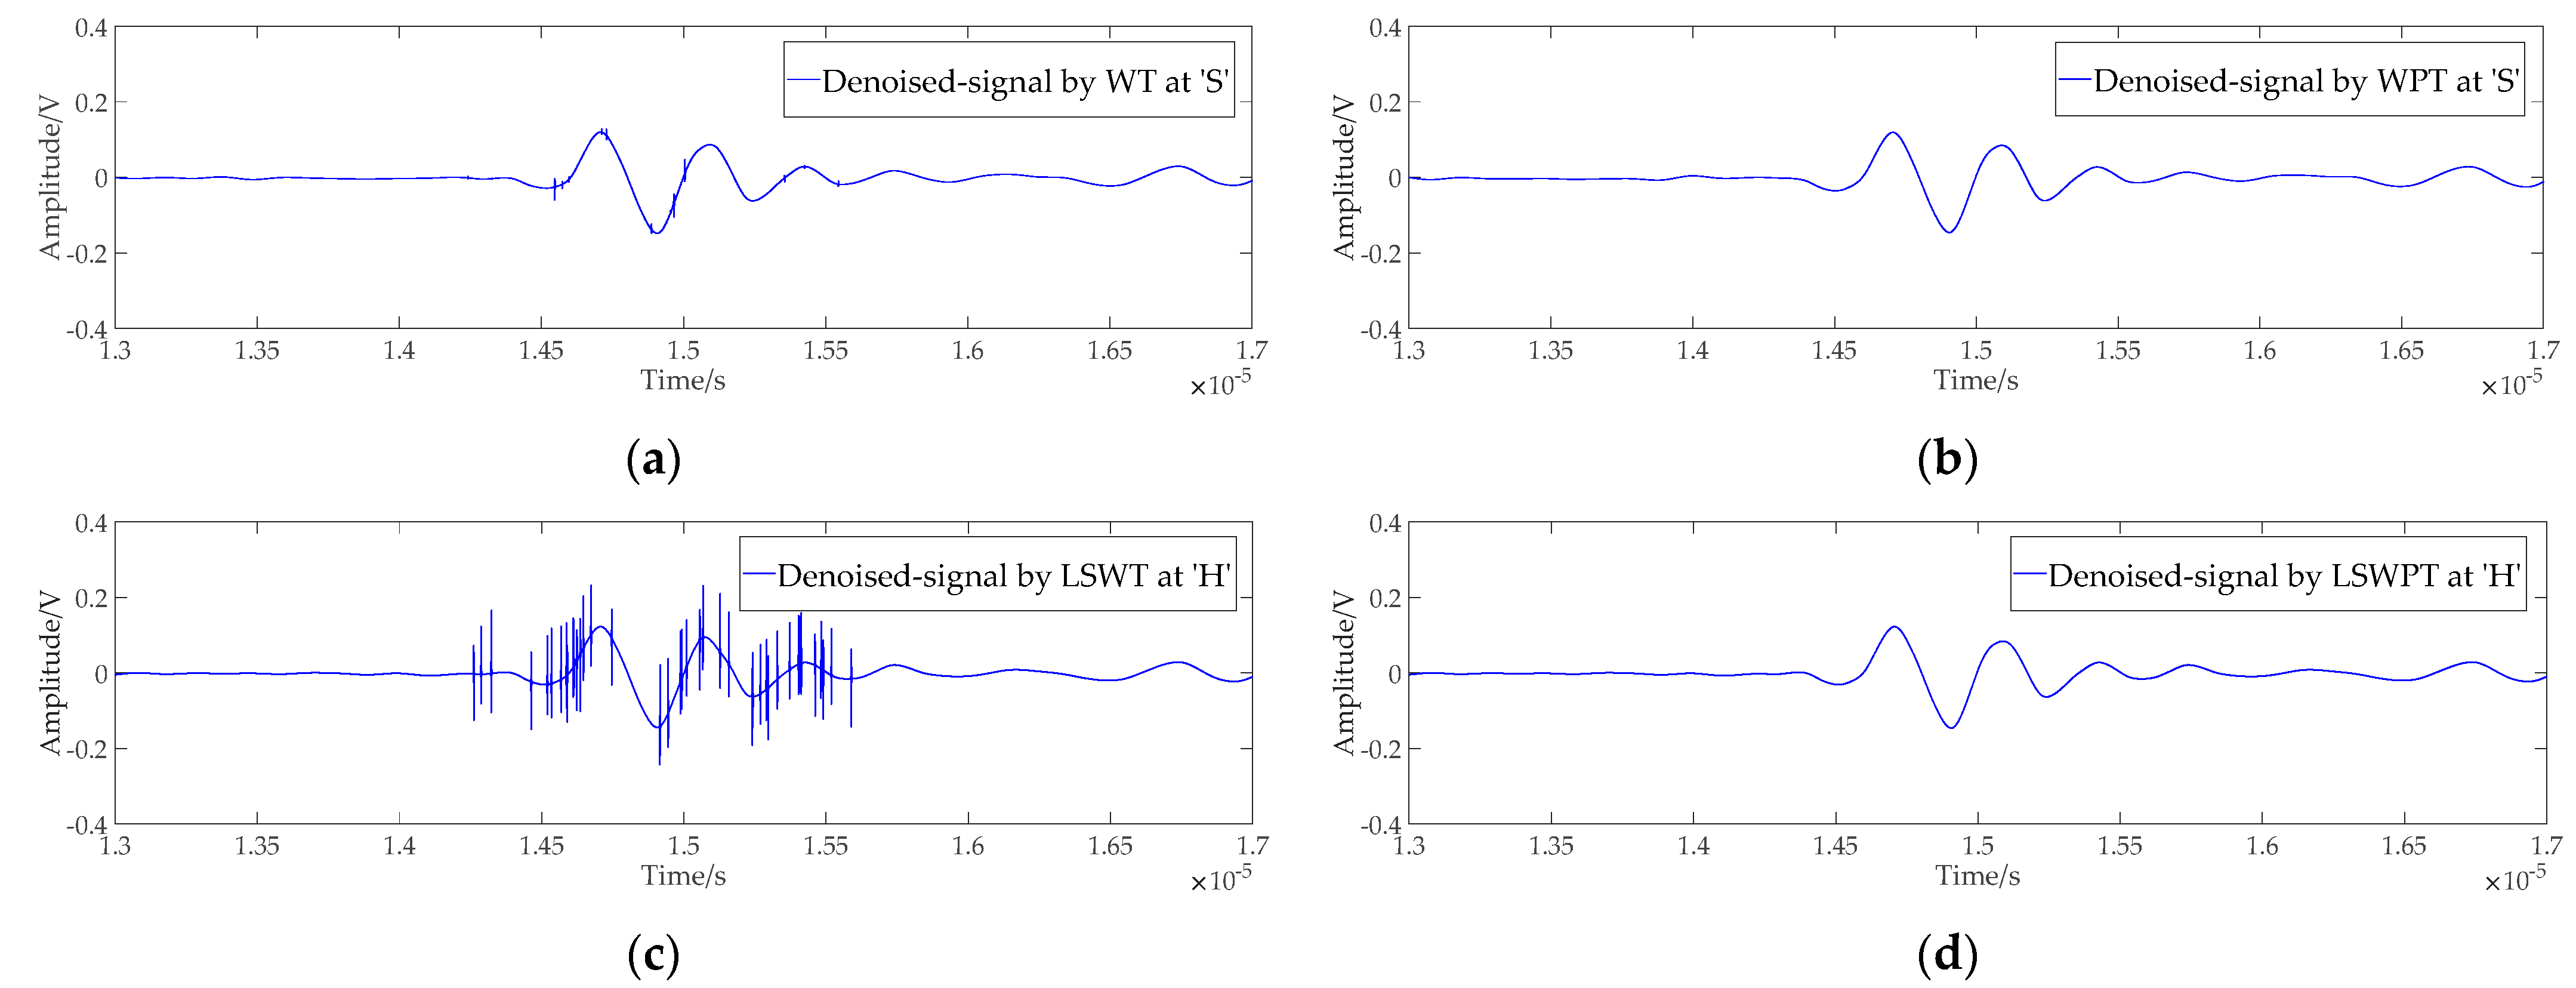
In order to verify the effectiveness and advancement of the LSWPT method, WT, WPT, LSWT, and LSWPT methods are used to denoise the test signal. The wavelet base is sym8, and the decomposition level is 8. The soft thresholding (S) and hard thresholding (H) processing methods are used for threshold processing respectively. Four indicators including root mean square error (RMSE), SNR, peak relative error (PRE), and calculation time (T) are introduced to quantitatively evaluate the denoising signal, expressed as:
In the above equations, and are respectively the sampled value of the original signal and the reconstructed value of denoised signal at time of i. N is the signal length. and are the peak value of the original signal and denoised signal, respectively. The higher the SNR and the smaller the RSME and PRE, it means that the denoised signal is closer to the real signal of the LCR wave, and the denoising has achieved better results. The denoising results of the WT, WPT, LSWT, and LSWPT methods are shown in Table 1.
The results in Table 1 show that the four denoising methods based on wavelet analysis achieved the purpose of denoising well, and the SNRs are significantly improved. The calculation time of LSWT and LSWPT is shorter than that of traditional WT and WPT respectively, which reflects the advantages of the lifting scheme (LS) in denoising efficiency. Under the soft thresholding processing, both WT and WPT methods can effectively remove the noise of the LCR wave signal, as shown in Figure 12a,b. However, the LCR signal denoised by the WT method has some burrs affected by the high-frequency sinusoidal signal, while the WPT method effectively removes the high-frequency noise and makes the LCR signal smoother and closer to the ideal signal. Comparing Figure 12c,d, as well as the results in Table 1, it can be seen that under the hard thresholding processing, the WT and LSWT methods are ineffective against the interference of high-frequency noise, while the WPT and LSPT methods are very effective, which illustrates the advantages of wavelet packet denoising.
4.4. Ultrasonic Equipment Calibration and Residual Stress Measurement
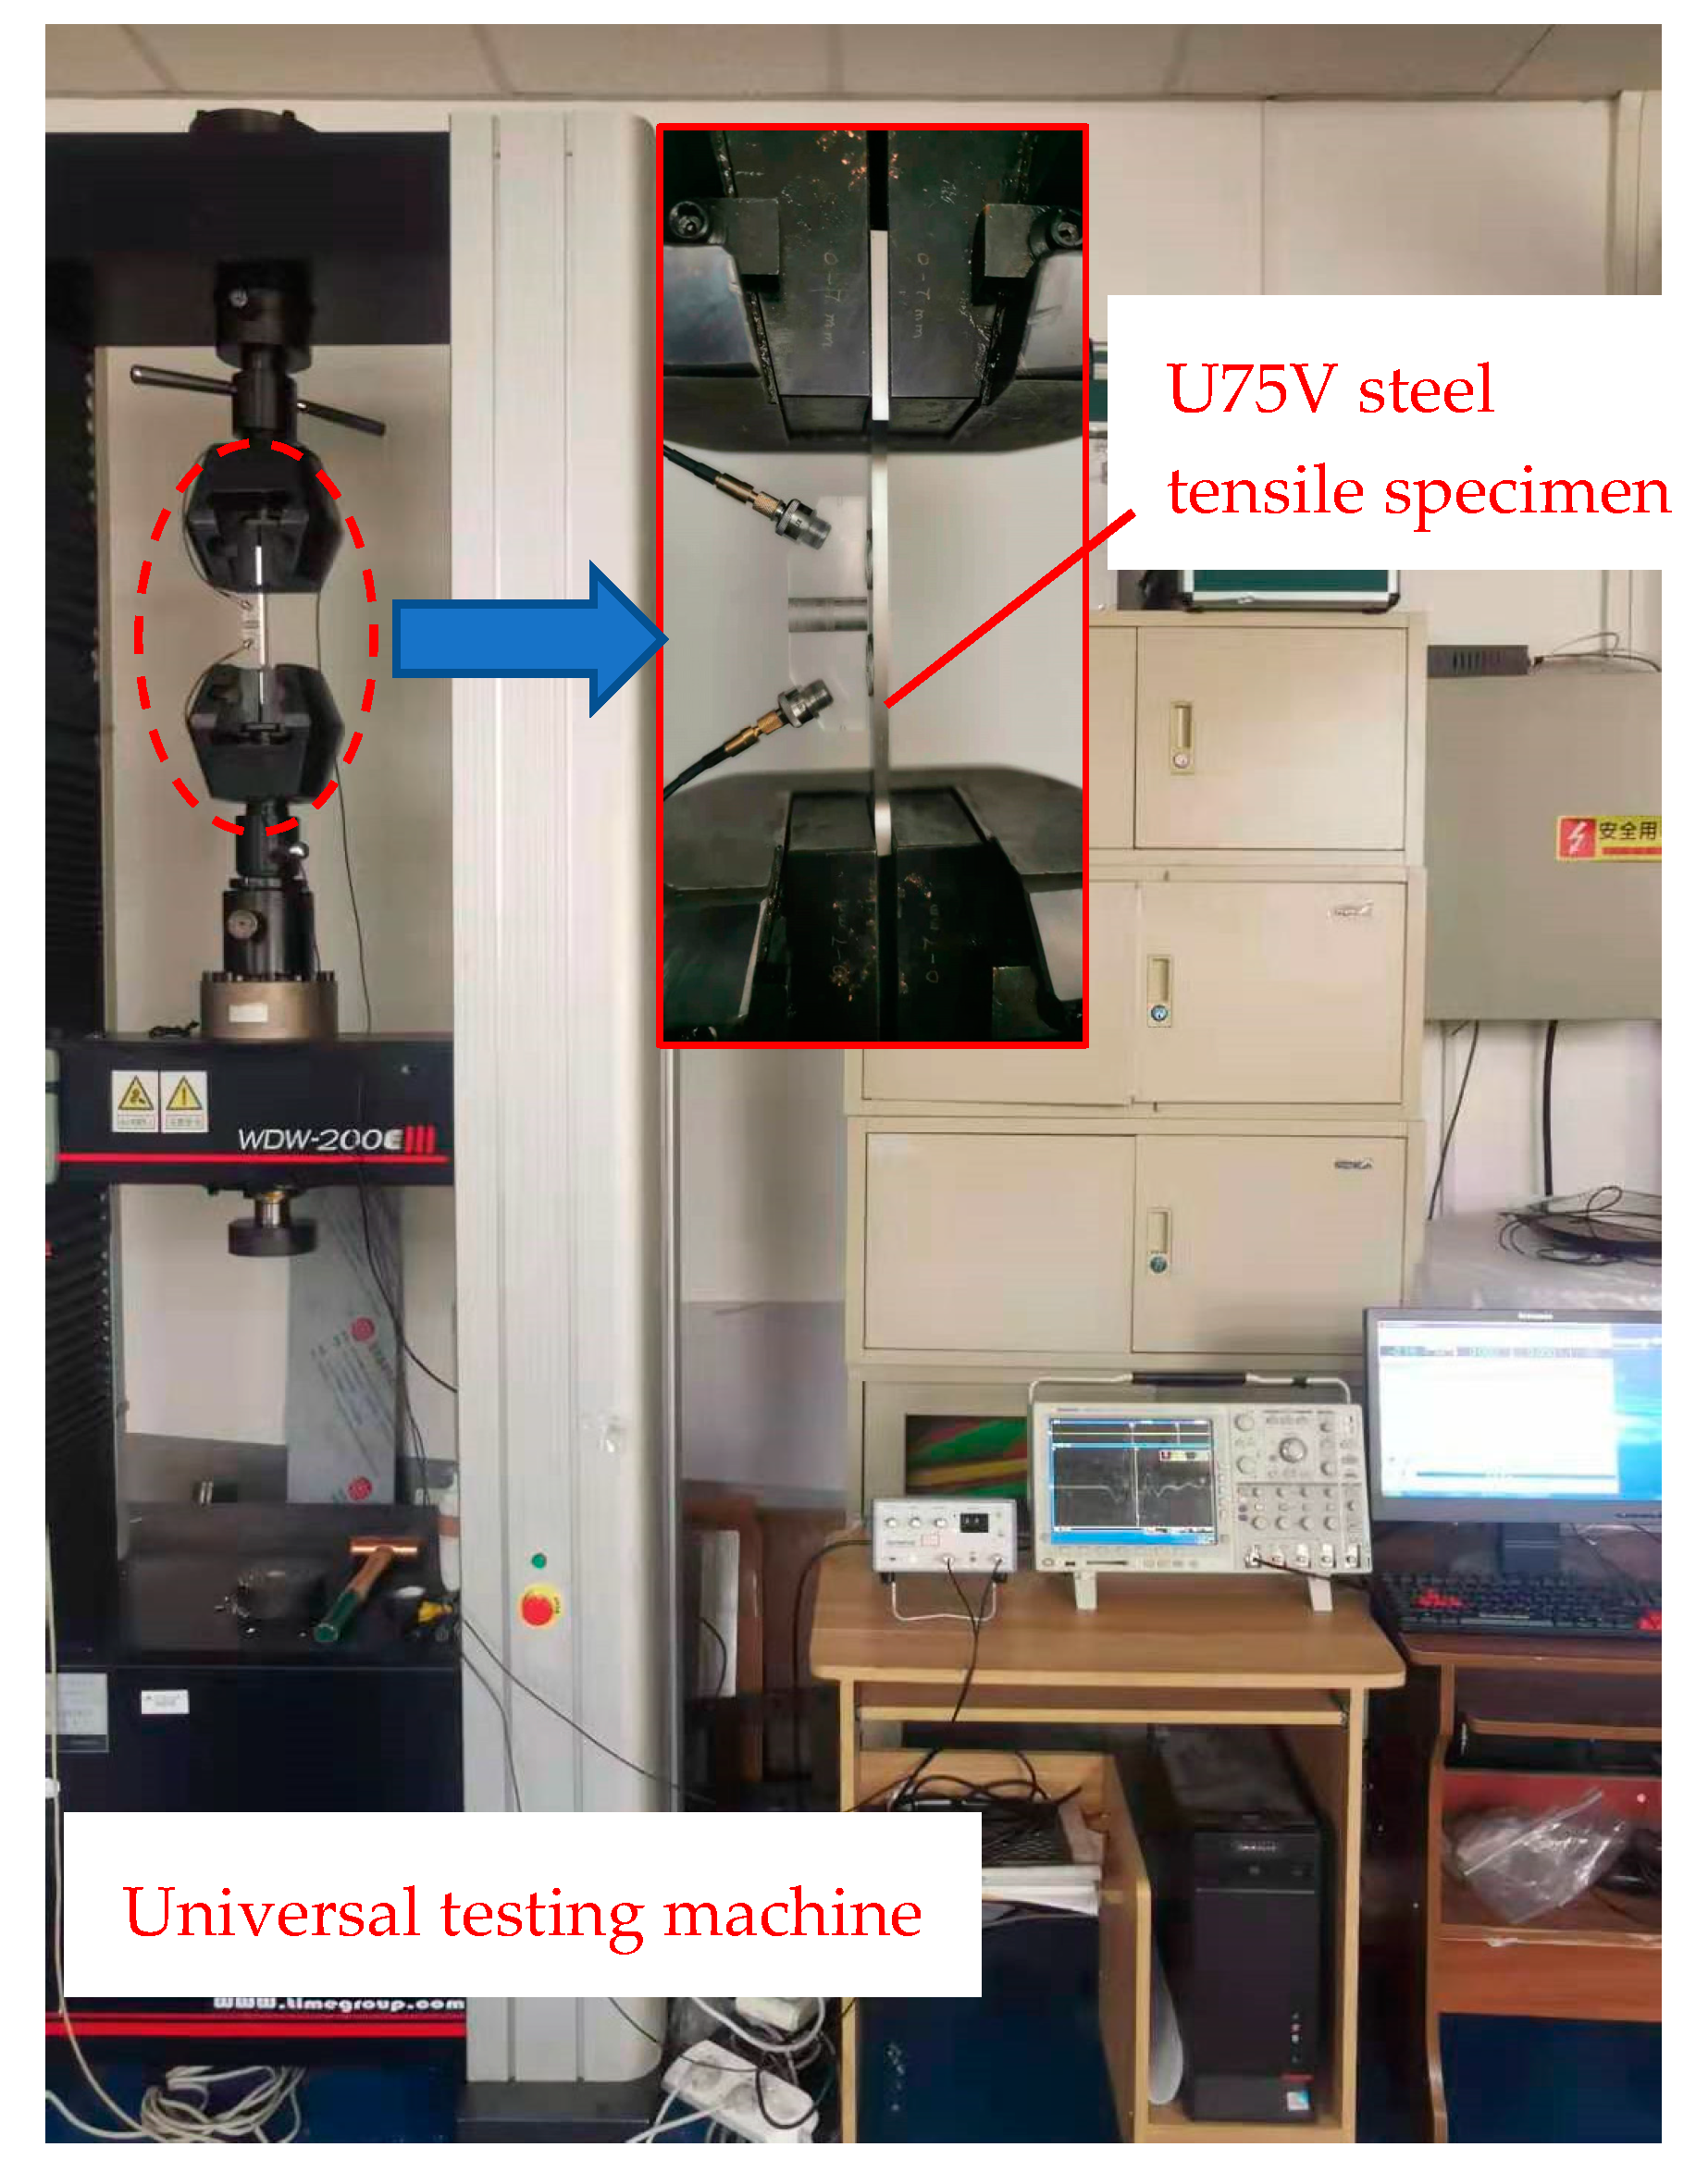
It is necessary to calibrate the ultrasonic equipment, we can adopt an absolute calibration method to calibrate the ultrasonic testing equipment with a universal testing machine, as shown in Figure 13. The U75V rail steel tensile test specimen is directly removed from the rail by wire cutting for preparation. We performed uniaxial tensile tests on U75V specimens at room temperature and obtained different tensile stresses and corresponding strains of the specimens relative to the free state (assumed to be a zero-stress state). At the same time, the change of TOF is obtained according to the time-domain signal of the LCR wave under different tensile stresses, as shown in Figure 14. Then calculate the correlation coefficient between these LCR wave signals to obtain the time difference of each LCR wave signal. According to Equation (12), the stress coefficient is 10.149 MPa/ns, as shown in Figure 15. When the ultrasonic equipment is calibrated, the stress can be calculated based on this coefficient and the change in TOF, and compared with the known tensile stress, so as to achieve absolute calibration of the ultrasonic equipment. The universal testing machine can accurately obtain the stress and strain of the specimen under any different tensile stress within the elastic deformation range. At the same time, by using an oscilloscope with a sampling rate of 1 GHz or higher to collect LCR wave signals, it is possible to record and distinguish small changes of TOF very well. Therefore, this absolute calibration method can evaluate the effectiveness of the ultrasonic residual stress measurement method.
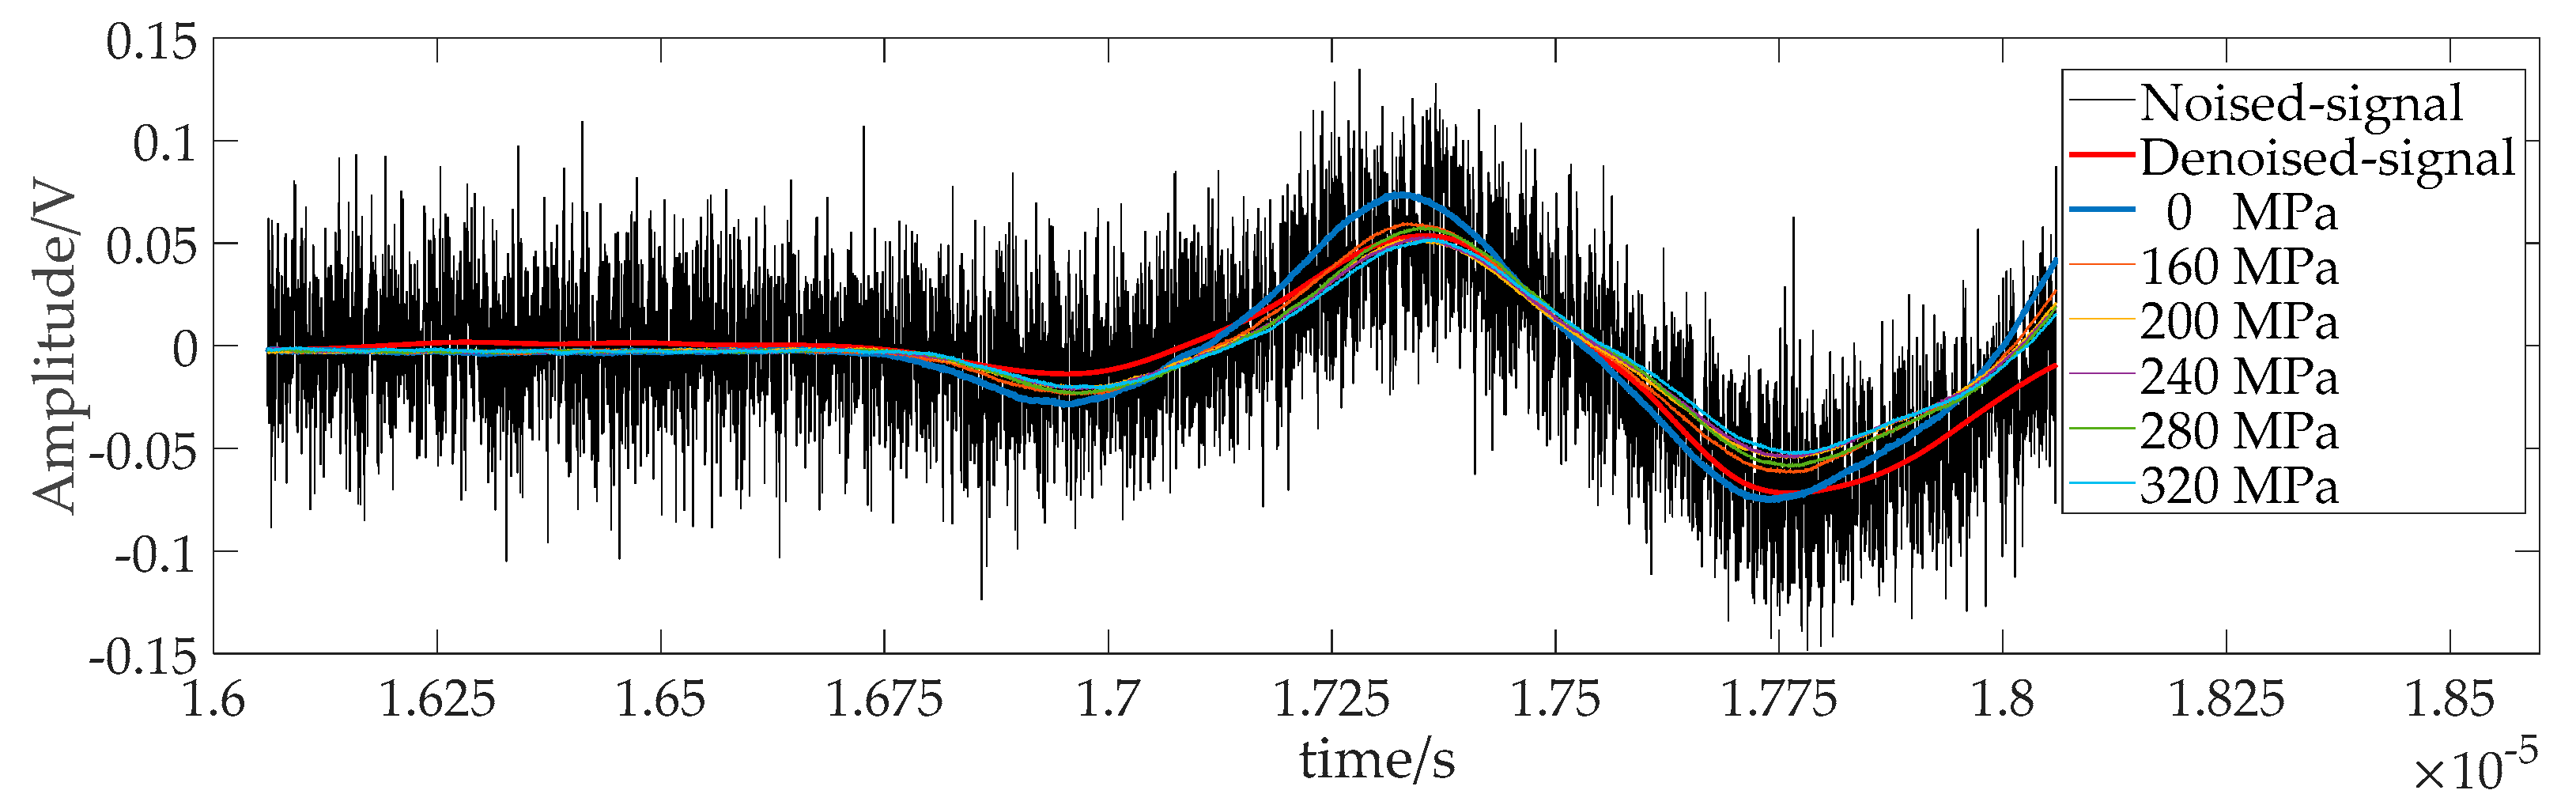
Similarly, we can add noise to the LCR wave signal (1 MHz) of the rail base as shown in Figure 7a, and then apply the LSWPT method for denoising processing to obtain the denoised signal shown in Figure 15. Cross-correlation calculations are performed on the noised signal and the denoised signal with the LCR wave signal of 0 MPa, respectively. The corresponding residual stresses are respectively 196.4756 MPa and 192.416 MPa, with an error of 2.11%, as shown in Figure 15. Therefore, by performing LSWPT denoising processing on the LCR signal, the accuracy of residual stress measurement can be effectively improved.
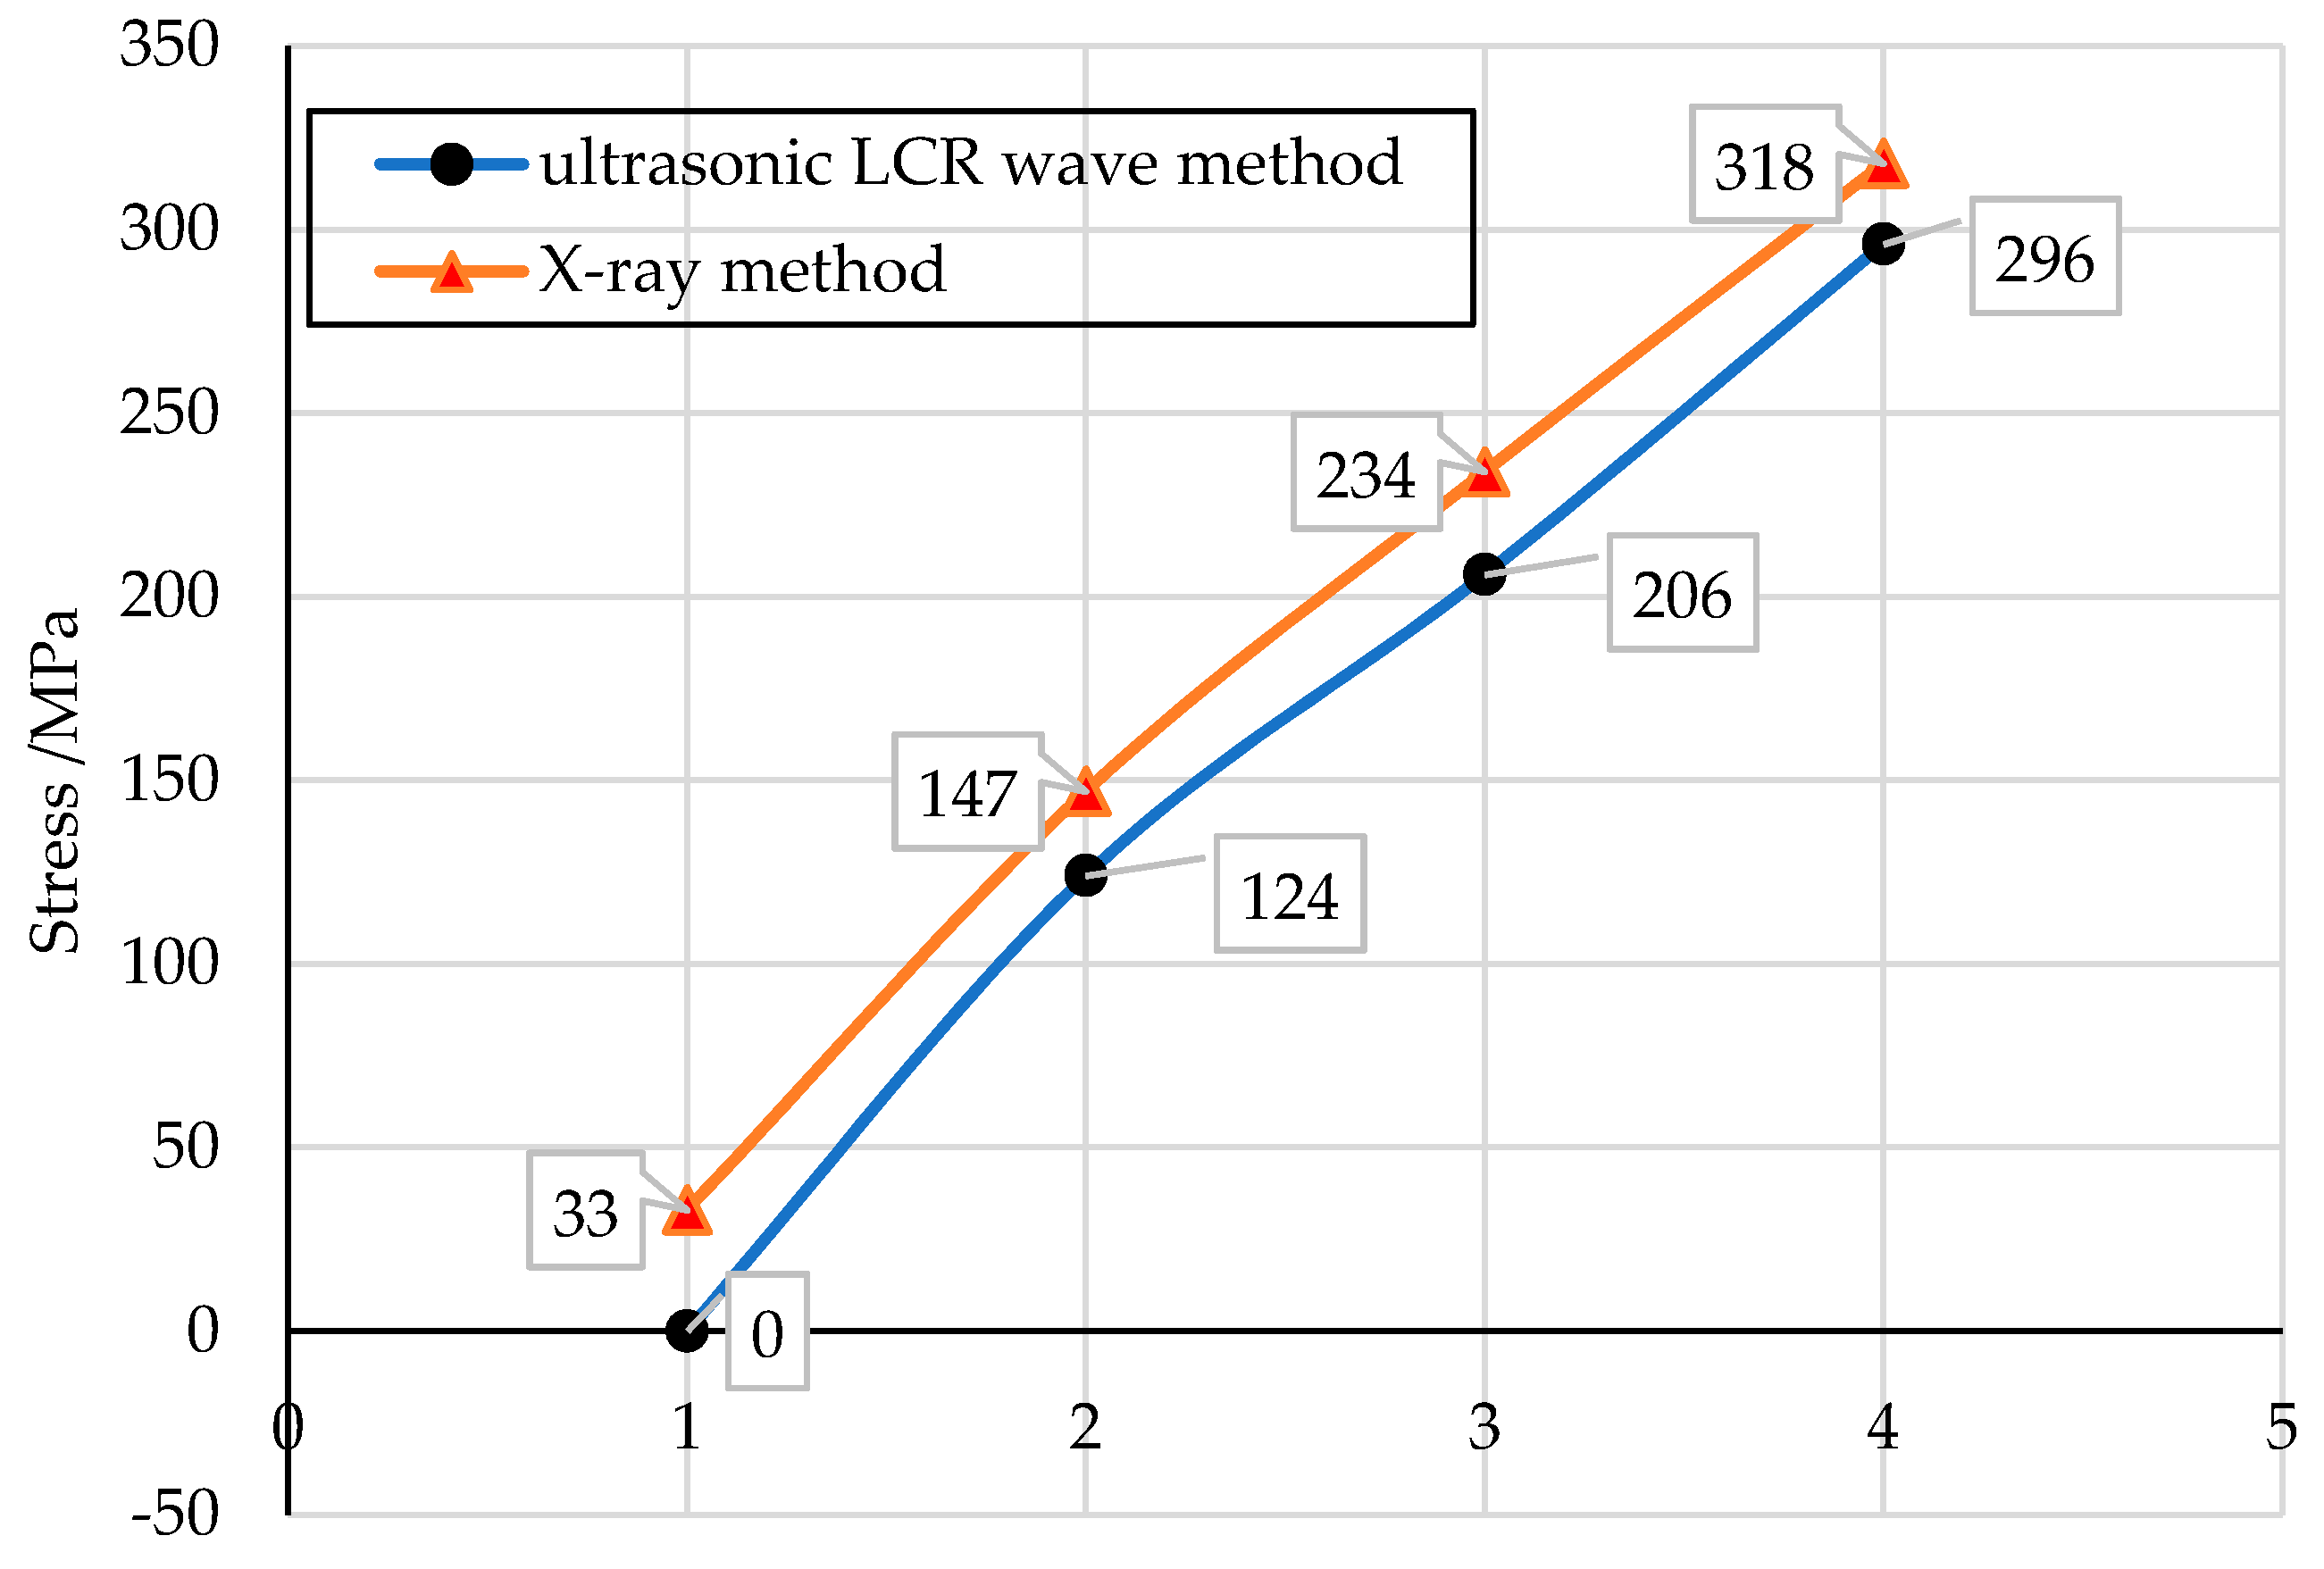
In order to evaluate the effectiveness of the ultrasonic measurement method of residual stress, we can use the X-ray method to measure the surface residual stress of the U75V tensile specimen, as shown in Figure 16, for comparison and verification. Due to the limitation of testing conditions, we cannot directly perform X-ray measurement on the tensile specimen on the universal testing machine. As shown in Figure 16a, we can artificially create different stresses on the tensile specimen surface. Simultaneously applying different pre-tightening forces to the bolts at both ends of the tensile specimen, the specimen produces different bending deformations. Theoretical analysis shows that different tensile stresses will appear on the top of the specimen. In order to reduce or ignore the influence of the change in sound path distance due to surface deformation, an ultrasonic probe system with a relatively short sound path distance should be used to measure the stress on the top surface.
From the results of the two measurement methods shown in Figure 17, it can be seen that the stress obtained by the X-ray measurement method is larger than that of the ultrasonic measurement method, but the stress change trend obtained by the two measurement methods is generally consistent. This shows that the ultrasonic measurement method is an effective residual stress measurement method. The main reason for the small difference in the measurement results is that the measurement benchmarks are different. The X-ray method measures the residual stress of a certain point, while the ultrasonic method is a relative measurement method, which measures the average stress of an ultrasonic wave propagation area. As we all know, it is very difficult to make a specimen without residual stress. It is believed that when the bolt pre-tightening force is 0, that is, when the specimen does not undergo bending deformation, there is no stress on the surface of the specimen. This state is used as a benchmark for the ultrasonic measurement of residual stress.
5. Conclusions
The ultrasonic LCR wave method is an effective method of residual stress measurement. The research presented in this paper focused on the denoising of LCR wave signals for rail surface residual stress measurement. The denoising methods based on WT, WPT, LSWT, and LSWPT were utilized for a structured noisy signal respectively. Combined with the experimental results and discussion, the following conclusions are drawn:
- The wavelet families of Daubechies, Symlets, Coiflets, and Biorthogonal are suitable for ultrasonic LCR wave signal analysis. The wavelet base sym8 is tight support in the time domain and has a fast attenuation in the frequency domain. It can be used as the best wavelet base. The best decomposition level is 8.
- The four denoising methods based on wavelet analysis effectively removed most of the noise in LCR wave signals, and the SNRs were significantly improved. The calculation time of LSWT and LSWPT is shorter than that of traditional WT and WPT respectively.
- The WPT and LSPT methods are more effective advanced than WT and LSWT methods against the interference of high-frequency noise.
- The LSWPT denoising method can effectively improve the accuracy of residual stress on-line measurement.
Author Contributions
Conceptualization, C.X. and Q.P.; methodology, Q.P. and P.L.; software, P.L.; validation, Y.L. and S.L.; formal analysis, P.L.; investigation, P.L.; resources, C.X.; data curation, Q.P.; writing—original draft preparation, P.L.; writing—review and editing, S.L. and Y.L.; visualization, Q.P.; supervision, C.X.; project administration, Q.P.; funding acquisition, C.X. and Q.P. All authors have read and agreed to the published version of the manuscript.
Funding
This research was funded by the National Key Basic Research Project (Grant No. 2020-JCJQ-ZD-191), National Natural Science Foundation of China (Grant No. U1737203 & No. 51975050), and the National Defense Science and Industry Bureau of China (Grant No. JSZL2018602C001).
Institutional Review Board Statement
Not Applicable.
Informed Consent Statement
Not Applicable.
Data Availability Statement
The data presented in this study are available on request from the corresponding author.
Conflicts of Interest
The authors declare no conflict of interest.
References
- Shayegan, G.; Mahmoudi, H.; Ghelichi, R.; Villafuerte, J.; Wang, J.; Guagliano, M.; Jahed, H. Residual stress induced by cold spray coating of magnesium AZ31B extrusion. Mater. Des. 2014, 60, 72–84. [Google Scholar] [CrossRef]
- Xu, C.; Song, W.; Pan, Q.; Li, H.; Liu, S. Nondestructive Testing Residual Stress Using Ultrasonic Critical Refracted Longitudinal Wave. Phys. Procedia 2015, 70, 594–598. [Google Scholar] [CrossRef] [Green Version]
- Yan, H. Research on Nonlinear Ultrasonic Properties of Tension Stress in Metal Materials. Chin. J. Mech. Eng. 2016, 52, 22–29. [Google Scholar] [CrossRef]
- Pan, Q.; Liu, S.; Li, X.; Xu, C. Characteristic Evaluation on Bolt Stress by Ultrasonic Nondestructive Methods. Adv. Mater. Sci. Eng. 2015, 2015, 1–6. [Google Scholar] [CrossRef] [Green Version]
- Thakur, R.C.; Topno, R.; Krishna, B.; Roy, B.; Murty, G. Residual Stress Measurement in Rails. In Proceedings of the National Seminar on Non-Destructive Evaluation, Hyderabad, India, 7–9 December 2006; pp. 159–162. [Google Scholar]
- Silk, M.G. Relationships between metallurgical texture and ultrasonic propagation. Met. Sci. 1981, 15, 559–565. [Google Scholar] [CrossRef]
- Crecraft, D. The measurement of applied and residual stresses in metals using ultrasonic waves. J. Sound Vib. 1967, 5, 173–192. [Google Scholar] [CrossRef]
- Ouahabi, A. A review of wavelet denoising in medical imaging. In Proceedings of the 8th International Workshop on Systems, Signal Processing and Their Applications (IEEE/WoSSPA), Algiers, Algeria, 12–15 May 2013; pp. 19–26. [Google Scholar] [CrossRef]
- Ashikuzzaman; Rivaz, H. Denoising RF Data via Robust Principal Component Analysis: Results in Ultrasound Elastography. In Proceedings of the 2020 42nd Annual International Conference of the IEEE Engineering in Medicine & Biology Society (EMBC), Montreal, QC, Canada, 20 July, 2020; Institute of Electrical and Electronics Engineers (IEEE): Piscataway, NJ, USA, 2020; Volume 2020, pp. 2067–2070. [Google Scholar]
- Mao, Y.; Que, P. Noise suppression and flaw detection of ultrasonic signals via empirical mode decomposition. Russ. J. Nondestruct. Test. 2007, 43, 196–203. [Google Scholar] [CrossRef]
- Rai, H.M.; Chatterjee, K. Hybrid adaptive algorithm based on wavelet transform and independent component analysis for denoising of MRI images. Meas. 2019, 144, 72–82. [Google Scholar] [CrossRef]
- Singh, K.; Sharma, B.; Singh, J.; Srivastava, G.; Sharma, S.; Aggarwal, A.; Cheng, X. Local Statistics-based Speckle Reducing Bilateral Filter for Medical Ultrasound Images. Mob. Networks Appl. 2020, 25, 2367–2389. [Google Scholar] [CrossRef]
- Shao, D.; Yuan, Y.; Xiang, Y.; Yu, Z.; Liu, P.; Liu, D.C. Artifacts detection-based adaptive filtering to noise reduction of strain imaging. Ultrason 2019, 98, 99–107. [Google Scholar] [CrossRef]
- He, Q. Vibration signal classification by wavelet packet energy flow manifold learning. J. Sound Vib. 2013, 332, 1881–1894. [Google Scholar] [CrossRef]
- Mohammed, M.S.; Ki-Seong, K. Shift-invariant wavelet packet for signal de-noising in ultrasonic testing. Insight-Non-Destructive Test. Cond. Monit. 2012, 54, 366–370. [Google Scholar] [CrossRef]
- Luo, X. Wavelet Packet Analysis to Signal in Ultrasonic Testing. Chin. J. Mech. Eng. 2006, 42, 142–146. [Google Scholar] [CrossRef]
- Matz, V.; Smid, R.; Starman, S.; Kreidl, M. Signal-to-noise ratio enhancement based on wavelet filtering in ultrasonic testing. Ultrason. 2009, 49, 752–759. [Google Scholar] [CrossRef] [PubMed]
- Yan, X.L.; Dong, S.Y.; Wang, W.L.; Xu, B.S. Denoising and Defect Diagnosis of Material Ultrasonic Detection signal Based on Best Wavelet Packet Base. Appl. Mech. Mater. 2012, 239–240, 52–56. [Google Scholar] [CrossRef]
- Lang, X.; Hu, Z.; Li, P.; Li, Y.; Cao, J.; Ren, H. Pipeline Leak Aperture Recognition Based on Wavelet Packet Analysis and a Deep Belief Network with ICR. Wirel. Commun. Mob. Comput. 2018, 2018, 1–8. [Google Scholar] [CrossRef] [Green Version]
- Muthumari, S.; Singh, A.; Sharma, A.P. De-noising ultrasonic TOFD signals: A comparative study of wavelet packet method using sure with SSP technique. J. Theor. Appl. Inf. Technol. 2012, 37, 112–115. [Google Scholar]
- Hu, L.; Fang, Z.; Qin, L.; Mao, K.; Chen, W.; Fu, X. Modelling of received ultrasonic signals based on variable frequency analysis. Flow Meas. Instrum. 2019, 65, 141–149. [Google Scholar] [CrossRef]
- Peilu, L.; Chunguang, X.; Xianzan, W.; Hanming, Z. Thick Wall Pipe Ultrasonic Signals Processing Based on Wavelet Packet and Singular Value Decomposition, In Proceedings of the Seventh Asia International Symposium on Mechatronics. Lecture Notes in Electrical Engineering (LNEE 589), Hangzhou, China, 19 September 2020; Springer: Singapore, 2020; pp. 873–882. [Google Scholar]
- Zheng, R.-D.; Gao, Y.-Q.; Li, J.-L.; Gao, X.-R. A Locating Algorithm of Train Wheel Flaws in Ultrasonic Images Based on Cross-Correlation and Wavelet Packet Denoising. In Proceedings of the 2019 Far East NDT New Technology & Application Forum (FENDT), Qingdao, China, 24 June 2019; Institute of Electrical and Electronics Engineers (IEEE): Piscataway, NJ, USA, 2019; pp. 163–167. [Google Scholar]
- Daubechies, I.; Sweldens, W. Factoring wavelet transforms into lifting steps. J. Fourier Anal. Appl. 1998, 4, 247–269. [Google Scholar] [CrossRef]
- Donoho, D.L.; Johnstone, I.M. Adapting to unknown smoothness via wavelet shrinkage. J. Am. Stat. Assoc. 1995, 90, 1200–1224. [Google Scholar] [CrossRef]
- Yan, H.; Xu, C.; Xiao, D.; Cai, H. Properties of GH4169 Superalloy Characterized by Nonlinear Ultrasonic Waves. Adv. Mater. Sci. Eng. 2015, 2015, 1–8. [Google Scholar] [CrossRef] [Green Version]
- Tsui, P.P.; Basir, O.A. Wavelet basis selection and feature extraction for shift invariant ultrasound foreign body classification. Ultrason 2006, 45, 1–14. [Google Scholar] [CrossRef] [PubMed]
- Zhaoheng, D.; Shanghe, L.; Lei, W. Selection of the optimal wavelet bases for wavelet de-noising of partial discharge signal. In Proceedings of the 2010 2nd International Conference on Signal Processing Systems; Institute of Electrical and Electronics Engineers (IEEE): Piscataway, NJ, USA, 2010; Volume 3, pp. V3–400. [Google Scholar]
- Feng, X.; Neilan, M. Vanishing Moment Method and Moment Solutions for Fully Nonlinear Second Order Partial Differential Equations. J. Sci. Comput. 2008, 38, 74–98. [Google Scholar] [CrossRef]
Figure 1.
The 2-level decomposition of the lifting scheme.
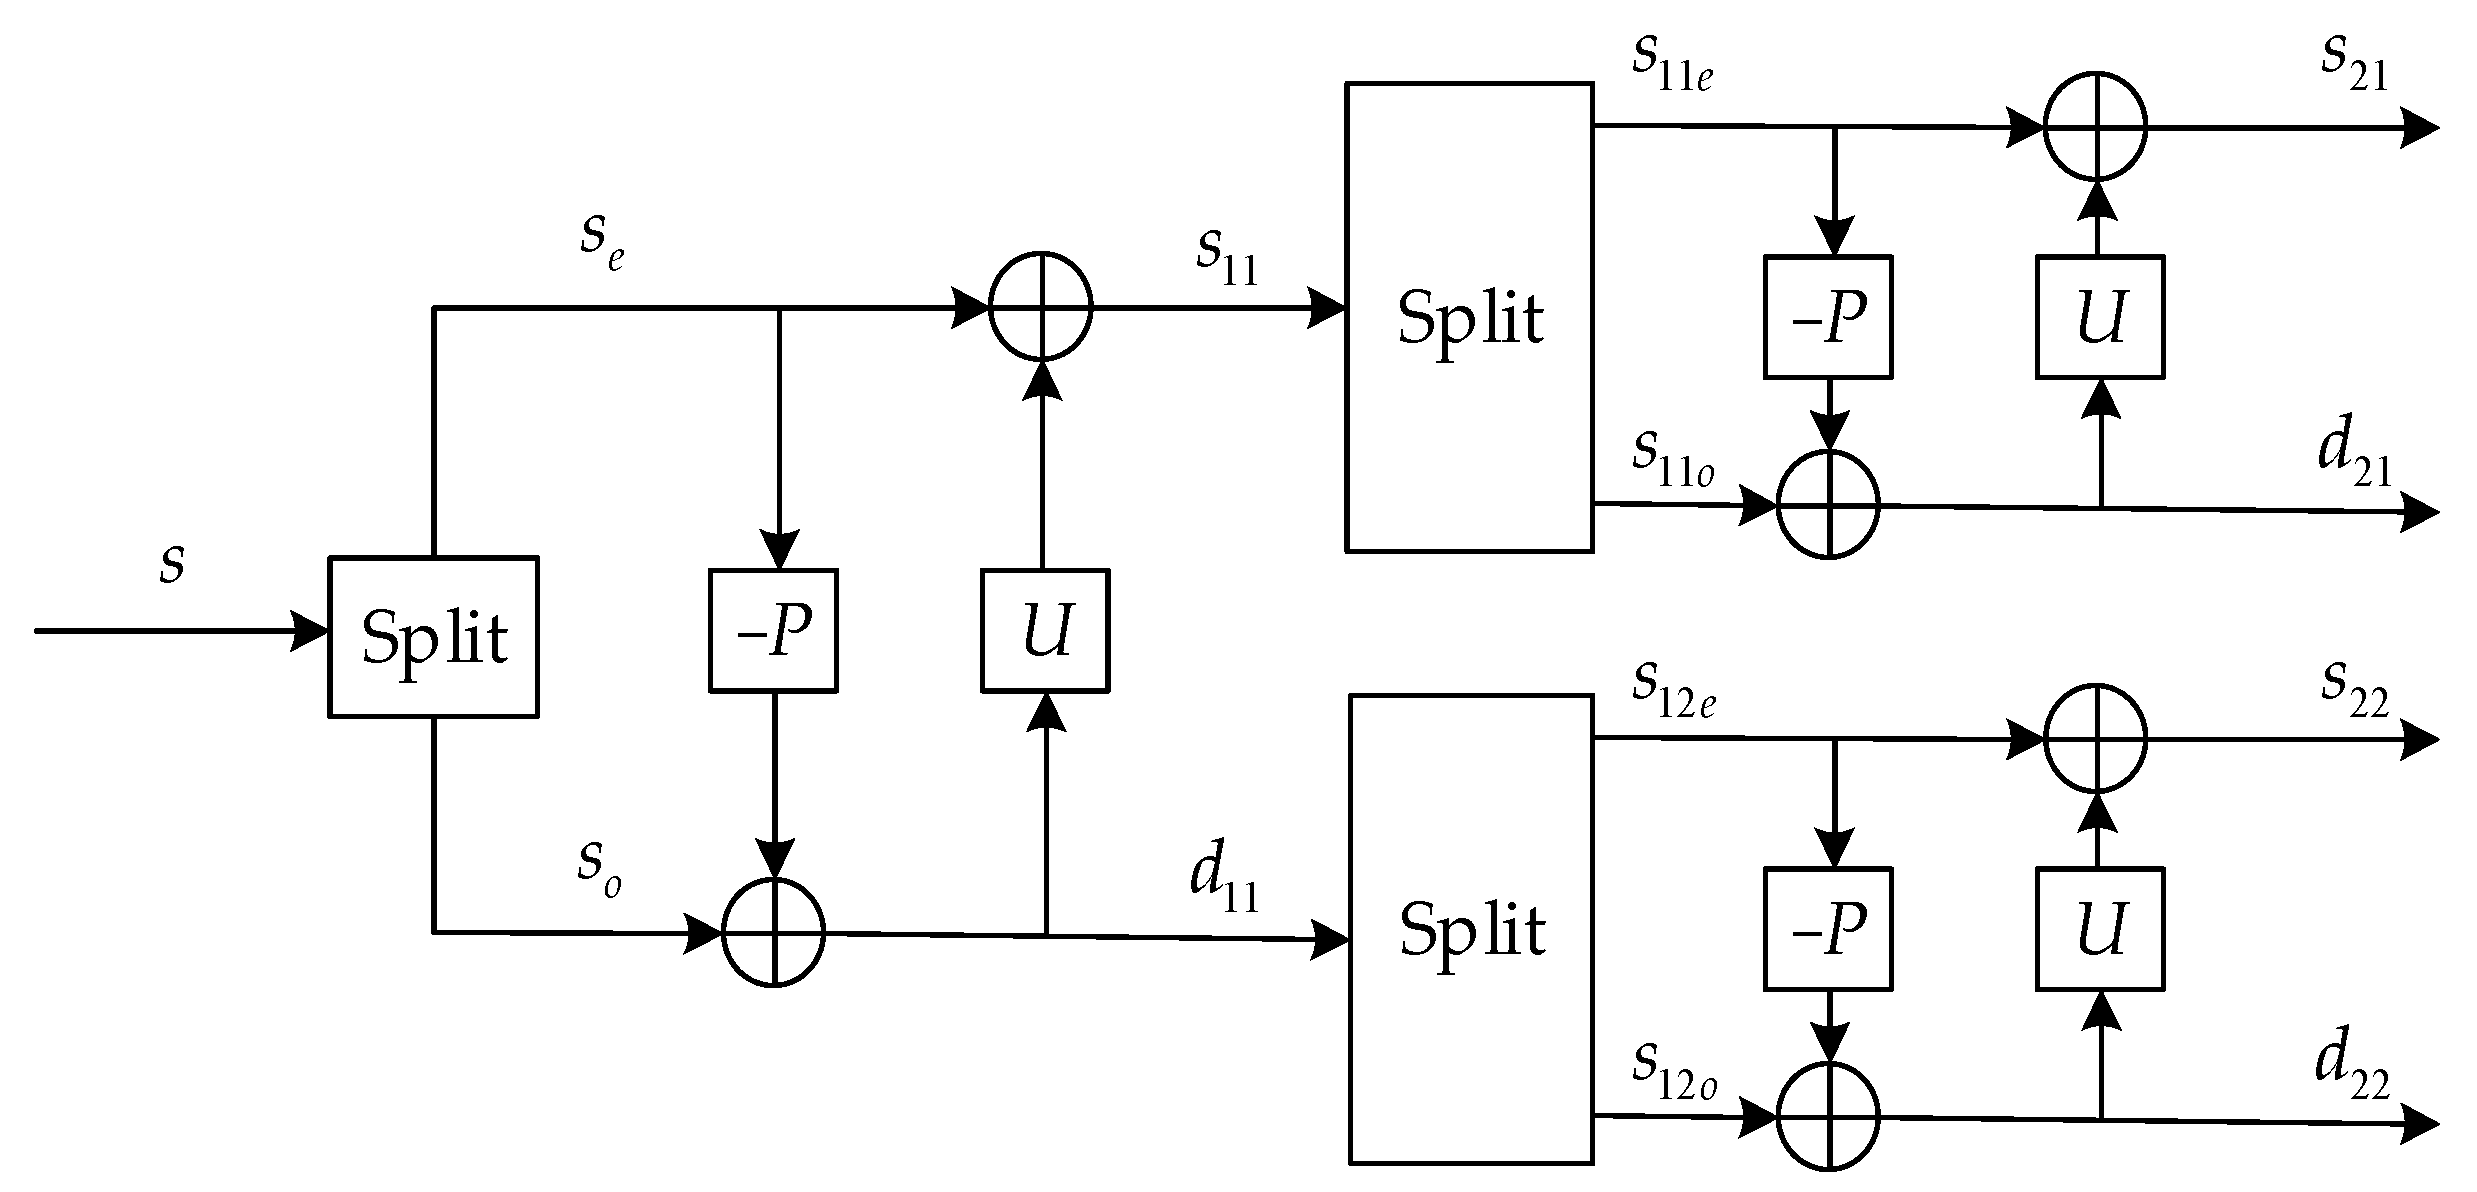
Figure 2.
The lifting scheme wavelet transform (LSWT) decomposition based on the principle of interpolation and subdivision.
Figure 2.
The lifting scheme wavelet transform (LSWT) decomposition based on the principle of interpolation and subdivision.
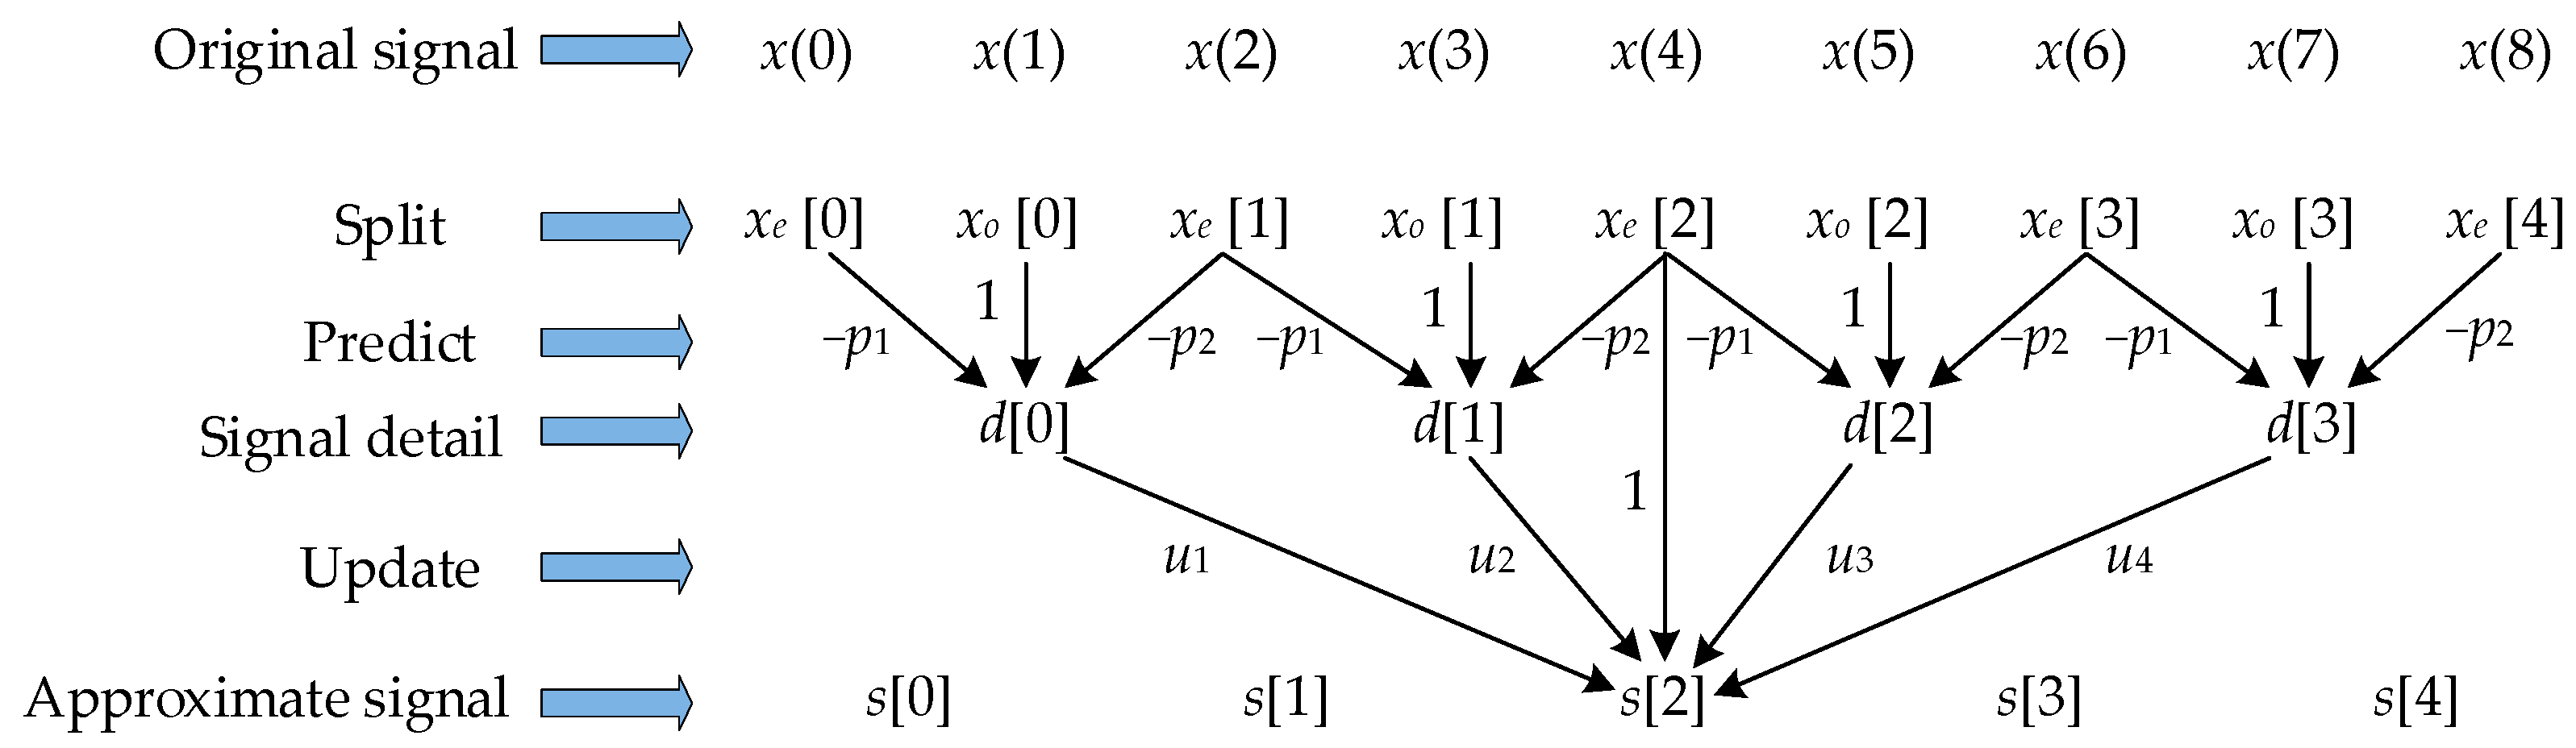
Figure 3.
The reconstruction process after 2-level decomposition of lifting scheme.
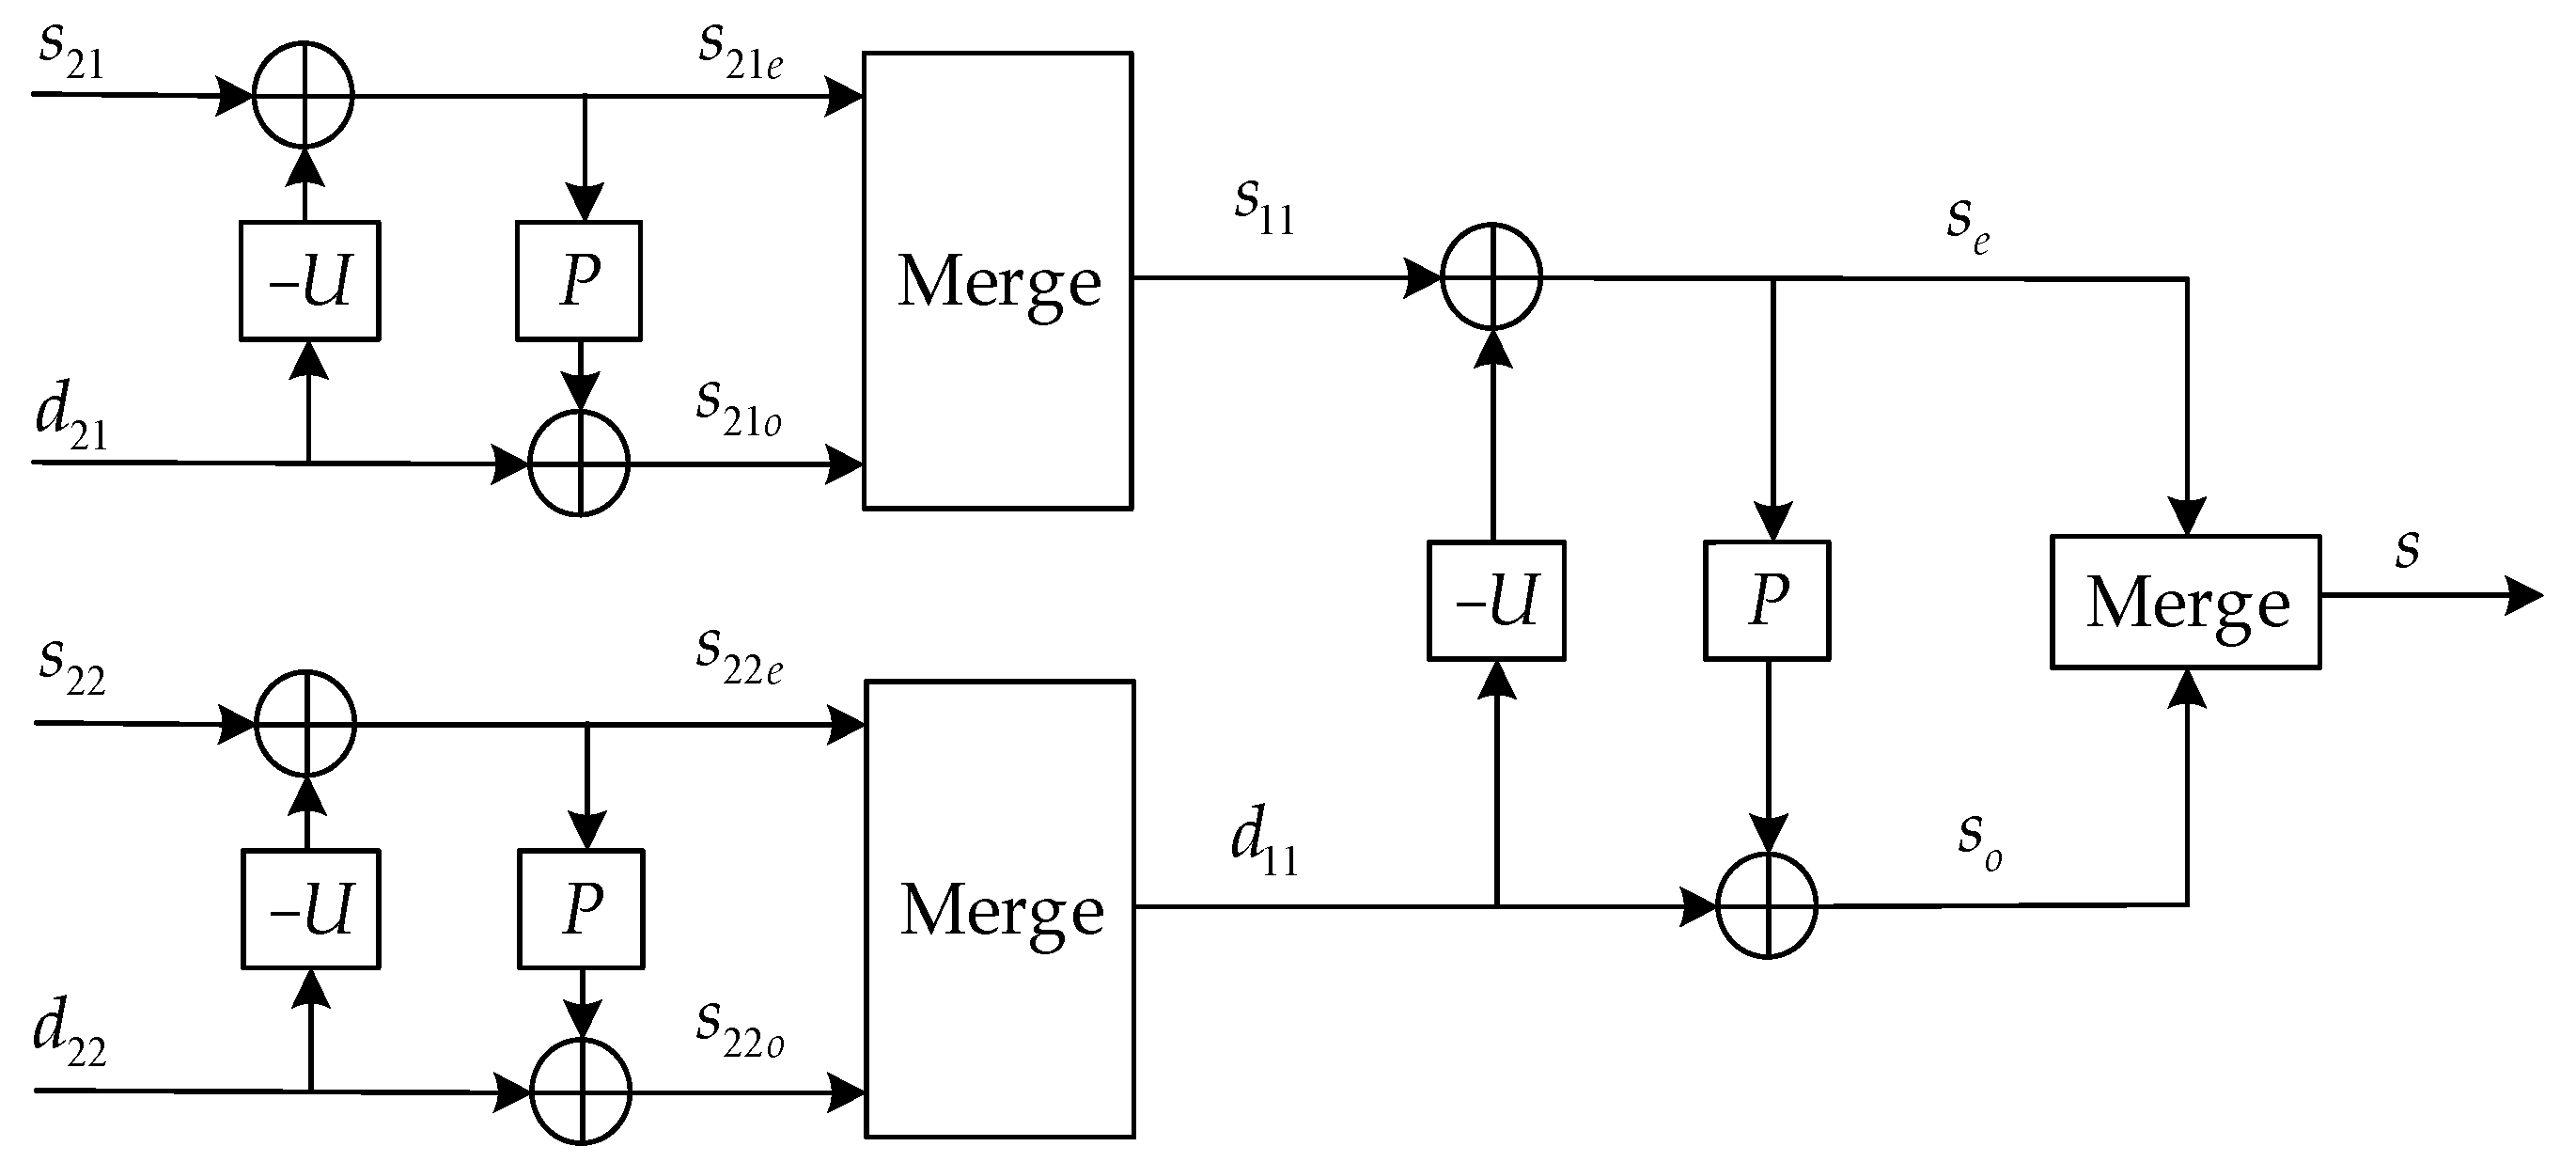
Figure 4.
The LSWT reconstruction based on the principle of interpolation and subdivision.

Figure 5.
Rail surface residual stress measurement by using ultrasonic longitudinal critically refracted (LCR) wave.
Figure 5.
Rail surface residual stress measurement by using ultrasonic longitudinal critically refracted (LCR) wave.
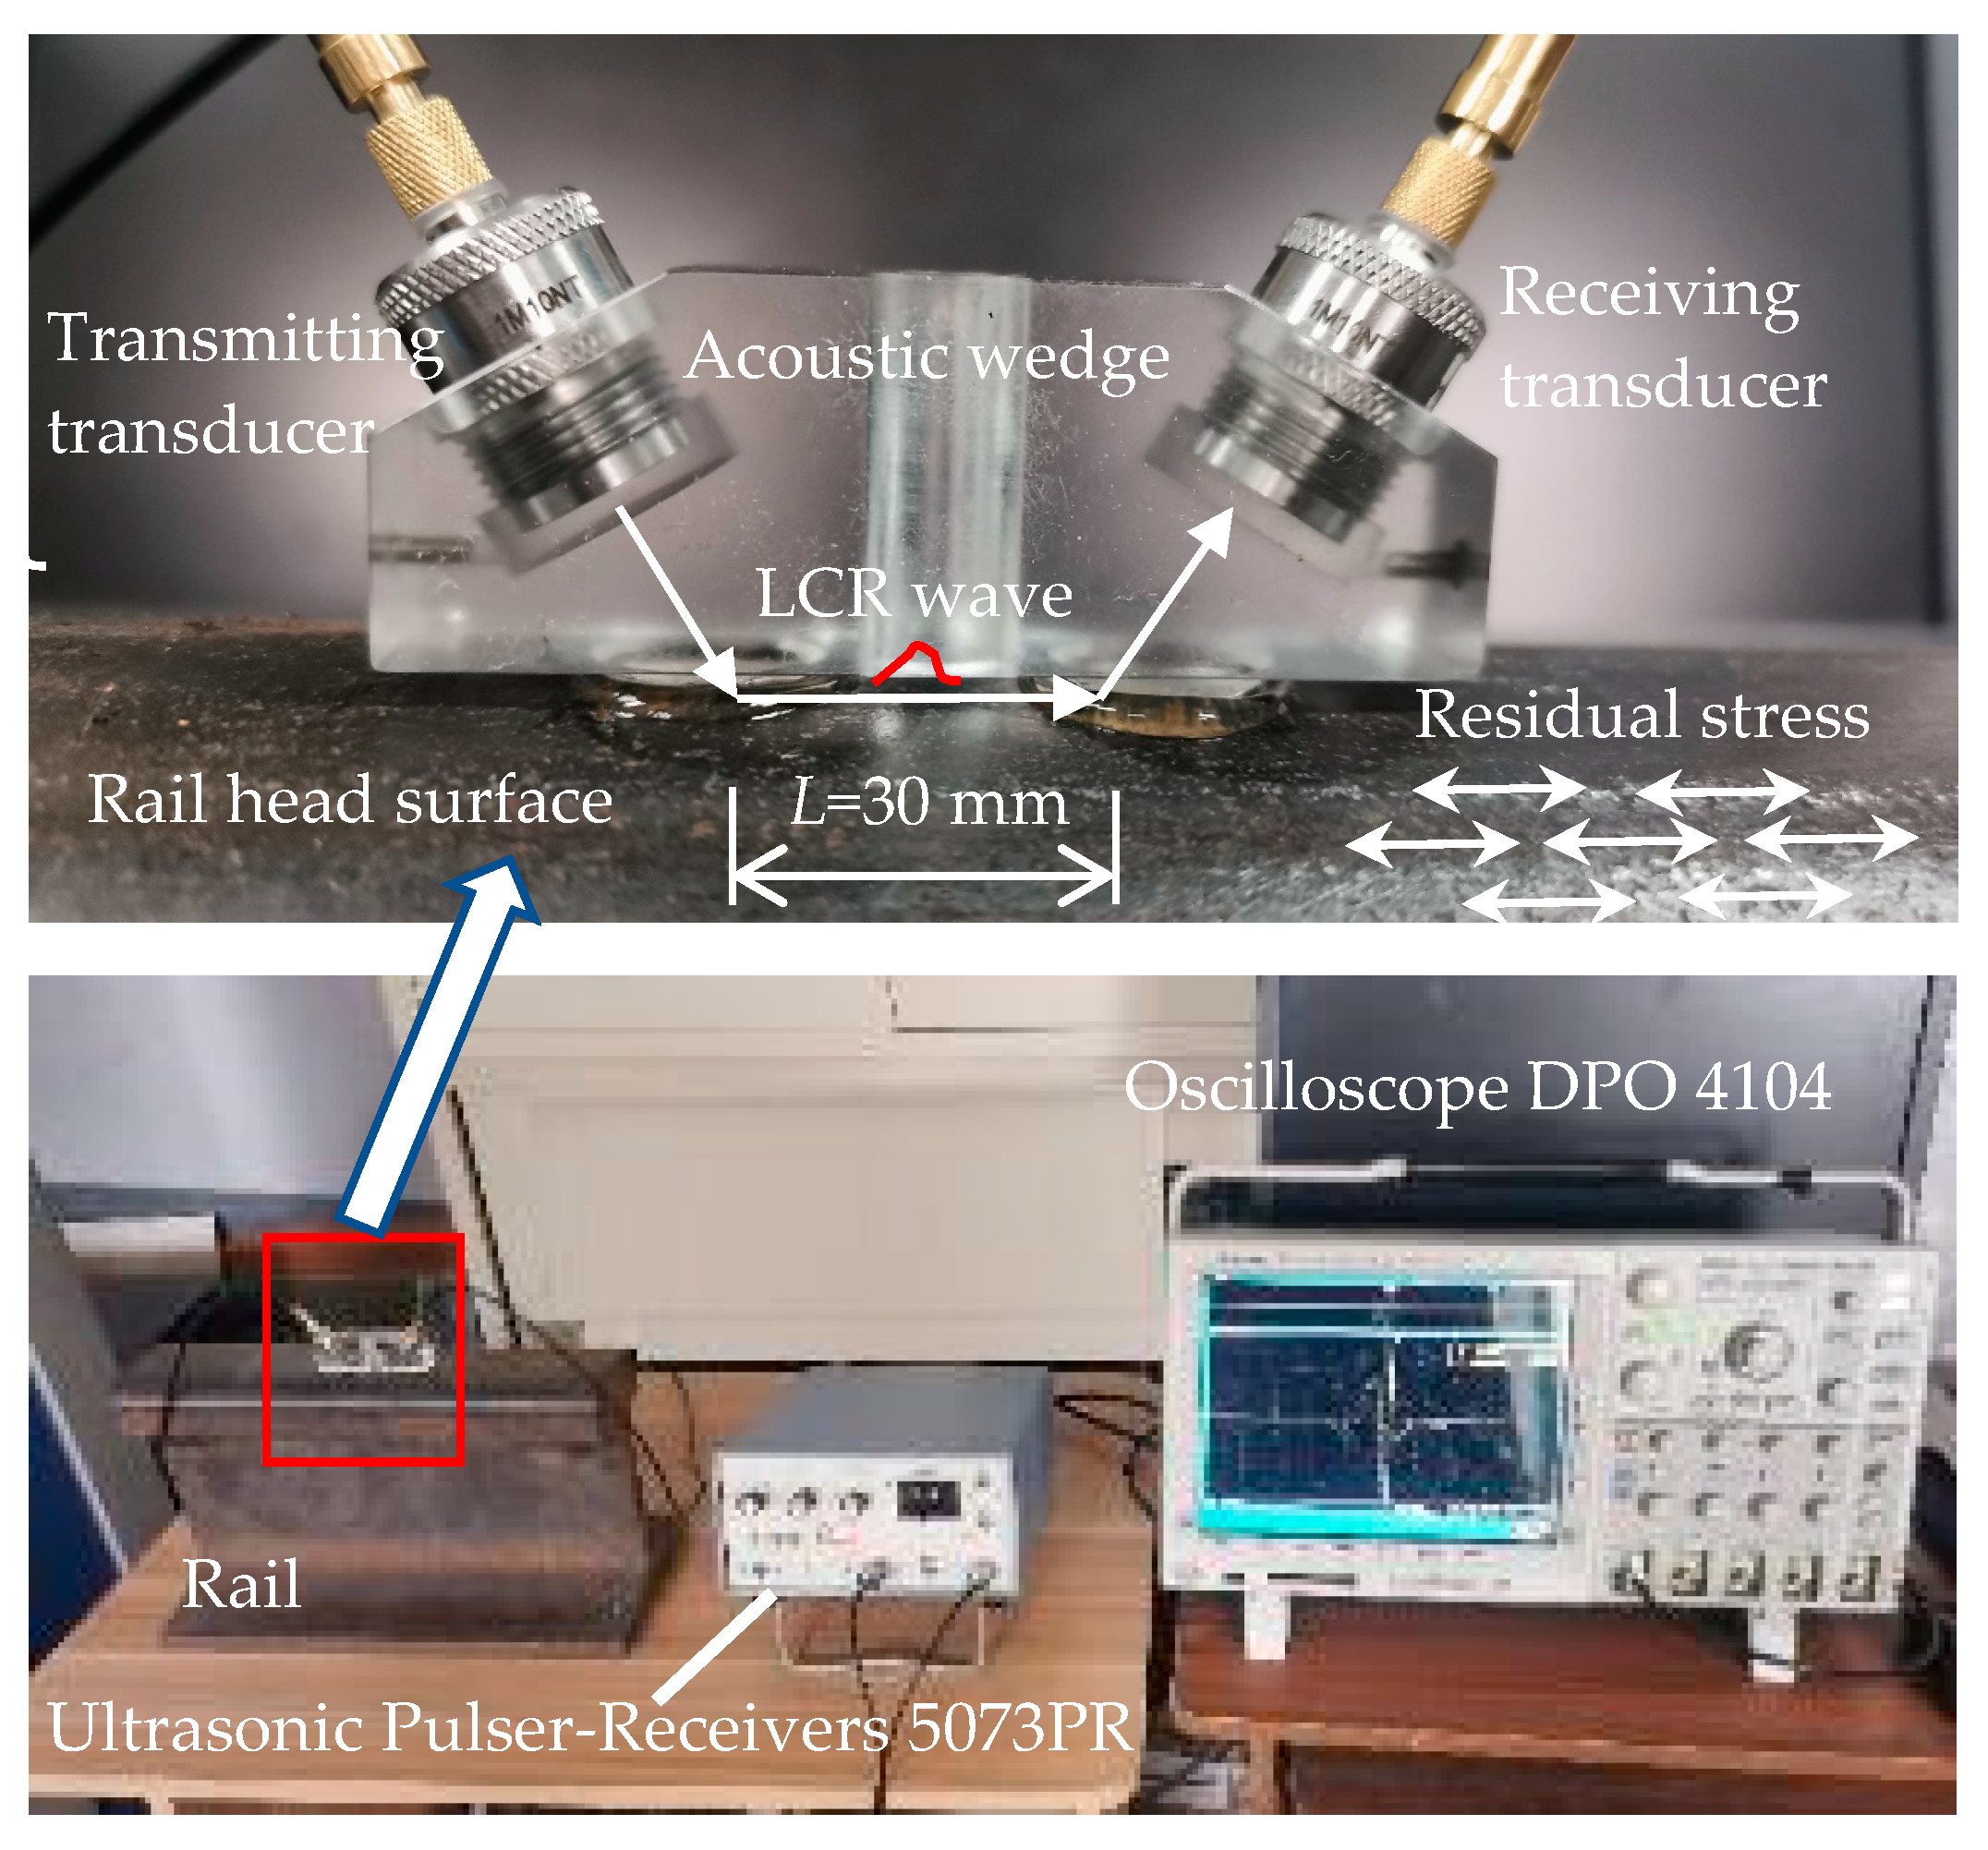
Figure 6.
Surface residual stress measurement at rail head, rail web, and rail base.

Figure 7.
The original signals of rail head, rail web, and rail base by using ultrasonic transducers with the frequency of (a) 1 MHz; (b) 2.5 MHz; (c) 5 MHz.
Figure 7.
The original signals of rail head, rail web, and rail base by using ultrasonic transducers with the frequency of (a) 1 MHz; (b) 2.5 MHz; (c) 5 MHz.

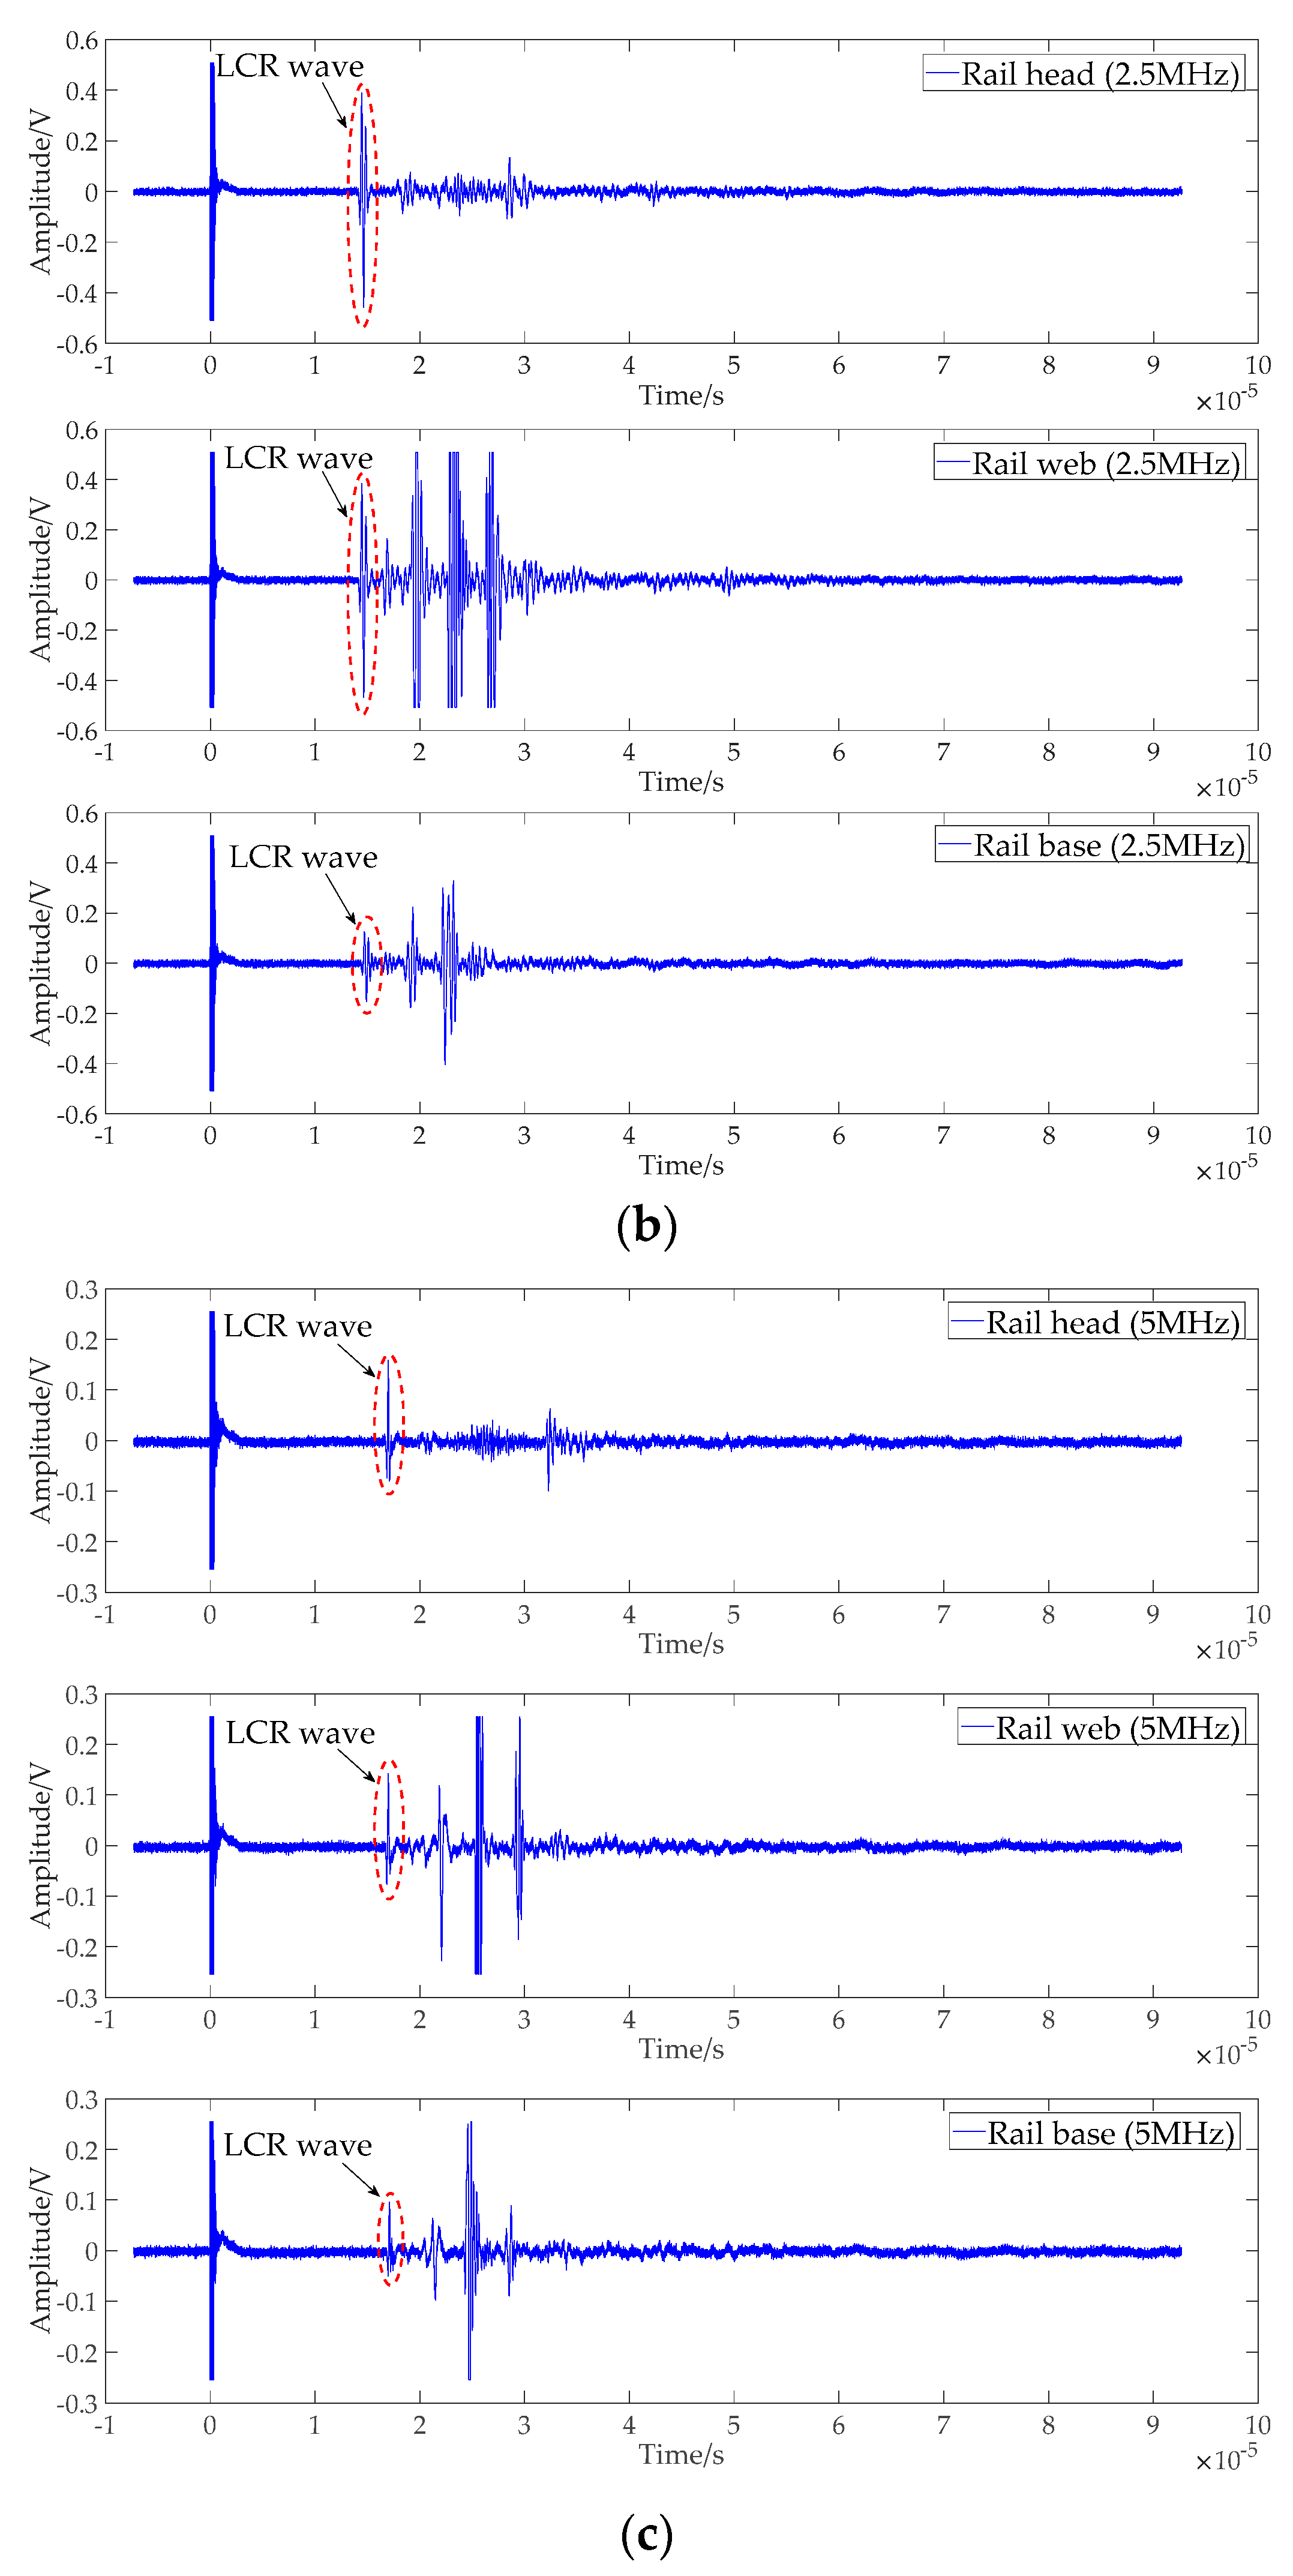
Figure 8.
Wavelet Flow diagram of design for best wavelet base and optimal decomposition scale of lifting scheme wavelet packet transform (LSWPT).
Figure 8.
Wavelet Flow diagram of design for best wavelet base and optimal decomposition scale of lifting scheme wavelet packet transform (LSWPT).

Figure 9.
The rail base: (a) original LCR wave signals; (b) after 32-average filtering; (c) high-frequency sinusoidal signal; (d) with white noise.
Figure 9.
The rail base: (a) original LCR wave signals; (b) after 32-average filtering; (c) high-frequency sinusoidal signal; (d) with white noise.
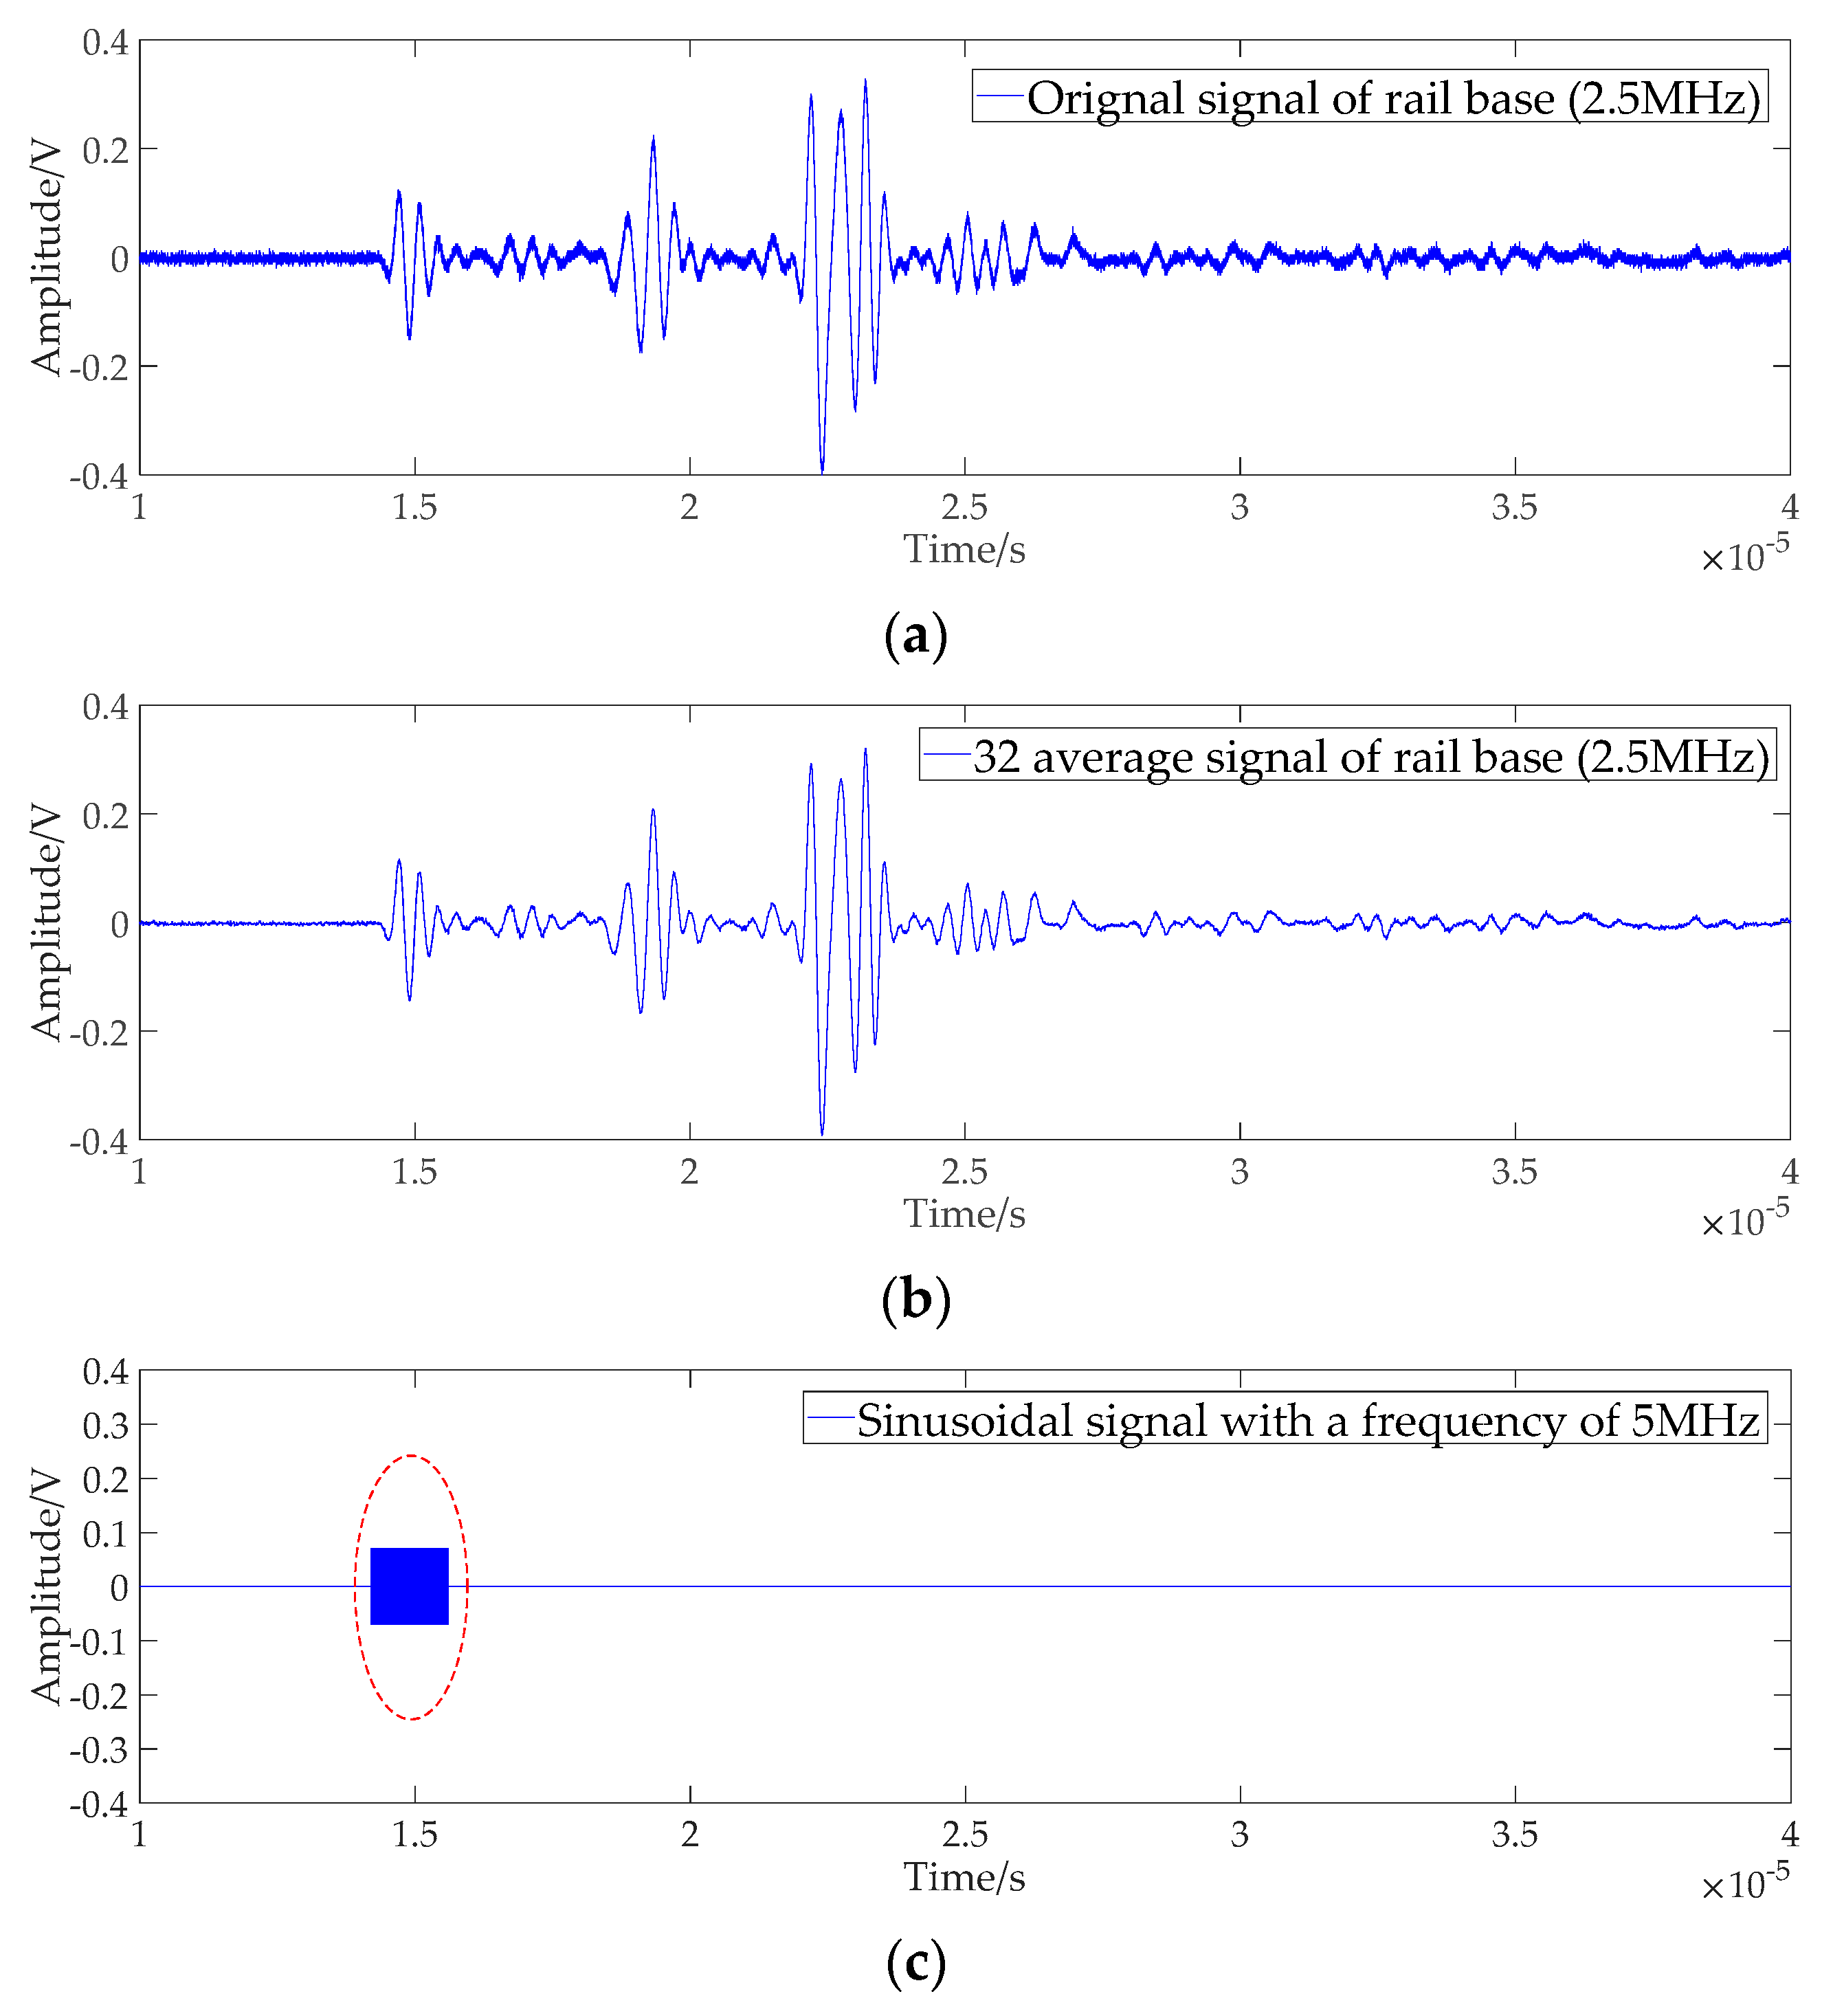
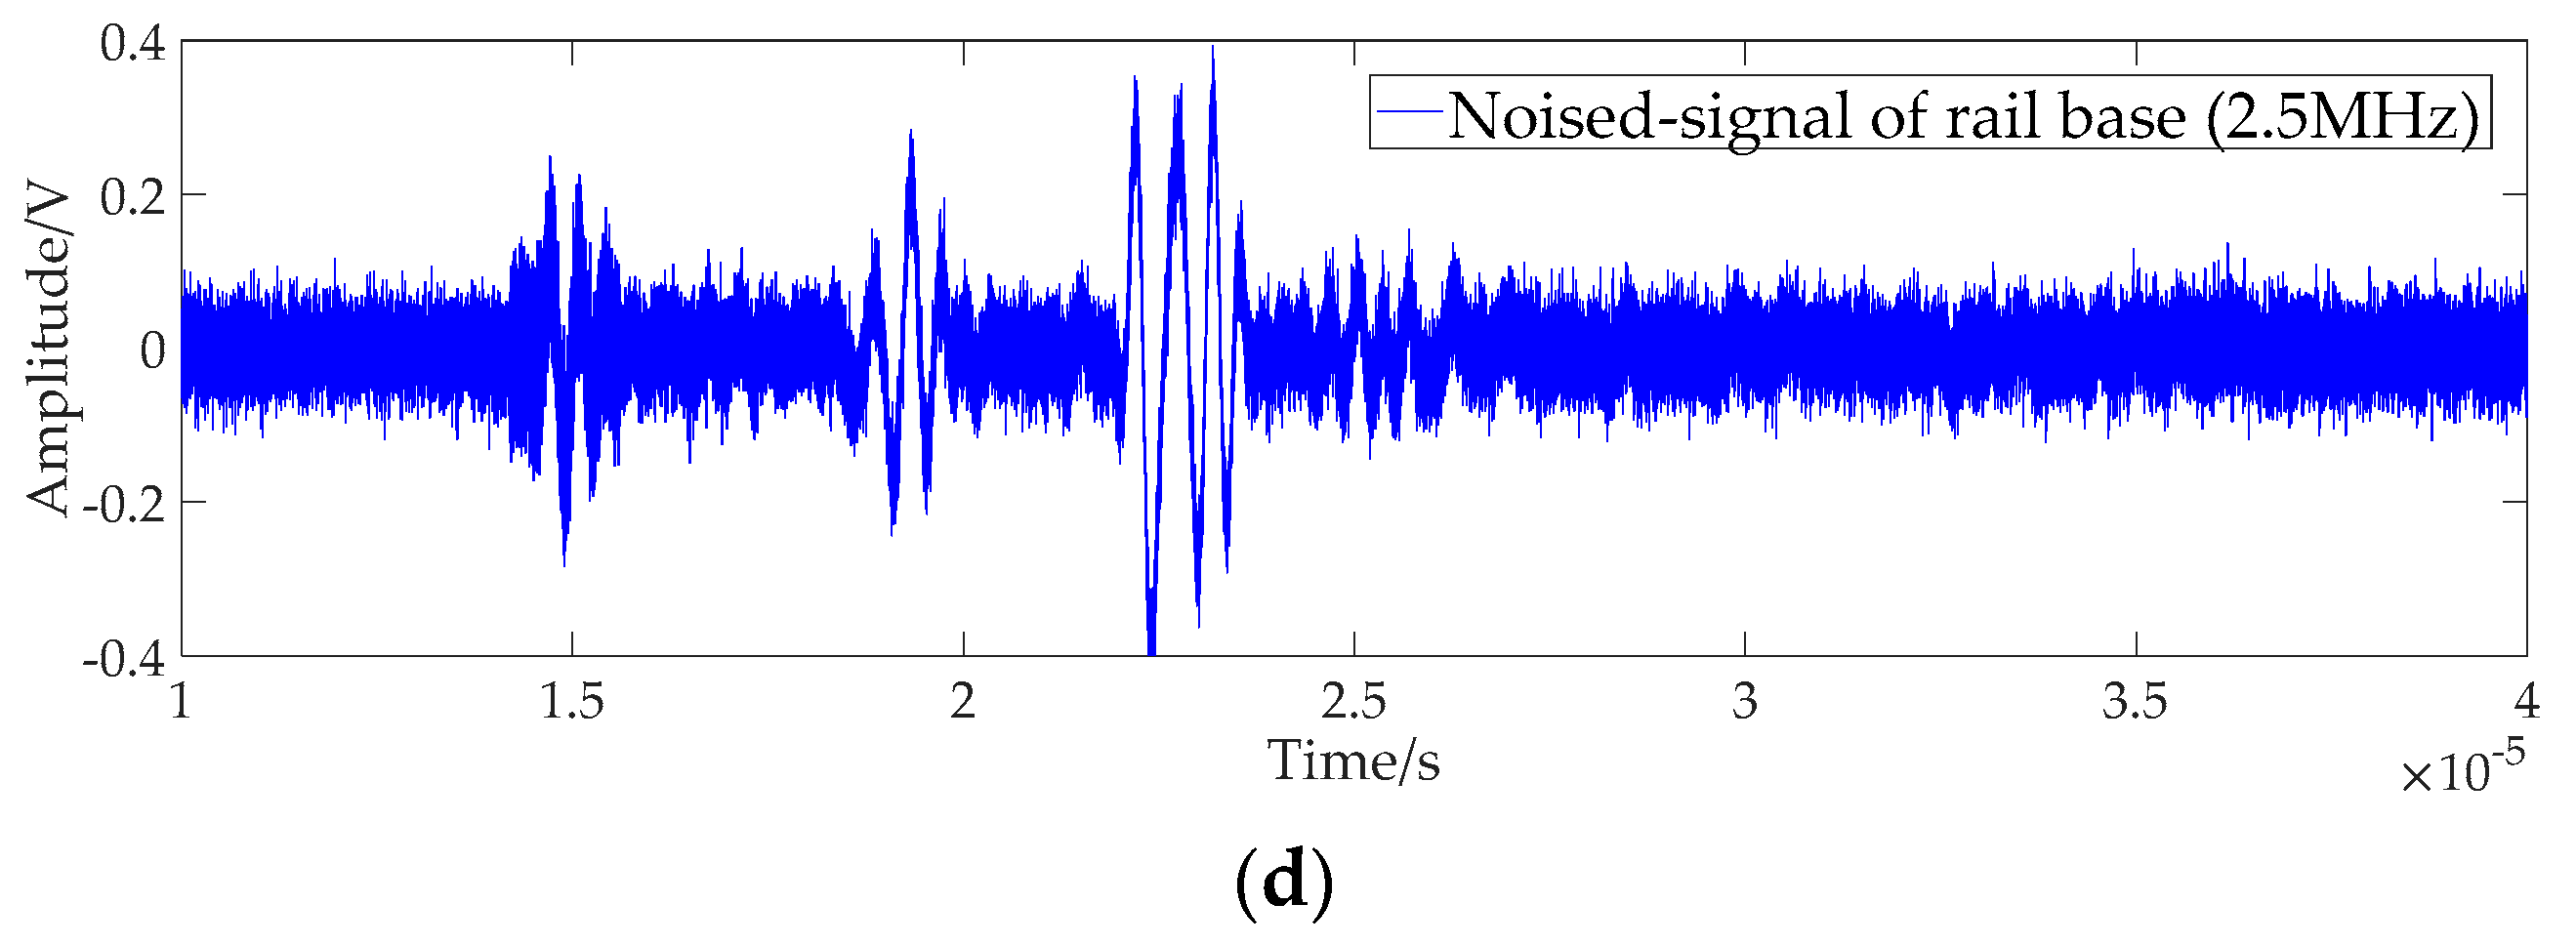
Figure 10.
The signal-to-noise ratio (SNR) of denoise processing by: (a) dbN; (b) symN; (c) coifN; (d) biorNr.Nd.
Figure 10.
The signal-to-noise ratio (SNR) of denoise processing by: (a) dbN; (b) symN; (c) coifN; (d) biorNr.Nd.


Figure 11.
The sym8 wavelet scaling function and wavelet function.
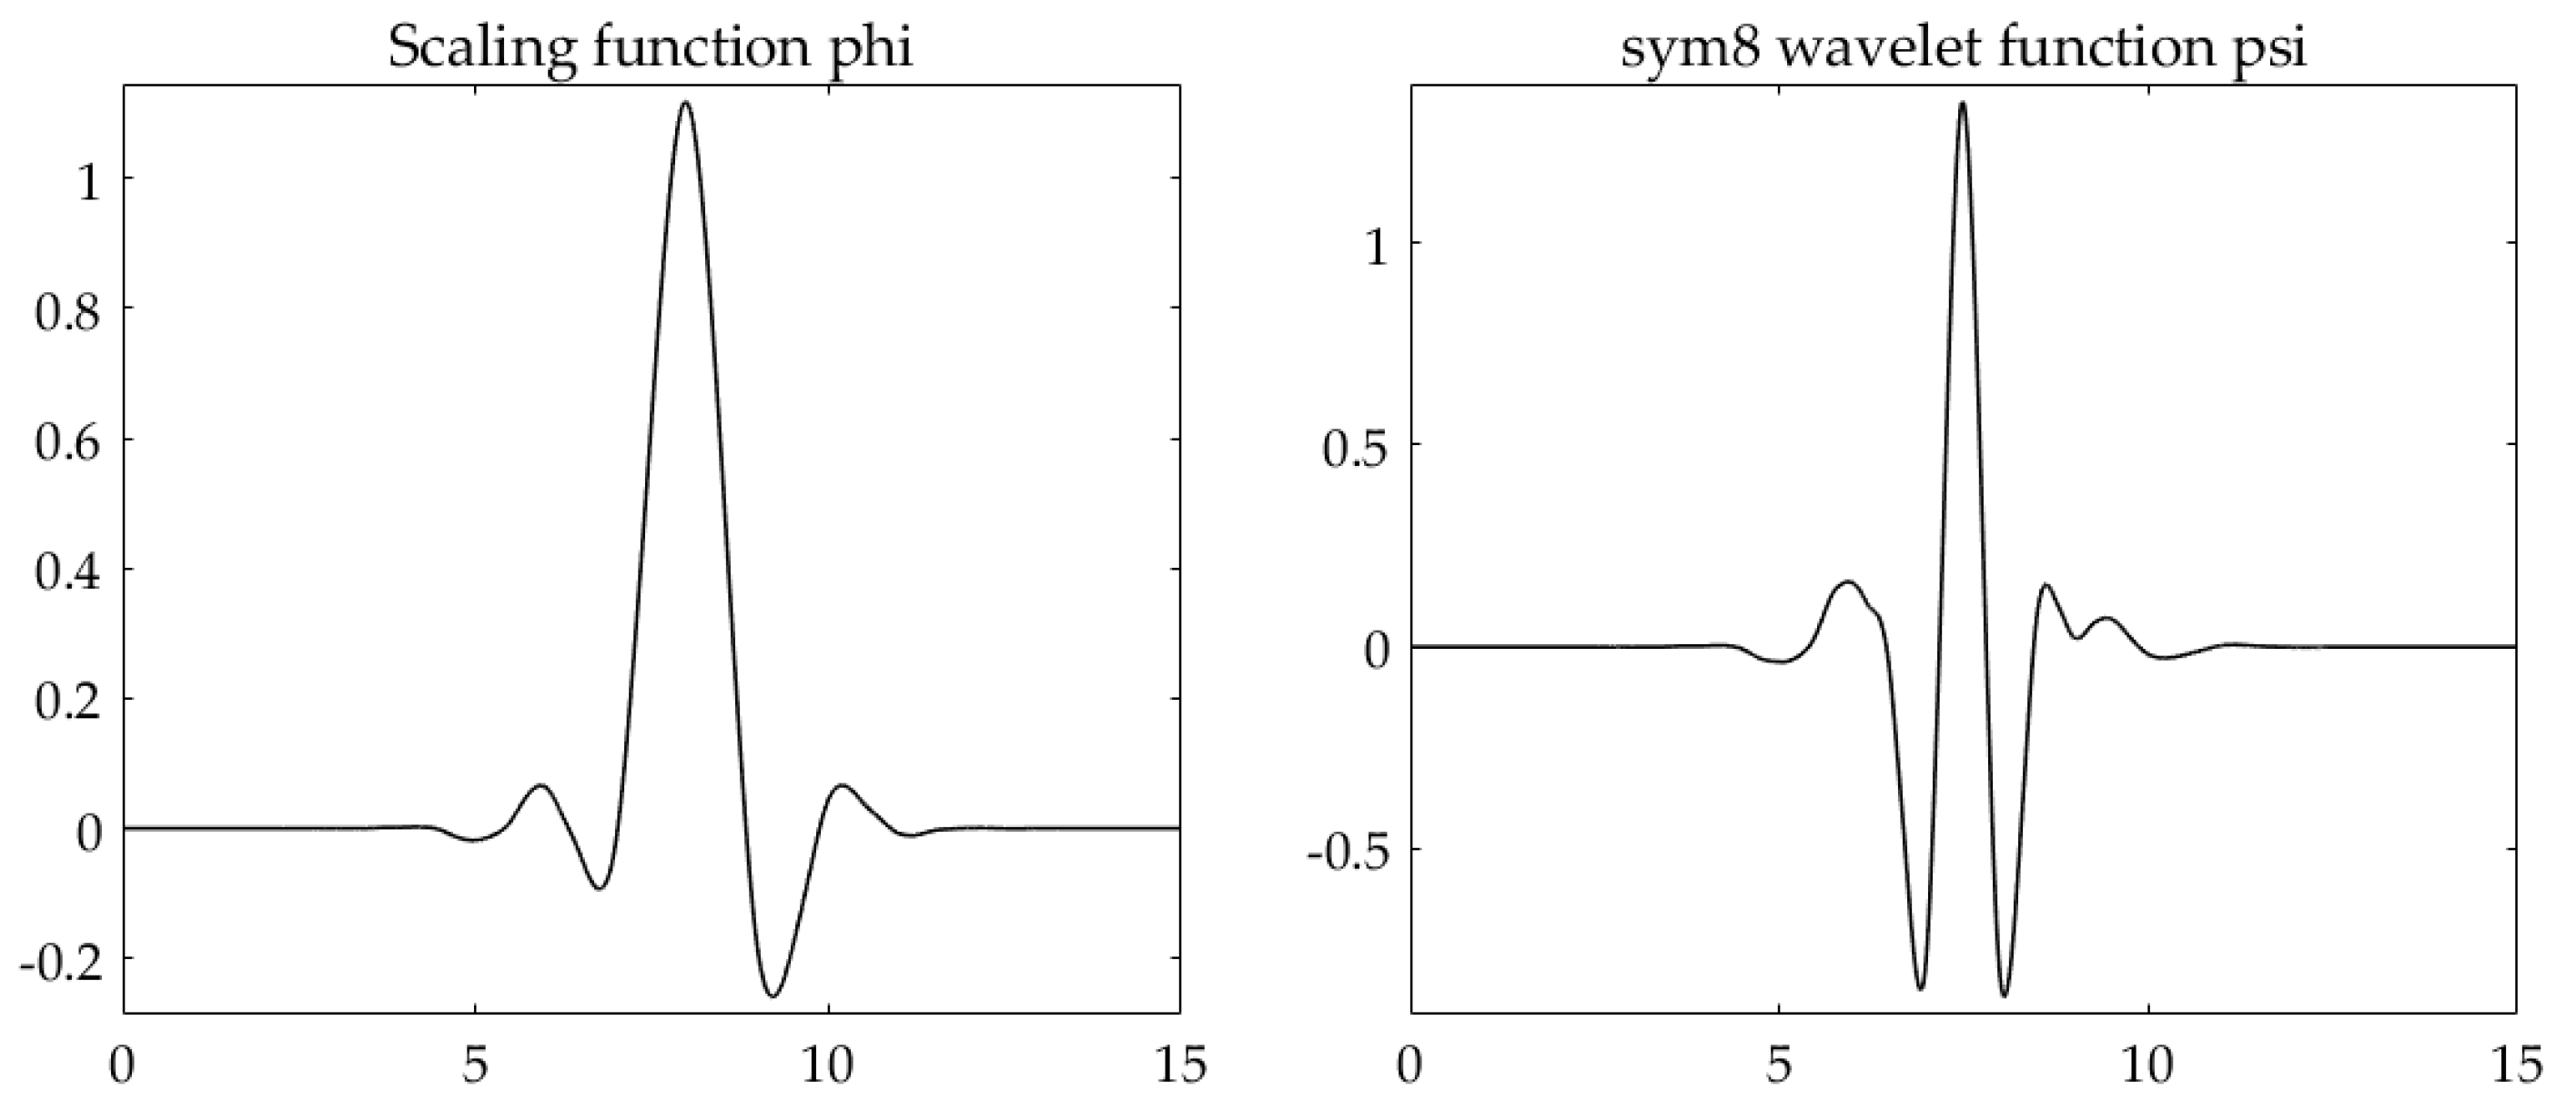
Figure 12.
The LCR wave signals denoised (a) by WT at soft thresholding; (b) by WPT at soft thresholding; (c) by LSWT at hard thresholding; (d) by LSWPT at hard thresholding.
Figure 12.
The LCR wave signals denoised (a) by WT at soft thresholding; (b) by WPT at soft thresholding; (c) by LSWT at hard thresholding; (d) by LSWPT at hard thresholding.

Figure 13.
The absolute calibration method to calibrate the ultrasonic testing equipment.

Figure 14.
The LCR wave signals (1 MHz) of the rail base for calibration and measurement.

Figure 15.
The stress calibration of U75V rail steel and measurement of rail base residual stress.
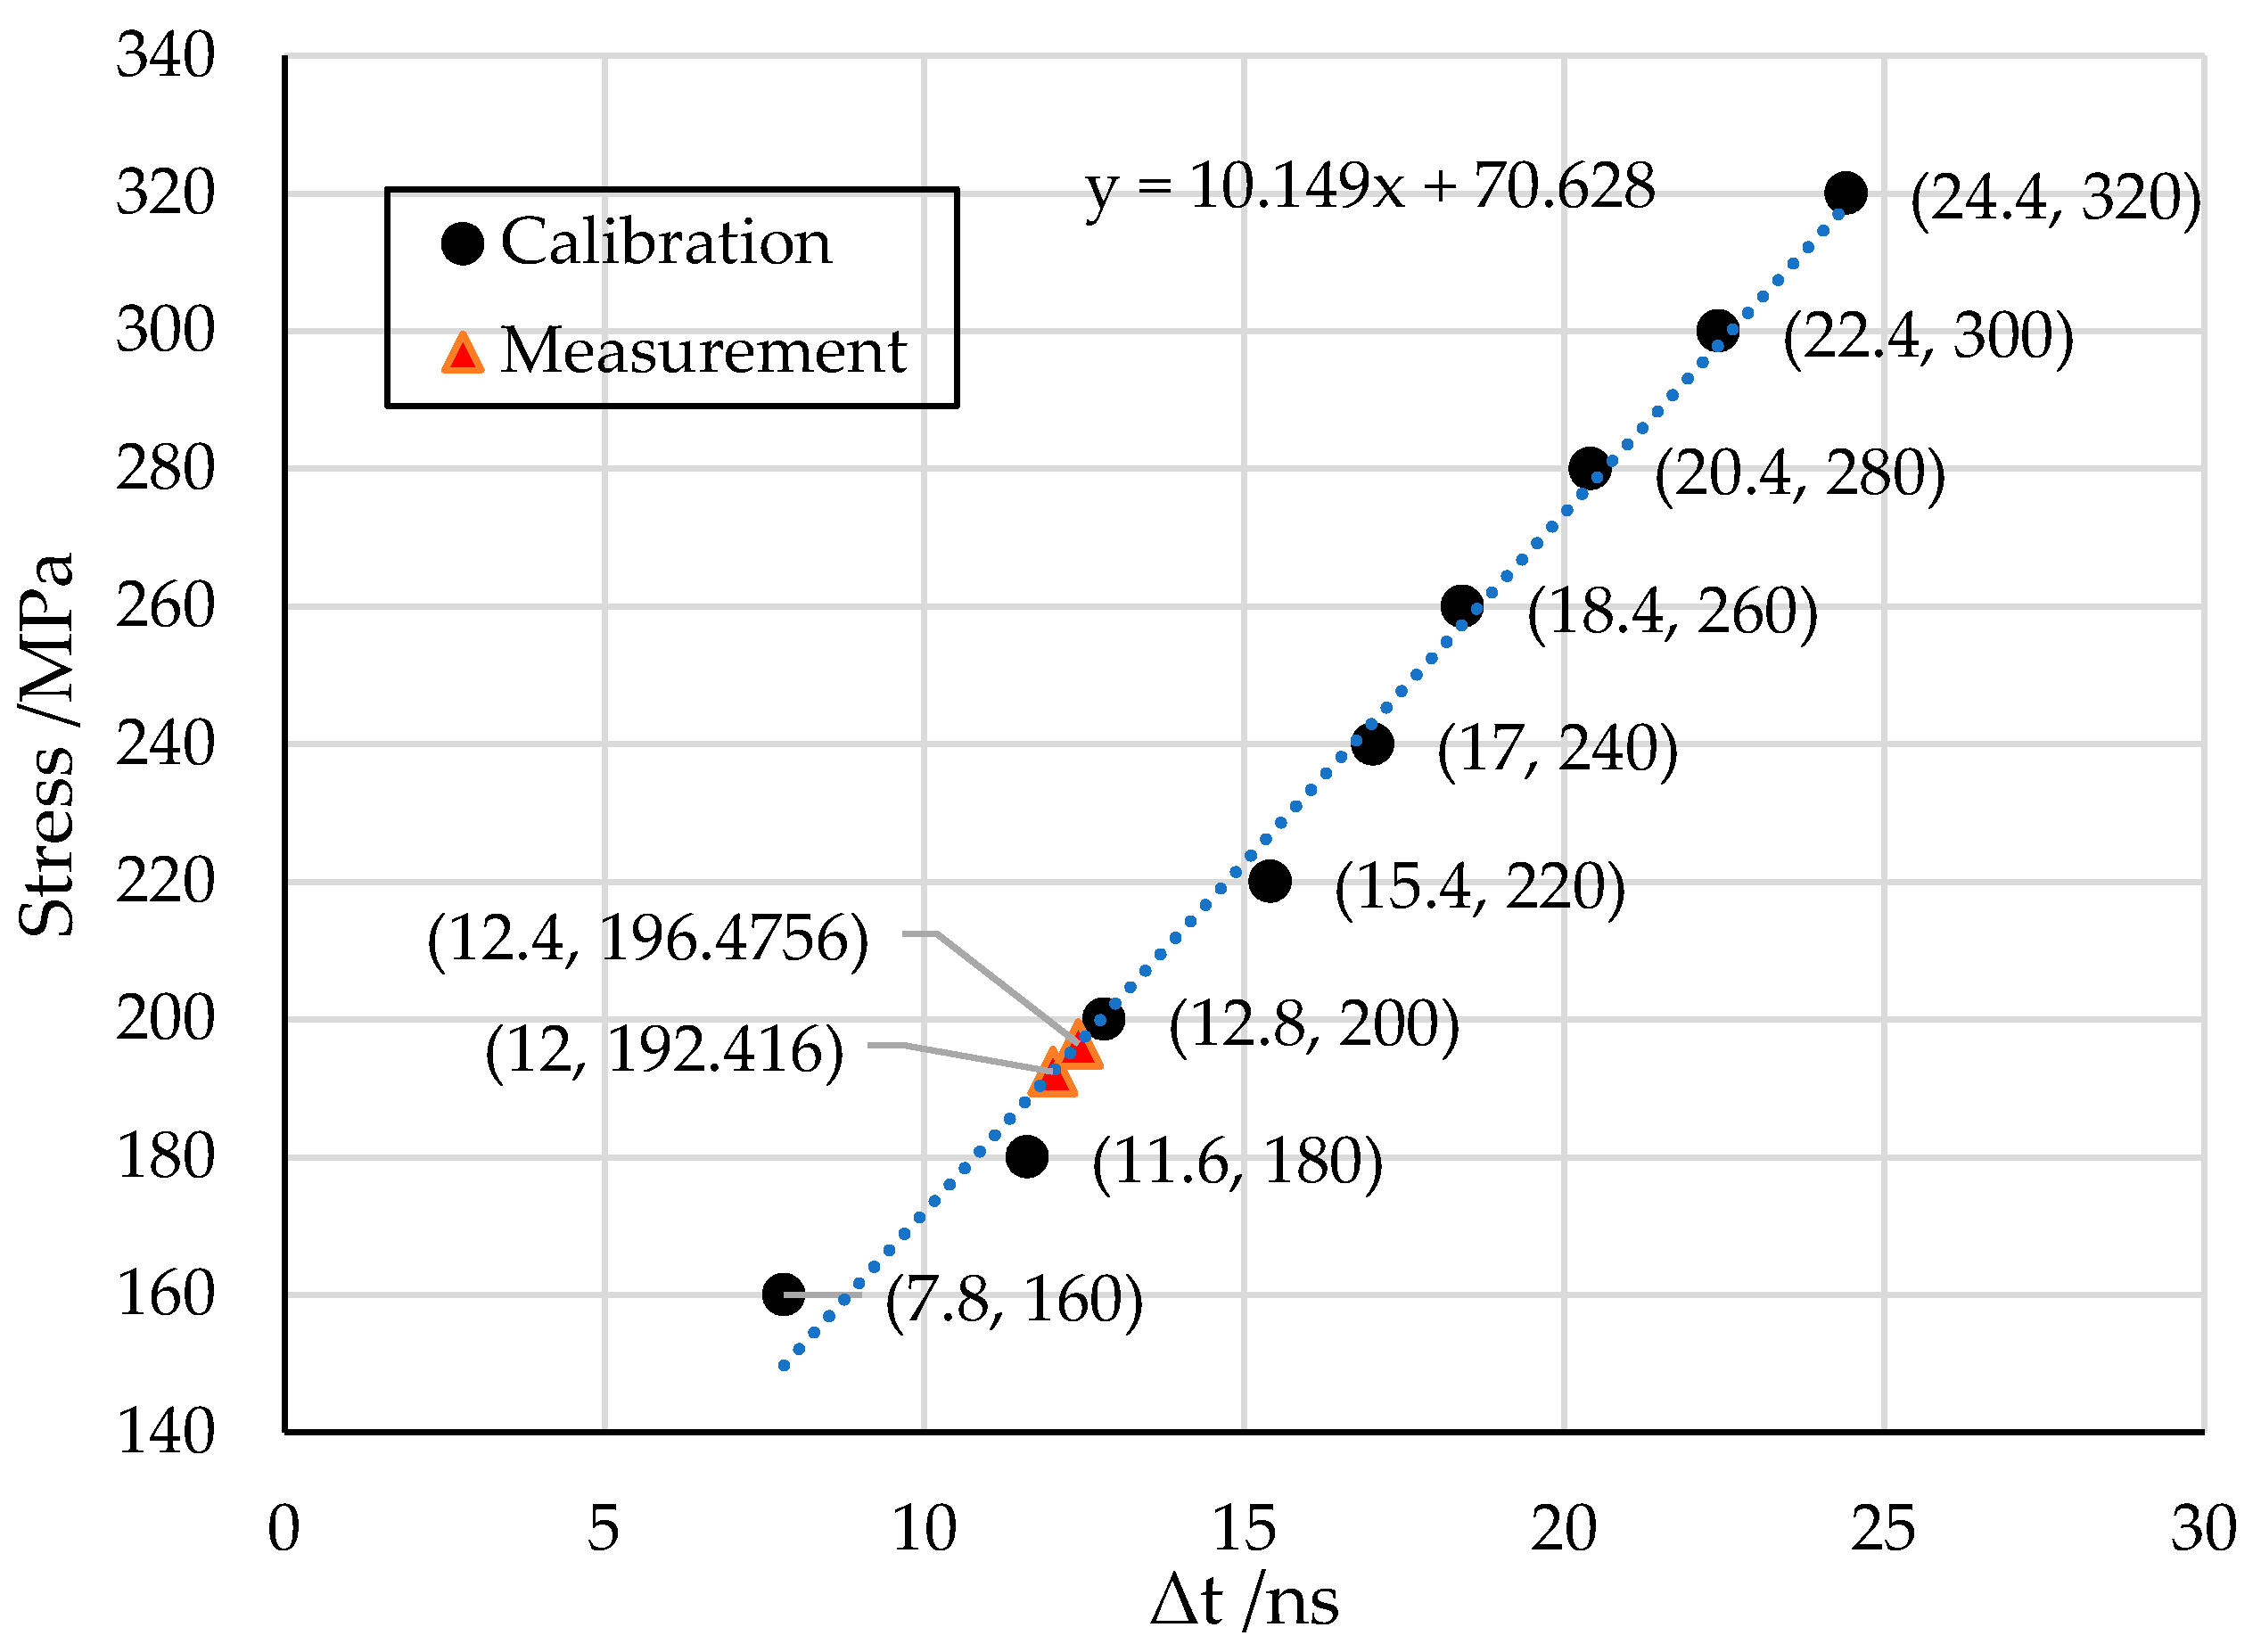
Figure 16.
The surface stress measurement for U75V rail steel tensile specimen by using (a) ultrasonic LCR wave method; and (b) X-ray method.
Figure 16.
The surface stress measurement for U75V rail steel tensile specimen by using (a) ultrasonic LCR wave method; and (b) X-ray method.
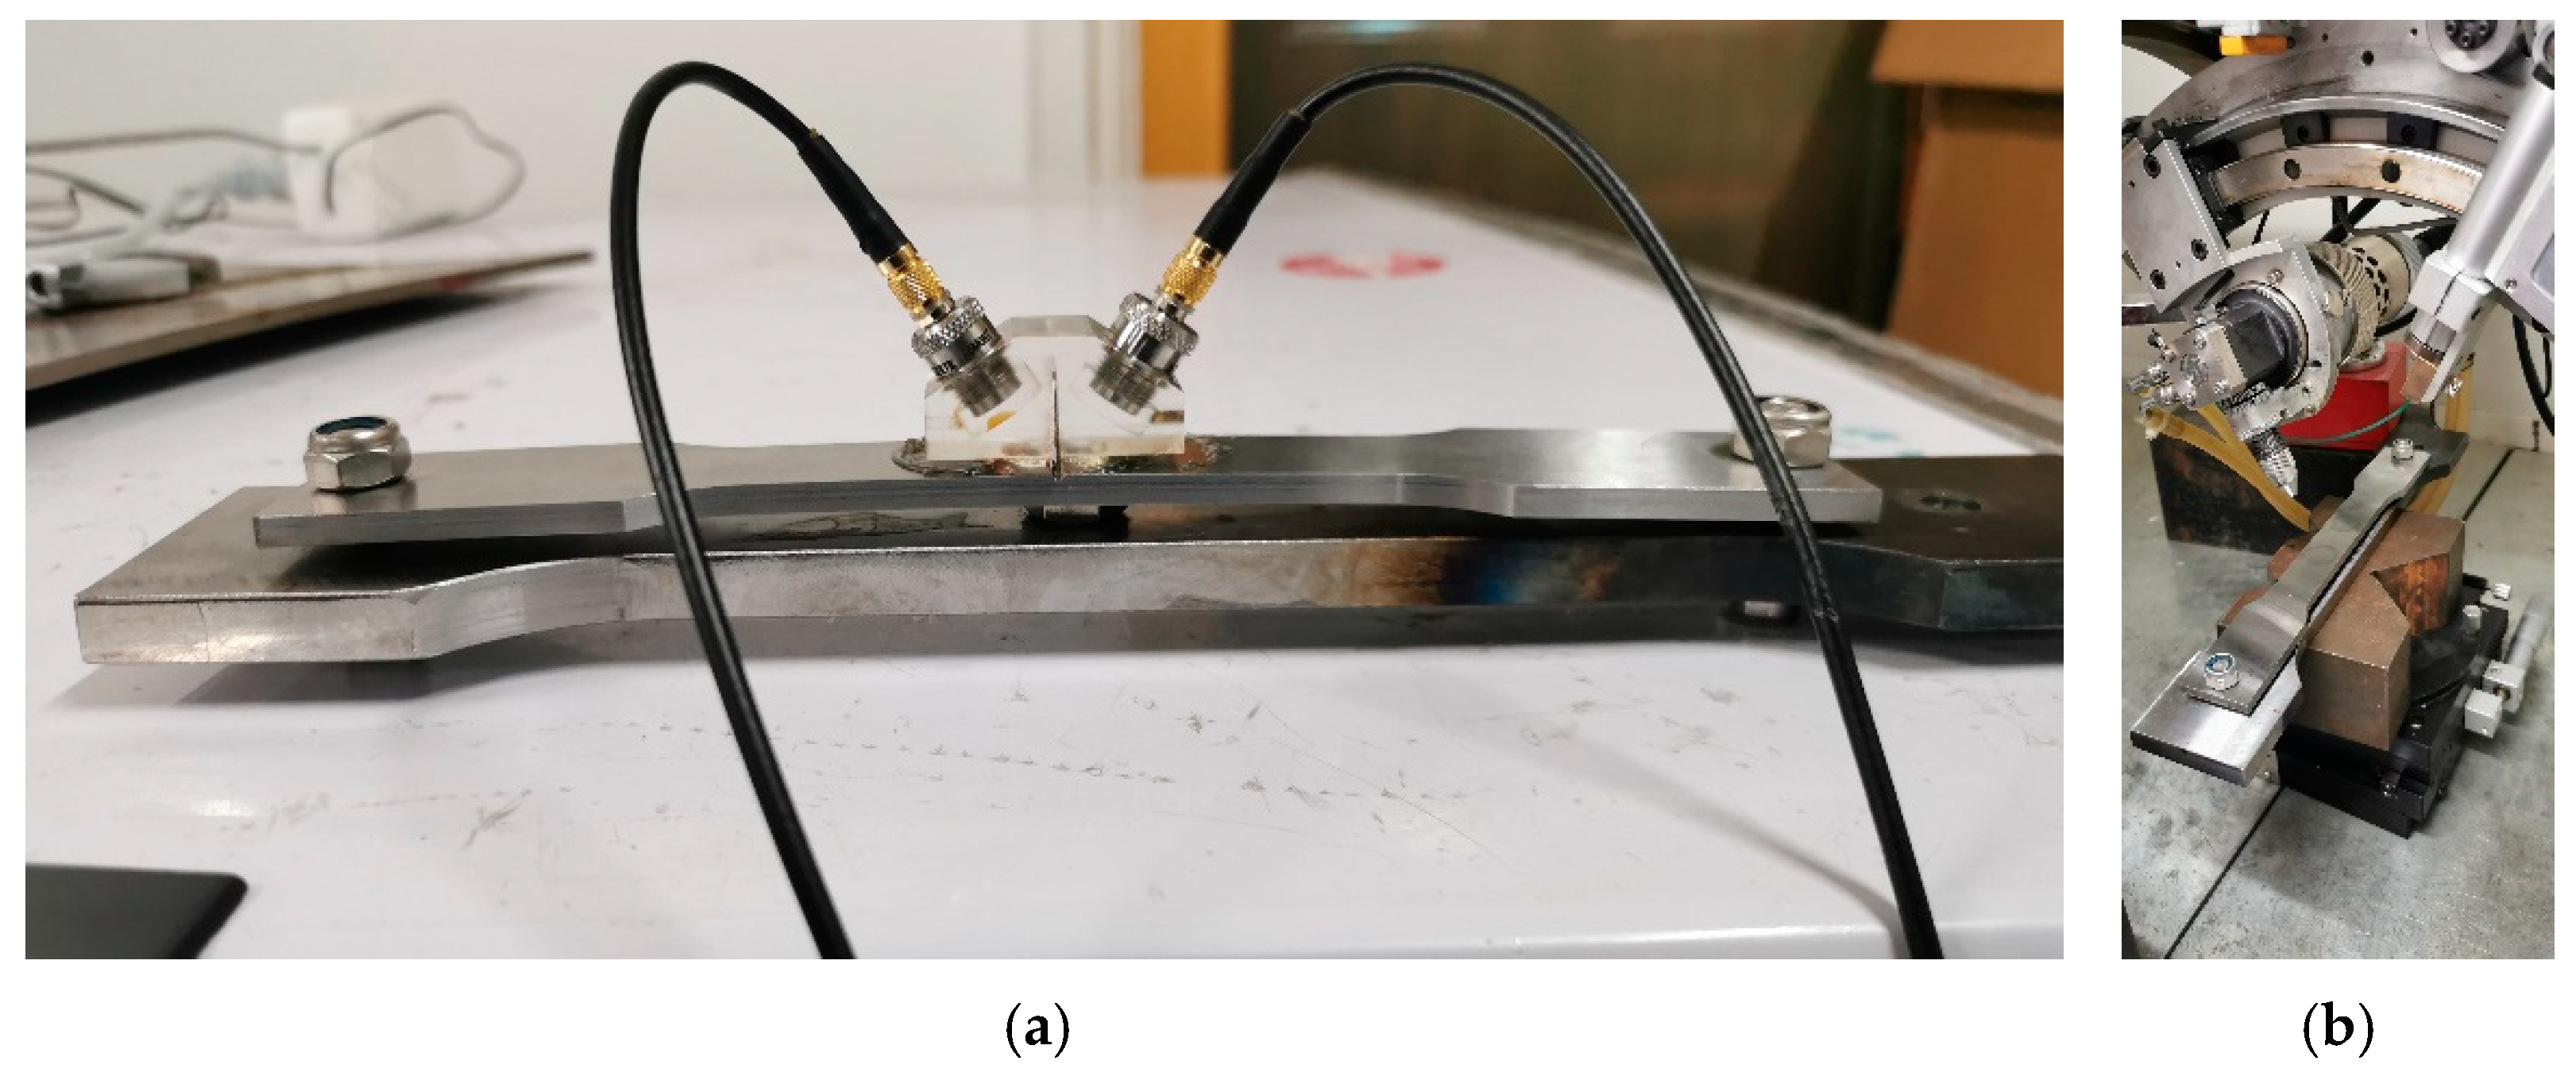
Figure 17.
The surface stress of U75V rail steel tensile specimen.


Table 1.
The denoising results of the traditional wavelet transform (WT), wavelet packet transform (WPT), lifting scheme wavelet transform (LSWT) and lifting scheme wavelet packet transform (LSWPT) methods.
Table 1.
The denoising results of the traditional wavelet transform (WT), wavelet packet transform (WPT), lifting scheme wavelet transform (LSWT) and lifting scheme wavelet packet transform (LSWPT) methods.
| Noise Signal | WT | WPT | LSWT | LSWPT | |||||
|---|---|---|---|---|---|---|---|---|---|
| S | H | S | H | S | H | S | H | ||
| RMSE | 0.0497 | 0.0039 | 0.0118 | 0.0038 | 0.0038 | 0.0042 | 0.0112 | 0.0035 | 0.0048 |
| SNR (dB) | −2.1253 | 20.0907 | 10.3482 | 20.2092 | 20.2092 | 19.3699 | 10.8017 | 20.1783 | 18.1509 |
| PRE(%) | 124.23 | 7.79 | 105.65 | 4.17 | 4.17 | 0.0556 | 137.74 | 4.25 | 9.33 |
| T (ms) | - | 139.158 | 136.494 | 280.520 | 281.082 | 72.372 | 76.977 | 167.685 | 180.542 |
Publisher’s Note: MDPI stays neutral with regard to jurisdictional claims in published maps and institutional affiliations. |
© 2021 by the authors. Licensee MDPI, Basel, Switzerland. This article is an open access article distributed under the terms and conditions of the Creative Commons Attribution (CC BY) license (https://creativecommons.org/licenses/by/4.0/).
Share and Cite
MDPI and ACS Style
Li, P.; Xu, C.; Pan, Q.; Lu, Y.; Li, S. Denoising of LCR Wave Signal of Residual Stress for Rail Surface Based on Lifting Scheme Wavelet Packet Transform. Coatings 2021, 11, 496. https://doi.org/10.3390/coatings11050496
AMA Style
Li P, Xu C, Pan Q, Lu Y, Li S. Denoising of LCR Wave Signal of Residual Stress for Rail Surface Based on Lifting Scheme Wavelet Packet Transform. Coatings. 2021; 11(5):496. https://doi.org/10.3390/coatings11050496
Chicago/Turabian StyleLi, Peilu, Chunguang Xu, Qinxue Pan, Yuren Lu, and Shuangyi Li. 2021. "Denoising of LCR Wave Signal of Residual Stress for Rail Surface Based on Lifting Scheme Wavelet Packet Transform" Coatings 11, no. 5: 496. https://doi.org/10.3390/coatings11050496
Note that from the first issue of 2016, this journal uses article numbers instead of page numbers. See further details here.