Article

Fabrication of Multifunctional SERS Platform Based on Ag NPs Self-Assembly Ag-AAO Nanoarray for Direct Determination of Pesticide Residues and Baicalein in Real Samples

1
Department of Biomedical Engineering, Chengde Medical University, Chengde 067000, China
2
College of Physics and Electronic Engineering, Hebei Normal University for Nationalities, Chengde 067000, China
3
School of Energy and Power Engineering, North University of China, Taiyuan 030051, China
4
College of Traditional Chinese Medicine, Chengde Medical University, Chengde 067000, China
5
State Key Laboratory of Materials Science & Technology and Key Laboratory for Microstructural Material Physics of Hebei Province, School of Science, Yanshan University, Qinhuangdao 066004, China
*
Authors to whom correspondence should be addressed.
Coatings 2021, 11(9), 1054; https://doi.org/10.3390/coatings11091054
Submission received: 3 August 2021 / Revised: 21 August 2021 / Accepted: 25 August 2021 / Published: 31 August 2021
(This article belongs to the Collection Advanced Surface Coating of Nanoparticles)

Abstract

:
Aiming at the shortcomings of high cost and time-consumption in traditional liquid chromatography, an effective surface enhanced Raman scattering (SERS)-based trace detection method has been proposed to quantitatively identify the active component of traditional Chinese medicine. In this paper, a high-performance and versatile SERS platform based on Ag nanoparticles (NPs) self-assembly Ag-anodized aluminium (Ag NPs-Ag-AAO) nanoarray was fabricated by controllable physico-chemical preparation technology. The results indicated that the electromagnetic field enhancement effect was sharply strengthened as Ag NPs assembled, and the experimental enhancement factor (EEF) value was calculated to be 1.0083 × 10⁶. This novel Ag NPs-Ag-AAO nanoarray with substantial “hot spots” exhibited high SERS signal reproducibility, with the relative standard deviation (RSD) value at less than 2.23%. More importantly, this SERS platform was applied to detect active component Baicalein in Scutellaria baicalensis, and the limit of detection (LOD) was located at 10 fg/mL. Therefore, this Ag NPs-Ag-AAO nanoarray with high sensitivity, strong Raman signal reproducibility and reliable practicability has broad application prospects in the rapid detection of trace substances in the active components of traditional Chinese medicine and is expected to be popularized.

1. Introduction

In visible and near-infrared light bands, noble metal (Cu, Ag, Au and Pt) composite nanoarrays can stimulate a strong surface plasmon resonance (SPR) effect. This effect improves the light scattering conversion efficiency of nonlinear optical processes that are sensitive to electromagnetic field intensity changes, of which the most representative one is surface enhanced Raman scattering (SERS) technology [1,2]. Based on the advantages of normal Raman detection, SERS technology effectively improves the intensity and sensitivity of Raman signal, which can realize single molecule detection [3]. At the same time, it overcomes the problem that Raman signal is easily interfered by fluorescence signal; therefore, it is widely used in surface science, food safety, public safety and biomedical detection, among other fields [4,5,6].
Since the SERS phenomenon was discovered in 1974 [7], researchers have been committed to revealing its enhancement mechanism. During this period, more than a dozen theoretical models have been put forward, and these numerous enhancement mechanisms can be mainly classified into two categories: electromagnetic enhancement (EM) mechanisms and chemical enhancement (CM) mechanisms [8]. It is generally believed that the EM mechanism contributed the most to the SERS enhanced effect. In recent years, the SPR model has been widely accepted to explain the EM mechanism [9]. According to the SPR model theory, when the incident light irradiates the rough surface of noble metal nanostructures, the free electrons will oscillate collectively at the interface between the noble metal and dielectric. If the frequency of incident light is the same as the natural frequency of free electron oscillation, the SPR effect will occur, which makes the electromagnetic field intensity of the noble metal surface significantly enhanced. When the probe molecule is in the electromagnetic field enhancement region, the Raman scattering cross section of the probe molecule will be significantly enhanced, and the obtained spectrum is the SERS spectrum of the probe molecule [10]. The CM mechanism suggests that the SERS phenomenon is caused by the change in the polarizability of the probe molecules adsorbed on the rough noble metal nanostructures. In CM mechanisms, the charge transfer model is widely accepted [11]. This charge transfer process will produce a resonance-like effect, which leads to an increase in the polarization of the probe molecule and the Raman scattering cross section, resulting in the enhancement of the Raman scattering signal intensity [12]. In most SERS systems, the mechanisms of EM and CM exist simultaneously and both contribute to the enhancement of the SERS effect. Theoretical and experimental studies have also confirmed that EM plays a major role in Raman signal enhancement (104–1012), while chemical enhancement usually contributes about 101–102 [13].
With the development of nanotechnology, researchers have developed a large number of noble metal nanostructures with different functions. The key to the vigorous development of SERS technology is the low cost and simple preparation technology. Because SERS technology can characterize the molecular information of the sample at the nanoscale and the highly sensitive and stable SERS active substrate can combine the molecular information with the plasmon characteristics of noble metal nanostructures, researchers prefer Au, Ag, Cu and other noble metal nanostructures, as these noble metals have large optical responses in the visible range [14,15,16]. Through reactive ion etching and ion sputtering technology, Prof. Liu prepared a kind of flexible and ordered Au nanocap-like SERS active substrate [17]. This flexible SERS substrate with periodic nanostructures has high sensitivity and reproducibility for the detection of organic molecules. Prof. Yang’s team prepared a kind of bioinspired Ag brochosomes-hollow microscale particle with submicroscale pits-having broadband and omnidirectional SERS performance [18]. In 2019, this group assembled the double layer polyethylene microspheres colloidal crystal template by the self-assembly method and prepared a type of highly uniform volume enhanced Raman scattering (VERS) substrate by combining the thermal evaporation and reverse mode process [19]. Because the VERS substrate was composed of a microbowl and a hollow nanocone at the bottom of the bowl, the strong electromagnetic field was not only generated on the surface of the microbowl but also inside the hollow nanocone. Therefore, compared with the conventional SERS substrate, this periodic and regular geometry can achieve the highly reproducible and reliable detection of viruses and other macromolecular substances. In terms of SERS enhancement performance, Ag nanomaterials have a large optical response in the visible light range, a higher efficiency of enhanced Raman scattering and a simple geometric modulation structure, so they have been widely used in SERS detection, such as for graphene oxide film dip-coated Ag nanoarrays [20], Ag NPs-decorated Au nanorod arrays [21], Ag NPs-poly(acrylic acid-stat-acrylamide)-block-polystyrene nano-objects [22] and so on. At the same time, many research teams have developed active SERS substrates by using biomaterials as templates, such as Ag/Razor Clam [23], GO/Ag/Lotus leaf [24] and GO/Ag/cicada wing [25]. The surface of these biomaterials has a natural hierarchical structure, which not only provides abundant electromagnetic “hot spots” but also shows super-hydrophobicity for the enrichment of analytes, thus obtaining strong electromagnetic field enhancement and high detection sensitivity.
However, these noble metal nanostructured SERS substrates also have some disadvantages. For example, the contacts of noble metal nanoparticles with the molecules and environmental media will lead to an unnecessary charge transfer, which will affect the Raman detection results. In addition, the proportion of “hot spots” in the total adsorption surface area of noble metal nanoparticles is very small (<1%) [26], which leads to poor statistical results of ultra sensitive detection. Some SERS substrates also have defects, such as complex manufacturing process, high equipment requirements, high preparation cost and low output, which greatly limit the application of regular noble metal nanostructures in the field of SERS [27].
Aiming at the above defects of SERS preparation technology, in this work, we first prepared an AAO template by anodizing high-purity aluminum foil after high-temperature annealing and chemical electropolishing. Then, Ag nanopillar arrays were deposited on the AAO template by magnetron sputtering to construct Ag-AAO nanostructures. The surface of this nanoarray was covered with sub−10 nm nanogaps, which can excite uniform and high intensity electromagnetic enhancement “hot spots”. Due to the existence of large-scale nanocavities on the Ag-AAO nanoarray, Ag NPs with a diameter of 30 nm were assembled on the Ag-AAO (Ag NPs-Ag-AAO) nanoarray by the oil-water separation self-assembly method, which can efficiently improve the electromagnetic field enhancement performance. The schematic diagram of the preparation process was shown in Figure 1. More importantly, combined with the rapid solvent pretreatment method, Ag NPs-Ag-AAO SERS substrate was used for the rapid analysis of acephate pesticide residues on the surface of Scutellaria baicalensis, which improved the efficient and time-saving Raman detection method of pesticide residues. Meanwhile, the Ag NPs-Ag-AAO SERS platform can quickly and accurately detect Baicalein under neutral pH conditions with a LOD of 10 fg/mL, which is expected to open up a new method for the identification of traditional Chinese medicine and biomedical sensing.

2. Experimental

2.1. Chemicals and Materials

The silver target (diameter: 60.0 mm, thickness: 2.0 mm, purity: 99.99%) and high purity aluminum foil (thickness: 0.25 mm, purity: 99.999%) were purchased from Nanchang Hanchen New Materials Technology Co., Ltd., Nanchang, China. The 4-aminothiophenol, Methylene blue (MB), oxalic acid, perchloric acid, acephate, crystal violet (CV) and anhydrous ethanol were all analytical grade and purchased from J & K Scientific Ltd., Beijing, China. The N-Hexane was obtained from the Damao Chemical Reagent Factory in Tianjin, China. Deionized water (18.25 MΩ) was used to prepare the solutions throughout the experiment.

2.2. Sample Preparation

2.2.1. Preparation of Porous AAO Template

First of all, we assembled a thermostatic electrolytic cell to prepare a porous AAO template. The electrolyte was an oxalic acid solution with a concentration of 0.3 M, and the schematic diagram of the preparation device is shown in Figure 2. First, the high purity aluminum foil was annealed in an annealing furnace at 400 °C for 2 h and then electropolished in the mixture of perchloric acid and anhydrous ethanol (volume ratio 1:4) for 5 min. After high temperature annealing and electro-chemical polishing, the high purity aluminum foil was anodized. Then, the polished aluminum foil was cleaned with acetone and deionized water. After natural drying, the aluminum foil was placed in the thermostatic electrolytic cell. The oxidation voltage was between 40 V, the oxidation time was controlled within 300 s and the constant temperature was 5 °C. Finally, the AAO nanofilm can be obtained.

2.2.2. Preparation of Ag-AAO Nanoarray

The Ag-AAO nanoarray was prepared by high vacuum magnetron sputtering (Radio frequency, Shenyang Scientific Instruments Co., Ltd., Shenyang, China) and an ion beam composite thin film deposition system (FJL560, Shenyang Scientific Instruments Co., Ltd., Shenyang, China). First, the AAO template was fixed in the sputtering chamber. Before the sputtering, the plasma cleaning was carried out in the sputtering chamber with 5 sccm argon that flowed for 10 min. As the intensity of the pressure in the sputtering chamber reached 3.5 × 10⁻³ Pa, the sputtering began. When the sputtering power was controlled at 14 W and the MFC2 value in the flow indicator reached 50, the sputtering chamber built up luminance successfully. By controlling the sputtering time and sputtering power, we were able to obtain a series of Ag-AAO nanoarrays with different morphologies.

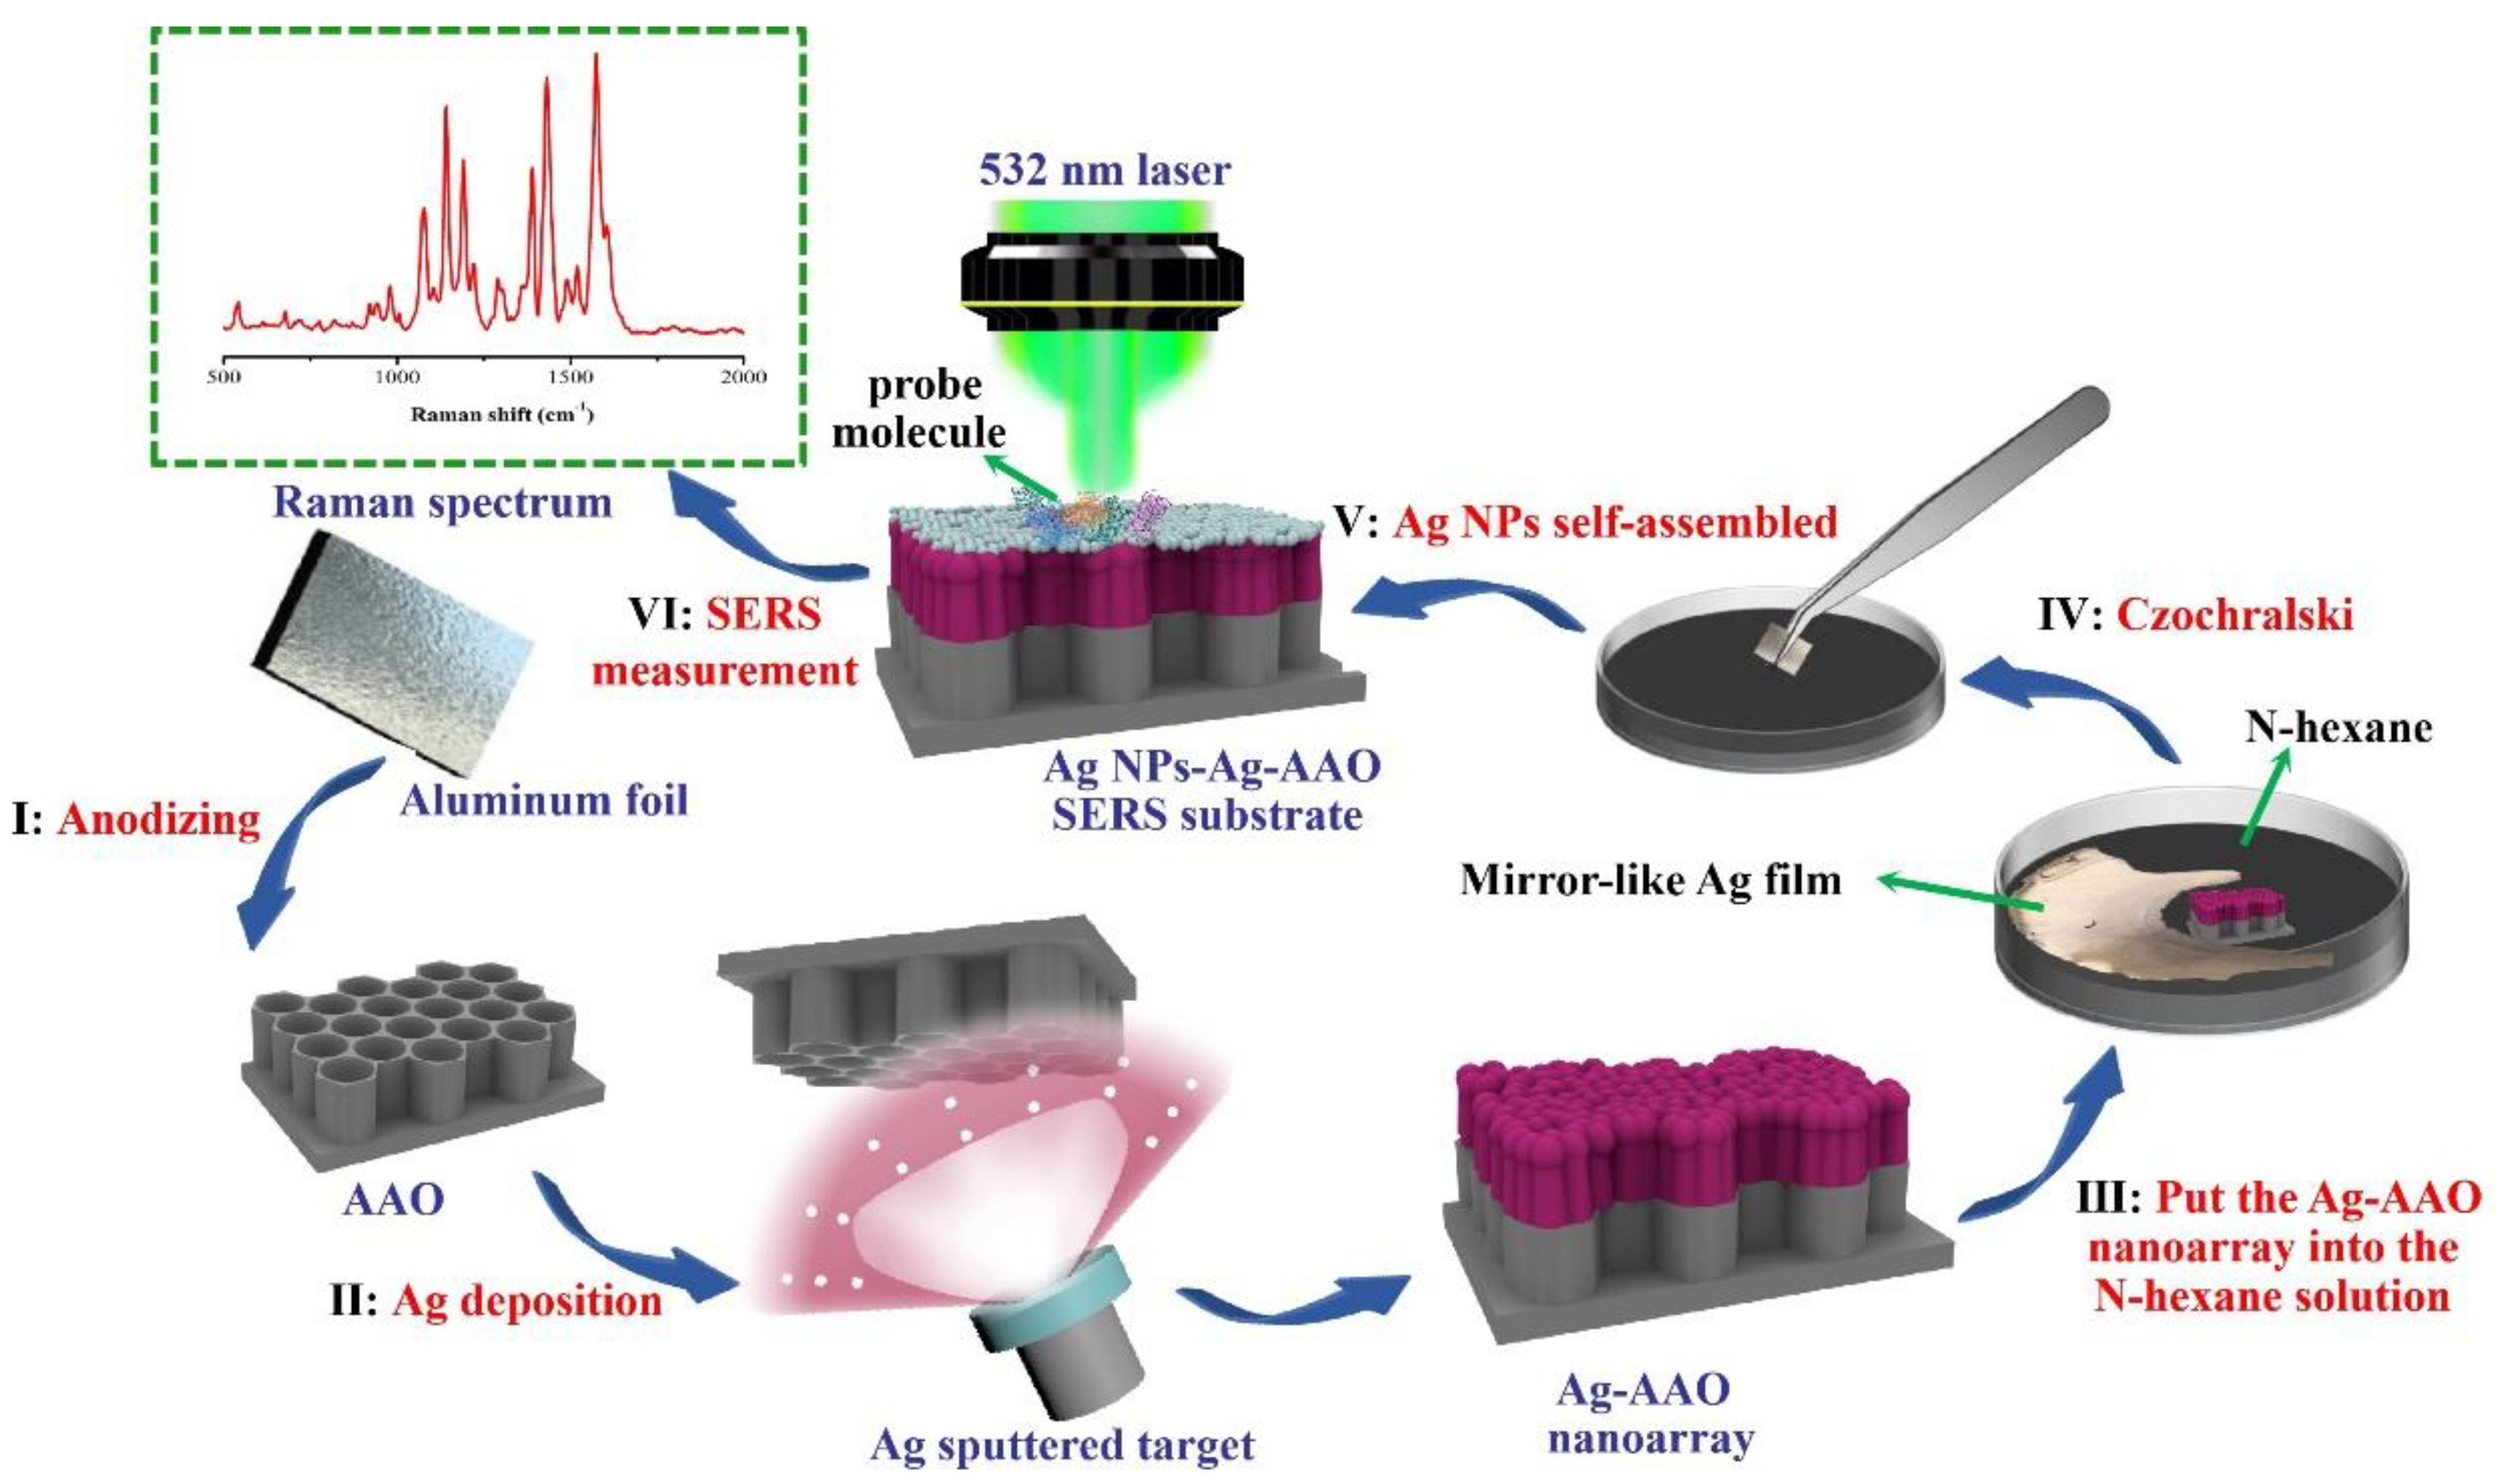
2.2.3. Preparation of Ag NPs-Ag-AAO Nanoarray by Oil-Water Separation Self-Assembly Method

First, we poured 1/3 volume of N-hexane into a clean petri dish. Then, the concentrated Ag sol was slowly added to the N-hexane. The Ag sol (sphere) was evenly distributed in the upper layer of the N-hexane. In this paper, the classic Lee & Meise method [28] was used to prepare Ag sol. Then, the anhydrous ethanol was taken with a pipette and dropped on the mixture interface of the Ag sol and N-hexane. At this time, the Ag NPs would be adsorbed to the interface of the N-hexane. Under the induction of ethanol, the adsorbed Ag NPs would gradually increase and form a mirror-like Ag film, as shown in Figure 1. The prepared Ag-AAO nanoarray was placed under the mirror-like Ag film with a tweezer and then lifted upward. The Ag film would remain on the Ag-AAO nanoarray, and a dense layer of Ag NPs formed on its surface. After natural drying, we used deionized water to clean the substrate three times to eliminate the influence of N-hexane and ethanol on the experimental results. Lastly, the composite structure of the Ag NPs-Ag-AAO nanoarray was constructed. What needs illustration is that the terminology to describe the samples of Ag-AAO fabricated at the sputtering time of x min was Agx-AAO substrate.

2.3. Characterization and SERS Measurements

The morphology of the prepared AAO, Ag-AAO and Ag NPs-Ag-AAO were characterized by field emission scanning electron microscopy (FE-SEM) (SU8220, Hitachi of Japan, Tokyo, Japan). The morphology and the size of the Ag NPs were characterized by the Transmission Electron Microscope (TEM) (HT7700, High-Technologies Corp., Ibaraki, Japan). UV-vis absorption spectra were obtained by the Shimadzu UV-2550 system (Shimadzu (China) Co., Ltd., Shanghai, China). The Raman spectra in this paper were all obtained by a Raman system (Horiba LabRAM HR800, HORIBA Jobin Yvon, Paris, France). During the SERS measurements, the laser power was 0.1 W, the laser wavelength was set at 532 nm, the objective lens of × 50 was used, the numerical aperture was 0.75, the acquisition time of each Raman spectrum was 10 s and the spectral resolution was 1 cm−1. Each probe molecule with a different concentration was prepared with deionized water by means of the dilution method with a factor of 10.

2.4. Electromagnetic Field Simulations

Because the theory of Mie scattering is not applicable to the aggregation state of noble metal nanoparticles, nor is it applicable to the complex shape of nanostructures, the current commonly used method is the three-dimensional finite-difference time-domain (3D-FDTD) simulation method [29]. In this paper, the 3D-FDTD method was used to simulate the interaction between Ag nanostructures and electromagnetic fields, including the interaction between the irregular shape of Ag nanofilm and the size of Ag NPs with an excitation wave. The Ag nanomaterials studied in this paper belong to the dispersive materials, and the relative dielectric constant varies with frequency. According to the modified Drude model, the properties of the Ag nanomaterials were processed, and their relative dielectric constant can be expressed as:
ε ( ω ) = ε + ε s ε 1 + i ω τ + σ i ω ε 0 = ε r + i ε i
By expanding the Equation (1), the real and imaginary parts can be expressed as:
ε r = ε + ε s ε 1 + ω 2 τ 2
ε i = ( ε s ε ) ω τ 1 + ω 2 τ 2 + σ ω ε 0
where the εs is the static relative permittivity, ε represents the infinite high frequency relative permittivity, τ is the conductivity and σ is the relaxation time. In order to ensure the reliability of the simulation results, in this paper, the parameters of Ag can refer to Gai’s theoretical research on the modified Drude model of wide wave bands [30].

3. Results and Discussion

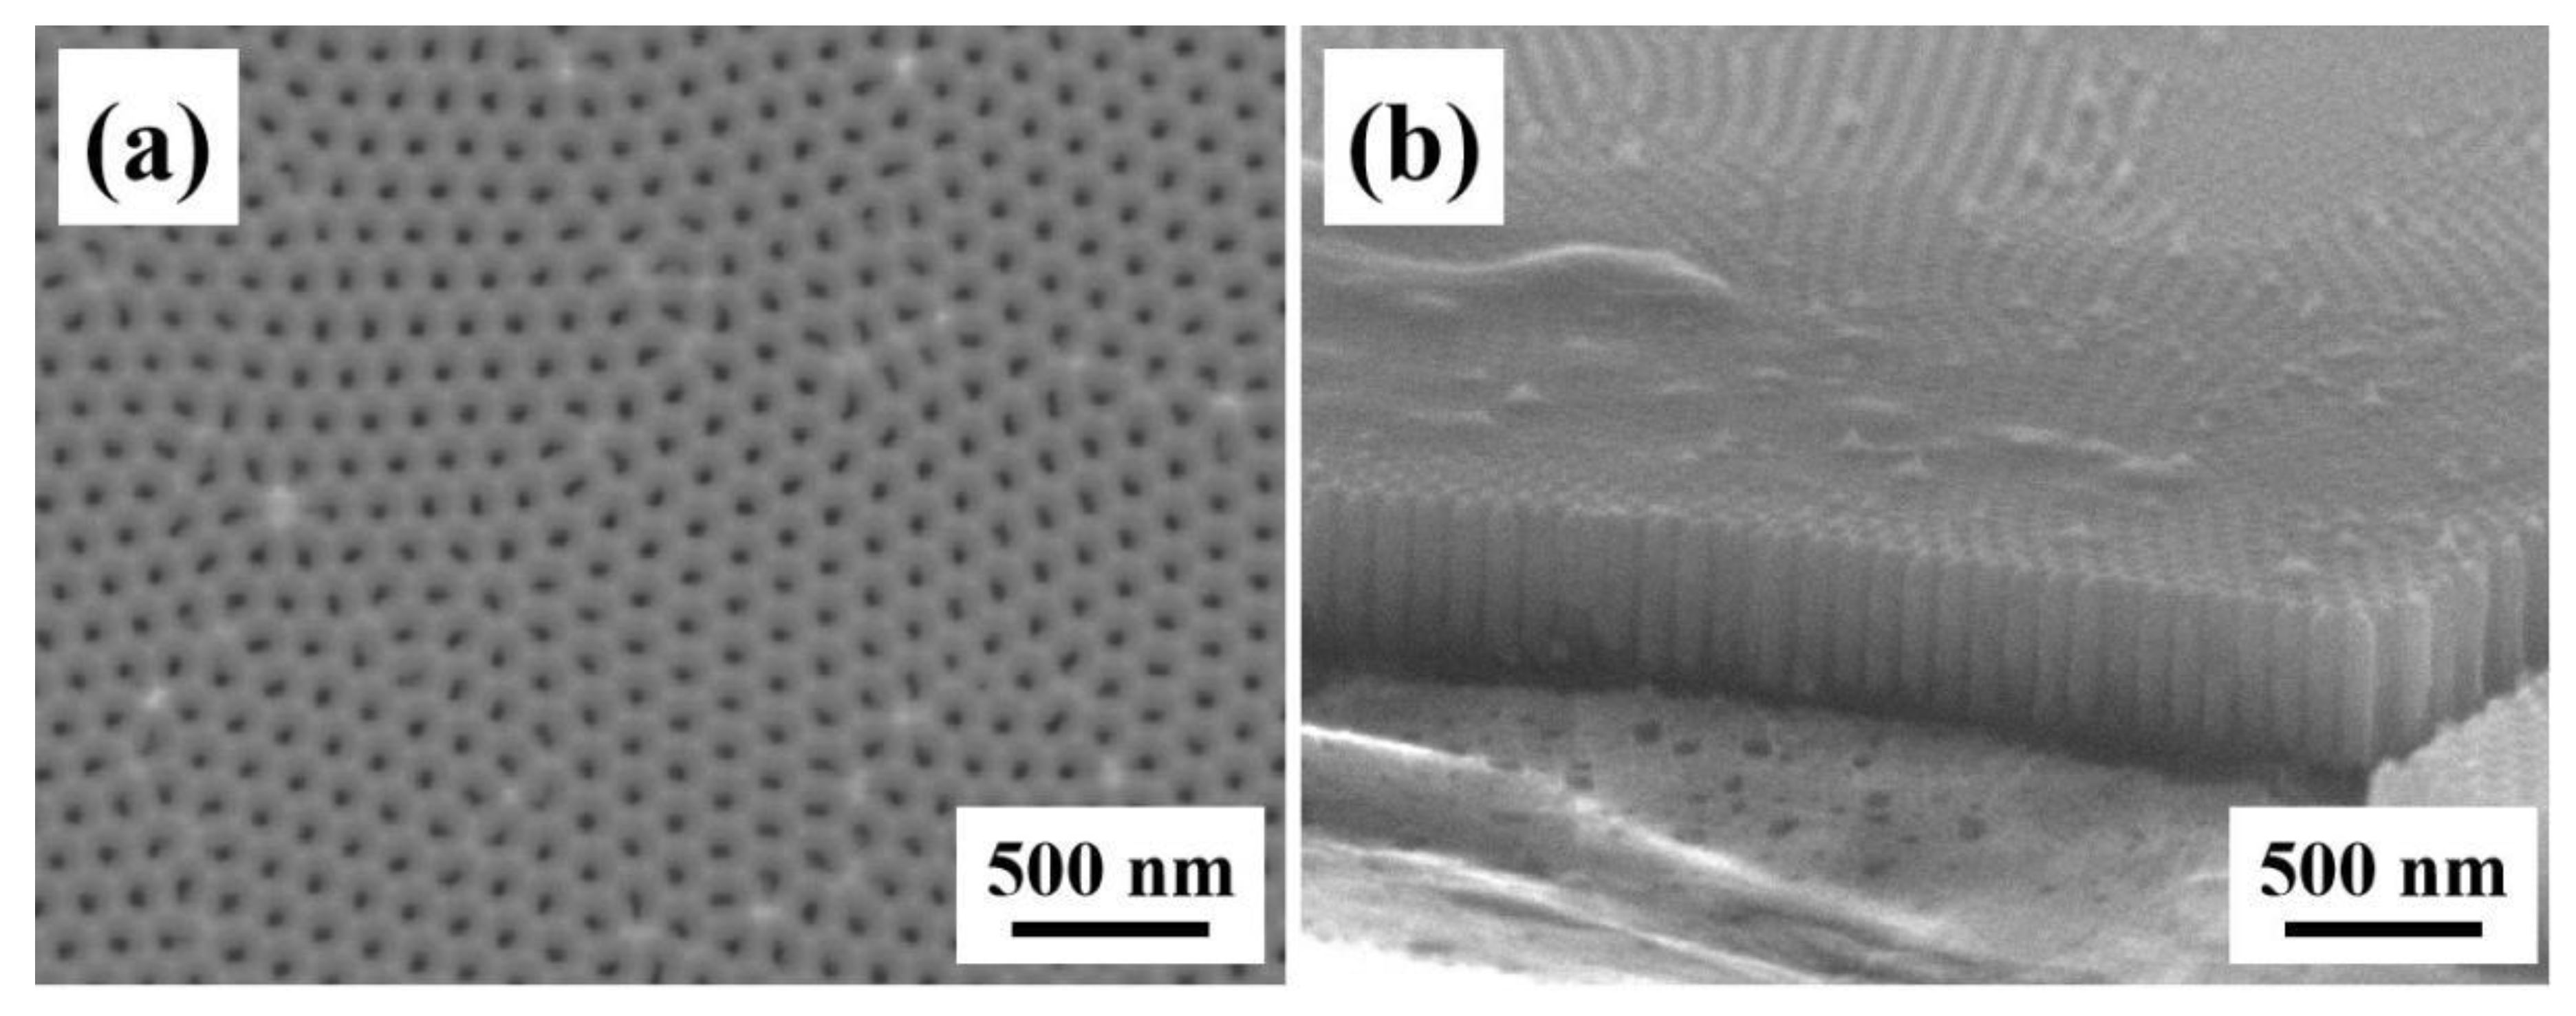
3.1. Morphology Characterization of the AAO Nanotemplate

AAO has been widely used in the preparation of SERS substrates because of its highly uniform nanopore structure. Once the structure is combined with the Ag nanomaterial, the SPR effect will be generated on the edge of the nanopore, thus ensuring the formation of the high density “hot spot”. On the other hand, the three-dimensional ordered nanopore structure can also effectively expand the specific surface area of adsorbed analyte molecules, which is more conducive to the regulation of electromagnetic enhanced “hot spots”, and then optimize the SERS performance of regular nanoarrays. Figure 3a shows the top-view FE-SEM images of the as-prepared AAO nanotemplate. The large-scale nanoporous array was formed on the surface of the AAO nanotemplate with high uniformity and periodicity. The diameter of the nanopore was 50 ± 3 nm and the nanospace was about 140 ± 2 nm. Figure 3b exhibits the cross-section view FE-SEM image of AAO. We can observe that the single-channel nanopores on the surface of AAO were highly homogeneous, with a length of 400 ± 5 nm.

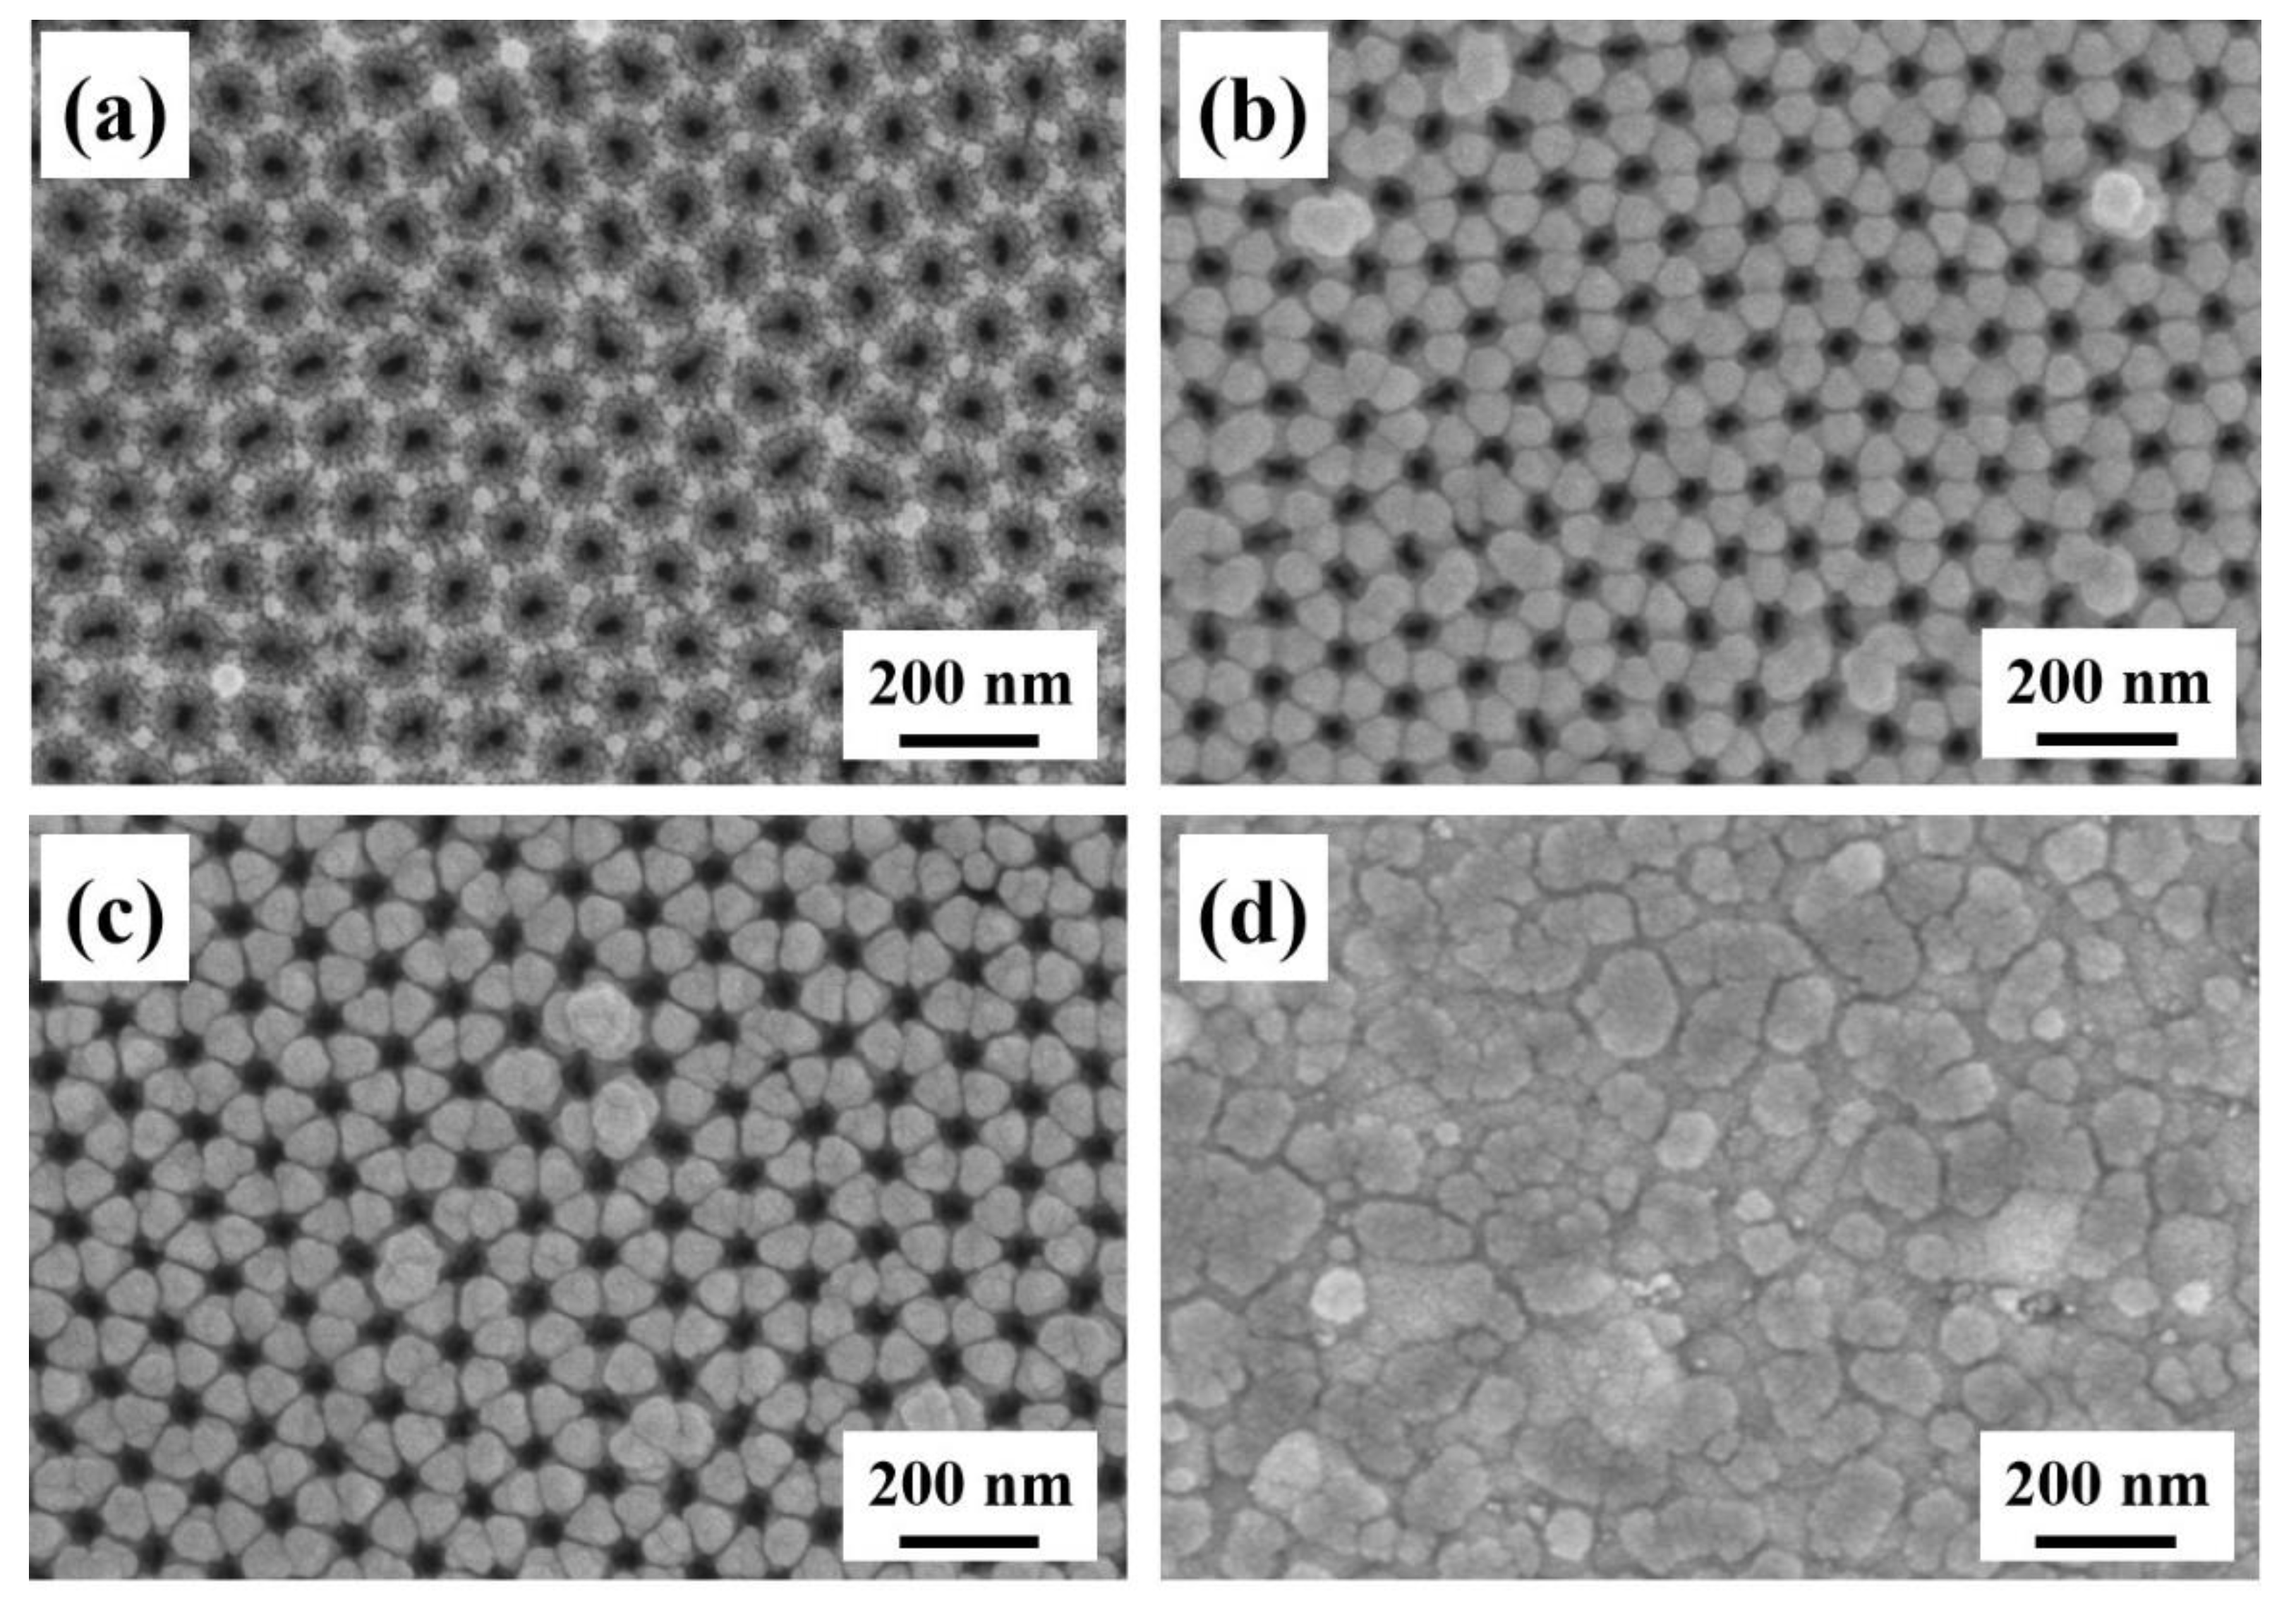
3.2. Nanomorphology of the Ag-AAO Nanoarrays and 3D-FDTD Simulations

According to the previous research [31], we concluded that the magnetron sputtering technology has the advantages of a fast deposition rate, high purity, good uniformity and strong controllability. By controlling the key parameters of sputtering time and sputtering power, we regulated the enhancement effect of the electromagnetic field, which depended on the distribution of “hot spots” in the nanogaps. The FE-SEM images of the Ag-AAO nanoarrays with different sputtering times (and the same sputtering power) were displayed in Figure 4a–d. Because the AAO prepared by anodization was highly homogeneous, the Ag-AAO nanoarrays were also highly uniform after sputtering Ag nanofilms. When the sputtering time was controlled at 10 min, the Ag nanofilms began to strictly grow at the edges of the AAO nanopores. With the increase in sputtering time, the regular Ag nanofilms became thicker and thicker. As shown in Figure 4c, the six-petal nanoflower-like nanostructure appeared. The average length of the nanopetal was 55 ± 3 nm and the average diameter of the nanopore was 40 ± 2 nm. Therefore, these rough six-petal flower-like nanostructures and nanopores could stimulate the potential SPR effect. More importantly, the average size of the nanogap between the nanopetals was less than 10 nm, resulting in a strong SPR coupling effect. Due to the regular distribution of these nanogaps, the Ag20-AAO (sputtering time was 20 min) nanoarrays can stimulate a uniform SPR effect and produce high-intensity electromagnetic “hot spots”. When the sputtering time was further extended to 25 min, as shown in Figure 4d, the regular six-petal flower-like nanostructure disappeared, and the nanogaps, which were less than 10 nm, were gradually filled by the sputtered Ag atoms. Therefore, the Ag25-AAO (sputtering time was 20 min) nanoarray presented irregular island-like nanostructures. In this case, the SPR coupling effect was reduced, which led to the decrease of SERS signal strength.
The compositional distribution of the Ag20-AAO nanoarray was further investigated using energy dispersive X-ray spectroscopy (EDX) (Hitachi of Japan, Tokyo, Japan). Overlay maps of Ag and Al EDX are shown in Figure 5a with a clear separation and uniform distribution, which confirmed the Ag-coated AAO nanostructure. The cross-section view FE-SEM image of the Ag20-AAO nanoarray was displayed in Figure 5b. We can see that the as-sputtered Ag flower-like nanostructures consisted of a nanopillar roughly 100 ± 6 nm in height, which tended to be vertically oriented and uniformly distributed on the AAO surface.
According to the geometric configuration of the Ag20-AAO nanoarray in Figure 4c and Figure 5b, we simulated the electromagnetic field intensity distribution near the Ag20-AAO nanostructure. Figure 5c was the Ag20-AAO structural model, in which the top diameter of the Ag nanopillar was 55 nm and the height of the nanopillar was 150 nm. The parameters of the simulation have been described in detail in Section 2.4. The continuous sinusoid laser with a wavelength of 532 nm was chosen as the incident light in our simulation, and the laser perpendicularly propagated into the model with the polarization direction of E. Figure 5d,e shows the electromagnetic field simulation results from the x-y plane and x-z plane. There were dense nanogaps in the Ag20-AAO model, which formed multi-level and uniform “hot spots” with obvious local electromagnetic field enhancement. The simulation results of the Ag20-AAO model showed that the maximum value of the local electromagnetic field was 42.91 V m−1. According to the following Equation (4) [32]:
G S E R S = | E l o c ( ω ) E i n c ( ω ) | 4
where the Eloc(ω) and Einc(ω) are the E and E0 in the 3D-FDTD calculations, respectively. Therefore, the theoretical enhancement factor (TEF1) value was 3.39 × 10⁶.
In an effort to improve the electromagnetic field enhancement performance of the Ag20-AAO SERS substrate, the Ag NPs were assembled onto the Ag20-AAO surface by the oil-water separation self-assembly method. The TEM image of the Ag NPs with a high magnification in Figure 6a revealed that a nanoparticle count obtained from different regions of the sample confirmed the presence of essentially monodispersed Ag NPs adopting a spherical-like morphology with an average diameter of 30 nm. The FE-SEM image of the Ag NPs modified Ag20-AAO SERS substrate prepared by the oil-water separation self-assembly method is shown in Figure 6b. Ag NPs with a size of 30 nm were closely packed on the surface of the Ag20-AAO nanoarray and formed a dense Ag NPs nanolayer, as shown in the Figure 6b1. In order to further investigate the electromagnetic field enhancement characteristics of the Ag NPs30-Ag20-AAO (30 nm Ag NPs self-assembly Ag20-AAO) nanoarray, we constructed the Ag NPs30-Ag20-AAO structure model, as shown in Figure 6c. The intensity distribution of the electromagnetic field near the Ag NPs30-Ag20-AAO model shown in Figure 6d,e indicates that there were strong electromagnetic fields in the whole space. Especially, high electromagnetic field intensity was confined and enhanced at the inter-Ag NPs nanogaps. Meanwhile, the electromagnetic field intensity at the Ag NPs-Ag nanofilms junctions can also be observed. According to the Equation (4), the calculated TEF2 was 2.847 × 10⁹, which was 839.8 times high than that of the Ag20-AAO model. With the improvement of the nanomorphology of the Ag20-AAO nanoarray, the Ag NPs can effectively fill the cavity between the Ag nanopillar, resulting in the formation of abundant sub−10 nm nanogaps. When the Ag NPs30-Ag20-AAO model was excited by the incident light, the effective Raman cross section increased and the collective resonance effect of the electrons enhanced. Therefore, the electromagnetic field intensity increased at the sub−10 nm gaps.

3.3. SERS Performances of the Ag NPs30-Ag20-AAO Substrate

Referring to the wavelength position of the absorption peak in the UV-vis absorption spectrum, the optimal excitation wavelength in Raman measurement can be determined. Consequently, the best SERS intensity can be obtained by choosing the best excitation wavelength [33,34]. Figure 7a shows the UV-vis absorption spectrum of the Ag NPs30-Ag20-AAO substrate. The absorption peak center was located at 524 nm, which was near the 532 nm. Therefore, in the SERS measurement, we chose the 532 nm laser as the excitation light source.
The SERS spectrum of the bare AgNPs30-Ag20-AAO substrate has been detected first, as shown in Figure 7b. The characteristic peak of the N-hexane and ethanol did not appear in the SERS spectrum. The N-hexane and ethanol were volatile. After assembling the Ag NPs on the Ag20-AAO substrate, they would quickly evaporate during the drying process. Therefore, the influence of N-hexane and ethanol on the Raman spectroscopy were excluded. Figure 7c shows the Raman spectra of 10−5 M 4-aminothiophenol solution adsorbed on different Ag-AAO substrates and the Ag NPs30-Ag20-AAO substrate. Meanwhile, the Raman spectrum of the 10−5 M 4-aminothiophenol solution adsorbed on the Ag NPs-AAO substrate was also exhibited. Notably, the Raman signal intensity of 4-aminothiophenol on Ag NPs30-Ag20-AAO was stronger than that of the 4-aminothiophenol Raman intensities obtained on the Ag-AAO nanoarrays and the Ag NPs-AAO substrate, owing to the heavy self-assembled nature of the Ag NPs by the oil-water separation self-assembly method. The same conclusion was also obtained in the calculation of the Raman characteristic peak integral area in the range of 1502–1811 cm−1, which extracted from the Raman spectra in Figure 7c, as shown in Figure 7d1–d4. In order to quantitatively analyze the enhancement performance of the Ag NPs30-Ag20-AAO SERS substrate, the increase factor values were calculated in Table 1. From the calculation results of the increase factors, it can be concluded that the SERS enhancement effect of the Ag NPs30-Ag20-AAO substrate was much higher than that of the Agx-AAO substrates. This result can be attributed to the wide range of “hot spots” density introduced by the Ag NPs after self-assembly. Compared with the more dispersed Ag NPs, as shown in Figure 6a, the Ag NPs on the Ag NPs30-Ag20-AAO SERS substrate prepared by the self-assembly method showed slight aggregation, which can further facilitate the formation of more “hot spots” to enhance the SERS response.

3.4. Sensitivity of the Ag NPs30-Ag20-AAO Substrate

As a complete study on the preparation and application of the SERS substrate, the potential application in sensitivity detection of the as-proposed SERS-based platform for quantitatively analyzing the MB molecule was investigated by directly adsorbing the MB molecule on the Ag NPs30-Ag20-AAO substrate. Figure 8a exhibits the sensitivity response of the Ag NPs30-Ag20-AAO substrate to the MB molecule with the concentrations from 10−7 M to 10−12 M. The Raman spectra detection results showed that the Raman characteristic peaks located at 768 cm−1, 1155 cm−1, 1396 cm−1 and 1626 cm−1 can be observed in Figure 8a, and the corresponding vibration modes [35] of these Raman characteristic peaks were collected in Table 2. The characteristic peak intensity at 1626 cm−1 was used to indirectly monitor the corresponding concentrations of the MB molecule. As expected, the SERS intensity of the Ag NPs self-assembly SERS substrate increased with the increase of the MB molecular concentration in the range of 1 × 10⁻¹² M−1 × 10⁻⁷ M. At the same time, a good linear relationship was established between the logarithm of SERS intensities at 1626 cm−1 and the logarithm of MB concentrations, as shown in Figure 8b. The linear calibration curve was fitted as y = 7.104 + 0.258, x (R2 = 0.98636). Error bars in the plot represented the standard deviations from five measurements of different spots for each concentration. Therefore, the LOD of the MB molecule on the Ag NPs30-Ag20-AAO was 1 × 10⁻¹¹ M. Here, the effect of the pre-resonance Raman enhancement performance on LOD was not considered. These results indicated that the proposed SERS-based platform had good potential for the practical detection in real samples of other aromatic molecules, even pesticide residues and active ingredients of Traditional Chinese medicine.

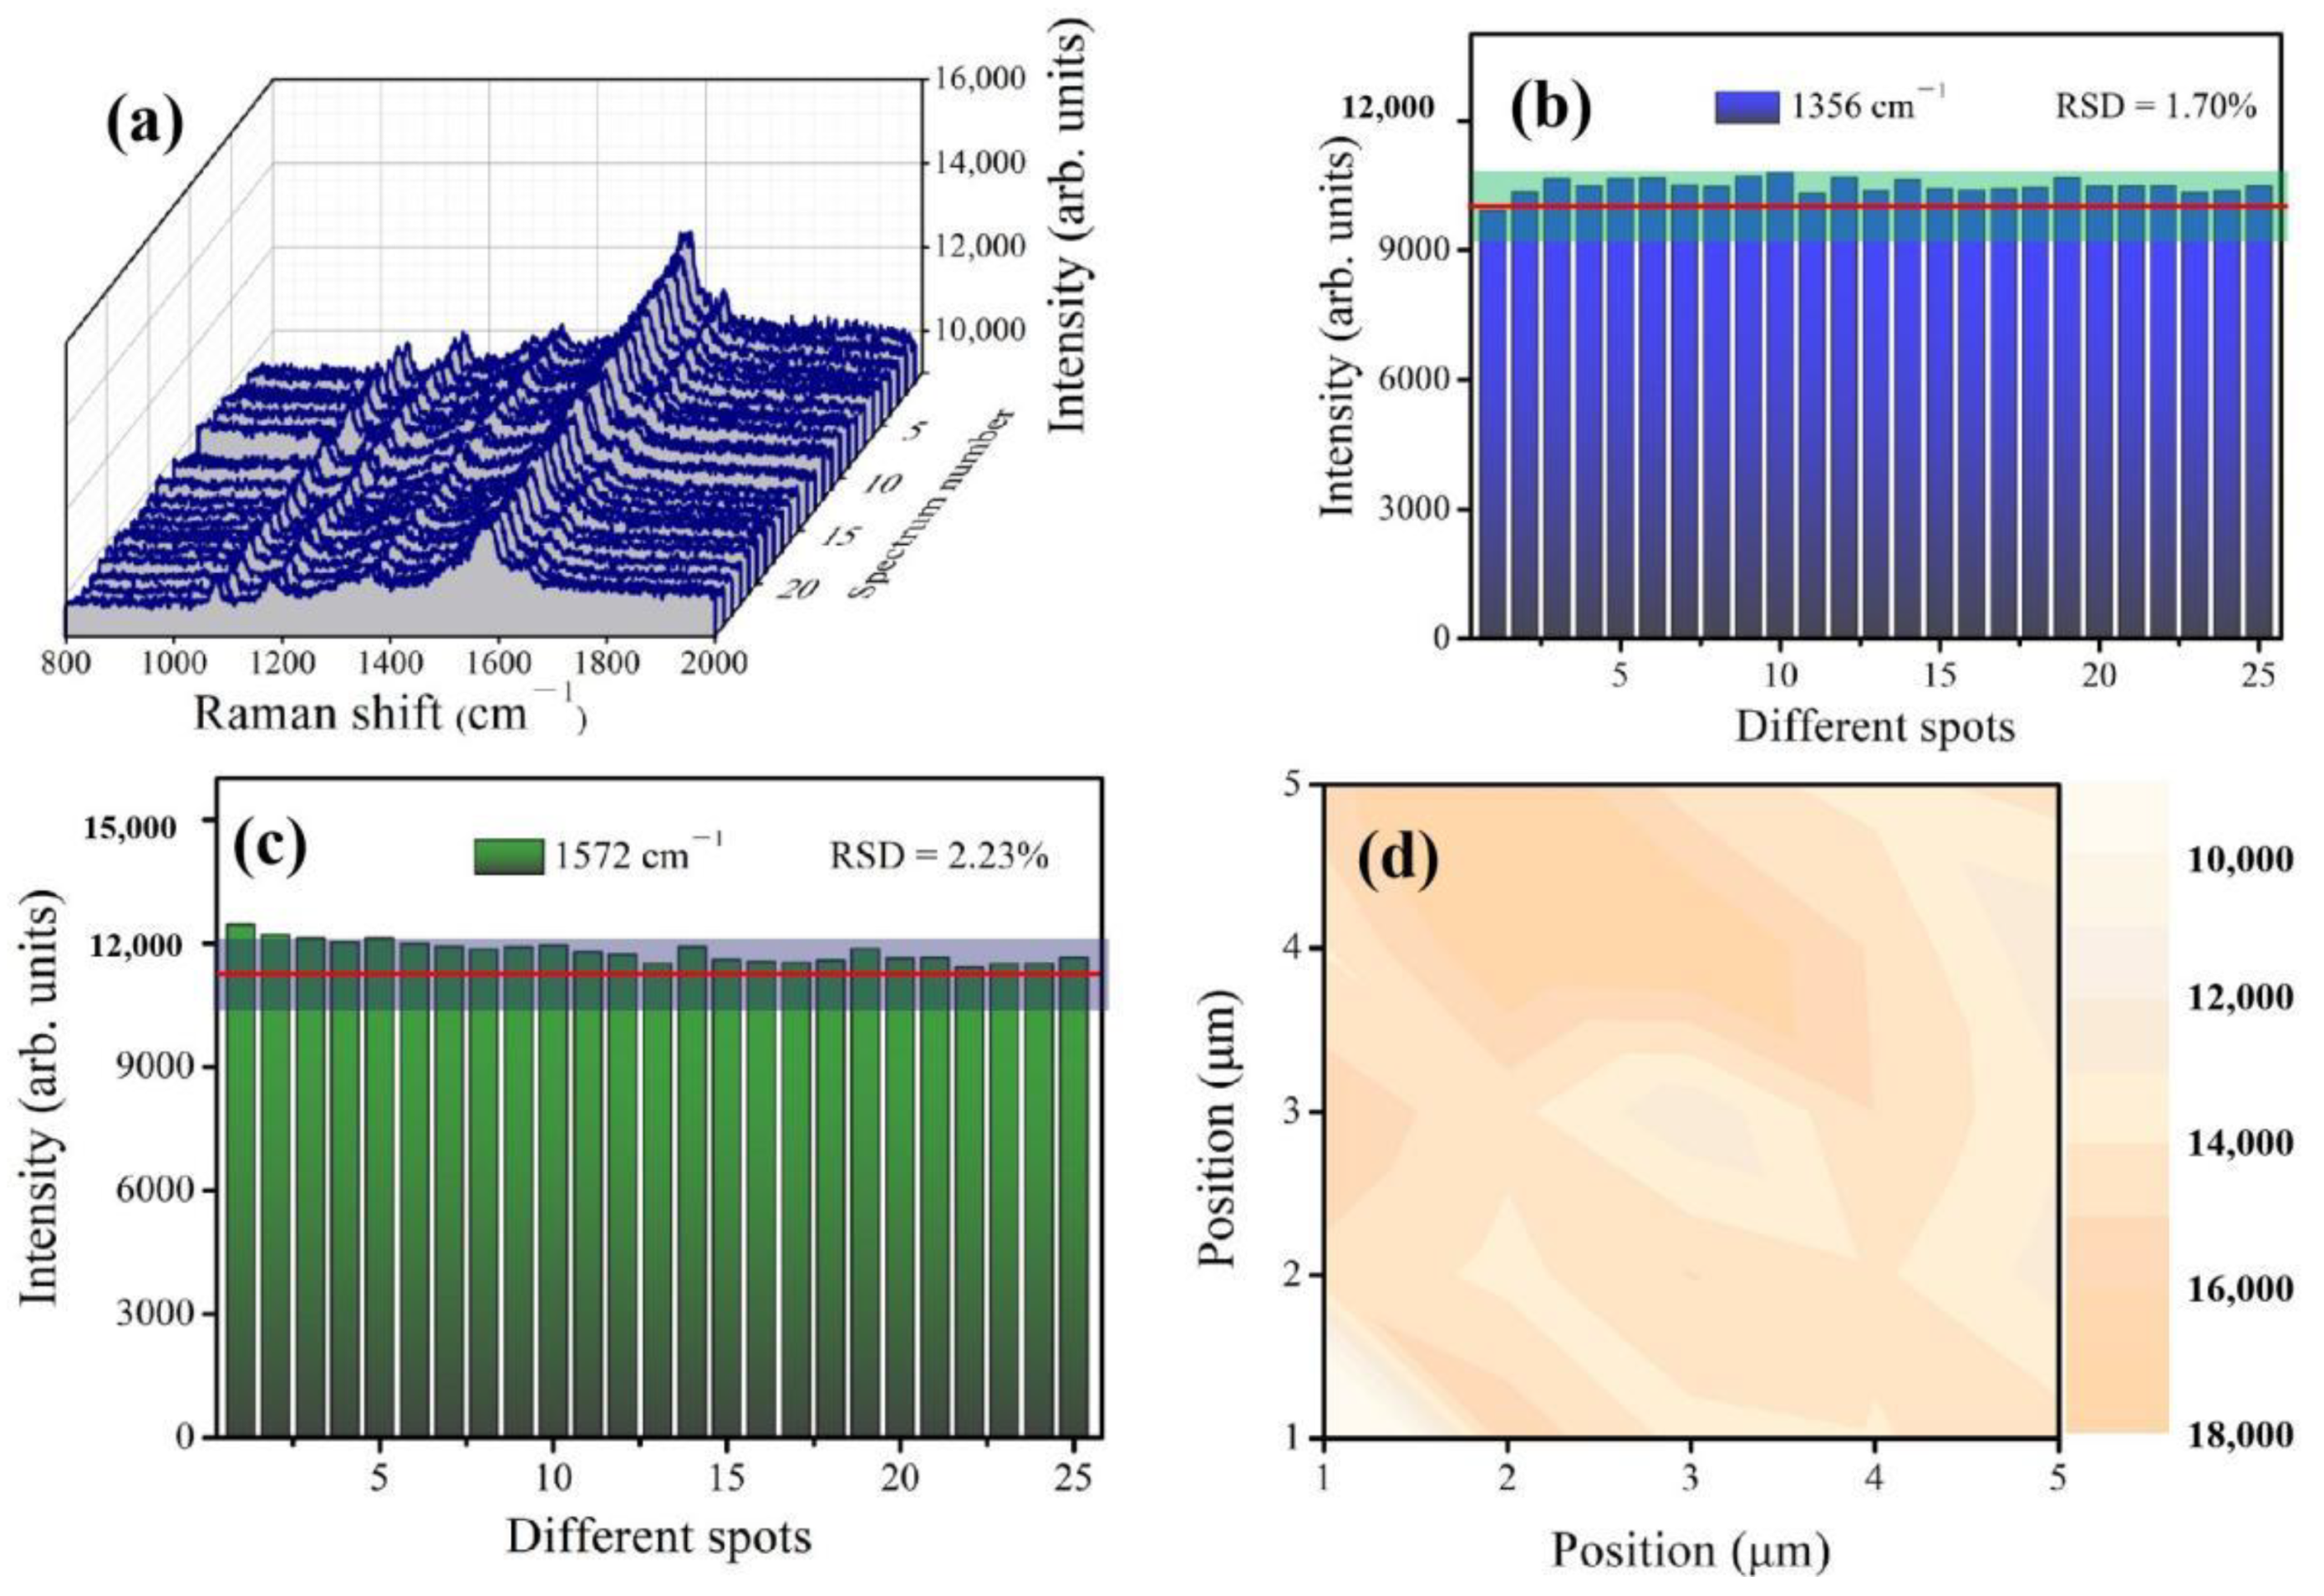
3.5. Reproducibility of the Ag NPs30-Ag20-AAO Substrate

In practical application, another important content of Raman scattering research is the reproducibility of the SERS signals. In many cases, random distribution or a lack of electromagnetic “hot spots” can lead to a great deviation in the SERS signal strength [36]. Therefore, the reproducibility of the Raman signal greatly affected the reliability and practicability of the SERS system detection. In order to further reveal the Raman signal reproducibility and practicability of the Ag NPs30-Ag20-AAO substrate, the Raman detection of acephate on the surface of Scutellaria baicalensis was carried out by using the “pasted and peeled off” method. First, Scutellaria baicalensis was thoroughly washed with deionized water and anhydrous ethanol. Then, 10 μL of 10−10 mg/mL acephate solution were sprayed directly on the surface of Scutellaria baicalensis. After natural evaporation at room temperature, the 10 μL anhydrous ethanol solution was dropped onto the pre-treated sample. In this step, the ethanol acted as an extraction. Finally, the Ag NPs30-Ag20-AAO SERS substrate was pressed onto the sample for 30 s and then peeled off for further Raman detection. This process was repeated five times to ensure the successful collection of acephate.
Acephate is a kind of organophosphate pesticide. In agricultural production, acephate is often used as a protective fungicide for leafy vegetables, traditional Chinese medicine, tea and corn. This pesticide can inhibit the activity of cholinesterase in the human body, resulting in neurophysiological dysfunction. Once inhaled, acephate can cause poisoning and even death. Therefore, the Ag NPs30-Ag20-AAO SERS substrate was applied to detect the acephate residue on Scutellaria baicalensis. Figure 9a shows the substrate-to-substrate reproducible SERS spectra of 10−10 mg/mL acephate. These 25 SERS spectra were obtained from 25 points randomly selected from the 5 Ag NPs30-Ag20-AAO substrates. From the Raman spectra in Figure 9a, we found that the characteristic peaks of acephate did not shift to red or blue, and the signal intensity of the characteristic peak showed no difference. The relative standard deviation (RSD) values were calculated to evaluate the reproducibility on the basis of Equation (5) [37]:
R S D = i = 1 n ( I i I ¯ ) 2 n 1 I ¯
where Ī is the average intensity of all of the SERS spectra, n is 25 and Ii is the intensity of each SERS spectrum on the same characteristic peak. The RSD values at the characteristic peaks of 1356 cm−1 and 1572 cm−1 were exhibited in Figure 9b,c. Each RSD value was less than 2.23%, which fully revealed that the Ag NPs30-Ag20-AAO substrate had a good reproducibility of the Raman signal in the whole region. In order to further confirm the point-to-point reproducibility of the Ag NPs30-Ag20-AAO substrate, a randomly selected 5 μm × 5 μm = 25 μm2 area was chosen, and the laser scanning step was 1 μm. The point-to-point Raman mapping image at 1181 cm−1 is shown in Figure 9d. The brightness of the grid was proportional to the Raman signal intensity at 1181 cm−1, which indicated that the Ag NPs30-Ag20-AAO substrate had an excellent Raman signal reproducibility.
Due to the excellent reproducibility and reliable practicability of the Ag NPs30-Ag20-AAO substrate, the Raman spectra of acephate were successfully detected at an extremely low concentration level (10−10 mg/mL). Compared with the limit of quantitation (LOQ) specified in the national food safety standard of China (GB 2763-2014), the detection limit of the Ag NPs30-Ag20-AAO SERS substrate was far lower than the LOQ. It was further proved that the Ag NPs30-Ag20-AAO substrate has super sensitivity and wins a wide application prospect in actual industrial and agricultural production.

3.6. Experimental Enhancement Factor (EEF) Calculation

In the above description, we used the 3D-FDTD method to simulate the electromagnetic field enhancement near the Ag NPs30-Ag20-AAO model, and the TEF was 2.847 × 10⁹. In order to further evaluate the Raman enhancement performance of the Ag NPs30-Ag20-AAO SERS substrate from an experimental point of view, the experimental enhancement factor (EEF) value was calculated according to the following Equation (6) [38]:
E E F = I S E R S I b u l k × N b u l k N S E R S
where the Ibulk and ISERS are the Raman signal intensities of 10−2 M CV solution on the Si wafer and 10−6 M CV solution on the Ag NPs30-Ag20-AAO SERS substrate at the 1619 cm−1 characteristic peak. Nbulk and NSERS represent the number of CV molecules on the Si wafer and the Ag NPs30-Ag20-AAO SERS substrate under the laser spot. Figure 10a,b exhibits the Raman spectra of 10−2 M CV solution on the Si wafer and 10−6 M CV solution on the Ag NPs30-Ag20-AAO SERS substrate, respectively. Through the integral calculation of the 1619 cm−1 characteristic peak area, the values of Ibulk and ISERS were 26,314 and 3,184,950. Therefore, the value of ISERS/Ibulk was 121.036. The number of CV molecules (N: Nbulk and NSERS) can be calculated according to Equation (7) [39]:
N = ( N A × M × V s o l u t i o n S s u b ) × S l a s e r
where NA is the Avogadro constant, M is the CV molecular concentration and Vsolution = 10 μL is the volume of the CV solution on the Si wafer and the Ag NPs30-Ag20-AAO SERS substrate. Ssub stands for the area of the CV drop and the Slaser is the laser area. In the experiment, the Ssub on the Si wafer was 1.2 times larger than that on the Ag NPs30-Ag20-AAO SERS substrate. In the SERS measurement, the diameter of the laser area was 1 μm. Through calculation, the Slaser was 0.785 μm2. Therefore, the value of Nbulk/NSERS was calculated as 0.833 × 10⁴. Therefore, according to Equation (6), the EEF value of the Ag NPs30-Ag20-AAO SERS substrate was 1.0083 × 10⁶. The EEF value is less than TEF value. In the simulation model of electromagnetic field intensity, the Ag nanospheres composed of silver atoms were closely constructed, and large-scale “hot spots” were stimulated in the narrow nanogaps. On the other hand, there was a monolayer Ag NPs film modified on the surface of the Ag-AAO model in Figure 6c. However, in the experiment, Ag NPs were adsorbed in multiple layers. The aforementioned two main reasons caused the TEF value to be greater than the EEF value. So far, we have successfully detected 4-aminothiophenol, acephate, MB and CV molecules with the Ag NPs30-Ag20-AAO substrate. These results indicate the universality of the Ag NPs30-Ag20-AAO SERS substrate in the field of Raman spectroscopy.

3.7. Detection of the Baicalein by the Ag NPs30-Ag20-AAO Substrate

According to the above analysis, we know that the Ag NPs30-Ag20-AAO substrate has strong electromagnetic field enhancement, ultra-high sensitivity and excellent Raman signal reproducibility. At a very low concentration of 10−10 mg/mL, acephate residue was successfully detected on the surface of Scutellaria baicalensis. In order to further study the application prospects of the substrate in the detection of real active ingredients in traditional Chinese medicine, we prepared Baicalein solutions with the concentration ranging from 1 ng/mL to 10 fg/mL.
Scutellaria baicalensis is a kind of traditional Chinese medicine with roots as a medicine. It is mainly used for warm heat disease, upper respiratory tract infection, lung heat cough, pneumonia, dysentery, hypertension and so on [40]. Modern Chinese medicine research showed that Baicalein was the main active ingredient of Scutellaria baicalensis [41]. Baicalein can reduce cerebrovascular resistance, improve cerebral blood circulation and increase cerebral blood flow and anti platelet aggregation. It is used for the treatment of paralysis after cerebrovascular disease. Baicalein is an effective component in the body. After Baicalein enters the animal body, it is rapidly transformed into Baicalin and other metabolites in the blood.
Therefore, a reasonable, low-cost and sensitive method for the detection of Baicalein was essential. Figure 11a shows the Raman spectra of Baicalein at the concentrations of 1 ng/mL to 10 fg/mL on the Ag NPs30-Ag20-AAO substrate obtained by SERS technology. Figure 11b1,b2 shows the Raman spectra of Baicalein powder and 1 ng/mL Baicalein. In these Raman spectra, the characteristic peaks of Baicalein, including 691 cm−1, 1063 cm−1, 1370 cm−1 and 1599 cm−1, can be clearly observed. With the decrease of Baicalein concentration, the intensities of the Raman characteristic peaks decreased. When the concentration was as low as 10 fg/mL, the characteristic peak can still be clearly identified. Taking the 1599 cm−1 characteristic peak as an example, when the logarithms of Baicalein concentration and Raman intensity were calculated at the same time, a perfect linear correlation curve was shown in Figure 11c, where the calculation equation was y = 6.181 + 0.197 x and R2 was 0.99128. The practical detection results show that this high-performance Ag NPs30-Ag20-AAO SERS substrate can be applied for the rapid and quantitative detection of other label-free active ingredient molecules in other traditional Chinese medicines.

4. Conclusions

In summary, a facile approach for the high technical mature fabrication of the 30 nm Ag NPs self-assembly Ag20-AAO nanoarray was successfully demonstrated for sensing pesticide residues and active components of traditional Chinese medicine. Using ethanol as an inducer, the designed plasma nanoarray was realized by the strategy of the self-assembly of Ag NPs at the N-hexane/water interface. The close-packed Ag NPs on the Ag20-AAO nanoarray with the nanogaps less than 10 nm between the neighboring Ag NPs stimulated uniform and high intensity electromagnetic enhancement “hot spots”. The high-performance Ag NPs30-Ag20-AAO substrate was used to detect the residue of acephate on the surface of Scutellaria baicalensis, which proved that the substrate had excellent Raman signal reproducibility and reliable practicability. In the practical detection, the Raman spectra of Baicalein and its concentration dependence were given, and the LOD was located at 10 fg/mL. The superiority of the constructed Ag NPs30-Ag20-AAO SERS platform in the current study demonstrated the feasibility of both pesticide residues analysis and Chinese medicine active components detection. It indicated that this preparation method has great application potential in the trace detection of other active components of traditional Chinese medicine, pesticides and antibiotics.

Author Contributions

Conceptualization, M.W. and L.W.; methodology, L.W. and M.W.; software, J.G. (Jialin Ge) and W.Y.; validation, S.X., M.W. and J.G. (Jianjun Gu); formal analysis, C.C., K.L. and J.G. (Jungai Gu); investigation, J.G. (Jianjun Gu) and W.H.; resources, G.S. and S.X.; data curation, G.S. and Z.Z.; writing—original draft preparation, G.S., Z.Z. and W.Y.; writing—review and editing, G.S., C.C. and W.H.; visualization, J.G. (Jungai Gu) and J.G. (Jialin Ge); supervision, K.L.; project administration, G.S. and S.X.; funding acquisition, L.W., G.S. and S.X. All authors have read and agreed to the published version of the manuscript.

Funding

This work was funded by the Science and Technology Project of Hebei Education Department (QN2021236), the foundation of Hebei Normal University for nationalities (NO. DR2018004) and the “Technology Innovation Guidance Project-Science and Technology Work Conference” of the Hebei Provincial Department of Science and Technology.

Institutional Review Board Statement

Not applicable.

Informed Consent Statement

Not applicable.

Data Availability Statement

Data sharing is not applicable to this article.

Conflicts of Interest

The authors declare no conflict of interest.

References

  1. Ru, E.C.L.; Etchegoin, P.G. Single-molecule surface-enhanced Raman spectroscopy. Annu. Rev. Phys. Chem. 2012, 63, 65–87. [Google Scholar] [PubMed] [Green Version]
  2. Zheng, X.S.; Jahn, I.J.; Weber, K.; Cialla-May, D.; Popp, J. Label-free SERS in biological and biomedical applications: Recent progress, current challenges and opportunities. Spectrochim. Acta A 2018, 197, 56–77. [Google Scholar] [CrossRef]
  3. Li, C.H.; Liu, A.H.; Zhang, C.; Wang, M.H.; Li, Z.; Xu, S.C.; Jing, S.Z.; Yu, J.; Yang, C.; Man, B.Y. Ag gyrus-nanostructure supported on graphene/Au film with nanometer gap for ideal surface enhanced Raman scattering. Opt. Express 2017, 25, 20631–20641. [Google Scholar] [CrossRef] [PubMed]
  4. Yu, J.; Yang, M.; Li, Z.; Liu, C.; Wei, Y.; Zhang, C.; Man, B.; Lei, F. Hierarchical particle-in-quasicavity architecture for ultratrace in situ Raman sensing and its application in real-time monitoring of toxic pollutants. Anal. Chem. 2020, 92, 14754–14761. [Google Scholar] [CrossRef]
  5. Zhao, Y.Y.; Qi, F.; Zhao, C.L.; Xie, C.X.; Wang, J.G.; Chang, C.T.; Li, Y.J.; Zhang, L.C. Facile fabrication of ultrathin freestanding nanoporous Cu and Cu-Ag films with high SERS sensitivity by dealloying Mg-Cu(Ag)-Gd metallic glasses. J. Mater. Sci. Technol. 2021, 70, 205–213. [Google Scholar] [CrossRef]
  6. Meng, S.; Chen, R.; Xie, J.; Li, J.; Cheng, J.; Xu, Y.; Cao, H.; Wu, X.; Zhang, Q.; Wang, H. Surface-enhanced Raman scattering holography chip for rapid, sensitive and multiplexed detection of human breast cancer-associated MicroRNAs in clinical samples. Biosens. Bioelectron. 2021, 190, 1113470–1113479. [Google Scholar] [CrossRef]
  7. Fleischmann, M.; Hendra, P.J.; McQuillan, A.J. Raman spectra of pyridine adsorbed at a silver electrode. Chem. Phys. Lett. 1974, 26, 163–166. [Google Scholar] [CrossRef]
  8. Cong, S.; Yuan, Y.; Chen, Z.; Hou, J.; Yang, M.; Su, Y.; Zhang, Y.; Li, L.; Li, Q.; Geng, F.; et al. Noble metal-comparable SERS enhancement from semiconducting metal oxides by making oxygen vacancies. Nat. Commun. 2015, 6, 7800–7806. [Google Scholar] [CrossRef] [PubMed]
  9. Salomon, L.; Bassou, G.; Aourag, H.; Dufour, J.P.; De Fornel, F.; Carcenac, F.; Zayats, A.V. Local excitation of surface plasmon polaritons at discontinuities of a metal film: Theoretical analysis and optical near-field measurements. Phys. Rev. B 2002, 65, 125409. [Google Scholar] [CrossRef]
  10. Willets, K.A.; Van Duyne, R.P. Localized surface plasmon resonance spectroscopy and sensing. Annu. Rev. Phys. Chem. 2007, 58, 267–297. [Google Scholar] [CrossRef] [Green Version]
  11. Otto, A. Surface-enhanced Raman scattering: “Classical” and “Classical” Origins. In Light Scattering in Solids IV. Topics in Applied Physics; Springer: Berlin, Germany, 1984; Volume 54, pp. 289–418. [Google Scholar]
  12. Campion, A.; Kambhampati, P. Surface enhanced Raman scattering. Chem. Soc. Rev. 1998, 27, 241–250. [Google Scholar] [CrossRef]
  13. Wang, Y.X.; Liu, S.S.; Gao, W.T.; Zhang, Y.J.; Yang, J.H. Surface-enhanced Raman spectroscopy based on ordered nanocap arrays. Superlattice. Microst. 2012, 52, 750–758. [Google Scholar] [CrossRef]
  14. Xu, H.; Jian, Q.; Xu, L.; Gao, S. Wireless battery-free generation of electric fields on one-dimensional asymmetric Au/ZnO nanorods for enhanced Raman sensing. Anal. Chem. 2021, 93, 9286−9295. [Google Scholar] [CrossRef]
  15. Tang, L.; Tian, C.; Gu, W.; Jiang, Z. Surface-enhanced Raman scattering-based lateral flow immunoassay mediated by hydrophilic-hydrophobic Ag-modified PMMA substrate. Spectrochim. Acta A Mol. Biomol. Spectrosc. 2021, 262, 120092. [Google Scholar] [CrossRef]
  16. Caldwell, J.; Taladriz-Blanco, P.; Rothen-Rutishauser, B.; Petri-Fink, A. Detection of sub-micro- and nanoplastic particles on gold nanoparticle-based substrates through surface-enhanced Raman scattering (SERS) Spectroscopy. Nanomaterials 2021, 11, 1149. [Google Scholar] [CrossRef] [PubMed]
  17. Zhang, P.; Liu, G.Q.; Feng, S.J.; Zhao, X. Engineering of flexible granular Au nanocap ordered array and its surface enhanced Raman spectroscopy effect. Nanotechnology 2020, 31, 035303–035312. [Google Scholar] [CrossRef] [PubMed]
  18. Ding, Q.Q.; Kang, Y.L.; Li, W.L.; Sun, G.F.; Liu, H.; Li, M.; Ye, Z.R.; Zhou, M.; Zhou, J.G.; Yang, S.K. Bioinspired brochosomes as broadband and omnidirectional surface-enhanced Raman scattering substrates. J. Phys. Chem. Lett. 2019, 10, 6484–6491. [Google Scholar] [CrossRef]
  19. Zhang, X.; Zhang, X.; Luo, C.L.; Liu, Z.Q.; Chen, Y.Y.; Dong, S.L.; Jiang, C.Z.; Yang, S.K.; Wang, F.B.; Xiao, X.H. Volume-enhanced Raman scattering detection of viruses. Small 2019, 15, 1805516–1805523. [Google Scholar] [CrossRef]
  20. Politano, G.G.; Cazzanelli, E.; Versace, C.; Vena, C.; De Santo, M.P.; Castriota, M.; Ciuchi, F.; Bartolino, R. Graphene oxide on magnetron sputtered silver thin films for SERS and metamaterial applications. Appl. Surf. Sci. 2018, 427, 927–933. [Google Scholar] [CrossRef]
  21. Yilmaz, M. Silver-nanoparticle-decorated gold nanorod arrays via bioinspired polydopamine coating as surface-enhanced Raman spectroscopy (SERS) platforms. Coatings 2019, 9, 198. [Google Scholar] [CrossRef] [Green Version]
  22. Demirci, G.; Muszynska, J.; Cetinkaya, O.; Filipczak, P.; Zhang, Y.M.; Nowaczyk, G.; Halagan, K.; Ulanski, J.; Matyjaszewski, K.; Pietrasik, J.; et al. Effective SERS materials by loading Ag nanoparticles into poly(acrylic acid-stat-acrylamide)-block-polystyrene nano-objects prepared by PISA. Polymer 2021, 224, 123747–123756. [Google Scholar] [CrossRef]
  23. Guo, L.T.; Cao, H.W.; Cao, L.P.; Li, N.; Zhang, A.Q.; Shang, Z.B.; Jiao, T.F.; Liu, H.L.; Wang, M.L. Improve optical properties by modifying Ag nanoparticles on a razor clam SERS substrate. Opt. Express 2021, 29, 5152–5165. [Google Scholar] [CrossRef] [PubMed]
  24. Shi, G.C.; Wang, M.L.; Zhu, Y.Y.; Wang, Y.H.; Xu, H.J. A novel natural SERS system for crystal violet detection based on graphene oxide wrapped Ag micro-islands substrate fabricated from Lotus leaf as a template. Appl. Surf. Sci. 2018, 459, 802–811. [Google Scholar] [CrossRef]
  25. Yang, W.; Li, Z.; Lu, Z.Y.; Yu, J.; Huo, Y.Y.; Man, B.Y.; Pan, J.; Si, H.P.; Jiang, S.Z.; Zhang, C. Graphene-Ag nanoparticles-cicada wings hybrid system for obvious SERS performance and DNA molecular detection. Opt. Express 2019, 27, 3000–3013. [Google Scholar] [CrossRef]
  26. Fang, Y.; Seong, N.H.; Dlott, D.D. Measurement of the distribution of site enhancements in surfaceenhanced Raman scattering. Science 2008, 321, 388–392. [Google Scholar] [CrossRef]
  27. Yan, X.Y.; Wang, M.Y.; Sun, X.; Wang, Y.H.; Shi, G.C.; Ma, W.L.; Hou, P. Sandwich-like Ag@Cu@CW SERS substrate with tunable nanogaps and component based on the Plasmonic nanonodule structures for sensitive detection crystal violet and 4-aminothiophenol. Appl. Surf. Sci. 2019, 479, 879–886. [Google Scholar] [CrossRef]
  28. Lee, P.C.; Meisel, D.J. Adsorption and surface-enhanced Raman of dyes on silver and gold sols. J. Phys. Chem. B 1982, 86, 3391–3395. [Google Scholar] [CrossRef]
  29. Fuchs, R. Theory of the optical properties of ionic crystal cubes. Phys. Rev. B 1975, 11, 1732–1740. [Google Scholar] [CrossRef]
  30. Gai, H.F.; Wang, J.; Tian, Q. Modified Debye model parameters of metals applicable for broadband calculations. Appl. Optics 2007, 46, 2229–2233. [Google Scholar] [CrossRef]
  31. Wang, M.L.; Yan, X.Y.; Shi, G.C.; Shang, Z.B.; Zhang, A.Q.; Ma, W.L. Optical properties of Ag@cicada wing substrate deposited by Ag nanoparticles. Curr. Appl. Phys. 2020, 20, 1253–1262. [Google Scholar] [CrossRef]
  32. García-Vidal, F.J.; Pendry, J.B. Collective theory for surface enhanced Raman scattering. Phys. Rev. Lett. 1996, 77, 1163–1166. [Google Scholar] [CrossRef]
  33. Muhammad, M.; Shao, C.S.; Huang, Q. Label-free SERS diagnostics of radiation-induced injury via detecting the biomarker Raman signal in the serum and urine bio-samples based on Au-NPs array substrates. Spectrochim. Acta A Mol. Biomol. Spectrosc. 2019, 233, 117282–117291. [Google Scholar] [CrossRef]
  34. Wang, M.L.; Shang, Z.B.; Yan, X.Y.; Shi, G.C.; Cao, H.W.; Ma, W.L.; Jiao, T.F. Enhance fluorescence study of grating structure based on three kinds of optical disks. Opt. Commun. 2021, 481, 126522–126530. [Google Scholar] [CrossRef]
  35. Li, C.Y.; Huang, Y.Q.; Lai, K.Q.; Rasco, B.A.; Fan, Y.X. Analysis of trace methylene blue in fish muscles using ultra-sensitive surface-enhanced Raman spectroscopy. Food Control 2016, 65, 99–105. [Google Scholar] [CrossRef]
  36. Lin, S.; Lin, X.; Shang, Y.; Han, S.; Hasi, W.; Wang, L. Self-assembly of faceted gold nanocrystals for surface-enhanced Raman scattering application. J. Phys. Chem. C 2019, 123, 24714–24722. [Google Scholar] [CrossRef]
  37. Parsons, H.M.; Ekman, D.R.; Collette, T.W.; Viant, M.R. Spectral relative standard deviation: A practical benchmark in metabolomics. Analyst 2009, 134, 478–485. [Google Scholar] [CrossRef]
  38. Lv, M.Y.; Teng, H.Y.; Chen, Z.Y.; Zhao, Y.M.; Zhang, X.; Liu, L.; Wu, Z.L.; Liu, L.M.; Xu, H.J. Low-cost Au nanoparticle-decorated cicada wing as sensitive and recyclable substrates for surface enhanced Raman scattering. Sens. Actuators B. Chem. 2015, 209, 820–827. [Google Scholar] [CrossRef]
  39. Zhang, M.F.; Meng, J.T.; Wang, D.P.; Tang, Q.; Chen, T.; Rong, S.Z.; Liu, J.Q.; Wu, Y.C. Biomimetic synthesis of hierarchical 3D Ag butterfly wing scale arrays/graphene composites as ultrasensitive SERS substrates for efficient trace chemical detection. J. Mater. Chem. C 2018, 6, 1933–1943. [Google Scholar] [CrossRef]
  40. Chen, M.T.; Xiao, H.T.; Chen, B.; Bian, Z.X.; Kwan, H.Y. The advantages of using Scutellaria baicalensis and its flavonoids for the management of non-viral hepatocellular carcinoma. J. Funct. Foods 2021, 78, 104389–104401. [Google Scholar] [CrossRef]
  41. Liao, H.F.; Ye, J.; Gao, L.L.; Liu, Y.L. The main bioactive compounds of Scutellaria baicalensis Georgi. for alleviation of inflammatory cytokines: A comprehensive review. Biomed. Pharmacother. 2021, 133, 110917–110933. [Google Scholar] [CrossRef] [PubMed]
Figure 1. Schematic illustration of the fabrication process of the Ag NPs-Ag-AAO nanoarray and the SERS measurement by the Raman system.
Coatings 11 01054 g001
Figure 2. Schematic diagram of the AAO preparation device.
Coatings 11 01054 g002
Figure 3. FE-SEM images of the prepared AAO nanoarrays from (a) top view and (b) cross-section view.
Coatings 11 01054 g003
Figure 4. FE-SEM images of (a) Ag10-AAO, (b) Ag15-AAO, (c) Ag20-AAO and (d) Ag25-AAO substrates with different sputtering times.
Coatings 11 01054 g004
Figure 5. (a) EDX mapping of the Ag20-AAO nanoarray; (b) cross-section view FE-SEM image of the Ag20-AAO nanoarray; (c) 3D-FDTD model of the Ag20-AAO nanoarray; the spatial distributions of the electromagnetic field intensity of the Ag20-AAO nanoarray in the (d) x-y plane and (e) y-z plane.
Coatings 11 01054 g005
Figure 6. (a) TEM image of the Ag NPs; (b,b1) top view and cross-section view FE-SEM images of the Ag NPs30-Ag20-AAO substrate; (c) 3D-FDTD model of the Ag NPs30-Ag20-AAO nanoarray; the spatial distributions of the electromagnetic field intensity of the Ag NPs30-Ag20-AAO nanoarray in the (d) x-y plane and (e) y-z plane.
Coatings 11 01054 g006
Figure 7. (a) UV-vis extinction spectra of the Ag NPs30-Ag20-AAO substrate; (b) Raman spectra of the bare AgNPs30-Ag20-AAO substrate; (c) Raman spectra of the 4-aminothiophenol on different types of SERS substrates; (d1d4) the integrated integral area of the Raman shift in the range of 1502 cm−1–1811 cm−1.
Coatings 11 01054 g007
Figure 8. (a) Raman spectra of the MB solution with different concentrations on the Ag NPs30-Ag20-AAO substrate; (b) the linear relationship between the integral area of Raman intensity and the different concentrations at 1626 cm1 in a logarithm scale.
Coatings 11 01054 g008
Figure 9. (a) SERS spectra of 10−10 mg/mL acephate obtained from 25 randomly selected spots; (b,c) Raman characteristic peak intensities of 10−10 mg/mL acephate; (d) SERS mapping image of the 1181 cm−1 characteristic peak.
Coatings 11 01054 g009
Figure 10. (a) SERS spectra of 10−2 M CV solution on the Si wafer; (b) SERS spectra of 10−6 M CV solution on the Ag NPs30-Ag20-AAO SERS substrate.
Coatings 11 01054 g010
Figure 11. (a) Raman spectra of Baicalein at different concentrations ranging from 1 ng/mL to 10 fg/mL; (b1,b2) Raman spectra of Baicalein powder and 1 ng/mL Baicalein; (c) corresponding calibration curve of the peak intensity at 1599 cm−1.
Coatings 11 01054 g011
Table 1. Raman intensities of different SERS substrates at the peak of 1582 cm−1.
Sputtering Time (min)Peak Intensity I (cps)Increase Factor
(IAg NPs30-Ag20-AAO/IAgx-AAO)
IAgx-AAOIAg NPs30-Ag20-AAO
10182,101.97 ± 5480.781.037 × 106 ± 159.35.69 ± 0.029
15296,142.98 ± 3581.301.037 × 106 ± 159.33.50 ± 0.044
20407,642.04 ± 6139.091.037 × 106 ± 159.32.54 ± 0.026
Table 2. Vibrational modes of the MB Raman characteristic peaks.
Raman (cm−1)SERS (cm−1)Vibrational Mode
596 (w)595 (w)Skeletal deformation of C–S–C
671 (w)672 (w)Out-of-plane bending of C–H
770 (w)768 (w)In-plane bending of C–H
1154 (w)1155 (w)In-plane bending of C–H
1394 (m)1396 (m)Symmetrical stretching of C–N
-1468 (w)Asymmetrical stretching of C–N
1623 (s)1626 (s)Ring stretching of C–C
Notation: s, strong; m, medium; w, weak peak intensity.
Publisher’s Note: MDPI stays neutral with regard to jurisdictional claims in published maps and institutional affiliations.

