
A Phase Field Approach to Modeling Heavy Metal Impact in Plasma Spraying
1
School of Mathematics and Statistics, Yancheng Teachers University, Yancheng 224002, China
2
Department of Mechanical Engineering, University of Michigan, Dearborn, MI 48128, USA
*
Author to whom correspondence should be addressed.
Coatings 2022, 12(10), 1383; https://doi.org/10.3390/coatings12101383
Submission received: 13 July 2022
/
Revised: 31 August 2022
/
Accepted: 7 September 2022
/
Published: 22 September 2022
(This article belongs to the Topic Insight into Liquid/Fluid Interfaces)
Abstract
:A phase field model enhanced with the shared memory parallelism OpenMP was proposed, capable of modeling the impact of a heavy metal droplet under practical plasma spraying conditions. The finite difference solution of the Navier-Stokes equations, coupled with the Cahn-Hilliard equation, tracks the gas-liquid interface. The liquid fraction, defined over the computational domain, distinguishes fluid from solid. The model is employed for Ni and YSZ drop impacts after ruling out the effect of mesh size. The model exhibits a reasonable parallel-computing efficiency, and the predicted maximum spread factors agree well with analytical models.
1. Introduction
Phase field modeling, an emerging technique to study phase interface problems, has attracted a wide spread attention recently [1]. Different from traditional sharp interface methods that capture an interface of zero thickness, a phase field model, or a descendant of diffuse interface methods, treats the interface as a thin but finite-sized transition layer between different phases by using fixed grids. By so doing, it eliminates the need to employ moving grids to satisfy the idealized delta boundary conditions along an interface; moving grids are notoriously difficult to implement, especially for complex moving boundary problems as encountered in droplet spreading and solidification microstructure formation. Molecular simulations show that there is indeed a finite transition layer over which atom arrangement in one phase gradually changes into that in another phase. In fact, molecular simulations are one of the tools used to obtain phase field parameters. From this perspective, the phase field model, in essence, is a microscopic-physics-based model. In phase field modeling, a normalized order parameter is introduced, which evolves to track the interface dynamics [2].
There are two types of formulations in the phase field model: one conservative and the other non-conservative [3]. The former is called the Cahn-Hilliard (CH) equation, which describes the evolution of a concentration field in phase change problems [4]. In this approach, the driving force is derived from a chemical potential and/or convection. The latter is referred to as the Allen-Cahn equation, which is not conservative and is often used in solidification modeling [5]. Recently, interest in developing conservative Allen-Cahn equations to study two-phase flow problems has merited some attention from the research community [6].
This paper applies the Cahn-Hilliard phase field model to study the problems of drop impact and spreading. An early work by Jacqmin [7] showed that the CH model can have the same outer behavior as sharp interface models but that the inner behavior can be greatly different. He also considered the problem of prescribing contact angles in the moving contact line within the framework of phase field modeling. His work has motivated researchers to apply the CH model to study various types of problems associated with droplet impact and spreading and related solving methods [8,9,10,11]. One of the key issues involved in how to simulate two-phase flows with a large disparity of density and viscosity. The use of the CH model is known to result in loss of mass. A remedy was presented in [12], details of which were not elaborated. Ding et al. [13] also developed a phase field model for such treatment, and subsequently, many modifications were proposed by researchers [14,15,16,17]. Another issue in the CH model is the selection of phase field mobility. Yue et al. [18] and Magaletti et al. [19] proposed correlations based on asymptotic analysis to choose the phase field mobility, but their validity appears to be debatable, and hence the choice is still empirical. Recently, the phase field Lattice Boltzmann models have also been developed for flows of large thermophysical property differences [20].
Solidification is another phase change phenomenon, for which phase field models are also useful. The literature on phase field modeling comes mostly from the materials research community.
Having reviewed the literature, there appear to be relatively few papers on their use in drop impact undergoing solidification, despite its engineering significance. Most of the work appears to have come from the authors’ group. Shen et al. [21] developed such a model for that purpose, but the model is computationally inefficient as it was not on a parallel computing platform. Computations, in particular 3D computations, require a large number of computational resources, which calls for parallel computing to improve efficiency. This paper presents a parallel implementation of a 3D transport phenomena/solidification microstructure formation model and applies the model to study the spreading of a heavy metal (Ni) impact and of Yttria-Stabilized Zirconia (YSZ) impact while undergoing solidification. Computed results show that for drops of diameter 12 μm and of an impacting velocity of 100 m/s under plasma spraying conditions, solidification time is about 0.6 μs for YSZ and 0.3 μs for Ni. Moreover, Ni drops are prone to be blocked by solidification while spreading. The findings and models presented should be of great value in understanding the fundamentals governing the plasma spraying process and in searching for the optimized design of surface coatings in turbine machines and aircraft engines.
2. Mathematical Statement
A phase field model for this complex liquid-gas flow was developed in [21], but it was not run in parallel. This time the model is enhanced with the shared memory parallelism, OpenMP (version 4.5). Therefore, the governing equations will be briefly reviewed, with a focus on the implementation of the parallel algorithm. The governing equations are listed as follows.
2.1. Governing Equations for Drop Impact Dynamics
In Equation (1), is the phase field, with c = 1 denoting gas and c = 0 liquid herein. is the chemical potential, where F is the total free energy functional and defines the variational derivative [21]. In Equation (3), signifies surface tension. is a source term and will be defined later. is the Newtonian stress tensor and the local gravitational acceleration. Density ρ and viscosity μ have been recast as functions of the order parameter .
The subscripts g and l indicate gas and liquid, respectively. The liquid fraction λ is defined below
where is the melting point of a liquid and a quite small temperature interval. Moreover, in Equation (4), stands for the heat capacity at constant pressure, for temperature, and k for thermal conductivity. L represents the latent heat of solidification.
Flow near a solidifying front is assumed to be a porous media flow. A source term is thus incorporated into Equation (3).
in which is a rather large number to suppress all the other momentum sources when the liquid fraction is approaching zero, while , on the contrary, is a quite small number to avoid division by zero. The readers are referred to [21] for the explanation of other parameters.
2.2. Boundary and Initial Conditions
Boundary conditions are implied in Figure 1. Note that only a quarter of computational domain is calculated. Specifically, XY and ZY are symmetry planes, with all the others being walls. Homogeneous Neumann boundaries are applied to all the variables, except the velocity on planes of symmetry and walls and the order parameter c on plane ZX, where a static contact angle is enforced [7]. Briefly, the order parameter c on the substrate surface satisfies , where and n is the unit normal outwards. gives the liquid-solid interfacial tension and produces the gas-solid interfacial tension , the two deciding the static contact angle through Young’s equation . In addition, measures the gas-liquid interfacial thickness, is the gas-liquid interfacial tension, and .
Thermal contact resistance is taken into account, with a large value between the gas and the substrate and with a small one between the drop and the substrate. Initially, the drop is sitting ~8Δx, or 3.2 μm, above the substrate, with an impacting velocity ranging from subsonic to supersonic. The substrate is preheated to 423 K [21], and the drop and surrounding gas are at the same temperature at the beginning.
2.3. Finite Difference Solution Enhanced with OpenMP
Discretized with the explicit finite difference method, the governing equations are solved on a half-staggered grid. The pressure-velocity coupling is decoupled using the explicit projection method. Central difference and upwind schemes are employed to tackle diffusion and convection terms, respectively.
Given the large number of grid nodes involved, the inhouse code written with Fortran is reinforced using the shared-memory parallelism, OpenMP. A final word on the parallel computing of the pressure Poisson equation. A simple yet efficient parallel version of SOR (Successive Over Relaxation) based on the Red/Black ordering is utilized, with the relaxation factor being 1.8 herein. The heat equation, Equation (4), is also solved using an iterative method. Its serial algorithm was summarized in [22]. The parallel version is built by adding the OpenMP directives outside the Do loop regardless of data dependency. Because of the high nonlinearity, an under-relaxation factor of 0.35 is used therein. Moreover, the commercial software Simply Fortran (version 2.41) is employed to compile and run the code in a parallel fashion.
3. Results and Discussion
This section begins with a mesh sensitivity study, where the effect of interface thickness or grid spacing is examined. In what follows, emphasis is given to the spreading and solidification dynamics of YSZ and Ni under different temperatures and impact velocities. Table 1 gives the thermophysical parameters used in simulations. Thermal contact resistance is fixed to 1 × 10⁻⁸ m2·K/W throughout.
3.1. Mesh Sensitivity Study: Subsonic YSZ Drop Impact
In phase field modeling, the Cahn number (Cn = ξ/D) gives the relative importance of interface thickness, measured by ξ, and certain characteristic length scales, for instance, drop diameter D. This section thus examines the effect of mesh size, or interface thickness ξ, on the numerical outcome. It is noted that ξ is adjusted linearly with respect to mesh size, denoted by Δx, if a Cartesian grid uniform and equal in all directions is employed. Notice also that in all the cases, ξ = Δx/2, indicating that 4~5 grid points span the diffuse interface layer, if defined as 0.05 < c < 0.95. Moreover, there are 15, 30, and 60 cells across drop diameter, respectively, in Figure 2. Numerical configurations are as follows: Drop diameter is 12 μm and the impacting velocity is 100 m/s. The contact angle is set to 140°. The readers are referred to [21] for details. The time step Δt is chosen out of the CFL condition, where Δt~Δx/Vmax, with Vmax being the maximum global speed. A simple calculation gives Δt~10−10 s for the coarse and medium grids and Δt~10−11 s for the fine grid.
A first glance tells that no obvious discrepancy exists in droplet profile, even for the coarse grid of Cn = 1/30. At 0.1 μs, the droplet is involved in the early spreading process, but it has completed the spreading phase before 0.3 μs. Subsequently, under the combined action of surface tension and solidification, its profile changes little. Figure 3 displays the temperature distribution for Cn = 1/30 and Cn = 1/60 at 0.6 μs.
Figure 4 shows the comparison of spread factors under different Cn. The spread factor is defined as the ratio of the changing drop diameter to its initial diameter. Notice that the changing drop diameter is tracked along the positive x axis. Since time is counted when the drop is released above the substrate, the symbols in Figure 4 all have a discontinuity.
Figure 4, however, unveils evident disagreement among various Cn. For the coarse grid of Cn = 1/30, the maximum spread factor is 2.4, and for the medium grid of Cn = 1/60, it is 2.73, and for the fine grid, it is 2.9. The largest relative error is about 20.83%. In this YSZ drop impact, the Reynolds number, measuring the relative importance of inertial force and viscous force, Re = ρVD/μ, turns out to be 254.24. In the literature, a number of empirical formulas have been proposed to predict the maximum spread factor, with the aReb type for inertia-dominated impacts [23]. Using this correlation, it is found that satisfying agreement could be achieved if a = 0.925 and b = 0.2, such a combination yielding a maximum spread factor of 2.80, which is quite close to the numerical prediction with Cn = 1/60 and which is not far away from the case with Cn = 1/120. However, given the formidable, demanding resources for 3D calculations and computational efficiency, the grid of Cn = 1/60, or Δx = 0.4 μm, is utilized throughout the paper.
Another matter of concern is the phase field mobility M, which has not been understood fully up to this point [19]. It may be seen as the mass diffusivity in Fick’s law. The choice of M is tricky, as it cannot be too large or too small. In the former case, mass diffusion may dampen mass convection, thus smearing the interface and causing severe mass loss; in the latter case, it may bring about unwanted deformation or computation difficulties [24]. Herein, the correlation proposed by [18] is adopted, where M~16ξ2/μe, with being the effective viscosity.
3.2. Efficiency of Parallel Algorithm
The parallel algorithm developed is to be tested in this section. The YSZ impact with Cn = 1/60 in Section 3.1 is studied. In that case, the number of total grid points is 66 × 46 × 66. The time per output with different computation cores is given below in Figure 5. Herein, the time interval of 1 μs is divided into 80 subintervals, and after each subinterval, a file will be output. It is to be noted that the working station has only 24 physical cores, but with the Hyper-Threading technique, a total of 48 visual cores is available. The number of cores in Figure 5 refers to that of visual cores.
Figure 5 shows that with the increase in core numbers, time reduction is satisfying only at the beginning. Moreover, when the core number reaches or comes beyond 8, the time per output is nearly constant. This is because of the overhead in the master thread’s waiting for other threads when a parallel region is ended, and a serial region is to be encountered. Moreover, the number of grid points in testing the parallel efficiency is about 0.2 million, which may not be sufficient to bring out the advantages of the model. Given this, the speed-up of two is still acceptable.
3.3. Solidification Impediment for Drop Spreading
Compared with YSZ, which is used as a coating material in aircraft engines or turbomachines, Ni has a larger thermal conductivity, a lower viscosity, and a much higher surface tension coefficient. On the contrary, YSZ has a smaller thermal conductivity, a higher viscosity, and a moderate surface tension coefficient. These differences may lead to distinct spreading and solidification behaviors under practical plasma spraying conditions. For YSZ drop impact, solidification is safely assumed to occur after spreading is complete [21]. Even if a little portion of melt close to the substrate has been solidified during spreading, fluid flow is not influenced dramatically as if the drop spread without phase change.
This section examines the effect of solidification on the spreading dynamics of YSZ and Ni drops. In order to control the rate of solidification, a number of factors could be adjusted, such as drop temperature and thermal contact resistance. Herein, the focus is placed on drop temperature with the thermal contact resistance being fixed to 1 × 10⁻⁸ m2·K/W, indicating perfect contact between a drop and a substrate [25]. As the substrate is preheated, the adsorbed matter evaporates, resulting in a cleaner substrate surface, which will help produce dislike splats [26]. Moreover, the drop diameter is 12 μm, and the impacting velocity is 100 m/s. Figure 6 describes a sequence of snapshots showing drop profiles at different instants.
When the initial drop temperature is set to 1800 K, a little higher than its melting point, a pancake splat is formed. Nevertheless, when the temperature is raised to 3000 K, much higher than its melting point, a splash occurs, and the drop disintegrates eventually. Herein, splash is not defined as the jetting of small droplets as in other studies [27] but as “jumping of the rim” [28]. To anatomy the effect of solidification, the cross-section view is provided in Figure 7, where the blue, corresponding to λ ≦ 0.5, denotes the frozen portion, and the white, demarcating the drop and the gas, corresponds to c = 0.5.
At 0.03 μs, when the drop just begins impacting the substrate, its bottom deforms because of a high stagnation pressure developed around the impacting center due to gas viscosity and the no-slip condition imposed on the wall. At that time, the gas gap separates the drop from the substrate, excluding the possibility of heat transfer, let alone phase change. The gas beneath the drop is compressible, and it will be trapped between the drop and the substrate [29]. Air trapping is bound to happen in liquid-solid impacting. The trapped gas will then shrink into a bubble to minimize surface area. The volume of the bubble is on the order of magnitude of R3St4/3, where St = μg/ρlVR is the inverse Stokes number [30]. It is approximately 10−23 m3, too tiny to be accounted for in phase field modeling. Thus the effect of air bubbles is neglected. As time goes on to 0.1 μs, the case at 1800 K has seen a portion solidified, while the case at 3000 K witnesses no portion frozen. The drop at that time is involved in the spreading process. In other words, for Ni drop impact at 1800 K, solidification actually takes place during the spreading phase. With solidification progressing, the drop profile differs greatly at 0.3 μs, when the case at 1800 K has been frozen almost completely, with a little portion on the rim unsolidified. Moreover, the top surface is even, and the splat is of uniform thickness. On the contrary, the drop at 3000 K is flattened to a large degree, and the rim is obvious thicker due to surface tension. This could demonstrate that the spreading phase has been completed or is close to an end, and that surface energy, converted from kinetic energy, has attained an upper hand. Moreover, no portion is solidified up to this point for this case. Eventually, the drop at 1800 K solidifies fully before 0.6 μs, and the drop at 3000 K splashes, with two rims ejected on the substrate. To quantitatively describe the difference between these two cases, Figure 8 compares the spread factors.
Figure 8 shows that with a lower drop temperature, solidification could effectively inhibit drop spreading. The maximum spread factor is about 2.3. However, for the case at 3000 K, the maximum spread factor comes much higher because of splashing. It is noticeable, however, that before 0.2 μs, the spread factor evolution is nearly the same, and according to Figure 7, solidification actually occurs for the case at 1800 K. This further clarifies the relative importance of solidification and fluid motion: Even if solidification is fast, its effect could still be neglected during some time interval. The theoretically predicted maximum spread factor, based on 0.925Re0.2, turns out to be around 4.13, indicating that solidification arrests fluid motion for the case at 1800 K.
In order to check the role of solidification in the spreading of YSZ drop, a simulation was run with YSZ drop at 3000 K and impacting with 100 m/s onto a wall preheated to 423 K. The numerical outcome is provided in Figure 9.
At 0.1 μs, the drop just touches the substrate and, driven by a pressure gradient, makes its way horizontally. Pasandideh-Fard et al. [31] proposed a correlation to predict the time when the drop hits the maximum spread factor, with the critical time t* = tV0/D0 = 2.67. Simple conversion gives t = 0.32 μs, which is rather close to the numerical prediction, as derived in the spread factor evolution for this case with Cn = 1/60 in Figure 4. When time progresses to 0.3 μs, only a small portion turns solidified. Hence, though solidification occurs as early as in the spreading phase, it could not inhibit YSZ drop spreading because of a lower heat transfer rate. Subsequently, with the combined action of surface tension and solidification, the drop profile takes on a pancake shape but with a thickened rim, which is visually recognizable. This could still be ascribed to a lower heat transfer rate so that surface tension could have time to round and thicken the rim. The total solidification time could be estimated from a correlation in [32].
where is the kinetic coefficient [33], heat transfer coefficient, thermal conductivity of the substrate, H substrate thickness, splat thickness, the melting point, and substrate temperature. In this simulation, H~10 μm, δ~1 μm. Substitution into Equation (9) yields t~1 μs, confirming the validity of the proposed model. Figure 10 gives the velocity field at particular instants.
Figure 10 shows that at 0.1 μs when the drop just starts the spreading process, there is a vortex around the spreading front. This is because as the spreading front penetrates farther into the gas, the gas above the spreading front would be accelerated via its viscosity. Another vortex is found near the upper border. This is due to the existence of the vortex previously mentioned. When time progresses to 0.6 μs, nearly half the drop has solidified, and the number of vortexes increases to three since the spreading front acts like a vortex shedding tool herein.
To sum up, a distinct difference exists between Ni and YSZ drop impacts under practical plasma spraying conditions. Solidification could be neglected during YSZ drop impact because of a lower thermal conductivity, while it must be taken into consideration for Ni drop impact due to a much higher heat extraction rate from Ni drop to the substrate.
3.4. Effect of Velocity on Droplet Spreading
In the last section, attention is riveted to the role of solidification in drop-spreading dynamics. Through the comparison of Ni and YSZ drop impacts, it is found that solidification exerts no obvious effect on YSZ drop spreading. Herein, emphasis is placed on the effect of kinetic energy on drop spreading. Figure 11 delineates the YSZ drop profile under different impacting velocities at various instants. The drop diameter is still 12 μm, with an initial temperature of 3000 K.
Usually, with increased kinetic energy, the drop would extend farther. In the first column in Figure 11, the drop is involved in different phases, with the 100 m/s case being at the initial spreading stage and the 500 m/s being close to the end of spreading. Notice that the rim is thickened only for the 500 m/s case. As time progresses to 0.3 μs, the spreading phase is ended, with the thickened rims observed almost in all the cases, except the 100 m/s case, which is still spreading. Splashing occurs only for the 500 m/s impact. The splashing herein is not about the jetting of small droplets off the rim, as stated before. For phase-field modeling to capture daughter droplets in three dimensions, the mesh should be fine enough to resolve the smallest length scales. The computation demand is thus nearly formidable to date, even with the advanced strategy of adaptive mesh refinement or of GPU computing [34]. At 0.6 μs, the drop completes spreading in all the cases, and its profile changes little.
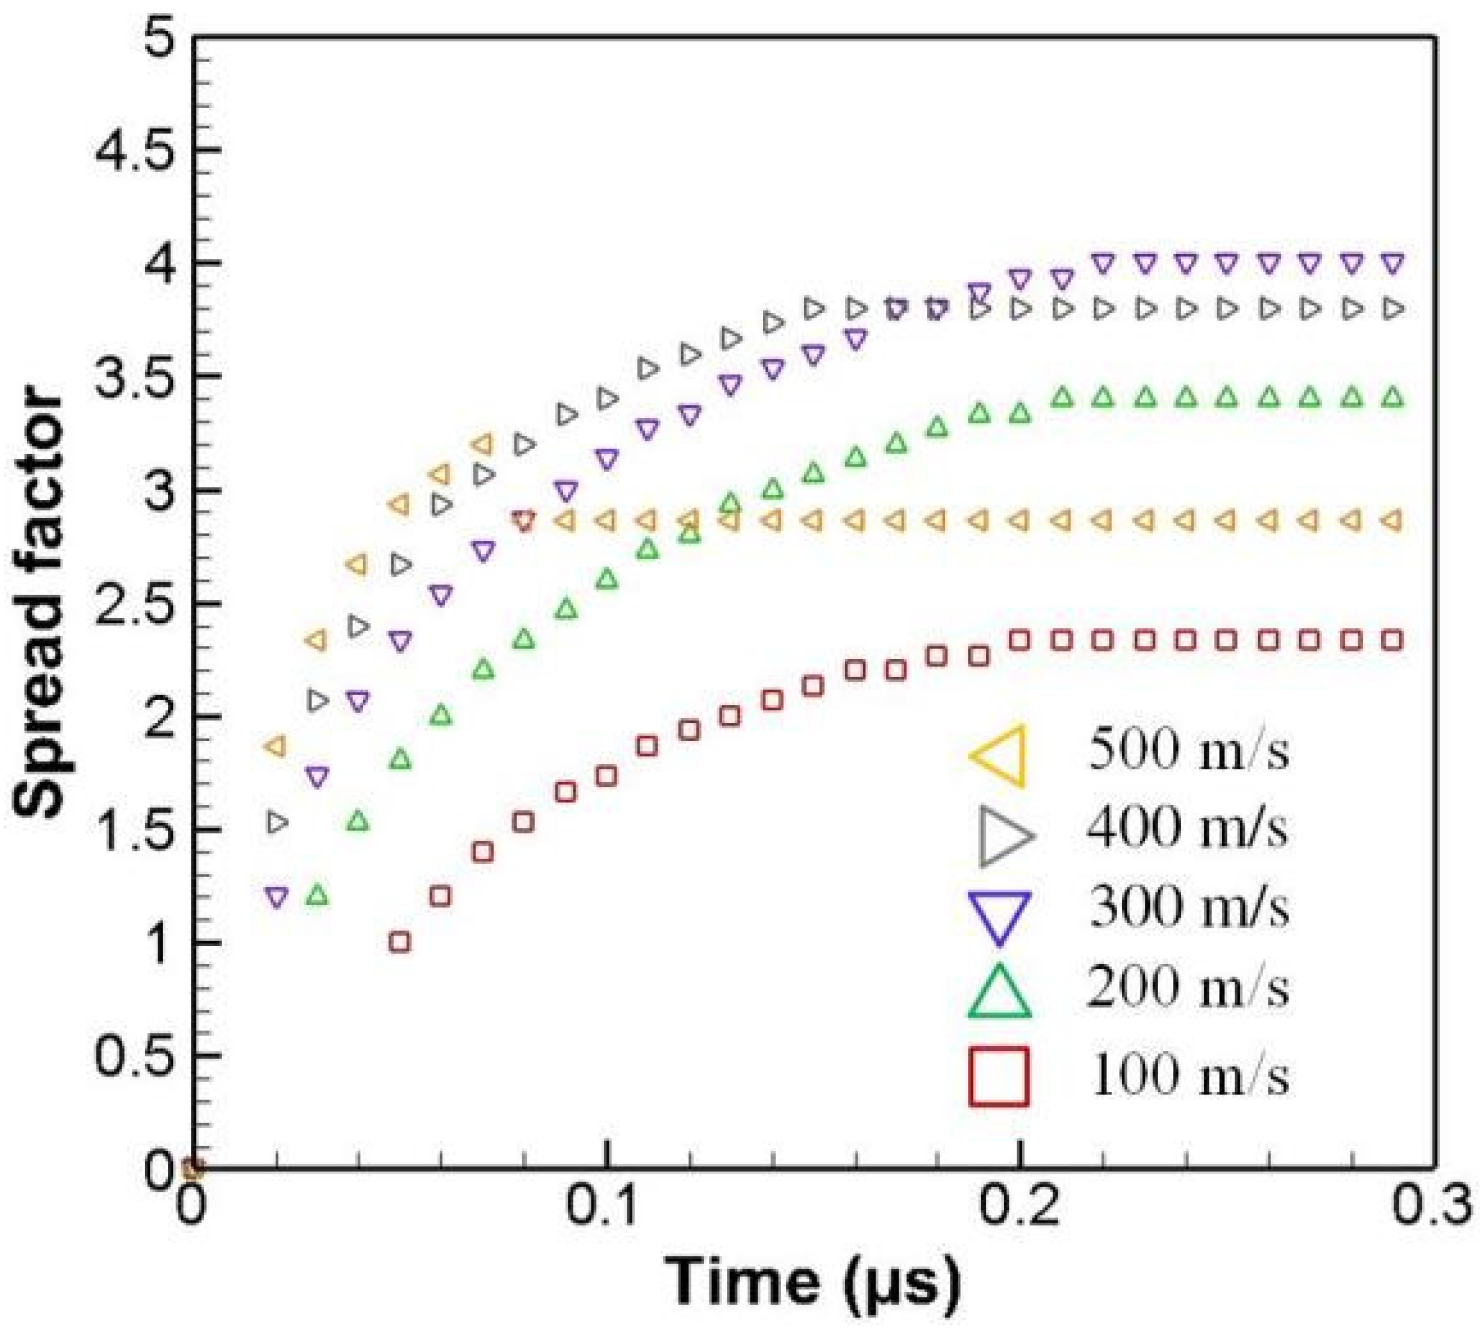
Figure 12 tells the spread factor evolution for different impacting velocities. The maximum spread factor increases with respect to the impacting velocity. The maximum spread factors are tracked to be 2.73, 3, 3.13, 3.27, and 3.43, all within 15% of the theoretical predictions of 0.925Re0.2. For the spreading diameter is tracked only in the x direction, or precisely the positive x axis, the plummet of it for the 500 m/s is understandable accordingly. Moreover, with increased impacting velocities, the critical time hitting the maximum spreading factor is also evident in Figure 12. After hitting the maximum extent, the spread factors are kept fixed, indicating that solidification works to inhibit drop spreading.
To summarize, for YSZ drop impact under practical circumstances, phase field modeling could capture the spreading and splashing dynamics, and solidification works mostly after spreading but before retracting so that further rebounding is inhibited.
Next, attention is directed to Ni drop impact, which has a higher Reynolds number due to a larger density and a smaller viscosity. It is noticed that the drop diameter is the same as the YSZ drop and that the initial temperature is fixed to 1800 K. Other numerical configurations are unaltered, with the numerical outcome given in Figure 13.
Figure 13 displays a much faster spreading process for Ni drops. Solidification completes within 0.3 μs, only half of that for YSZ drops. Splashing is also observed for the 500 m/s case. It may be initiated at 0.07 μs when four slits emerge along the rim. As the drop is still with impelling kinetic energy, the melt along the rim is ejected, leaving a square-like splat at 0.3 μs. In the last column, the final splat profile takes on a square shape for the 200 m/s to 400 m/s cases. Though overall speaking, the splat resembles a square, its core still takes on a circular shape. If the portion beyond the inner core is completely ejected, then the final splat is disk-like as well.
It is probable that this special splat shape is due to the combined action of solidification and fluid motion. If the fluid motion is not impelling, such as in the 100 m/s case, the final splat morphology is still circular. If it is energetic, splashing will occur, resulting in a fragmented shape as in the 500 m/s case. Nevertheless, the inertial force is not as strong as expected, and fluid motion is only partially restricted by solidification, leading to such a square-like splat.
Figure 14 shows the spread factor evolution for different impacting velocities. The maximum spread factor increases with respect to the impacting velocity. Interestingly, the maximum spread factors are almost equal for the 300 and 400 m/s cases. The maximum spread factors are tracked to be 2.33, 3.4, 4, 3.8, and 2.87, all deviating much from the theoretical predictions of 0.925Re0.2. It thus demonstrates this correlation could only be applied to cases without significant solidification.
4. Conclusions
A parallel version of a phase field model for heavy metal impact under practical thermal spraying conditions was proposed. The major findings are as follows: The model exists with sound parallel efficiency; Solidification inhibits Ni drop spreading under practical circumstances while exerting few effects on YSZ drop spreading because Ni is more thermally conductive. For drops of diameter 12 μm and of an impacting velocity of 100 m/s, solidification time is about 0.6 μs for YSZ and 0.3 μs for Ni. The predicted maximum spread factor for YSZ drop impact agrees quite well with existing theoretical predictions. The time to hit the maximum spread factor is on the order of magnitude of 0.1 μs for the conditions considered in this paper. Moreover, splashing could be captured using this model, even if in the form of a jumping rim, and data dependency in parallel computing is tolerable in this study.
Author Contributions
Supervision, B.Q.L.; Writing—original draft, M.S. All authors have read and agreed to the published version of the manuscript.
Funding
This research is supported by the Department of Education of Jiangsu Province, China (Grant No. 21KJB460034).
Institutional Review Board Statement
Not applicable.
Informed Consent Statement
Not applicable.
Data Availability Statement
Not applicable.
Conflicts of Interest
The authors declare no conflict of interest.
References
- Kim, J. Phase-Field Models for Multi-Component Fluid Flows. Commun. Comput. Phys. 2012, 12, 613–661. [Google Scholar] [CrossRef]
- Scardovelli, R.; Zaleski, S. Direct numerical simulation of free-surface and interfacial flow. Annu. Rev. Fluid Mech. 1999, 31, 567–603. [Google Scholar] [CrossRef]
- Lee, D.; Kim, J. Comparison study of the conservative Allen-Cahn and the Cahn-Hilliard equations. Math. Comput. Simul. 2016, 119, 35–56. [Google Scholar] [CrossRef]
- Yue, P. Thermodynamically consistent phase-field modelling of contact angle hysteresis. J. Fluid Mech. 2020, 899, A15. [Google Scholar] [CrossRef]
- Yang, C.; Li, S.; Wang, X.; Wang, J.; Huang, H. Phase-field simulation of multi-phase interactions in Fe-C peritectic solidification. Comput. Mater. Sci. 2020, 171, 109220. [Google Scholar] [CrossRef]
- Mirjalili, S.; Ivey, C.B.; Mani, A. A conservative diffuse interface method for two-phase flows with provable boundedness properties. J. Comput. Phys. 2019, 401, 109006. [Google Scholar] [CrossRef]
- Jacqmin, D. Contact-line dynamics of a diffuse fluid interface. J. Fluid Mech. 2000, 402, 57–88. [Google Scholar] [CrossRef]
- Alshehry, A.S.; Imran, M.; Shah, R.; Weera, W. Fractional-View Analysis of Fokker-Planck Equations by ZZ Transform with Mittag-Leffler Kernel. Symmetry 2022, 14, 1513. [Google Scholar] [CrossRef]
- Alshehry, A.S.; Imran, M.; Khan, A.; Shah, R.; Weera, W. Fractional View Analysis of Kuramoto-Sivashinsky Equations with Non-Singular Kernel Operators. Symmetry 2022, 14, 1463. [Google Scholar] [CrossRef]
- Xiao, J.; Pan, F.; Xia, H.; Zou, S.; Zhang, H.; George, O.A.; Zhou, F.; Huang, Y. Computational Study of Single Droplet Deposition on Randomly Rough Surfaces: Surface Morphological Effect on Droplet Impact Dynamics. Ind. Eng. Chem. Res. 2018, 57, 7664–7675. [Google Scholar] [CrossRef]
- Mukhtar, S.; Shah, R.; Noor, S. The Numerical Investigation of a Fractional-Order Multi-Dimensional Model of Navier-Stokes Equation via Novel Techniques. Symmetry 2022, 14, 1102. [Google Scholar] [CrossRef]
- Jacqmin, D. Calculation of Two-Phase Navier-Stokes Flows Using Phase-Field Modeling. J. Comput. Phys. 1999, 155, 96–127. [Google Scholar] [CrossRef]
- Ding, H.; Spelt, P.D.; Shu, C. Diffuse interface model for incompressible two-phase flows with large density ratios. J. Comput. Phys. 2007, 226, 2078–2095. [Google Scholar] [CrossRef]
- Shao, J.Y.; Shu, C. A hybrid phase field multiple relaxation time lattice Boltzmann method for the incompressible multiphase flow with large density contrast. Int. J. Numer. Methods Fluids 2015, 77, 526–543. [Google Scholar] [CrossRef]
- Zhan, C.; Chai, Z.; Shi, B. Consistent and conservative phase-field-based lattice Boltzmann method for incompressible two-phase flows. Phys. Rev. E 2022, 106, 025319. [Google Scholar] [CrossRef] [PubMed]
- Amiri, H.A.; Hamouda, A. Evaluation of level set and phase field methods in modeling two phase flow with viscosity contrast through dual-permeability porous medium. Int. J. Multiph. Flow 2013, 52, 22–34. [Google Scholar] [CrossRef]
- Zu, Y.Q.; He, S. Phase-field-based lattice Boltzmann model for incompressible binary fluid systems with density and viscosity contrasts. Phys. Rev. E 2013, 87, 043301. [Google Scholar] [CrossRef]
- Yue, P.; Zhou, C.; Feng, J.J. Sharp-interface limit of the Cahn-Hilliard model for moving contact lines. J. Fluid Mech. 2010, 645, 279–294. [Google Scholar] [CrossRef]
- Magaletti, F.; Picano, F.; Chinappi, M.; Marino, L.; Casciola, C.M. The sharp-interface limit of the Cahn-Hilliard/Navier–Stokes model for binary fluids. J. Fluid Mech. 2013, 714, 95–126. [Google Scholar] [CrossRef]
- Gruszczyński, G.; Mitchell, T.; Leonardi, C.; Łaniewski-Wołłk, Ł.; Barber, T. A cascaded phase-field lattice Boltzmann model for the simulation of incompressible, immiscible fluids with high density contrast. Comput. Math. Appl. 2019, 79, 1049–1071. [Google Scholar] [CrossRef]
- Shen, M.; Li, B.Q.; Yang, Q.; Bai, Y.; Wang, Y.; Zhu, S.; Zhao, B.; Li, T.; Hu, Y. A modified phase-field three-dimensional model for droplet impact with solidification. Int. J. Multiph. Flow 2019, 116, 51–66. [Google Scholar] [CrossRef]
- Voller, V.; Swaminathan, C.R. A general source-based method for solidification phase change. Numer. Heat Transfer Part B Fundam. 1991, 19, 175–189. [Google Scholar] [CrossRef]
- Li, C.-J.; Li, J.-L. Transient Contact Pressure During Flattening of Thermal Spray Droplet and Its Effect on Splat Formation. J. Therm. Spray Technol. 2004, 13, 229–238. [Google Scholar] [CrossRef]
- Zhou, C.; Yue, P.; Feng, J.J.; Ollivier-Gooch, C.F.; Hu, H.H. 3D phase-field simulations of interfacial dynamics in Newtonian and viscoelastic fluids. J. Comput. Phys. 2010, 229, 498–511. [Google Scholar] [CrossRef]
- Vardelle, M.; Leger, A.C.; Fauchais, P.; Gobin, D. Influence of particle parameters at impact on splat formation and solidification in plasma spraying processes. J. Therm. Spray Technol. 1995, 4, 50–58. [Google Scholar] [CrossRef]
- Fauchais, P.; Fukumoto, M.; Vardelle, A. Knowledge Concerning Splat Formation: An Invited Review. J. Therm. Spray Technol. 2004, 13, 337–360. [Google Scholar] [CrossRef]
- Jian, Z.; Josserand, C.; Popinet, S.; Ray, P.; Zaleski, S. Two mechanisms of droplet splashing on a solid substrate. J. Fluid Mech. 2017, 835, 1065–1086. [Google Scholar] [CrossRef]
- Zhang, Q.; Qian, T.; Wang, X.-P. Phase field simulation of a droplet impacting a solid surface. Phys. Fluids 2016, 28, 022103. [Google Scholar] [CrossRef]
- Liu, Y.; Tan, P.; Xu, L. Compressible air entrapment in high-speed drop impacts on solid surfaces. J. Fluid Mech. 2013, 716, R9. [Google Scholar] [CrossRef]
- Mandre, S.; Brenner, M.P. The mechanism of a splash on a dry solid surface. J. Fluid Mech. 2011, 690, 148–172. [Google Scholar] [CrossRef]
- Pasandideh-Fard, M.; Qiao, Y.M.; Chandra, S.; Mostaghimi, J. Capillary effects during droplet impact on a solid surface. Phys. Fluids 1996, 8, 650–659. [Google Scholar] [CrossRef]
- Shen, M.; Li, B.Q.; Bai, Y. Numerical modeling of YSZ droplet impact/spreading with solidification microstructure formation in plasma spraying. Int. J. Heat Mass Transf. 2020, 150, 119267. [Google Scholar] [CrossRef]
- Wang, G.-X.; Goswami, R.; Sampath, S.; Prasad, V. Understanding the Heat Transfer and Solidification of Plasma-Sprayed Yttria-Partially Stabilized Zirconia Coatings. Mater. Manuf. Process. 2004, 19, 259–272. [Google Scholar] [CrossRef]
- An, S.; Zhan, Y.; Yao, J.; Yu, H.; Niasar, V. A greyscale volumetric lattice Boltzmann method for upscaling pore-scale two-phase flow. Adv. Water Resour. 2020, 144, 103711. [Google Scholar] [CrossRef]
Figure 1.
Schematic of the problem, with the blue denoting substrate.
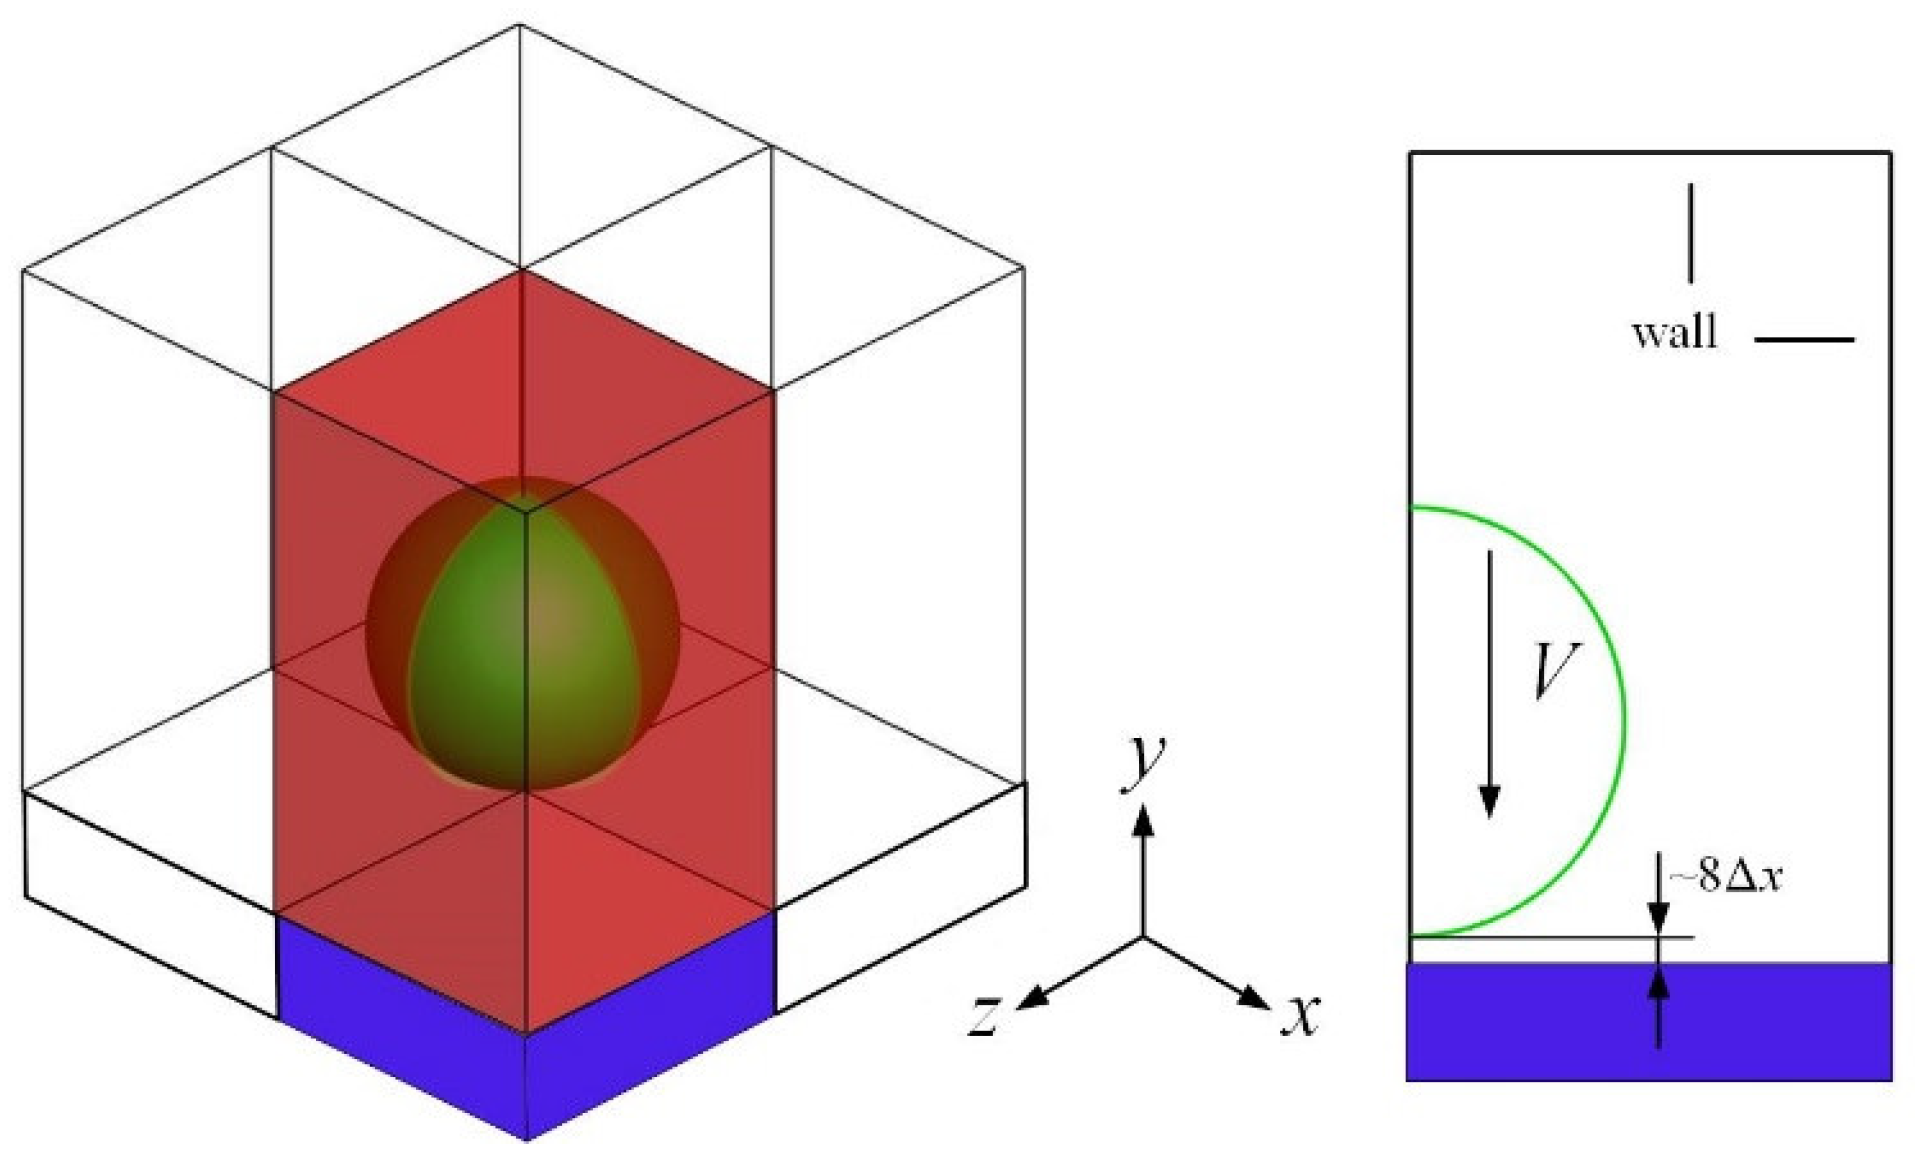
Figure 2.
Mesh independence test: spreading and solidification.

Figure 3.
Temperature distribution for (a) Cn = 1/30 and (b) Cn = 1/60 at 0.6 μs. The white contour denotes drop profile and the temperature is measured in K. The substrate surface is denoted in black.
Figure 3.
Temperature distribution for (a) Cn = 1/30 and (b) Cn = 1/60 at 0.6 μs. The white contour denotes drop profile and the temperature is measured in K. The substrate surface is denoted in black.

Figure 4.
Spread factor evolution for the mesh independence test.
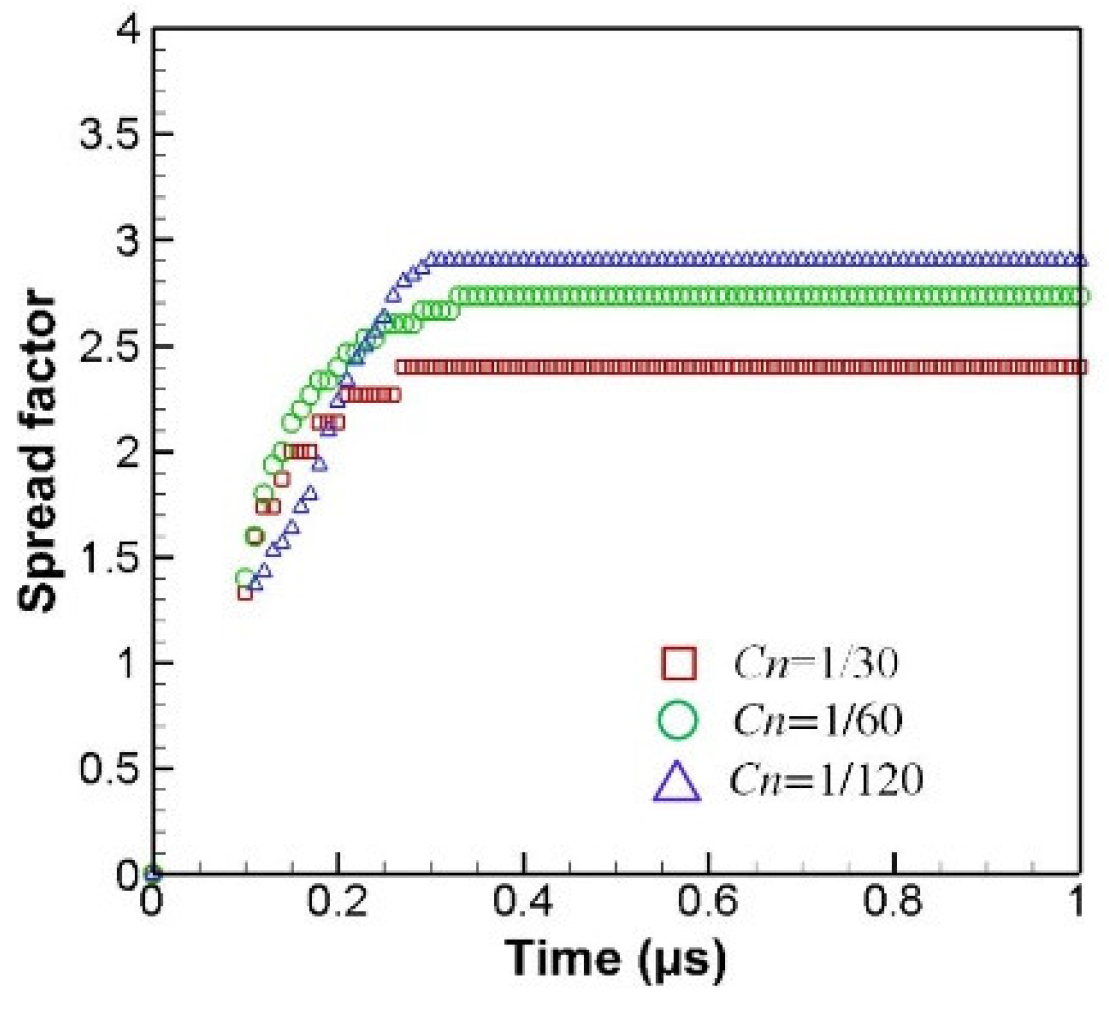
Figure 5.
Efficiency of the parallel algorithm.
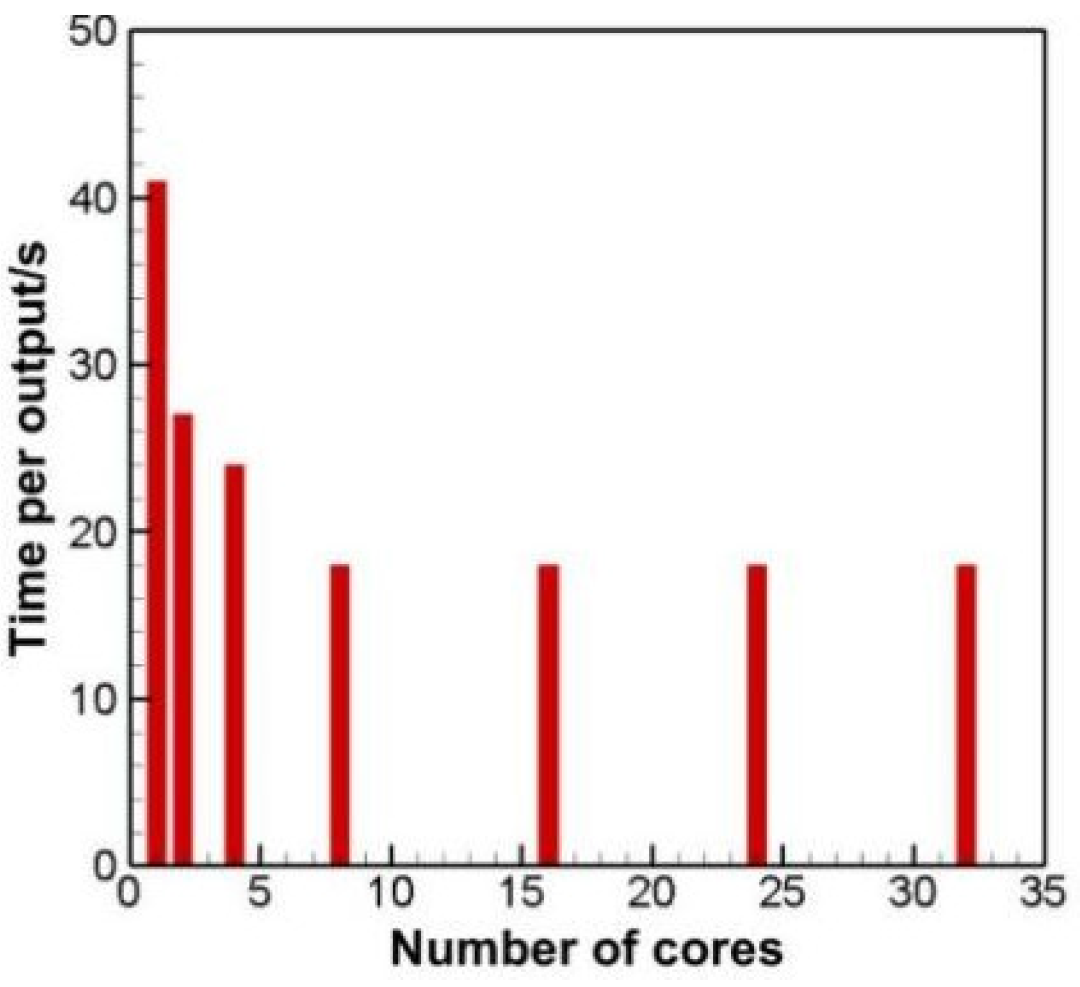
Figure 6.
Solidification arresting Ni drop spreading.
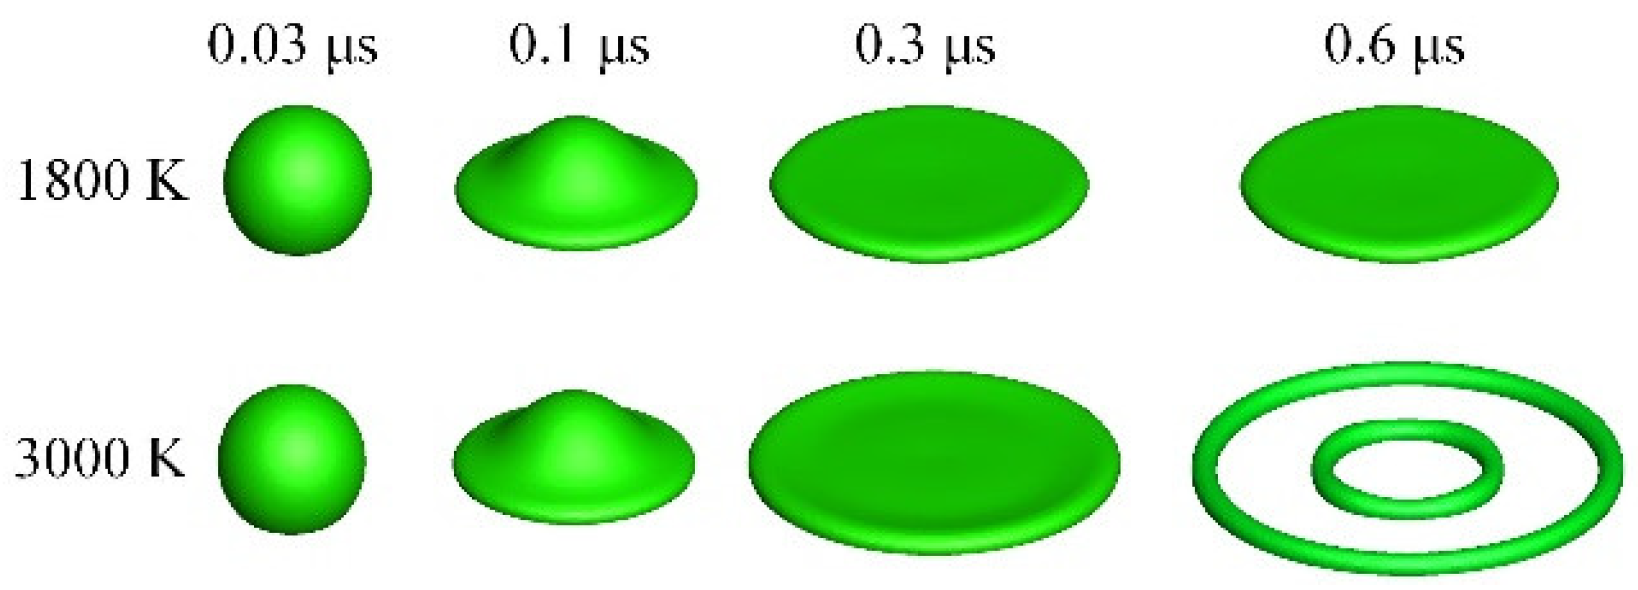
Figure 7.
Evolution of spreading and solidification for Ni drop at different initial temperatures. The white iso-contour is of c = 0.5 and the blue indicates the frozen portion.
Figure 7.
Evolution of spreading and solidification for Ni drop at different initial temperatures. The white iso-contour is of c = 0.5 and the blue indicates the frozen portion.

Figure 8.
Spread factor evolution for Ni drop at different initial temperatures.
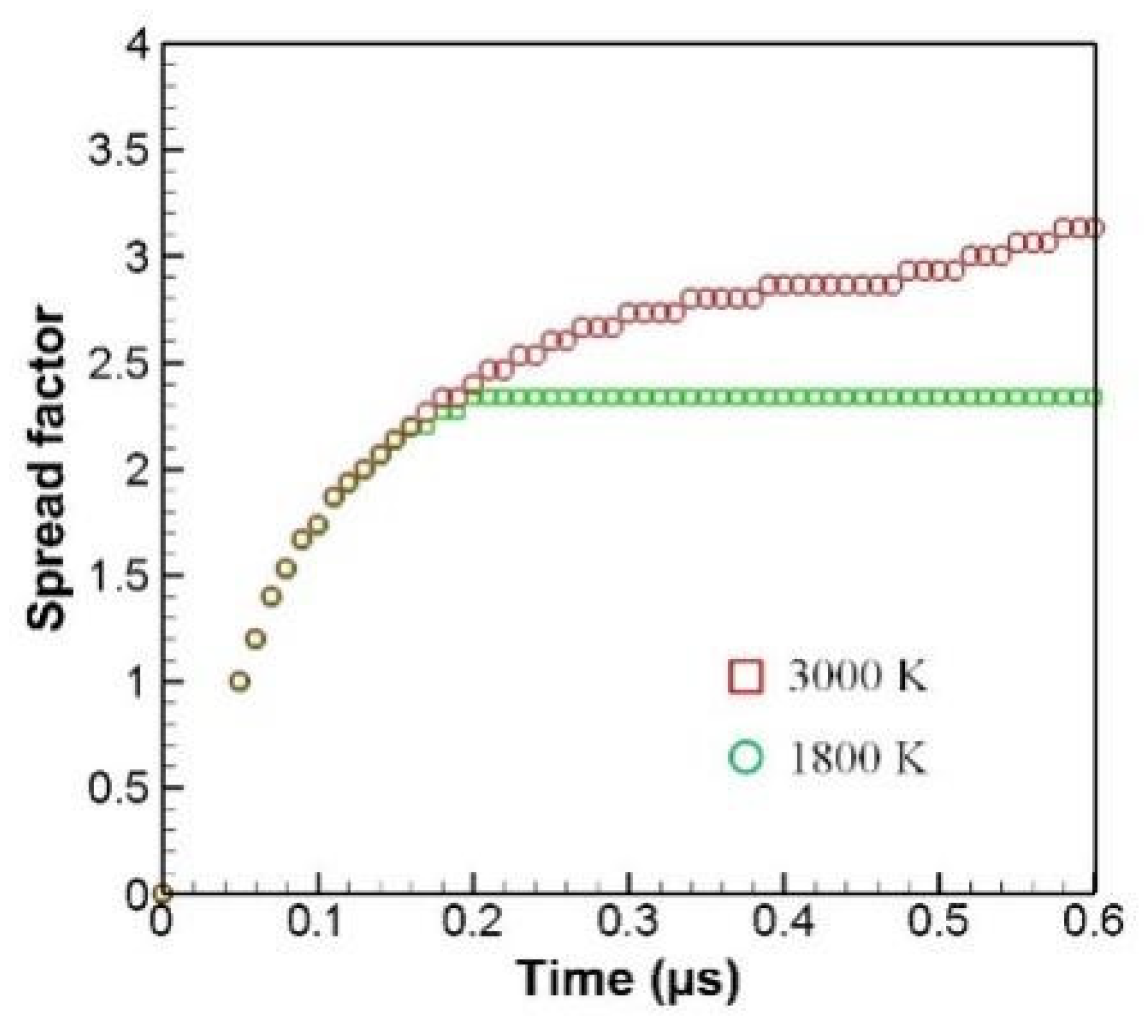
Figure 9.
A sequence of snapshots of YSZ drop spreading and their cross-sectional views.

Figure 10.
Velocity field at (a) 0.1 μs and (b) 0.6 μs for the YSZ drop impact.

Figure 11.
Effect of velocity on YSZ drop spreading.
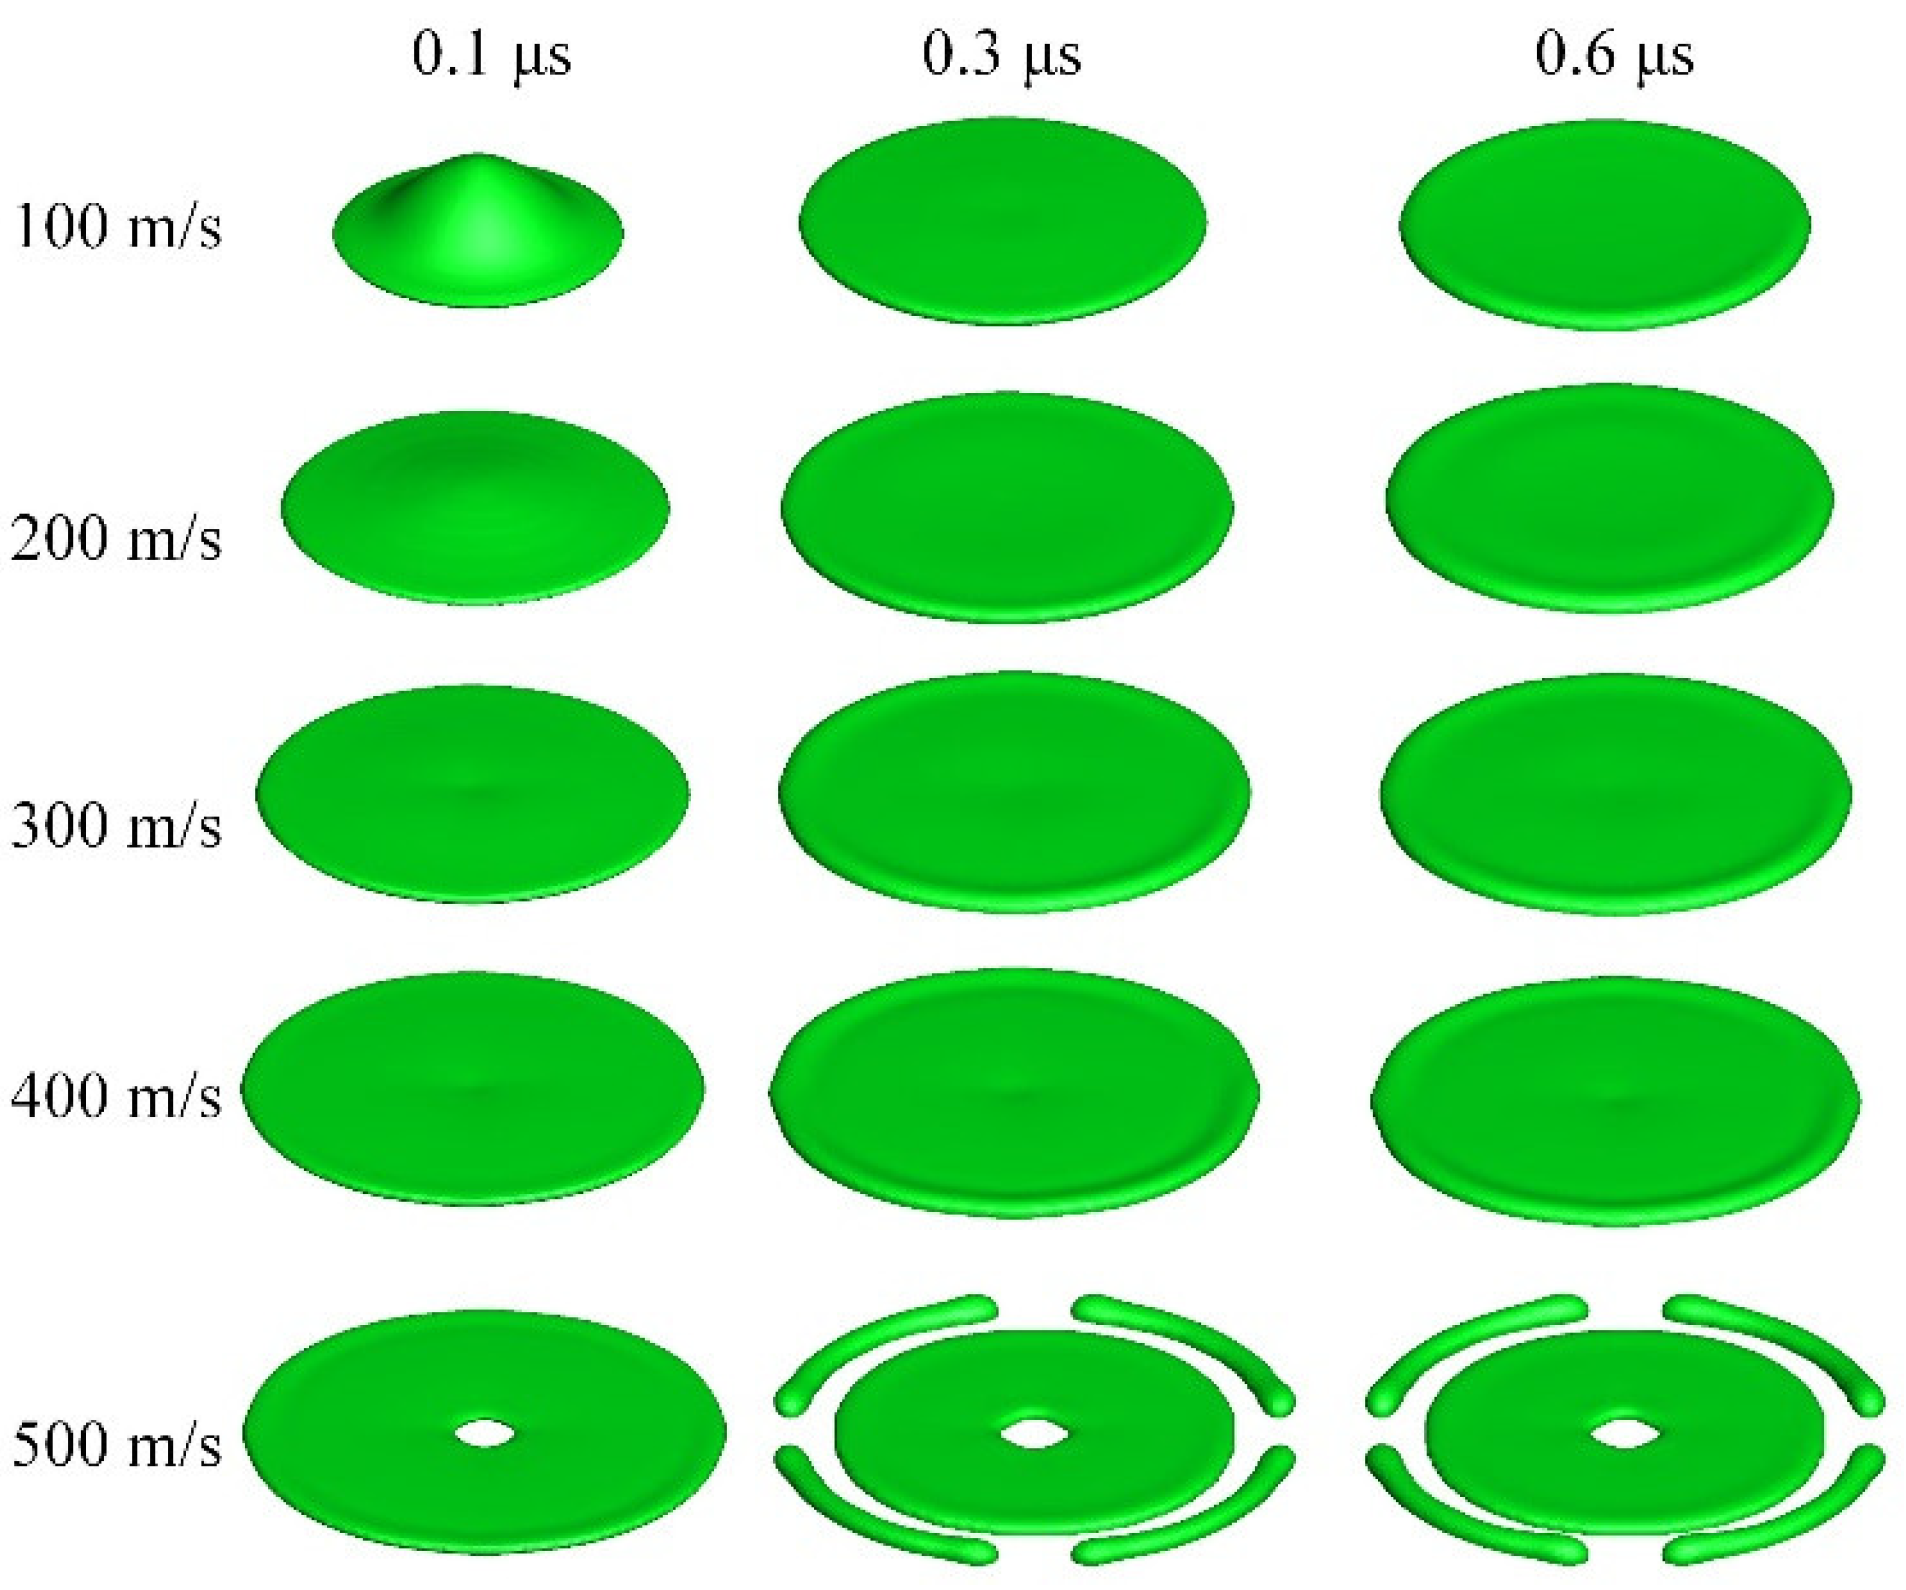
Figure 12.
Spread factor evolution for YSZ drop at different velocities.

Figure 13.
Effect of velocity on Ni drop spreading.
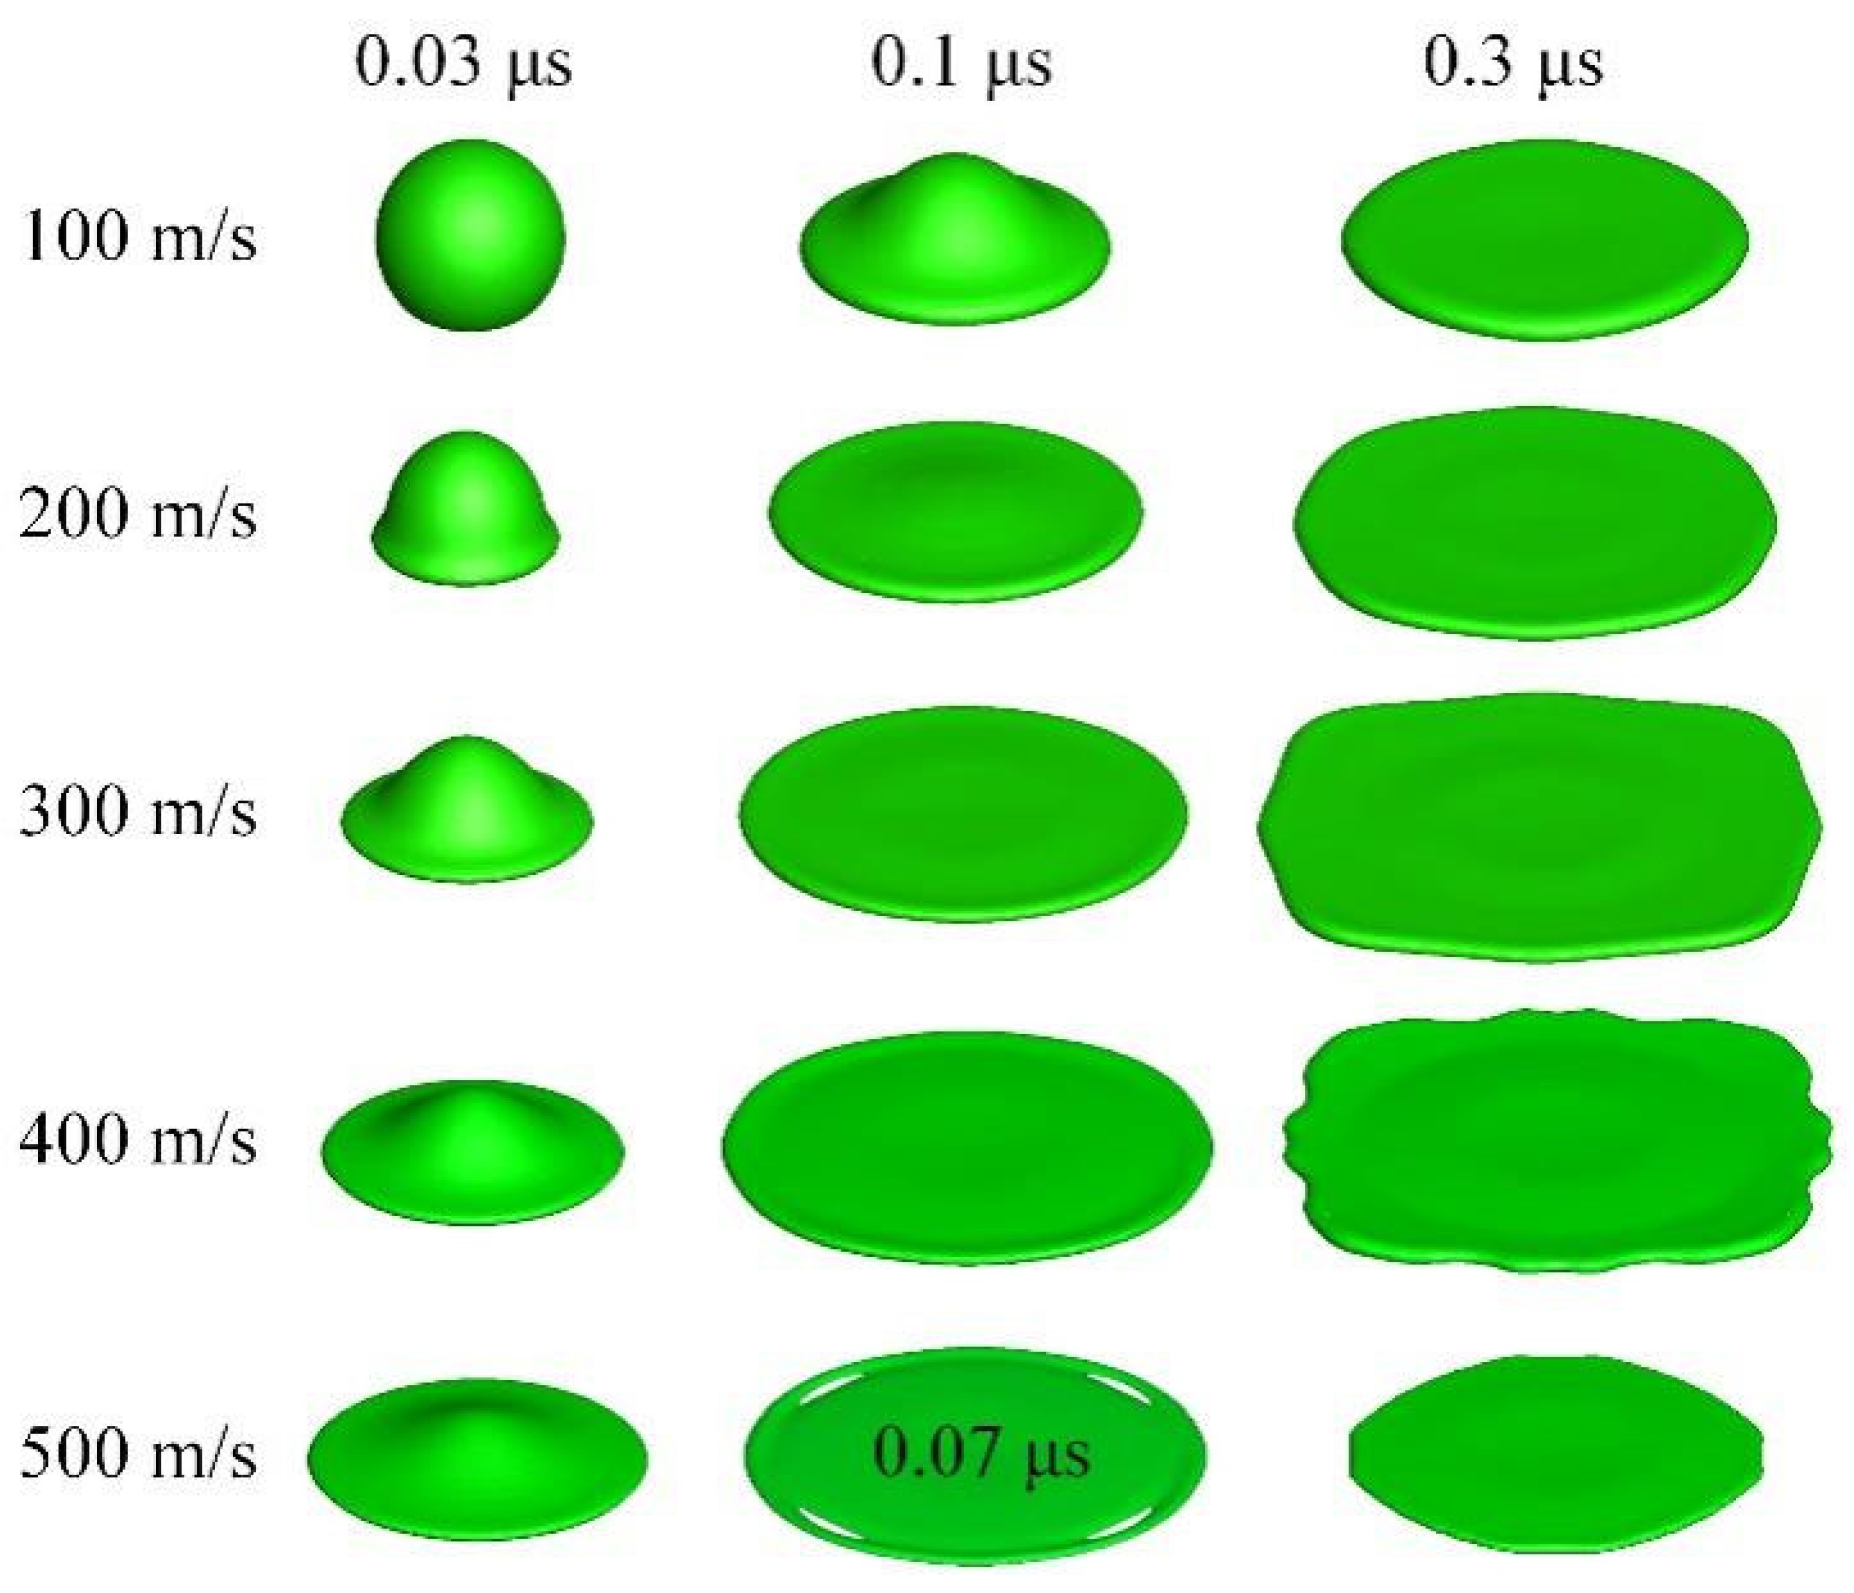
Figure 14.
Spread factor evolution for Ni drop at different velocities.

Table 1.
Thermophysical parameters used in simulations.
| Parameters | Ni | YSZ | Air | Substrate |
|---|---|---|---|---|
| 8900 | 5890 | 1.18 | 8400 | |
| ) | 562 | 713 | 1006 | 575 |
| ) | 71.8 | 2.32 | 0.0263 | 18.8 |
| ) | 6 | 27.8 | 0.0185 | - |
| Surface tension (N/m) | 1.8 | 0.43 | - | - |
| ) | 292 | 707 | - | - |
| Melting point (K) | 1726 | 2923 | - | - |
Publisher’s Note: MDPI stays neutral with regard to jurisdictional claims in published maps and institutional affiliations. |
© 2022 by the authors. Licensee MDPI, Basel, Switzerland. This article is an open access article distributed under the terms and conditions of the Creative Commons Attribution (CC BY) license (https://creativecommons.org/licenses/by/4.0/).
Share and Cite
MDPI and ACS Style
Shen, M.; Li, B.Q. A Phase Field Approach to Modeling Heavy Metal Impact in Plasma Spraying. Coatings 2022, 12, 1383. https://doi.org/10.3390/coatings12101383
AMA Style
Shen M, Li BQ. A Phase Field Approach to Modeling Heavy Metal Impact in Plasma Spraying. Coatings. 2022; 12(10):1383. https://doi.org/10.3390/coatings12101383
Chicago/Turabian StyleShen, Mingguang, and Ben Q. Li. 2022. "A Phase Field Approach to Modeling Heavy Metal Impact in Plasma Spraying" Coatings 12, no. 10: 1383. https://doi.org/10.3390/coatings12101383
Note that from the first issue of 2016, this journal uses article numbers instead of page numbers. See further details here.