
Fabrication of Particle-Stacking Microporous Metal Using Laser Powder Bed Fusion
1
School of Mechatronic Engineering and Automation, Foshan University, Foshan 528225, China
2
Ji Hua Laboratory, Foshan 528200, China
3
School of Mechanical and Automotive Engineering, South China University of Technology, Guangzhou 510640, China
*
Authors to whom correspondence should be addressed.
Coatings 2024, 14(3), 348; https://doi.org/10.3390/coatings14030348
Submission received: 3 February 2024
/
Revised: 11 March 2024
/
Accepted: 12 March 2024
/
Published: 14 March 2024
(This article belongs to the Section Laser Coatings)
Abstract
:Laser powder bed fusion can fabricate porous structures through lattices, but the preparation of micropores (<50 μm) with a specific pore distribution remains a challenge. Microporous 316L was fabricated by controlling the melting and solidification behavior of the particles using laser energy. The laser energy density was not a determining factor for the porosity and micropore formation, except for the single-factor condition. The high-speed scanning mode required a higher laser power to disorder the pore distribution, whereas low-speed scanning with a low laser impact on the stacking particles formed organized pores. The hatch distance significantly affected the pore distribution and pore size. The pore distribution in the XY plane was organized and homogenous, with channeled pores mainly interconnected along the laser scanning tracks, whereas in the Z direction, it showed a relatively disordered distribution, mainly linked along the layered direction. The microporous 316L displayed a mean pore size and median pore size of 10–50 μm with a high-percentage size distribution in 1–10 μm, a controllable porosity of 17.06%–45.33% and a good yield strength of 79.44–318.42 MPa, superior to the lattice porous 316L with 250.00 MPa at similar porosity.
1. Introduction
Owing to the existence of pores, porous metallic materials give them the dual attributes of being structural and functional [1,2], which has attracted much attention in recent years. With many extraordinary characteristics, such as low relative density, large specific surface area, lightweight, sound insulation, and energy absorption, porous metals are widely applied in lightweight [3,4], medical implants [5,6,7], filtration and separation [8,9], sound absorption and noise reduction [10,11,12], heat exchange [13,14,15] and battery catalysis [16,17]. Therefore, a porous structure with channeled pores and pore sizes less than 100 μm plays a particularly important role in physical and chemical performance owing to the excellent connectivity and high specific surface area of the micropores. For instance, interconnected micropores in catalysis with specific channels, allowing media such as gases or liquids to pass through, can increase the effective diffusion rate of ions and gas media and improve the electrochemical reaction rate with a large specific surface area [18].
Many conventional methods for fabricating metallic porous structures include foaming, templating, sponge replication, and dealloying [19,20,21]. However, these traditional techniques often have drawbacks, such as complex processes, lengthy lead times, high overall costs, and the need for sophisticated equipment. Therefore, a simple, effective, and rapid method is required for producing microporous metallic materials. Fortunately, additive manufacturing (AM), also known as three-dimensional (3D) printing, offers a new alternative for the rapid construction of porous metals. Laser powder bed fusion (LPBF) [22] is a mature commercial additive manufacturing technique that enables the single-step creation of complex components. Consequently, LPBF has become popular and reliable for the fabrication of porous metals with lattice structures. Studies have reported the successful manufacture of porous metals with various structures [23,24,25,26,27]. However, lattice porous structures are typically limited to the millimeter scale, with a low specific surface area [23,24,25,26,27,28], which restricts the further application of LPBF for the production of porous structures. Very few attempts have been made to fabricate micropores smaller than 50 μm and design pores with specific configurations using LPBF printing. Robinson et al. [29] combined selective laser melting (SLM) with small surrogate modeling to prepare an antiviral Cu W Ag microporous architecture with a limit pore size of 80 μm. However, the creation of smaller pores through lattice modeling is extremely difficult.
When using LPBF to fabricate dense metal materials, it is common to observe the generation of numerous micropores when the applied laser energy is insufficient. For example, Shrivastava et al. [30] investigated the influence of the LPBF process parameters on the interface characteristics of LPBF Inconel 718, revealing the behaviors of remelting, solidification and the formation mechanism of lack-of-fusion porosity. Consequently, some researchers have attempted to control the melting, fusion, and solidification processes of metals to produce micropores using low laser energy density conditions rather than relying on lattice structures. For instance, Kim et al. [31] fabricated microporous Ti using a low energy-density process below the threshold required for the complete melting of Ti. Similarly, Li et al. [32] prepared the porous Ti6Al4V with micropores by adjusting the laser hatch spacing for a low laser energy density and revealed the relationship between porosity and tensile strength. However, these studies did not investigate the relationship between the pore distribution in structure and the laser energy, nor did they explore the effect of laser parameters on the pore size and size distribution, which are crucial for micropore formation and customizing pore configurations. In addition, the formation mechanism of pores with different morphologies has not yet been elucidated. Therefore, it is necessary to investigate the production of interconnected pores with regular and controllable pore distribution using a specific laser parameter set. Such investigations will enable the production of metal components with tailored microstructures and improved mechanical properties, which will be beneficial for various applications.
In this study, we employed LPBF parameters to attain a specific laser energy that allowed us to regulate the melting, overlapping (fusion), and stacking of metal particles. By stacking molten particles with a considerably lower degree of fusion than that required for fully densified fusion, we successfully prepared a microporous metal with a controllably organized distribution of channeled micropores. This differs from the micropores that result from the residual gas trapped within the melt. As a typical material for LPBF printing, 316L stainless steel was selected. The effects of the printing parameters on the porosity, pore distribution of locations in the structure, pore size, and size distribution were investigated. The formation mechanism of pores with different morphologies was revealed. The compressive performance of the microporous structure was evaluated and compared to that of the lattice-porous 316L. This work provides a simple and effective way to prepare microporous metal structures using LPBF, which may be significantly instructive and a promising solution for customizing pore configurations and even for the preparation of gradient microporous structures.
2. Materials and Methods
2.1. Fabrication of Particle-Stacking Microporous 316L
The raw powder used in this experiment was 316L stainless-steel powder (15–53 μm, Jiangsu Vilory Advanced Materials Technology Co., Ltd. Xuzhou, China) with good sphericity (see the details in Figure 1a), good flowability (≤18 s 50−1 g), and high packing density (≥4.10 g·cm−3). The compositions of the 316L powder are listed in Table 1. The printer used in this experiment was an AmPro SP100 system (Suzhou AmPro Ltd., Suzhou, China) with an Nd: YAG fiber laser of wavelength 1.06 μm, laser power up to 200 w, laser scanning speed of up to 2000 mm·s−1, and layer thickness of 10–50 μm. Microporous cubic 316L specimens (10 mm × 10 mm × 10 mm) were built on the same material substrate without any preheating, and three of them were fabricated for each parameter set. The detailed printing process was as follows. First, a layer of microporous structure with a certain degree of “particle-to-particle” overlapping was formed after specific laser scanning, where the metal particles underwent rapid melting and solidification as a result of the superfast heating and cooling of the laser with a high laser-induced heating temperature of up to 105 K and a rapid cooling rate of up to 106–7 K·s−1 [33]. Next, these layered porous structures were stacked layer by layer to form a bulk porous metallic material with the desired micropores. As shown in Figure 2, the pore distribution in the structure, pore size, and size distribution are closely associated with laser energy, which can be determined with the main printing parameters (e.g., laser power, laser scanning speed, hatch distance, and layer thickness). The relationship between the laser power and laser energy supplied to the powder particles through conduction is the most direct because it determines the total energy per unit area of the powder particles. No other parameter, except laser power, can directly affect the total energy supply. Other factors, such as laser scanning speed, hatch distance, and layer thickness, can indirectly affect the energy received by the particles. The laser scanning speed determines the contact time between the laser and particle, and a faster scanning speed leads to a shorter contact time and less energy transmission. The hatch distance determines the distribution of laser energy on the particles per unit area, and a larger hatch distance results in less energy being allocated to the particles per unit area. The thickness of the layer determines the number of particles per unit volume that receive a specific laser energy. A thicker layer implies that more particles per unit volume receive energy, which, in turn, leads to less average energy being allocated to each particle. The entire printing process was conducted under high-purity nitrogen with an oxygen content below 100 ppm in the printing chamber to protect the 316L metal powder from oxidation.
The LPBF-printed particle-stacking porous samples of 316L are shown in Figure 1b, with no obvious visible cracks or defects on the flat surfaces.
2.2. Characterization
To evaluate the porosity of the samples, three specimens were prepared for each parameter set and meticulously polished on all sides. The polished samples were then precisely weighed using an electronic balance with an accuracy of 0.001 g to determine their bulk weight (Wbulk), and their bulk volume (Vbulk) was calculated based on their three-dimensional dimensions (measured using a micrometer with an accuracy of 0.001 mm). The volume density (), or relative density, was determined using Equation (1). Finally, the porosity (Pporosity) was obtained using Equation (2) [34]:
where , Pporosity, Vbulk, Wbulk, and represent volume density (or relative density), porosity, bulk volume, bulk weight, and theoretical density, respectively. All measurements and calculations were conducted with a precision of up to two decimal places.
Morphological observations of the cross-sections of microporous 316L were performed using an optical microscope (OLYMPUS GX53, Evident, Tokyo, Japan), and the morphology of the 316L powders was observed using scanning electron microscopy (SEM, NOVA NANOSEM 430, FEI, Hillsboro, TX, USA). The pore size and size distribution were measured using the post-processing software package ImageJ 1.8.0 (NIH, Bethesda, Rockville, MD, USA). The three-dimensional microstructure was determined using computed tomography (CT) images obtained using a 3D X-ray microscope (Xradia 620 Versa, ZEISS, Oberkochen, Germany) with a nominal ultimate resolution of up to 0.5 μm. The CT parameters employed were as follows: tube voltage, 150 kV; power, 23 w; integration time, 2 s, 4× objective; voxel resolution, 3.75 μm within a volume range of 3 × 3 × 3 mm3.
The quasi-static compressive properties of the microporous 316L samples with different porosities were tested using an electronic universal mechanical tester (CMT4303, MTS, Washington, DC, USA) at a constant load rate of 1.0 mm min−1 (strain rate of ~0.003 s−1). Compression force was applied perpendicularly to the printing plane. The compressive yield strength was calculated based on the stress–strain curves.
3. Results and Discussion
3.1. Effect of Laser Power and Laser Energy Density on Microporous Structure
Figure 3 shows the effect of laser power and the corresponding energy density on the porosity of LPBF-fabricated microporous 316L in two modes: “high-speed scanning of the equipment ultimate speed of 2000 mm·s−1 (“HS” mode for short hereafter)” and “low-speed of 600 mm·s−1 (“LS” mode for short hereafter). The porosities of the samples in the two modes first decreased sharply from an abnormally high point and then gradually leveled off. The porosity of the “HS” mode and the “LS” mode changed from the abnormally high value of 71.05% down to 17.06% and 75.82% down to 23.43%, respectively. Both modes at the low laser power (i.e., 70 w for “HS” mode and 40 w for “LS” mode) clearly showed a bad quality with some visible defects of abnormal coarse holes, having a relatively abnormal high porosity of 71.05% for “HS” and 75.82% for “LS,” which indicated that the laser energy at this low-power condition was not available for the formation of the stacking porous structure. Once upon this power (“HS” went over 70 w and “LS” over 40 w), both modes formed good-quality porous samples without any visible defects.
Aside from the abnormal porosities, it is obvious that the porosities at the two modes can be linearly fitted, as indicated by the dashed red line in Figure 3. Alongside this, fitting equations were also provided, which could be used as an instructive basis to fabricate a microporous structure with the desired porosity. The slope of the curve of the “HS” mode (value = 0.35) was lower than that of the “LS” mode (value = 0.56), which indicated that it had a wider operating laser power range for designing a desired porosity since applying the high-speed scanning mode. This may be because high-speed scanning with a lower energy density can refine the distribution accuracy of the laser energy on the particles, thereby allowing the laser energy to be controlled and distributed more precisely for each particle.
It is very interesting that all the points of the laser energy density of the “HS” mode were lower than that of “LS”, but not all the porosity of “HS” was higher. For instance, the porosity at 50 w (with laser energy density of 34.72 J·mm−3) of the “LS” mode was 28.20%, which is higher than that of “HS” at 120 w (with porosity of 25.74% and energy density of 25.00 J·mm−3) and 130 w (with porosity of 23.43% and energy density of 27.08 J·mm−3). In particular, though the energy density of “LS” at 40 w still had 27.78 J·mm−3, which is higher than that of “HS” at 120 w and 130 w, it still showed an abnormal porosity of 75.82% with visible abnormal holes, indicating the failed fabrication of the microporous structure. On the contrary, “HS” presented normal porosities until the laser energy density was down to 14.58 J·mm−3 at 70 w, which demonstrated that the condition of high energy density did not necessarily obtain a better formation than that of low energy density. According to the definition and calculation formula of the laser energy density, there are several variable factors, such as laser power, scanning speed, hatch distance, and layer thickness. Under the single-factor condition, the laser energy density can definitely and directly determine the formation of a porous structure and porosity. However, this was not the case for the two-factor condition. This illustrates that energy density was not the determining indicator, except under the condition of a single factor.
To analyze the effect of laser power on the porous structure, the morphology of the corresponding cross-sectional microstructure of the as-printed microporous 316L was examined, as shown in Figure 4. It was found that the particle-stacking microporous structure showed an irregular pore morphology formed by the interaction of “particle-to-particle” overlapping and stacking. This was quite different from the pores with a spherical morphology caused by some bubbles remaining in the molten pools because the rapid cooling rate of the laser prevented them from escaping out of the metal melts before complete solidification [35]. Typical sintered necks were clearly observed on the overlapping joints between the particles, as indicated by the yellow mark in the magnified image in Figure 4a. The pores of the “HS” mode were distributed randomly, especially in its low-power sample, which containined a lot of localized large interconnected pores. Many isolated small spherical particles were observed within the pores, indicating that they were most likely caused by the splash deposits. Many smaller spherical pores formed within the sintered struts because of rapid solidification at a high scanning speed. In the high-power sample, the number of localized large pores was clearly reduced, whereas the high power led to excessive overlapping of molten particles, resulting in the disappearance of pores within the bands. This could be confirmed by the red mark in the magnification of Figure 4b.
On the contrary, the samples of “LS” showed a homogenous distribution of pores along the uniform molten tracks with good particle melting and overlapping. There were fewer localized large pores and less-isolated spherical particles than in “HS”. Small spherical pores were not observed within the struts. The main reason may be that a large temperature gradient, strong laser impact pressure, and Marangoni flow [36,37,38] are caused by the high laser power in the “HS” mode. This had a serious impact on the 316L particles, leading to many more movements or splashes of the particles, which finally disordered the stacking pores. However, the low-speed scanning mode provided more time for the gas in the metal melts to escape before solidification. Low-speed scanning with a low impact pressure of the laser would thus be beneficial for mildly melting the particles and maintaining a good stacking state of the particles on the bed, which could result in the fabrication of a structure with orderly distributed pores along the laser scanning.
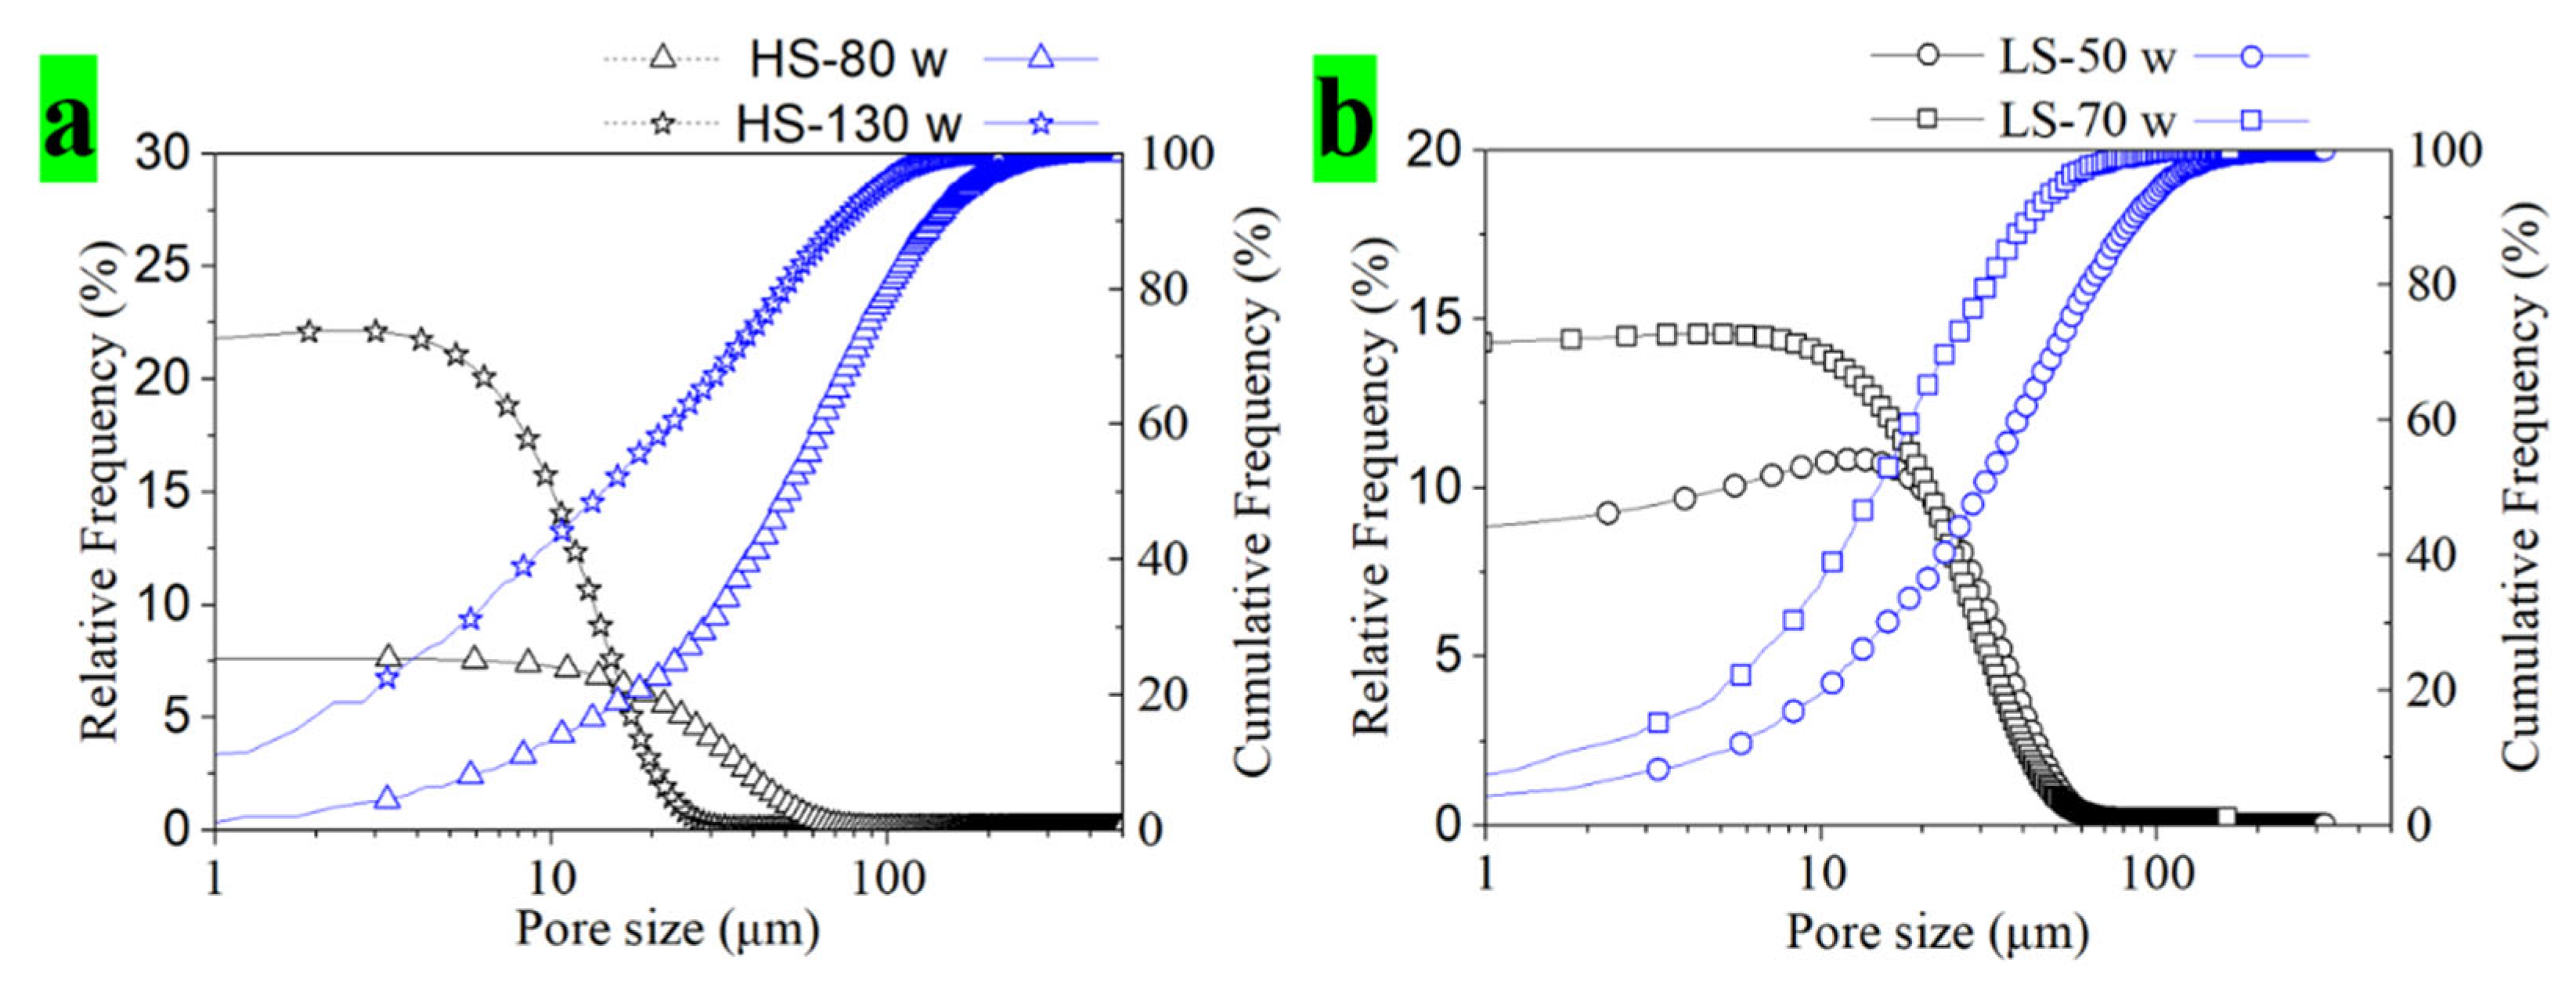
To quantify the relationship between the laser power and porous structure, the arithmetic mean particle size, median pore size, and size distribution were statistically analyzed, as shown in Table 2 and Figure 5, respectively. Almost all arithmetic diameters of the pores built with particle stacking were less than 100 μm. The mean particle size was larger than the median pore size of D50. With an increase in laser power, both pore sizes decreased transparently, in agreement with the porosity. As seen from the size distribution, all samples showed a semi-Gaussian distribution concentrated on the left side, with a near-horizontal variation at 1–10 μm, indicating a high percentage of small-sized pores with a size distribution of 1–10 μm. When the pores were larger than 10 μm, the relative proportion began to decrease slowly. The pore size in the “LS” mode decreased significantly from (D50) 30.00 μm to 14.75 μm and (D90) 85.50 μm to 73.75 μm, with an increase in laser power from 50 w to 70 w. On the other hand, the pore size in the “HS” mode decreased from 50.75 μm (D50) to 14.00 μm and from 135.75 μm (D90) to 72.75 μm as the laser power increased from 80 w to 130 w. In particular, the sample of the “HS” mode with low laser power at 80 w showed a much larger pore size, with an obviously wider pore size distribution compared with the other samples. There were some large pores, larger than approximately 500 μm, which corresponded to the massive localized large pores owing to the low laser energy density supplied by the laser, as shown in Figure 4a.
3.2. Effect of Laser Scanning Speed on Microporous Structure
Based on the “LS” mode with an ideal pore distribution, as previously discussed, we attempted to raise the porosity and, meanwhile, further optimize the pore structure by appropriately increasing laser scanning speed. Figure 6 shows the porosity of microporous 316L fabricated with a fixed laser power of 60 w, and the laser scanning speeds varied from 600 mm·s−1 to 1400 mm·s−1 at 200 mm·s−1 intervals. With the increase in laser scanning speeds, the porosity increased from 27.03% to 72.11%, which is much higher than that of “LS”. This is because increasing the scanning speed reduces the contact time between the laser and particles at constant laser energy, which indirectly decreases the amount of energy received by the particles per unit time. It is worth noting that the porosity increased by 57.08% when the laser scanning speed increased from 1200 mm·s−1 to 1400 mm·s−1. However, the porosity increased by only 17.31% when the laser scanning speed increased from 1000 mm·s−1 to 1200 mm·s−1 with the same increment. This corresponds to the macroscopic defects of abnormal holes (see the red mark in Figure 6) generated owing to some unmelted particles with insufficient laser energy when the laser scanning speed increased to 1400 mm·s−1, which indicates that the particle-stacking porous structure could not be formed normally beyond this speed.
Figure 7 shows the cross-sectional morphologies of the microstructures at different laser scanning speeds. As expected, pores with an irregular morphology were distributed homogenously and orderly along the scanning tracks when the laser scanning speed was less than 1200 mm·s−1. Compared with the sample printed at a scanning speed of 1400 mm·s−1 (with macroscopic defects of abnormal holes, as shown in Figure 6), although no macroscopic defects were found on the surface of the sample at a laser scanning speed of 1200 mm·s−1, many abnormally localized large pores with sizes of approximately 500 μm and massive isolated unmelted particles within the pores were observed. This indicated that the pores could maintain a small size and a good distribution when the scanning speed was below 1000 mm·s−1.
Table 3 lists the pore sizes corresponding to the cross-sectional porous structures obtained at different laser scanning speeds. With the increase in laser scanning speeds, the pore size increased from 28.00 μm (D50) to 55.75 μm and from 84.25 μm (D90) to 159.25 μm. The pore size of D50 increased 38.51% from 40.25 μm to 55.75 μm as the scanning speed increased from 1000 mm·s−1 to 1200 mm·s−1. However, it could be observed that a relatively large increment in the pore size of D90 increased by 68.07% from 94.75 μm to 159.25 μm. This corresponded to a microstructure with massive localized large pores at a scanning speed of 1200 mm·s−1, as shown in Figure 7c.
Figure 8 shows the size distribution at different laser scanning speeds. Similarly, the pore size distributions showed the same semi-Gaussian distribution, concentrated on the left side, indicating that the porous structures also had a high percentage of fine pores. With the increase in scanning speed, the percentage of pores distributed in the small size range (<100 μm) gradually decreased, and on the other hand, large pores continuously appeared, even some localized large pores over 500 μm.
3.3. Effect of Hatch Distance (HD) and Layer Thickness (LT) on Microporous Structure
Figure 9 shows the porosity of microporous 316L printed with different hatch distances at a scanning speed of 600 mm·s−1 and layer thicknesses of 30 μm and 42 μm. As the hatch distance increased, the porosity of the samples fabricated with an LT of 30 μm showed a tendency to first increase rapidly and then gradually level off. However, the porosity of the samples with an LT of 42 μm was extremely high at an HD of 0.14 mm. This may be related to the growth of pores with increasing hatch distances. On the one hand, the increase in HD decreased the laser energy distribution per unit area, and on the other hand, the intervals between adjacent molten pools were enlarged. Likewise, for a large layer thickness, less laser energy was allocated for each particle because more particles per unit volume had to be heated, resulting in more unmelted particles with a higher occurrence of large localized pores and abnormal porosity.
Correspondingly, the microstructures of the microporous 316L samples fabricated with different HD at two LTs of 30 μm and 42 μm are shown in Figure 10. All pores displayed irregular morphologies distributed homogenously along the molten tracks and laser scanning routes (see further details in the magnifications). The distances between the two adjacent molten tracks were consistent with the set HD used in the printing parameter, as verified by the red dashed lines in the magnifications in Figure 10a–d. With increasing HD, the porous structure changed from a particle-stacking net porous structure with small pores to large interconnected pores, illustrating that the pore structure can be arranged using the laser-scanning routes. Comparing the two LT samples, a large LT indicates that less energy is distributed per particle, making localized large pores more likely to appear, which agrees with the porosity results.
Table 4 and Figure 11 display the pore size and size distribution of the samples fabricated with hatch distances (HDs) of 0.08 mm and 0.14 mm at layer thicknesses (LTs) of 30 μm and 42 μm, respectively. As the HD increased from 0.08 mm to 0.14 mm, the pore sizes of the samples printed with an LT of 30 μm exhibited a significant increase. Specifically, the pore size in D50 increased by 61.76% from 25.50 μm to 41.25 μm, while the pore size in D90 increased by 40.61% from 65.25 μm to 91.75 μm. In contrast, the samples printed with an LT of 42 μm showed a more modest increase in the pore size of D50, which increased by only 21.19% from 37.75 μm to 45.75 μm, while the pore size in D90 largely increased by 67.69%. This indicated the presence of many more localized large pores. The pore size distribution exhibited a semi-Gaussian distribution with a concentration on the left side and a particularly high percentage of pores distributed in the range of approximately 10–50 μm. However, the size distribution below 10 μm was significantly reduced, indicating that the pore size controlled by HD was more concentrated and uniform. In comparison, the sample printed with an LT of 42 μm at an HD of 0.14 mm showed a clear lower distribution percentage of small-sized pores but a higher size distribution over 100 μm, which is related to the formation of localized large pores, as discussed in the microstructure.
3.4. Three-Dimensional Pore Structure
To observe the overall pore structure, the three-dimensional microstructure of microporous 316L was examined using a 3D X-ray microscope, as shown with the computed tomography in Figure 12. The CT image showed that the sample formed a microporous structure with interconnected pores. The pores in the XY plane (Figure 12b) were evenly distributed along the direction of the laser scanning routes and were mainly interconnected along the molten tracks, whereas those in the planes (Figure 12c,d) in the Z direction showed a relatively disordered distribution and were mainly linked along the layered direction. Within the pores, many unmelted particles were adsorbed on the struts. Struts formed by particle-to-particle overlap in the molten tracks and layer textures were clearly observed. Comparatively, the distribution of the struts in the XY direction, dominated by low laser power, rapid laser scanning, and large hatch distance, was more organized than those determined by the layer thickness and laser impacting pressure in the Z direction, indicating that the pore distribution was more controllable in the horizontal direction by controlling the laser scanning route with proper laser parameters.
3.5. Compressive Performance of Particle-Stacking Microporous 316L
The compressive performance of microporous 316L samples LPBF-fabricated at scanning speeds of 600, 800, 1000, and 1200 mm·s−1 and porous 316L prepared by combining LPBF with lattice modeling (i.e., lattice porous 316L) was evaluated for comparison. The stress-strain compressive curves are plotted in Figure 13. All samples exhibited an elastic linear rising stage, a long period of inclined plastic yielding stage, and a dramatic dropping stage, in accordance with the compressive stress-strain curve of a typical porous metallic material [28,39,40]. This indicates that the pores in the structure can absorb part of the loading energy before being completely fractured. It can also be observed that the periods of the inclined plastic yielding stage and energy-absorbing dropping stage of the sample with a porosity of 28.02% were longer than those of the other samples, indicating longer plastic deformation and worse buffer effect because of its low porosity. With an increase in porosity, the compressive performance of the samples decreased, which was in agreement with the Ashby and Gibson model [41] of the relationship between porosity and mechanical properties.
The compressive yield strengths of the particle-stacking microporous structure clearly decrease from 318.42 MPa to 79.44 MPa, with the porosity ranging from 28.02% to 45.33%, which could be attributed to large pores generally yielding ahead of the finer pores under the stress concentration. As the porosity increases, the amount and thickness of the strut walls acting as support skeletons in the architecture would reduce, generating numerous microcracks, where local stress concentrations are created and serve as locations of failure initiation upon mechanical loads in the end [35,42]. A comparison of the compressive yield strength of lattice porous 316L with a similar porosity of 29.05% was considered. Interestingly, the yield strength was 250.00 MPa lower than that of the particle-stacking microporous sample with a porosity of 28.02%, showing a yield strength of 318.42 MPa. In particular, even the sample with higher porosity (34.15%) still showed a yield strength of 271.71 MPa, which is slightly higher than that of the 316L lattice sample and much higher than that of the porous 316L (only 79 MPa) prepared by the conventional method of foam replication [43]. These results indicate that microporous 316L fabricated with laser melting and particle stacking has more advantages in terms of compressive performance. The particle-stacking microporous structure had more fine pores and a few localized large pores without systematic orientation and uneven pore surfaces, which better satisfied the conditions of the Ashby and Gibson model [44] and may contribute to a higher compressive strength. Conversely, the lattice porous structure had more homogenous and larger lattice-designed pores with a systematic orientation, which might have a detrimental effect on the mechanical properties.
The corresponding deformation mode of the compressed samples exhibited a different fracture morphology from the typical shear fracture upon compression (i.e., the samples with a porosity of 28.02% to 38.64%) to a destructive deformation of the bulk integrated collapse (i.e., the sample with a porosity of 45.33%), as shown in Figure 13c, which illustrates an intergranular fracture feature [43]. It is worth noting that the porous 316L sample fabricated with a lattice structure showed integral bending deformation without fracture, indicating quite different deformation mechanisms of the skeletons between the particle-stacking porous and lattice porous structures under compression. The lattice porous 316L with a lower yield strength, however, still showed compressed deformation of integral bending without generating any fractures, indicating good toughness of the lattice porous material, which might be related to its denser struts.
In summary, the findings of our study on microporous structures did not perfectly align with the theoretical model, which featured a completely aligned pore distribution with an absolutely uniform pore size. This discrepancy was attributed to various factors, such as the size homogeneity and sphericity uniformity of the particles, laser output stability, uniformity of the laser energy distribution, and particle migration owing to the real gas field. Furthermore, human error, measuring equipment accuracy, and environmental conditions such as room temperature and humidity may have contributed to errors in the tested data. However, we have developed a simple, efficient, and rapid approach for fabricating microporous metals with specific porosities, pore distributions, pore sizes, and size distributions controlled using laser energy. Our method allows the customization of pore configurations with more refined laser parameters, such as interconnected pores, as channels for enhancing the mass transfer rates [45]. These controllable pore characteristics with variable sizes and distributions are crucial for applications such as electrochemistry, catalysis, filtration, and separation. In the future, we plan to systematically investigate the performance of these applications involving gas or liquid flow through specific channeled pores.
4. Conclusions
316L with a microporous structure was successfully fabricated by controlling the melting and overlapping behaviors of 316L particles using the characteristics of superfast heating and cooling of the laser energy. The main conclusions are as follows.
- Overall, the particle-stacking microporous 316L possessed interconnected pores distributed homogenously, with a controllable normal porosity ranging from 17.06% to 45.33%, a pore size of D50 that is less than 50 μm and that of D90 that is less than 100 μm, and a high percentage of fine micropores distributed in the pore size of 1–10 μm in the semi-Gaussian distribution. The pores in the XY plane were evenly distributed along the direction of the laser scanning routes and were mainly interconnected along the molten tracks, whereas the pore distribution in the Z direction was relatively disordered and mainly linked along the layered direction.
- The laser energy density was not a determining indicator of the porosity or the formation of microporous structures. The high-speed scanning mode showed a general effect on the porosity variation, but it required high laser power for the formation of a porous structure, which might have disrupted the pore structure. In contrast, low-speed scanning weakened the impact of the laser energy on the stacking particles and formed pores distributed along the laser scanning tracks with an organized pore arrangement. The narrow hatch distance could contribute to the stacking of a net porous structure with small pore size, whereas a wide distance was beneficial for forming a particle-stacking porous structure with large interconnected pores.
- With a variation in porosity from 28.02% to 45.33%, the yield strength of microporous 316L varied from 318.42 MPa to 79.44 MPa, showing a higher compressive yield strength compared with the lattice porous 316L with similar porosity.
Author Contributions
Methodology, J.Q.; Formal analysis, J.Q.; Investigation, J.Q. and X.X.; Writing—original draft, J.Q.; Writing—review & editing, X.C. and Y.W.; Supervision, Y.L. All authors have read and agreed to the published version of the manuscript.
Funding
This work was supported by the National Natural Science Foundation of China (Grant No.: 52075421), Guangdong Basic Applied Basic Research Foundation (Grant No.: 2020B1515130002), and Ji Hua Laboratory Project (Grant No.: X202331TM200).
Institutional Review Board Statement
Not applicable.
Informed Consent Statement
Not applicable.
Data Availability Statement
Data are contained within the article.
Conflicts of Interest
The authors declare no conflict of interest.
References
- Balakrishnan, H.K.; Doeven Egan, H.; Merenda, A.; Dumée, L.F.; Guijt, R.M. 3D printing for the integration of porous materials into miniaturised fluidic devices: A review. Anal. Chim. Acta 2021, 1185, 338796. [Google Scholar] [CrossRef]
- Qin, J.; Chen, Q.; Yang, C. Research process on property and application of metal porous materials. J. Alloys Compd. 2016, 654, 39–44. [Google Scholar] [CrossRef]
- Wen, L.; Nie, M.; Wang, C.; Zhao, Y.; Yin, K.; Sun, L. Multifunctional, Light-Weight Wearable Sensor Based on 3D Porous Polyurethane Sponge Coated with MXene and Carbon Nanotubes Composites. Adv. Mater. Interfaces 2021, 9, 2270027. [Google Scholar] [CrossRef]
- Fu, C.; Liang, J.; Yang, G.; Dagestani, A.A.; Liu, W.; Luo, X.; Zeng, B.; Wu, H.; Huang, M.; Lin, L.; et al. Recycling of waste glass as raw materials for the preparation of self-cleaning, light-weight and high-strength porous ceramics. J. Clean. Prod. 2021, 317, 128395. [Google Scholar] [CrossRef]
- Resende-Gonçalves, C.I.; Sampaio, N.; Moreira, J.; Carvalho, O.; Caramês, J.; Manzanares-Céspedes, M.C.; Silva, F.; Henriques, B.; Souza, J. Porous Zirconia Blocks for Bone Repair: An Integrative Review on Biological and Mechanical Outcomes. Ceramics 2022, 5, 161–172. [Google Scholar] [CrossRef]
- Germaini, M.-M.; Belhabib, S.; Guessasma, S.; Deterre, R.; Corre, P.; Weiss, P. Additive manufacturing of biomaterials for bone tissue engineering—A critical review of the state of the art and new concepts. Prog. Mater. Sci. 2022, 130, 100963. [Google Scholar] [CrossRef]
- Kelly, C.N.; Wang, T.; Crowley, J.; Wills, D.; Pelletier, M.H.; Westrick, E.R.; Adams, S.B.; Gall, K.; Walsh, W.R. High-strength, porous additively manufactured implants with optimized mechanical osseointegration. Biomaterials 2021, 279, 121206. [Google Scholar] [CrossRef]
- Abdelgawad, K.Z.; Adebayo, A.R.; Isah, A.; Muhammed, N.S. A literature review of strength and stability of foam and their relationship with the absolute permeability of porous media. J. Pet. Sci. Eng. 2022, 211, 110195. [Google Scholar] [CrossRef]
- Yabansu, Y.C.; Altschuh, P.; Hötzer, J.; Selzer, M.; Nestler, B.; Kalidindi, S.R. A digital workflow for learning the reduced-order structure-property linkages for permeability of porous membranes. Acta Mater. 2020, 195, 668–680. [Google Scholar] [CrossRef]
- Yang, X.; Shen, X.; Duan, H.; Zhang, X.; Yin, Q. Identification of Acoustic Characteristic Parameters and Improvement of Sound Absorption Performance for Porous Metal. Metals 2020, 10, 340. [Google Scholar] [CrossRef]
- Sun, W.; Pan, B.; Song, X.; Xiao, H.; Zhou, J.; Sui, D. A novel sound absorber design of nanofibrous composite porous material. Mater. Des. 2022, 214, 110418. [Google Scholar] [CrossRef]
- Xu, X.B.; Liu, P.S.; Chen, G.F.; Li, C.P. Sound Absorption Performance of Highly Porous Stainless Steel Foam with Reticular Structure. Met. Mater. Int. 2020, 27, 3316–3324. [Google Scholar] [CrossRef]
- G, T.; Srinivas, K.E.S.; Harikrishnan, D.N.G.; Mobedi, M. Correlations and Numerical Modeling of Stacked Woven Wire-Mesh Porous Media for Heat Exchange Applications. Energies 2022, 15, 2371. [Google Scholar] [CrossRef]
- Wyczółkowski, R.; Bagdasaryan, V.; Gała, M.; Król, P.A. The Review of Chosen Methods Used to Investigate Heat Transfer in a Steel Porous Charge. Energies 2022, 15, 2266. [Google Scholar] [CrossRef]
- Liang, X.; Li, Y.; He, Z.; Yan, W.; Tan, F.; Wang, Q.; Zhu, T.; Sang, S. The effect of cellular structure on the strength and combustion properties of SiC porous ceramics. Ceram. Int. 2022, 48, 2538–2545. [Google Scholar] [CrossRef]
- Tao, X.; Yang, Z.; Cheng, M.; Yan, R.; Chen, F.; Cao, S.; Li, S.; Ma, T.; Cheng, C.; Yang, W. Phosphorus modulated porous CeO2 nanocrystallines for accelerated polysulfide catalysis in advanced Li-S batteries. J. Mater. Sci. Technol. 2022, 131, 212–220. [Google Scholar] [CrossRef]
- Lu, W.; Li, T.; Yuan, C.; Zhang, H.; Li, X. Advanced porous composite membrane with ability to regulate zinc deposition enables dendrite-free and high-areal capacity zinc-based flow battery. Energy Storage Mater. 2022, 47, 415–423. [Google Scholar] [CrossRef]
- Monaco, F.; Effori, E.; Hubert, M.; Siebert, E.; Geneste, G.; Morel, B.; Djurado, E.; Montinaro, D.; Laurencin, J. Electrode kinetics of porous Ni-3YSZ cermet operated in fuel cell and electrolysis modes for solid oxide cell application. Electrochim. Acta 2021, 389, 138765. [Google Scholar] [CrossRef]
- Ibrahim, M.H.; Mustaffar, M.I.; Ismail, S.A.; Ismail, A.N. A Review of Porous Glass-Ceramic Production Process, Properties and Applications. J. Phys. Conf. Ser. 2022, 2169, 012042. [Google Scholar] [CrossRef]
- Singh, S.; Bhatnagar, N. A survey of fabrication and application of metallic foams (1925–2017). J. Porous Mater. 2018, 25, 537–554. [Google Scholar] [CrossRef]
- Banhart, J. Manufacture, characterisation and application of cellular metals and metal foams. Prog. Mater. Sci. 2001, 46, 559–632. [Google Scholar] [CrossRef]
- Pfeiffer, S.; Florio, K.; Puccio, D.; Grasso, M.; Colosimo, B.M.; Aneziris, C.G.; Wegener, K.; Graule, T. Direct laser additive manufacturing of high performance oxide ceramics: A state-of-the-art review. J. Eur. Ceram. Soc. 2021, 41, 6087–6114. [Google Scholar] [CrossRef]
- Gunasekaran, J.; Sevvel, P.; Solomon, I.J. Metallic materials fabrication by selective laser melting: A review. Mater. Today Proc. 2020, 37, 252–256. [Google Scholar] [CrossRef]
- Dhiman, S.; Sidhu, S.S.; Bains, P.S.; Bahraminasab, M. Mechanobiological assessment of Ti-6Al-4V fabricated via selective laser melting technique: A review. Rapid Prototyp. J. 2019, 25, 1266–1284. [Google Scholar] [CrossRef]
- Yan, C.; Hao, L.; Hussein, A.; Young, P.; Raymont, D. Advanced lightweight 316L stainless steel cellular lattice structures fabricated via selective laser melting. Mater. Des. 2014, 55, 533–541. [Google Scholar] [CrossRef]
- Prajapati, M.J.; Kumar, A.; Lin, S.-C.; Jeng, J.-Y. Multi-material additive manufacturing with lightweight closed-cell foam-filled lattice structures for enhanced mechanical and functional properties. Addit. Manuf. 2022, 54, 102766. [Google Scholar] [CrossRef]
- Zhong, T.; He, K.; Li, H.; Yang, L. Mechanical properties of lightweight 316L stainless steel lattice structures fabricated by selective laser melting. Mater. Des. 2019, 181, 108076. [Google Scholar] [CrossRef]
- Ge, J.; Huang, J.; Lei, Y.; O’Reilly, P.; Ahmed, M.; Zhang, C.; Yan, X.; Yin, S. Microstructural features and compressive properties of SLM Ti6Al4V lattice structures. Surf. Coat. Technol. 2020, 403, 126419. [Google Scholar] [CrossRef]
- Shrivastava, A.; Anand Kumar, S.; Rao, S.; Nagesha, B.K. Exploring How LPBF process Parameters Impact the Interface Characteristics of LPBF Inconel 718 deposited on Inconel 718 wrought Substrates. Opt. Laser Technol. 2024, 174, 110571. [Google Scholar] [CrossRef]
- Robinson, J.; Arjunan, A.; Baroutaji, A.; Martí, M.; Molina, A.T.; Serrano-Aroca, Á.; Pollard, A. Additive Manufacturing of anti-SARS-CoV-2 Copper-Tungsten-Silver Alloy. Rapid Prototyp. J. 2021, 27, 1831–1849. [Google Scholar] [CrossRef]
- Li, Z.; Takano, N.; Mizutani, M. Material properties of selective laser melting additive-manufactured Ti6Al4V alloys with different porosities. Precis. Eng. 2023, 83, 142–151. [Google Scholar] [CrossRef]
- Lin, T.-C.; Cao, C.; Sokoluk, M.; Jiang, L.; Wang, X.; Schoenung, J.M.; Lavernia, E.J.; Li, X. Aluminum with dispersed nanoparticles by laser additive manufacturing. Nat. Commun. 2019, 10, 4124. [Google Scholar] [CrossRef]
- Kim, W.R.; Bang, G.B.; Kwon, O.; Jung, K.-H.; Park, H.-K.; Kim, G.-H. Fabrication of porous pure titanium via selective laser melting under low-energy-density process conditions. Mater. Des. 2020, 195, 109035. [Google Scholar] [CrossRef]
- Bruce, D.W.; O’Hare, D.; Walton, R.I. Porous Materials; John Wiley & Sons, Ltd.: Hoboken, NJ, USA, 2010. [Google Scholar] [CrossRef]
- Sallica-Leva, E.; Jardini, A.; Fogagnolo, J. Microstructure and mechanical behavior of porous Ti–6Al–4V parts obtained by selective laser melting. J. Mech. Behav. Biomed. Mater. 2013, 26, 98–108. [Google Scholar] [CrossRef] [PubMed]
- Khairallah, S.A.; Anderson, A.T.; Rubenchik, A.; King, W.E. Laser powder-bed fusion additive manufacturing: Physics of complex melt flow and formation mechanisms of pores, spatter, and denudation zones. Acta Mater. 2016, 108, 36–45. [Google Scholar] [CrossRef]
- Meier, C.; Penny, R.W.; Zou, Y.; Gibbs, J.S.; Hart, A.J. Thermophysical phenomena in metal additive manufacturing through selective laser melting: Fundamentals, modeling, simulation, and experimentation. Annu. Rev. Heat Transf. 2017, 20, 241–316. [Google Scholar] [CrossRef]
- Liao, H.; Zhu, J.; Chang, S.; Xue, G.; Zhu, H.; Chen, B. Al2O3 loss prediction model of selective laser melting Al2O3–Al composite. Ceram. Int. 2020, 46, 13414–13423. [Google Scholar] [CrossRef]
- Chen, X.; Wu, Y.; Liu, H.; Wang, Y.; Zhao, G.; Zhang, Q.; Wang, F.; Liu, Y. Mechanical performance of PEEK-Ti6Al4V interpenetrating phase composites fabricated by powder bed fusion and vacuum infiltration targeting large and load-bearing implants. Mater. Des. 2022, 215, 110531. [Google Scholar] [CrossRef]
- Liu, J.; Guo, K.; Sun, J.; Sun, Q.; Wang, L.; Li, H. Compressive behavior and vibration-damping properties of porous Ti-6Al-4V alloy manufactured by laser powder bed fusion. J. Manuf. Process. 2021, 66, 1–10. [Google Scholar] [CrossRef]
- Zhou, K.; Chen, W.; Yang, Y.; Li, R.; Dong, L.; Fu, Y.Q. Microstructure and mechanical behavior of porous tungsten skeletons synthesized by selected laser melting. Int. J. Refract. Met. Hard Mater. 2021, 103, 105769. [Google Scholar] [CrossRef]
- Vyatskikh, A.; Delalande, S.; Kudo, A.; Zhang, X.; Portela, C.M.; Greer, J.R. Additive manufacturing of 3D nano-architected metals. Nat. Commun. 2018, 9, 593. [Google Scholar] [CrossRef]
- Noor, M.F.; Jamaludin, R.K.; Ahmad, S. Physical and Mechanical Characteristics of Porous SS316L for Biomedical Implant. Solid State Phenom. 2017, 4479, 374–378. [Google Scholar] [CrossRef]
- Gibson, L.J.; Ashby, M.F. Cellular Solids-Structure and Properties, 2nd ed.; Cambridge University: Cambridge, UK, 1997. [Google Scholar]
- Zhu, B.; Fan, L.; Mushtaq, N.; Raza, R.; Sajid, M.; Wu, Y.; Lin, W.; Kim, J.-S.; Lund, P.; Yun, S. Semiconductor Electrochemistry for Clean Energy Conversion and Storage. Electrochem. Energy Rev. 2021, 4, 757–792. [Google Scholar] [CrossRef]
Figure 1.
316L raw powders and LPBF-fabricated microporous 316L. (a) SEM image of 316L spherical powders and (b) representative LPBF-fabricated particle-stacking samples.
Figure 1.
316L raw powders and LPBF-fabricated microporous 316L. (a) SEM image of 316L spherical powders and (b) representative LPBF-fabricated particle-stacking samples.

Figure 2.
Schematic diagram of microporous particle-stacking porous structure via laser powder bed fusion.
Figure 2.
Schematic diagram of microporous particle-stacking porous structure via laser powder bed fusion.

Figure 3.
Porosity of microporous 316L samples printed by LPBF as a function of the different laser power at two scanning modes of low laser scanning speed (600 mm·s−1) and high laser scanning speed (2000 mm·s−1): red dash lines are the fitted lines with the fitted equations to the corresponding data, where P and PL represent porosity and laser power, respectively.

Figure 4.
Cross-sectional micrographs of particle-stacking microporous 316L samples fabricated with different laser power at two modes of high-speed scanning and low-speed scanning: (a) 80 w and (b) 130 w at a high scanning speed of 2000 mm·s−1 and (c) 50 w and (d) 70 w at a low-speed scanning of 600 mm·s−1.

Figure 5.
Pore size distribution of microporous 316L samples fabricated with different laser power at two modes of high-speed scanning and low-speed scanning: (a) a high scanning speed of 2000 mm·s−1 and (b) a low scanning speed of 600 mm·s−1.
Figure 5.
Pore size distribution of microporous 316L samples fabricated with different laser power at two modes of high-speed scanning and low-speed scanning: (a) a high scanning speed of 2000 mm·s−1 and (b) a low scanning speed of 600 mm·s−1.

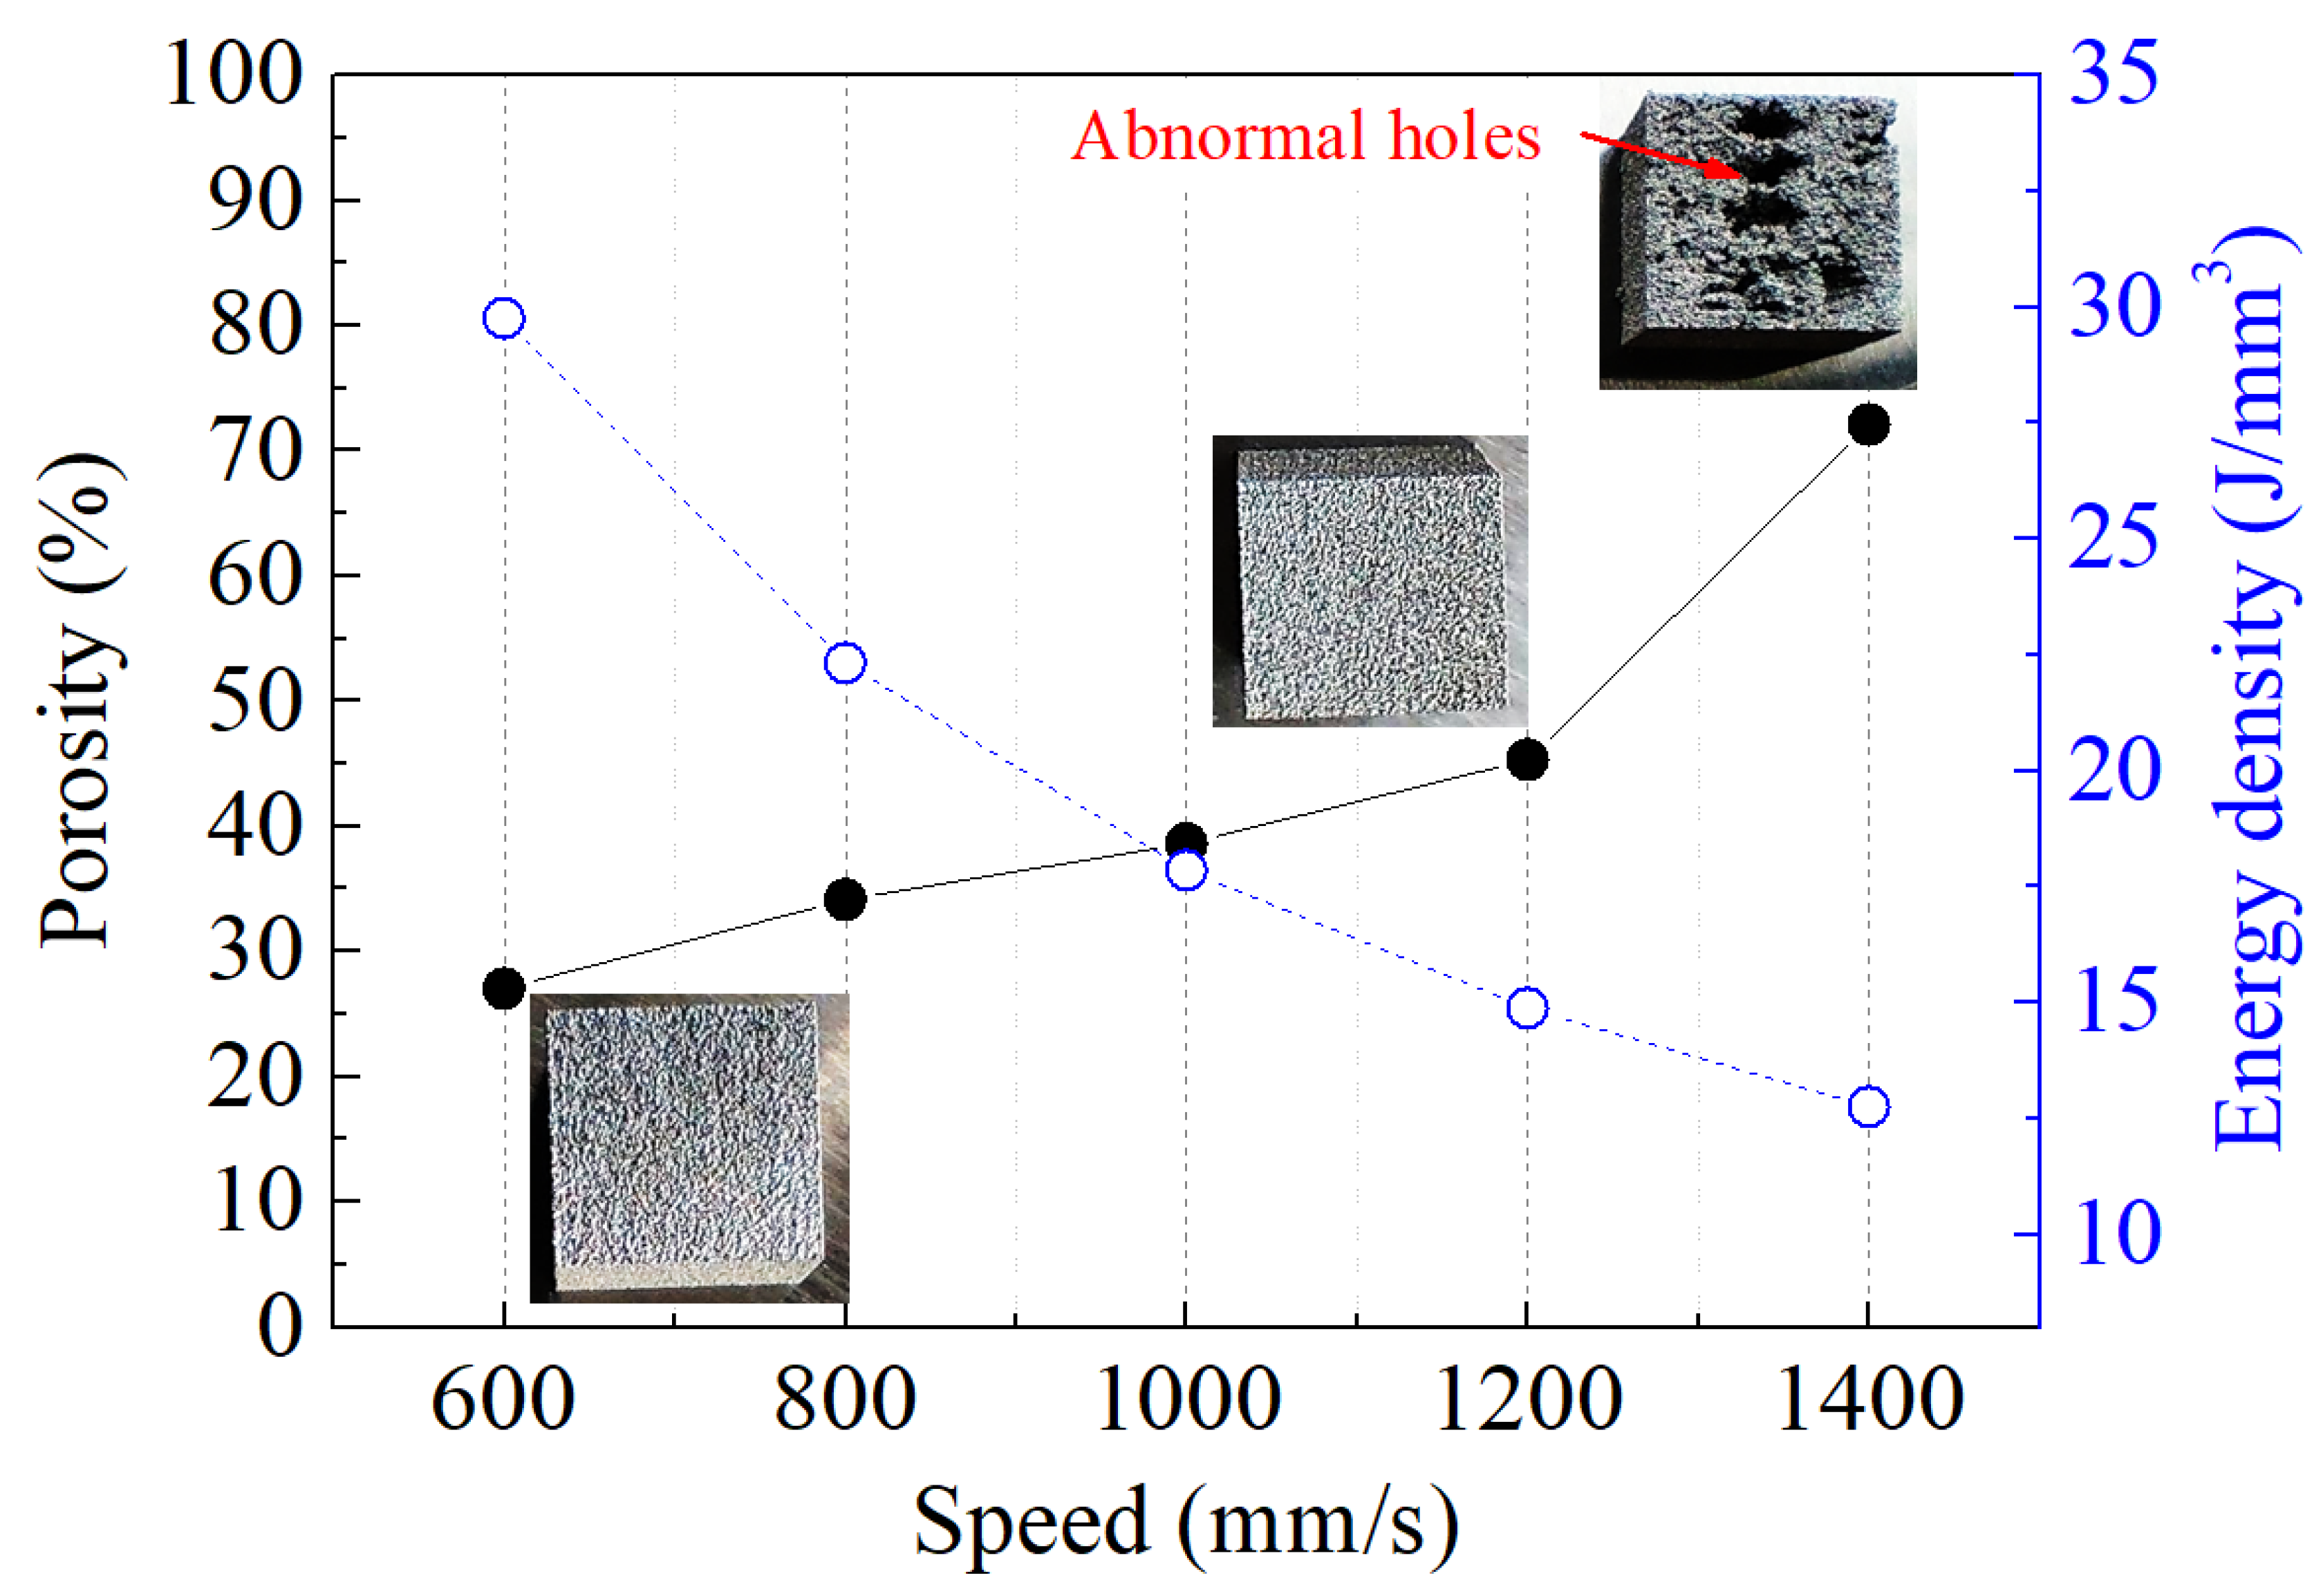
Figure 6.
Porosity of microporous 316L printed using LPBF as a function of the laser scanning speed.
Figure 6.
Porosity of microporous 316L printed using LPBF as a function of the laser scanning speed.

Figure 7.
Cross-sectional pore structure of microporous 316L samples fabricated with different laser scanning speeds: (a) 800 mm·s−1, (b) 1000 mm·s−1, and (c) 1200 mm·s−1.
Figure 7.
Cross-sectional pore structure of microporous 316L samples fabricated with different laser scanning speeds: (a) 800 mm·s−1, (b) 1000 mm·s−1, and (c) 1200 mm·s−1.

Figure 8.
Pore size distribution of microporous 316L samples fabricated with different laser scanning speeds.
Figure 8.
Pore size distribution of microporous 316L samples fabricated with different laser scanning speeds.

Figure 9.
Porosity of microporous 316L fabricated using LPBF as a function of the different hatch distances at two-layer thicknesses of 30 μm and 42 μm.
Figure 9.
Porosity of microporous 316L fabricated using LPBF as a function of the different hatch distances at two-layer thicknesses of 30 μm and 42 μm.

Figure 10.
Cross-sectional pores of microporous 316L samples fabricated with different HDs at two LTs of 30 μm and 42 μm: (a) HDs of 0.08 mm and (b) 0.14 mm at an LT of 30 μm, (c) HDs of 0.08 mm and (d) 0.14 mm at an LT of 42 μm.
Figure 10.
Cross-sectional pores of microporous 316L samples fabricated with different HDs at two LTs of 30 μm and 42 μm: (a) HDs of 0.08 mm and (b) 0.14 mm at an LT of 30 μm, (c) HDs of 0.08 mm and (d) 0.14 mm at an LT of 42 μm.

Figure 11.
Pore size distribution of microporous 316L samples fabricated with different HD at two LTs of 30 μm and 42 μm: (a) an LT of 30 μm and (b) an LT of 42 μm.
Figure 11.
Pore size distribution of microporous 316L samples fabricated with different HD at two LTs of 30 μm and 42 μm: (a) an LT of 30 μm and (b) an LT of 42 μm.

Figure 12.
Three-dimensional CT image of the microporous 316L sample fabricated with optimization of parameter: power 60 w, scanning speed 1000 mm·s−1, HD 0.12 mm, and LT 30 μm: (a) CT image of a 3 × 3 × 3 mm3 microporous 316L cubic, (b) a cross-section in the XY direction, (c) a cross-section in the YZ direction, and (d) a cross-section in the XZ direction.

Figure 13.
Compressive performances of the particle-stacking microporous 316L with different porosities, with a representative sample of lattice porous 316L as a comparison: (a) representative stress-strain curves, (b) morphologies of the fractured samples, and (c) yield strength.
Figure 13.
Compressive performances of the particle-stacking microporous 316L with different porosities, with a representative sample of lattice porous 316L as a comparison: (a) representative stress-strain curves, (b) morphologies of the fractured samples, and (c) yield strength.


Table 1.
Chemical composition of 316L.
| Composition | Fe | Cr | Ni | O | Si | Mn | Mo | C | Others |
|---|---|---|---|---|---|---|---|---|---|
| % | 68.42 | 13.97 | 13.22 | 0.051 | 0.98 | 0.18 | 2.82 | 0.0041 | 0.3549 |
Table 2.
Pore size corresponding to the cross-sectional porous structure in Figure 4.
Table 2.
Pore size corresponding to the cross-sectional porous structure in Figure 4.
| Sample | LS-50 w | LS-70 w | HS-80 w | HS-130 w |
|---|---|---|---|---|
| Mean (μm) | 41 | 22 | 64 | 29 |
| D50 (μm) | 30.00 | 14.75 | 50.75 | 14.00 |
| D90 (μm) | 85.50 | 73.75 | 135.75 | 72.75 |
| Porosity % | 28.20 ± 0.62 | 17.06 ± 0.47 | 42 ± 1.05 | 23.42 ± 0.58 |
Table 3.
Pore size corresponding to the cross-sectional porous structure in Figure 7.
Table 3.
Pore size corresponding to the cross-sectional porous structure in Figure 7.
| Sample | Mean (μm) | D50 (μm) | D90 (μm) | Porosity% |
|---|---|---|---|---|
| 800 mm·s−1 | 41 | 28.00 | 84.25 | 34.15 ± 0.53 |
| 1000 mm·s−1 | 51 | 40.25 | 94.75 | 38.64 ± 0.84 |
| 1200 mm·s−1 | 75 | 55.75 | 159.25 | 45.33 ± 0.72 |
Table 4.
Pore size corresponding to the cross-sectional porous structure in Figure 10.
Table 4.
Pore size corresponding to the cross-sectional porous structure in Figure 10.
| Sample | Mean (μm) | D50 (μm) | D90 (μm) | Porosity% | |
|---|---|---|---|---|---|
| 30 μm | 0.08 mm | 31 | 22.5 | 64.25 | 27.03 ± 0.54 |
| 0.14 mm | 41 | 33.00 | 79.25 | 37.33 ± 0.67 | |
| 42 μm | 0.08 mm | 35 | 26.5 | 66.25 | 28.20 ± 0.64 |
| 0.14 mm | 57 | 34.75 | 136.25 | 43.24 ± 0.88 | |
Disclaimer/Publisher’s Note: The statements, opinions and data contained in all publications are solely those of the individual author(s) and contributor(s) and not of MDPI and/or the editor(s). MDPI and/or the editor(s) disclaim responsibility for any injury to people or property resulting from any ideas, methods, instructions or products referred to in the content. |
© 2024 by the authors. Licensee MDPI, Basel, Switzerland. This article is an open access article distributed under the terms and conditions of the Creative Commons Attribution (CC BY) license (https://creativecommons.org/licenses/by/4.0/).
Share and Cite
MDPI and ACS Style
Qiu, J.; Xu, X.; Chen, X.; Liu, Y.; Wu, Y. Fabrication of Particle-Stacking Microporous Metal Using Laser Powder Bed Fusion. Coatings 2024, 14, 348. https://doi.org/10.3390/coatings14030348
AMA Style
Qiu J, Xu X, Chen X, Liu Y, Wu Y. Fabrication of Particle-Stacking Microporous Metal Using Laser Powder Bed Fusion. Coatings. 2024; 14(3):348. https://doi.org/10.3390/coatings14030348
Chicago/Turabian StyleQiu, Jinyong, Xiaoqiang Xu, Xu Chen, Yaxiong Liu, and Yanlong Wu. 2024. "Fabrication of Particle-Stacking Microporous Metal Using Laser Powder Bed Fusion" Coatings 14, no. 3: 348. https://doi.org/10.3390/coatings14030348
Note that from the first issue of 2016, this journal uses article numbers instead of page numbers. See further details here.