Article

Using MA-rFTIR Mapping as a Tool to Assess the Efficacy of Cleaning Treatments and to Aid in the Restoration Activities of Paintings

1
National Laboratory of Frascati, Via E. Fermi 54, 00044 Frascati, Italy
2
Excellence Centre at the Lazio Technological District for Cultural Heritage (DTC), Piazzale Aldo Moro, n. 5, 00185 Rome, Italy
3
Central Institute for Restoration, Via di San Michele 25, 00153 Rome, Italy
*
Author to whom correspondence should be addressed.
Coatings 2024, 14(4), 511; https://doi.org/10.3390/coatings14040511
Submission received: 29 February 2024 / Revised: 10 April 2024 / Accepted: 16 April 2024 / Published: 19 April 2024
(This article belongs to the Special Issue Materials Characterization and Surface Analysis for Cultural Heritage)

Abstract

:
The removal of non-original superimposed layers covering the original pictorial layer in paintings is a common practice to restore the authentic appearance of surfaces and mitigate potential risks to artwork preservation. Contemporary assessments of the effectiveness of such cleaning treatments often employ non-destructive analytical methods. However, many existing techniques face limitations, either lacking specificity in compound identification or analyzing very limited areas (<millimeters) through a point-by-point approach. This study introduces the application of a macro Fourier transform infrared scanner, in reflection mode (MA-rFTIR), as an effective tool for supporting restorers during cleaning processes. This method proved successful in addressing challenges related to the removal of calcium oxalate films and non-original superimposed layers on two ancient paintings.

1. Introduction

Exposure to pollutants, light, and dust can induce chromatic alterations and physical/optical degradations in pictorial layers, primarily through oxidation phenomena [1,2]. Consequently, cleaning processes become imperative to eliminate degradation products and/or superimposed layers, restoring the original appearance of the pictorial surface.
The aging process, coupled with interactions between pigments and binders, gives rise to the formation of metal oxalates and carboxylates, commonly observed as degradation products in paintings [3]. Among these, calcium oxalate stands out, often manifesting as a thick, durable patina that is challenging to remove. This substance originates from oxalic acid attributed to the metabolic activity of fungi and/or bacteria, as well as oxidative processes affecting organic materials, particularly those containing protein contents [4].
Beyond addressing degradation products, cleaning processes become essential for removing re-painted areas that can lead to chromatic and chemical alterations on the original surfaces. These coatings may be composed of more recent materials than the artwork’s original components or share a similar chemical composition with the original pictorial layers. In the latter scenario, it is crucial to monitor cleaning processes meticulously to prevent any damage to the original painted surface.
Therefore, the need to identify the nature of final coatings, surface alterations, and re-paintings, along with real-time monitoring of cleaning processes, propels scientific research toward the development of non-destructive techniques and analytical procedures. These techniques aim to be applied in situ, with the goal of evaluating the effectiveness of restorers’ treatments [5].
Typically, UV-fluorescence imaging serves as an analytical technique for detecting inhomogeneities in the varnish layer or identifying modern treatments, visible as dark areas [6,7,8]. Although this method serves as a valuable initial approach, it falls short in uniquely identifying specific compounds. Additional insights can be gained by employing UV spectroscopic techniques, including multispectral and hyperspectral imaging [9,10], UV-fluorescence spectroscopy [11,12,13], and laser-induced fluorescence spectroscopy (LIF) [14]. However, the identification of many compounds responsible for alterations and degradation phenomena remains challenging.
While hyperspectral and multispectral imaging in the visible and NIR range offer information about pigment types or reveal the presence of restoration treatments [15], they are less sensitive to organic matter or materials lacking specific spectral features in these ranges. Optical coherence tomography (OCT) has found extensive use in evaluating cleaning process effectiveness [16], primarily through measuring coating thickness, but it does not allow for the identification of removed or remaining products on the surface.
FT-IR spectroscopy, particularly in attenuated total reflectance (ATR) and external reflection modes, stands out as the most effective technique for detecting organic matter in situ [17]. Recently, reflection FTIR (r-FTIR) spectroscopy has been proposed to assess the efficiency of cleaning treatments due to its high sensitivity to organic compounds. By using this technique, it is necessary to take into account that the depth penetration in the mid-infrared range depends on several factors, including the wavelength of the radiation, the material being penetrated, and its optical properties such as absorption and scattering coefficients. Generally, in the mid-infrared range (wavelengths typically between 2.5 to 25 micrometers), infrared radiation can penetrate only a few micrometers into most materials. However, in some cases, such as with thin films or materials with low absorption coefficients, infrared radiation can penetrate deeper, up to several tens of micrometers or even millimeters. The exact penetration depth can vary widely depending on the specific conditions of the material and the infrared radiation being used [5,18,19,20].
However, as it is performed through point-by-point analysis, the results are specific to particular portions of the treated surface.
To address these limitations, researchers are exploring two main directions: (1) combining multiple techniques, such as point-by-point analyses with imaging or mapping devices [21,22] and (2) developing portable instruments for imaging or mapping that convert point-by-point analyses into comprehensive techniques [23,24,25].
In the latter aspect, macroscopic Fourier transform infrared scanning in reflection mode (MA-rFTIR) and Mid-IR hyperspectral imaging have been developed to acquire distribution maps of organic and inorganic compounds directly in situ [23,26].
Particularly, MA-rFTIR has been applied to cultural heritage over the last decade, demonstrating efficient recognition of pigments and binders in non-varnished artifacts (like illuminated manuscripts). However, its potential for recognizing the distribution of degradation products or superimposed layers has not been thoroughly investigated, especially concerning the verification of cleaning treatment effectiveness.
In this study, we assessed the efficacy of cleaning processes applied to two historic artworks: a 13th-century wooden painted cross and a 15th-century panel painting titled “Madonna in trono con Bambino, miracolo delle stimmate di San Francesco, Santi Antonio Abate e Bartolomeo, Crocefissione, San Cristoforo”. Our investigation employed a combination of micro-destructive and non-invasive methods. Initial analyses involved Micro-FTIR spectroscopy on samples to inform the selection of appropriate cleaning treatments. Subsequently, we gauged the effectiveness of the cleaning procedures using reflection FTIR (r-FTIR) spectroscopy, with a particular emphasis on exploring the potential of MA-rFTIR mapping to discern the distribution of residues on the paintings.

2. Materials and Methods

2.1. The Paintings

2.1.1. A 13th-Century Wooden Painted Cross

We examined a section of a 13th-century wooden painted cross (Figure 1a) originating from a Florentine context and attributed to the Master of Gagliano. The artwork depicts Christ, mourners, Christ the Judge, and angels. This artifact, housed in the storage of the Cenacolo Museum of Andrea del Sarto in San Salvi, Florence, has its origins in the Augustinian Monastery of Santa Caterina (FI), commonly known as San Gaggio. The painting’s colors exhibited alterations due to the presence of a thick superimposed layer, which was not part of the original surface.
These analyses were conducted during the restoration process undertaken by the Central Institute of Restoration (ICR) in Rome.

2.1.2. A Panel Painting Titled “Madonna in Trono con Bambino, Miracolo delle Stimmate di San Francesco, Santi Antonio Abate e Bartolomeo, Crocefissione, San Cristoforo” by Arcangelo Di Cola

This 15th-century wooden painting, attributed to Arcangelo di Cola, originates from the Galleria Nazionale delle Marche in Urbino. The artwork portrays the Enthroned Madonna with Child and other sacred episodes. Given the observed blackening of the Virgin’s mantle, our analyses were specifically directed towards this area.
These examinations were conducted in the course of the restoration process overseen by the Central Institute of Restoration (ICR) in Rome, with a particular focus on the Virgin’s mantle (Figure 1b).

2.2. Micro-Destructive Method

To discern the composition of superficial layers targeted for removal and guide the selection of cleaning processes, micro-FTIR spectroscopy was employed on samples extracted from both artworks.

Micro-FTIR

Micro-FTIR analysis was conducted using an infrared microscope, specifically the Thermo Scientific, Nicolet IN10 model (Madison, WI, USA), equipped with an LN-MCT detector. Spectra were obtained in transmission mode within the spectral range of 4000–650 cm−1, using a diamond cell. A minute micro-fragment was extracted from the painting surface and was directly placed and flattened onto the diamond cell for analysis.

2.3. Non-Invasive Methods

Point-by-point reflection FTIR spectroscopy and MA-rFTIR were employed both before and after the application of cleaning treatments to assess their effectiveness.

2.3.1. Point-by-Point Reflection FTIR Spectroscopy

The reflection FTIR spectra were obtained using an FT-IR spectrometer, specifically the ALPHA-II model from Bruker Optics, Ettlingen, Germany, equipped with an external reflectance module featuring an optical layout with a geometry of approximately 20°/20° and a coaxial digital camera. The spectrometer comprises a SiC globar source, a RockSolid interferometer, and a DLaTGS detector. For each point, an average of three measurements was taken over the spectral range of 7000–360 cm−1, with 64 scans and a spectral resolution of 4 cm−1. The acquired spectra were represented as pseudo-absorbance spectra [log(1/R); R = reflectance]. In reflection mode, absorption bands may undergo distortion due to surface and volume reflection. Surface reflection can cause derivative-like distortions in the band shape and inversion band (Reststrahlen effect), while volume reflection (also termed diffuse reflection) yields bands akin to those obtained in transmission mode [27]. In this work, derivative-like shapes and inversion bands are denoted as “+” and “*”, respectively.

2.3.2. MA-rFTIR

The spectrum acquisitions were conducted using the FT-IR spectrometer ALPHA-II from Bruker Optics, Germany (for more details, refer to Section 2.3.1). The spectrometer is mounted on a 3-axis motorized scanning system (Standa, Vilniaus, Lithuania), capable of movement in the X and Y directions. The Z translator enables the precise positioning of the IR beam at the focal point on the surface to be analyzed, facilitated by a Self-contained TOF Laser Sensor (Keyence, Mechelen, Belgium) recording the distance between the focal point and the surface.
Each acquisition is synchronized with the scanner positions via LabVIEW software 2019, facilitating the acquisition of images of the investigated areas. The lateral resolution of the spectrometer is approximately 1.5 mm, and each acquisition is recorded at intervals of 2 mm in both vertical and horizontal directions. Spectra were acquired with a spectral resolution of 8 cm−1, utilizing 4 scans and covering the spectral range of 7000–360 cm−1. The acquired spectra were processed using pseudo-absorbance [log(1/R); R = reflectance].
Data organization into spectral images was accomplished using ARTEMISIA Software (a demo version developed by X-Team Software Solutions s.r.l.s.) and superimposed on the visible image captured by the integrated camera. Spectral images, saved as ENVI files, were imported into the Matlab environment (MATLAB 2023, Mathworks, Inc., Natick, MA, USA) and processed using Hypertools3 [28,29]. The data were preprocessed using the standard normal variate (SNV) algorithm for spectral normalization. In some instances, the first derivative of the spectra was employed to emphasize derivative-like bands.
The results obtained from MA-rFTIR are showcased using false-color correlation maps generated with the Pearson correlation coefficient algorithm [30]. These maps focus on specific regions of interest (ROIs) containing characteristic spectral features of the compounds under investigation, while disregarding bands associated with potential chemical cleaning residues. The results are displayed in a false-color format, where a correlation coefficient value near 1 is represented in dark red, and a correlation coefficient value of −1 is represented in blue.
In this study, the analyzed areas covered approximately 3 × 10 cm2.

2.4. Cleaning Treatments

2.4.1. The 13th-Century Wooden Painted Cross

The cleaning treatment aimed at removing the thick and altered superimposed layer on the painted cross employed laser ablation combined with chemical cleaning [31]. Specifically, the LIGHT BRUSH 2 laser, powered by Er:YAG technology (Wavelength 2940 nm) from El.en. Company (Calenzano, Florence, Italy), was utilized for cleaning the entire painting surface, excluding the background painted with azurite mixed with glue. In these specific areas, the Nd:YAG THUNDER COMPACT laser from Quanta System (Milano, Italy), operating at the second harmonic (wavelength 532 nm), was employed. Chemical cleaning was performed by a chelating gel at pH8 constituted by acetic acid (1 g), Carbopol® Ultrez 21 (1 g), demineralized water (100 mL), and Triethylamine, namely TEA (4.1 mL) [32,33,34,35].

2.4.2. The Panel Painting Titled “Madonna in Trono con Bambino, Miracolo delle Stimmate di San Francesco, Santi Antonio Abate e Bartolomeo, Crocefissione, San Cristoforo” by Arcangelo Di Cola

The cleaning intervention aimed to remove an altered repainted layer that had compromised the clarity of the original blue coloring of the Virgin’s mantle. This process involved two cleaning phases: initially using a visco-elastic gel base, followed by the application of a pH 8.5 chelating gel, interspersed with Japanese paper [36,37]. The visco-elastic gel was prepared by mixing Polyvinyl alcohol, PVA (8 wt.% in demineralized water), and di-sodium tetraborate, Borax (8 wt.% in demineralized water), in a 4:1 ratio, whereas the chelating gel was constituted by acetic acid (1 g), Carbopol® Ultrez 21 (1 g), demineralized water (100 mL), and TEA (3–4 mL).

3. Results and Discussion

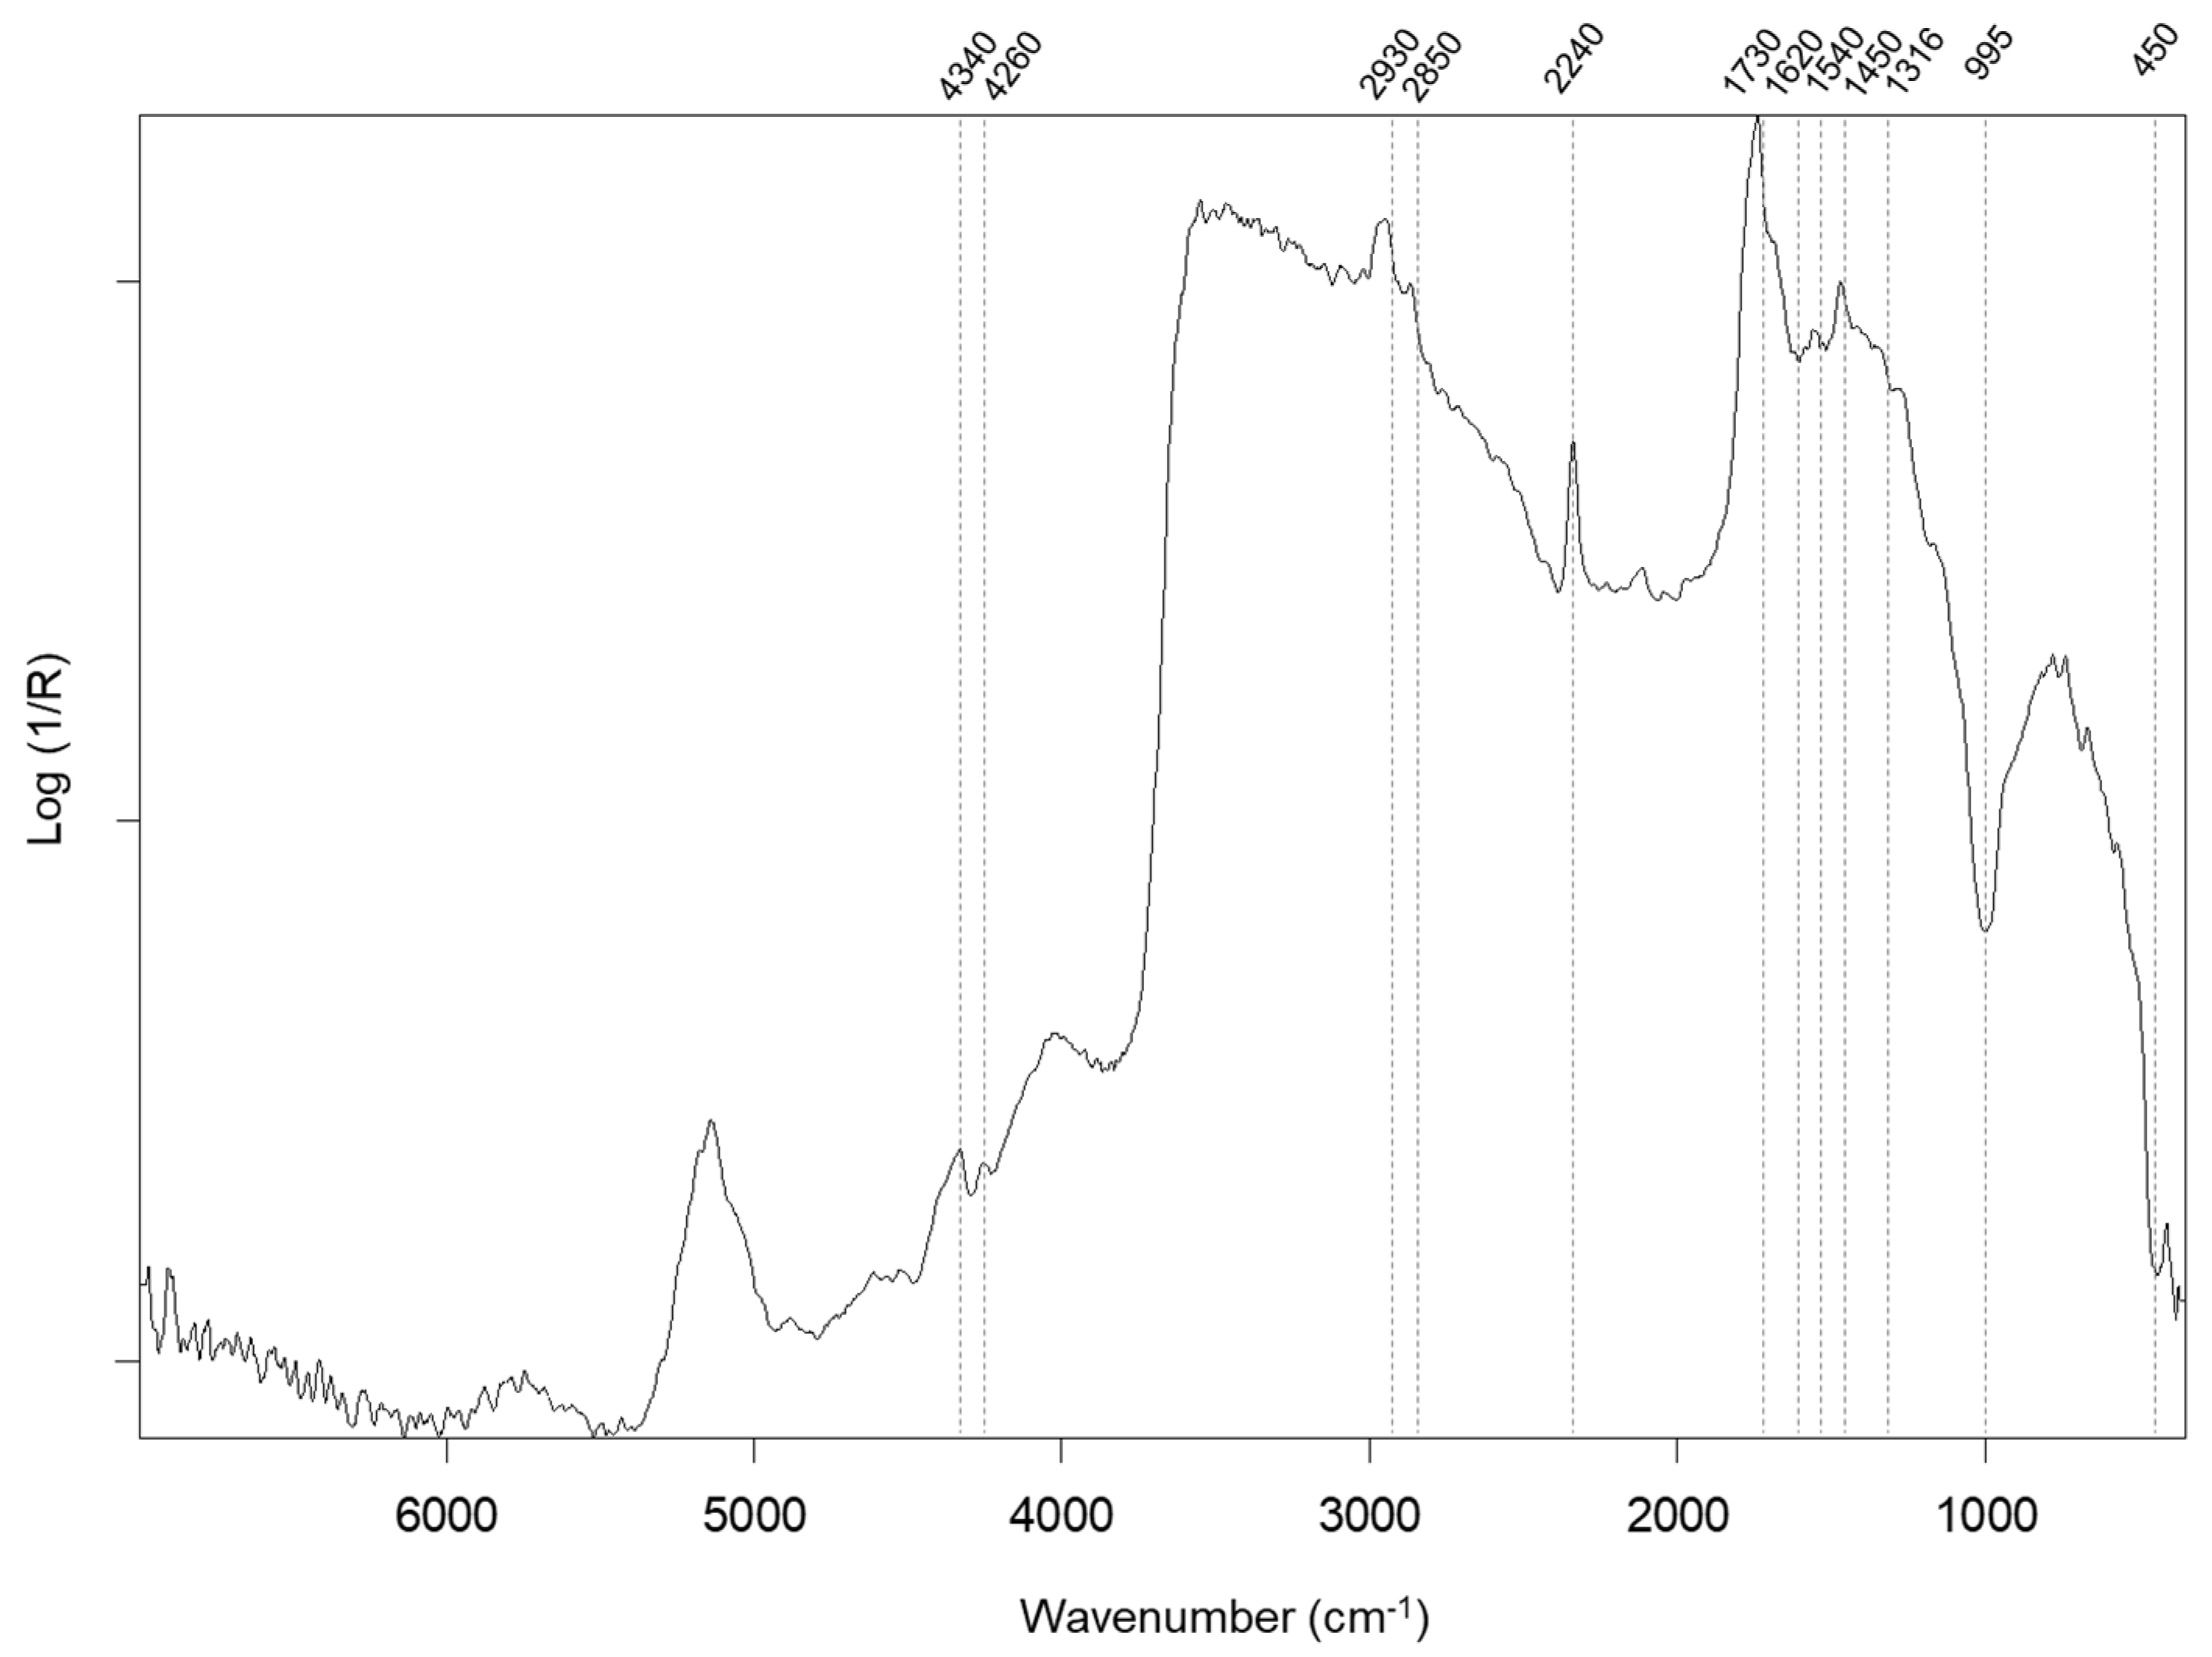
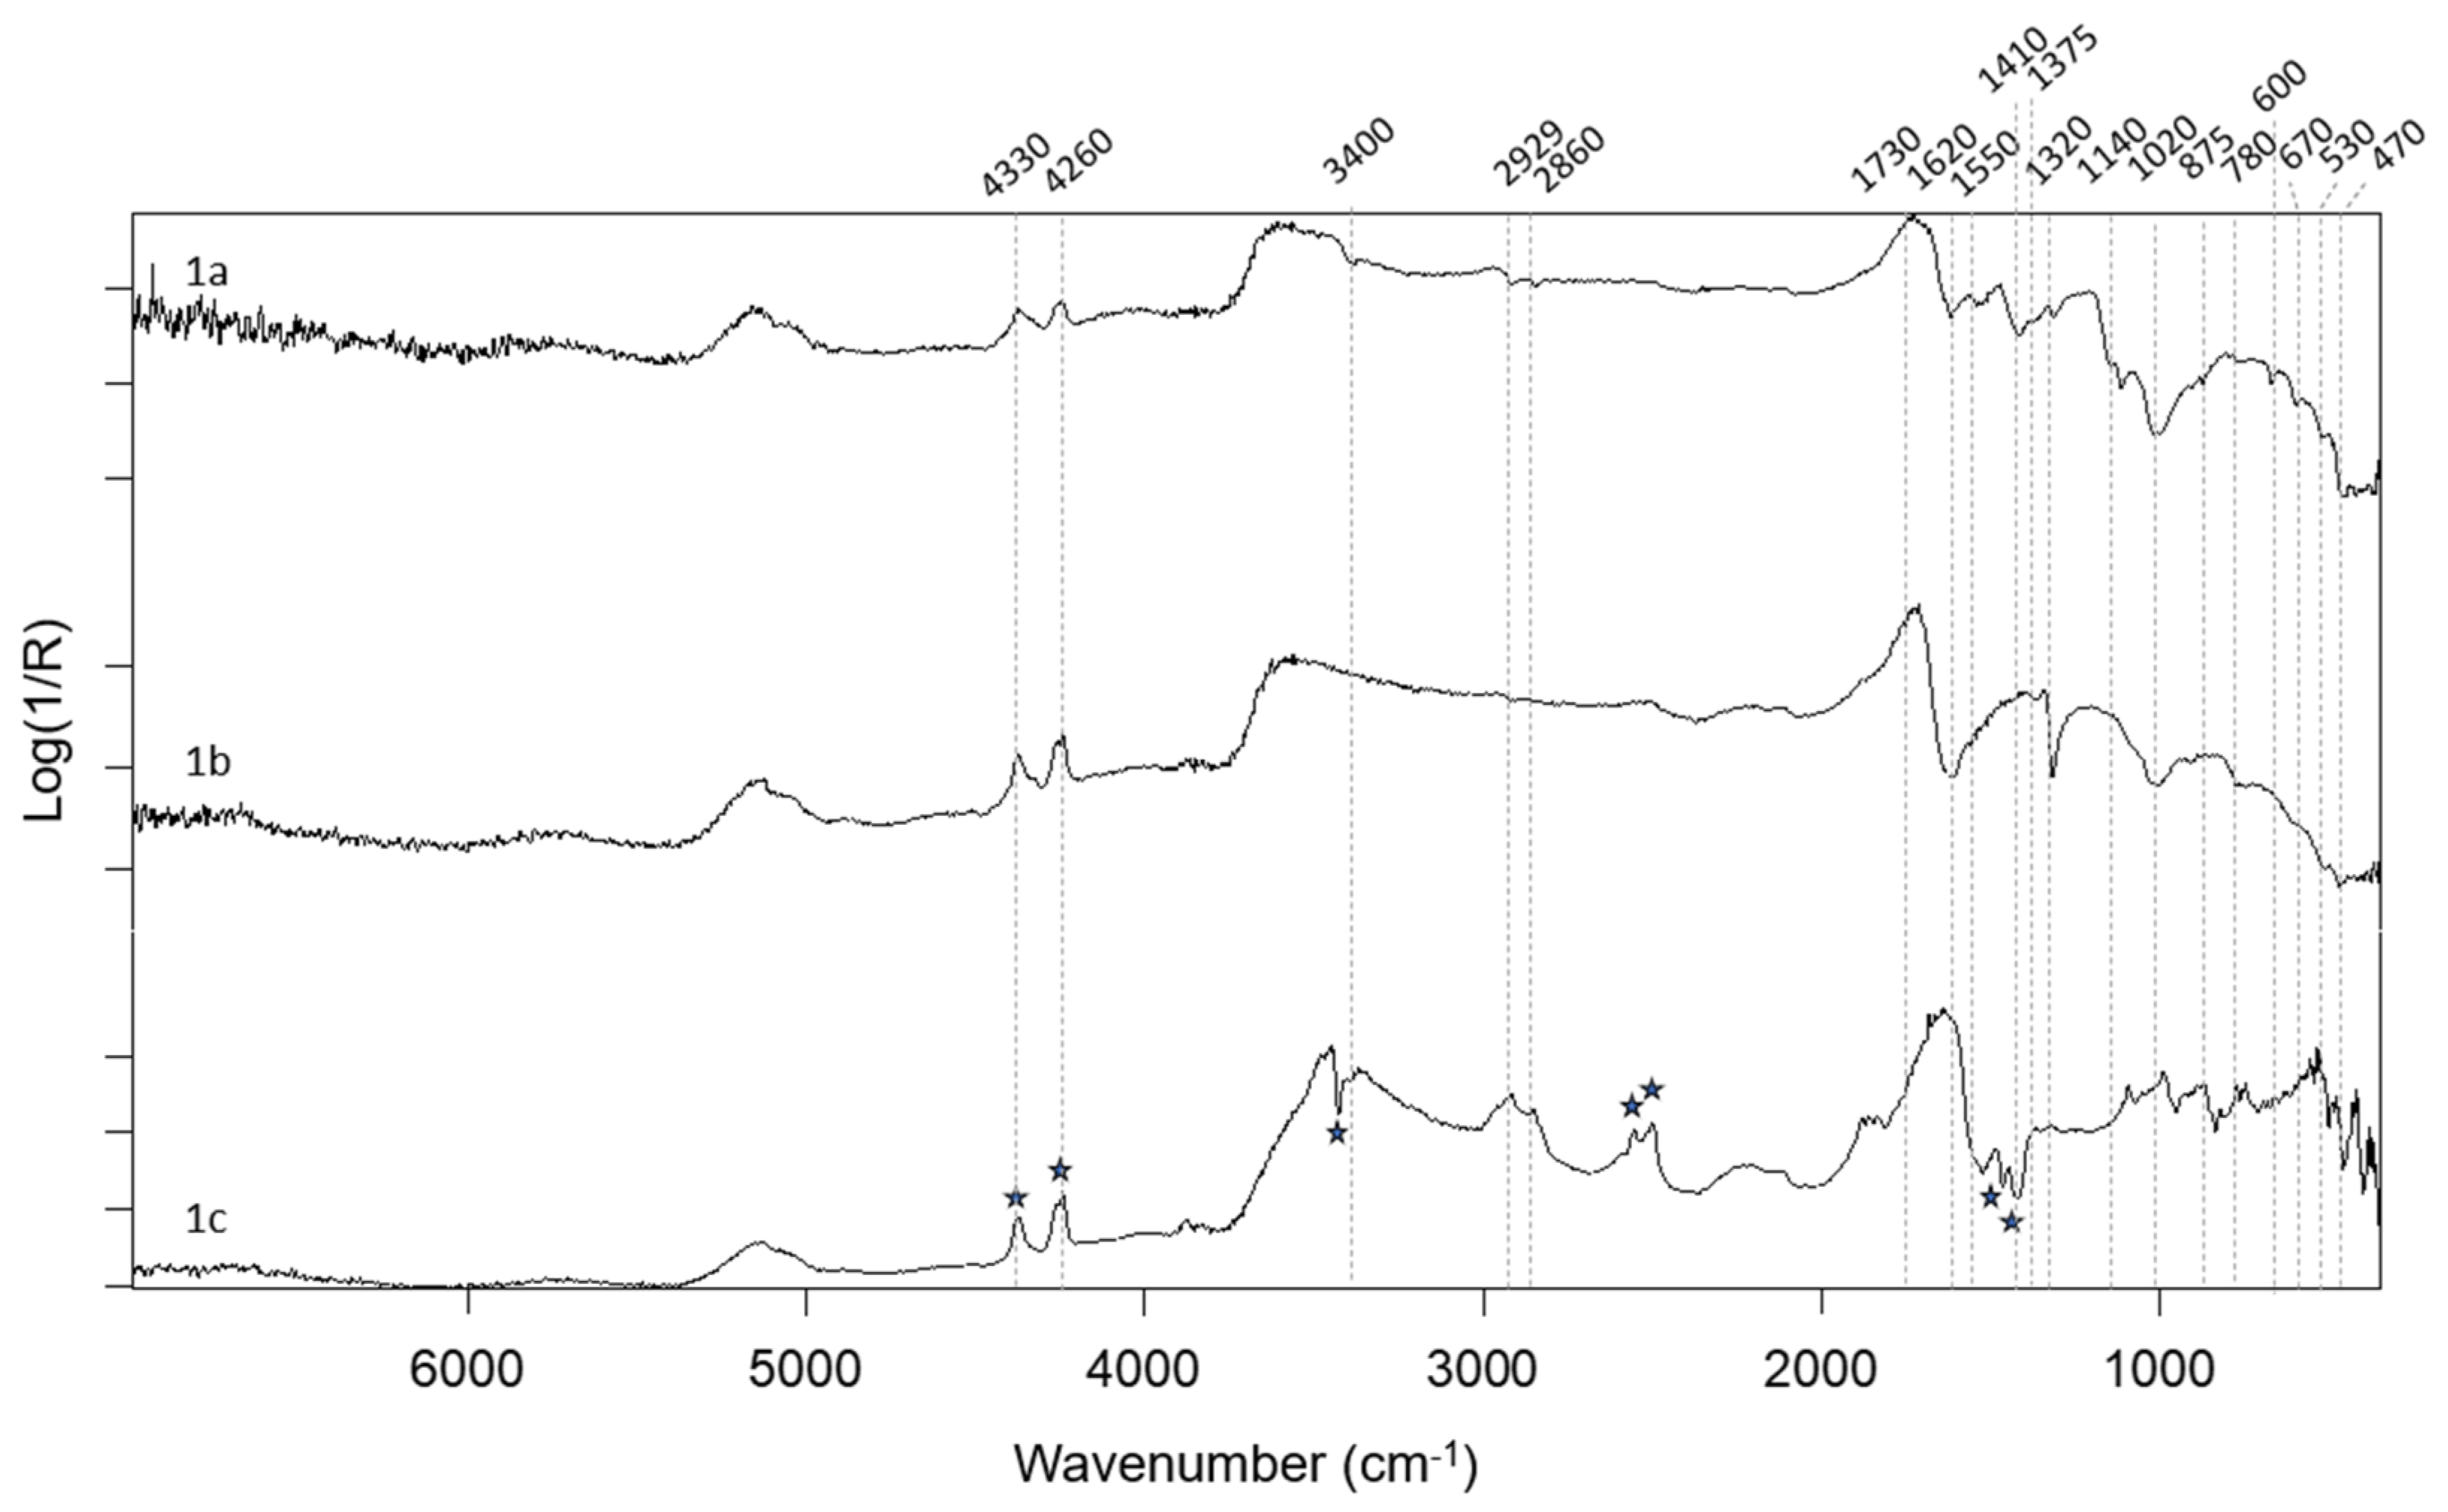
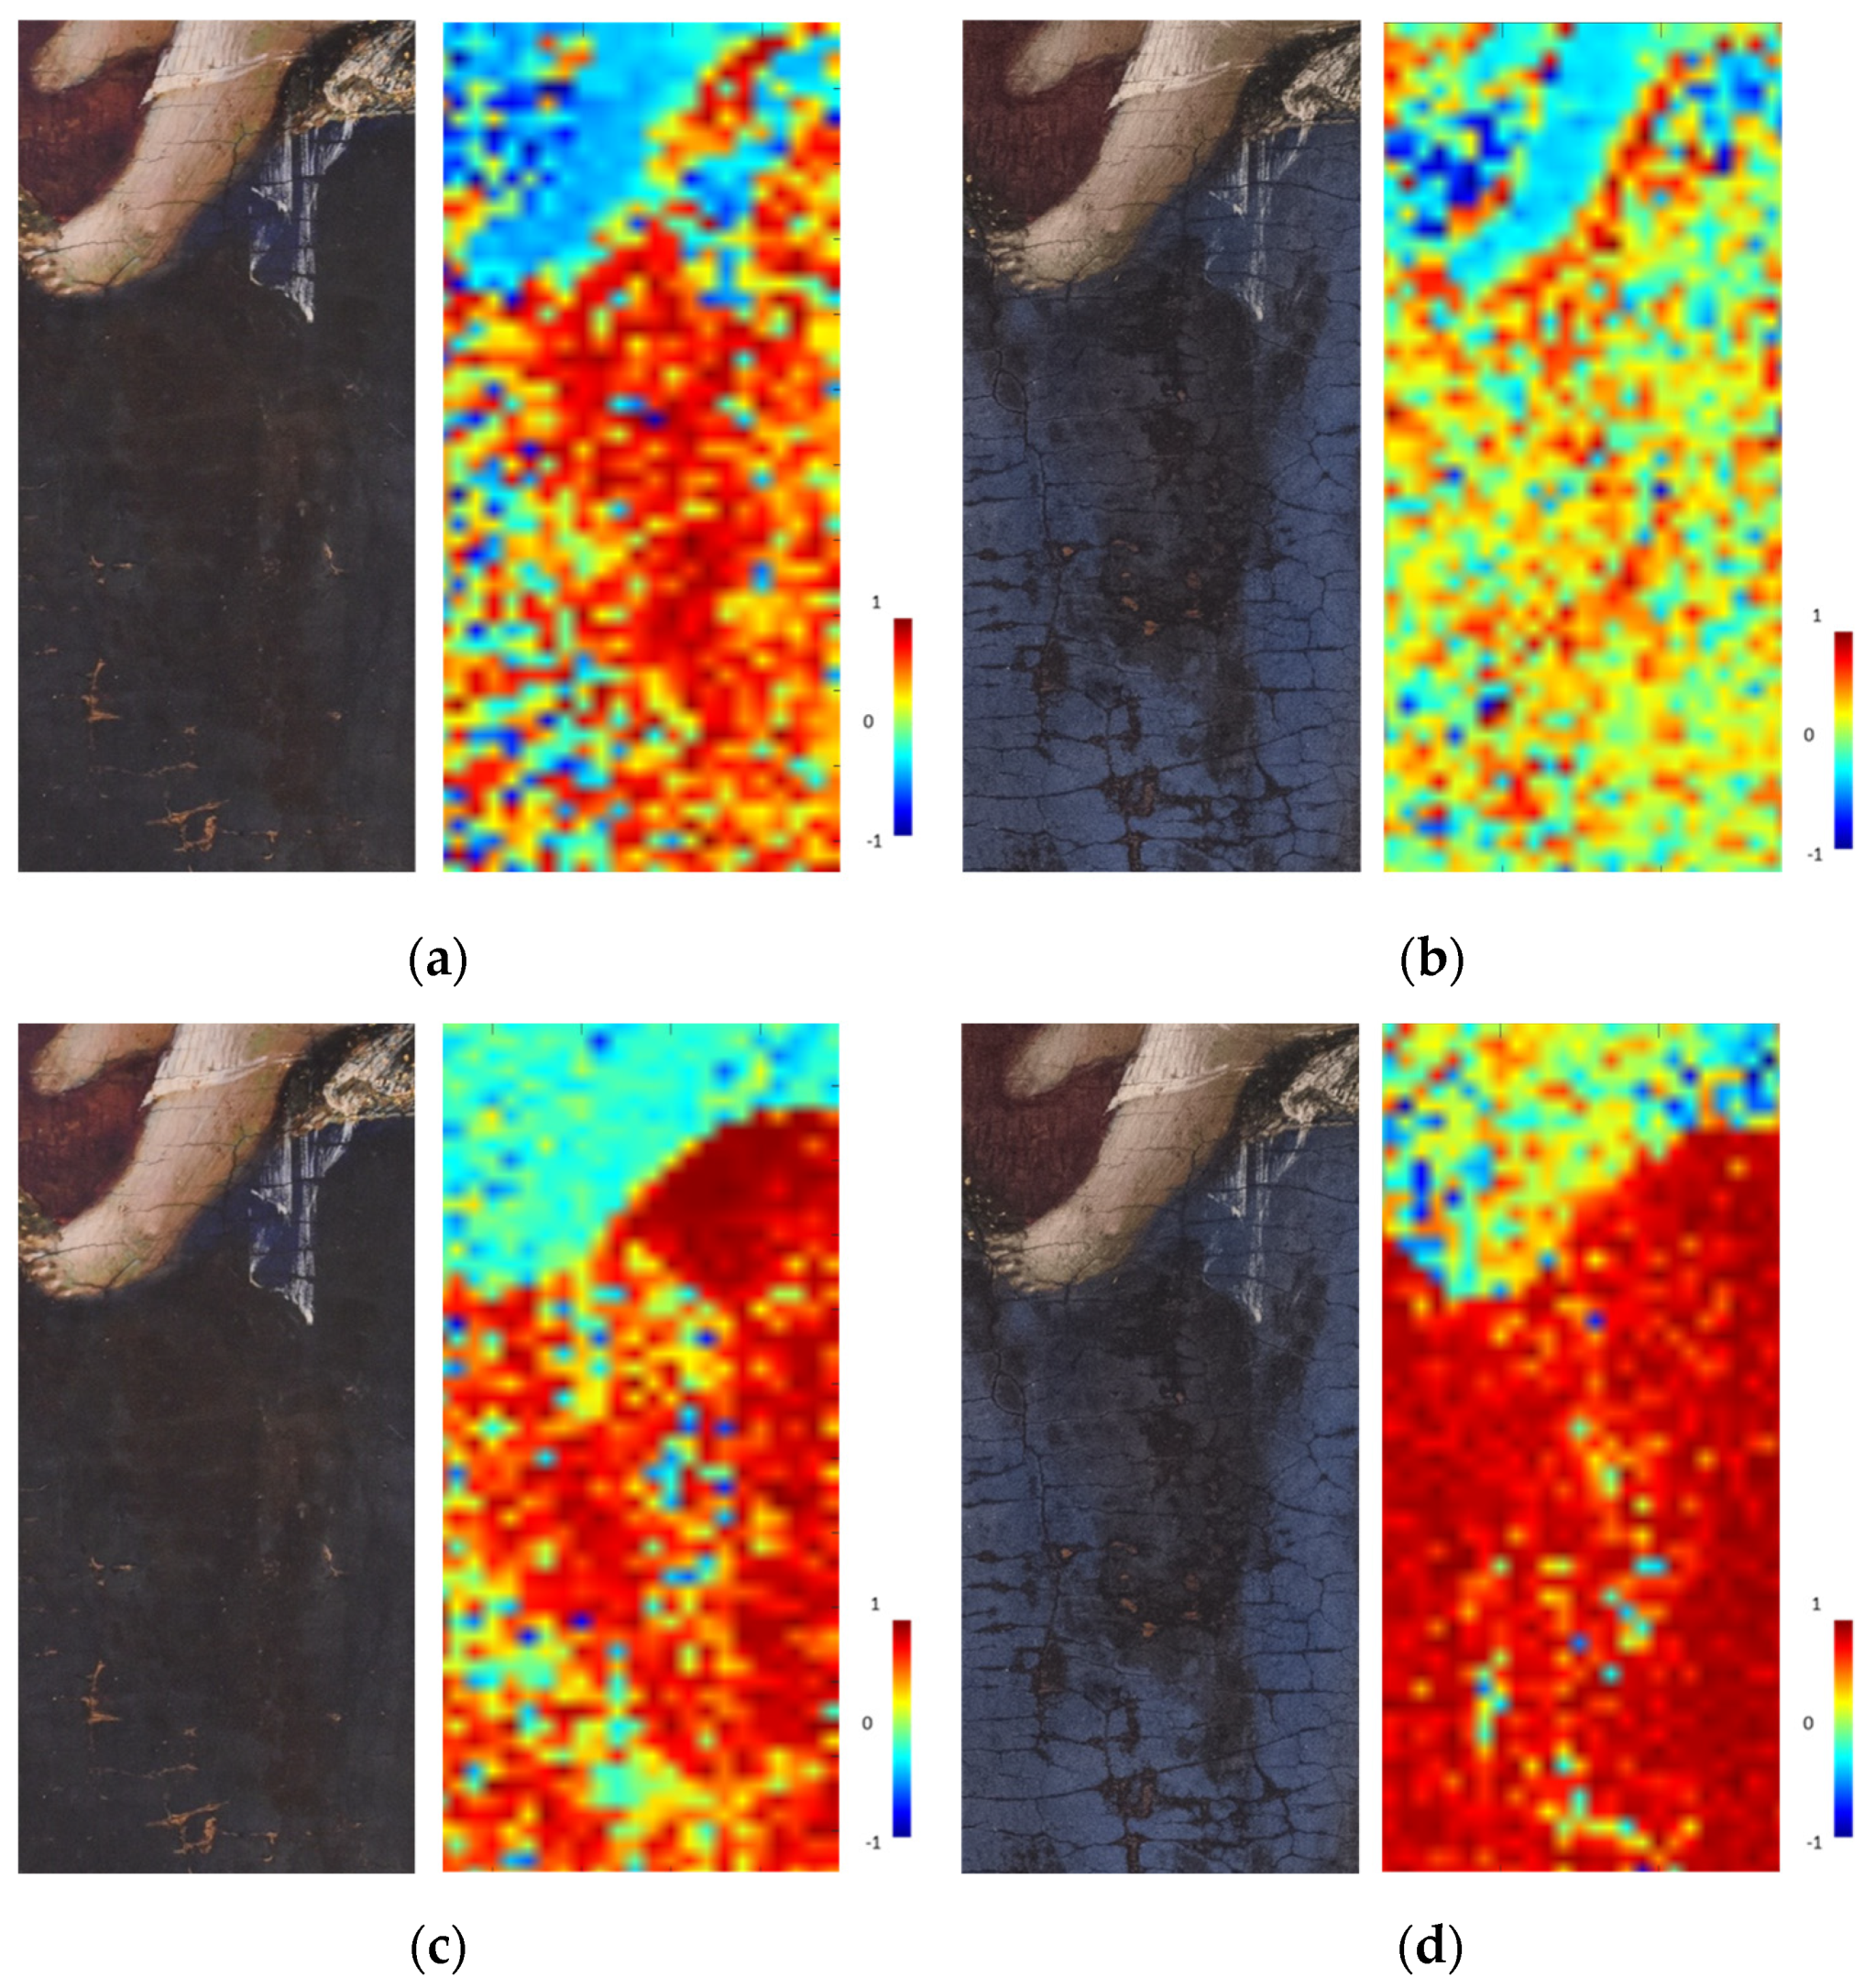
3.1. The 13th-Century Wooden Painted Cross

Micro-FTIR analyses were performed on some samples of the cross. In this study, we present the spectra obtained from two samples taken from the superimposed layer above the blue background, near the right hand of Christ. As depicted in Figure 2, measurements on one sample revealed absorption bands indicative of the following:
-
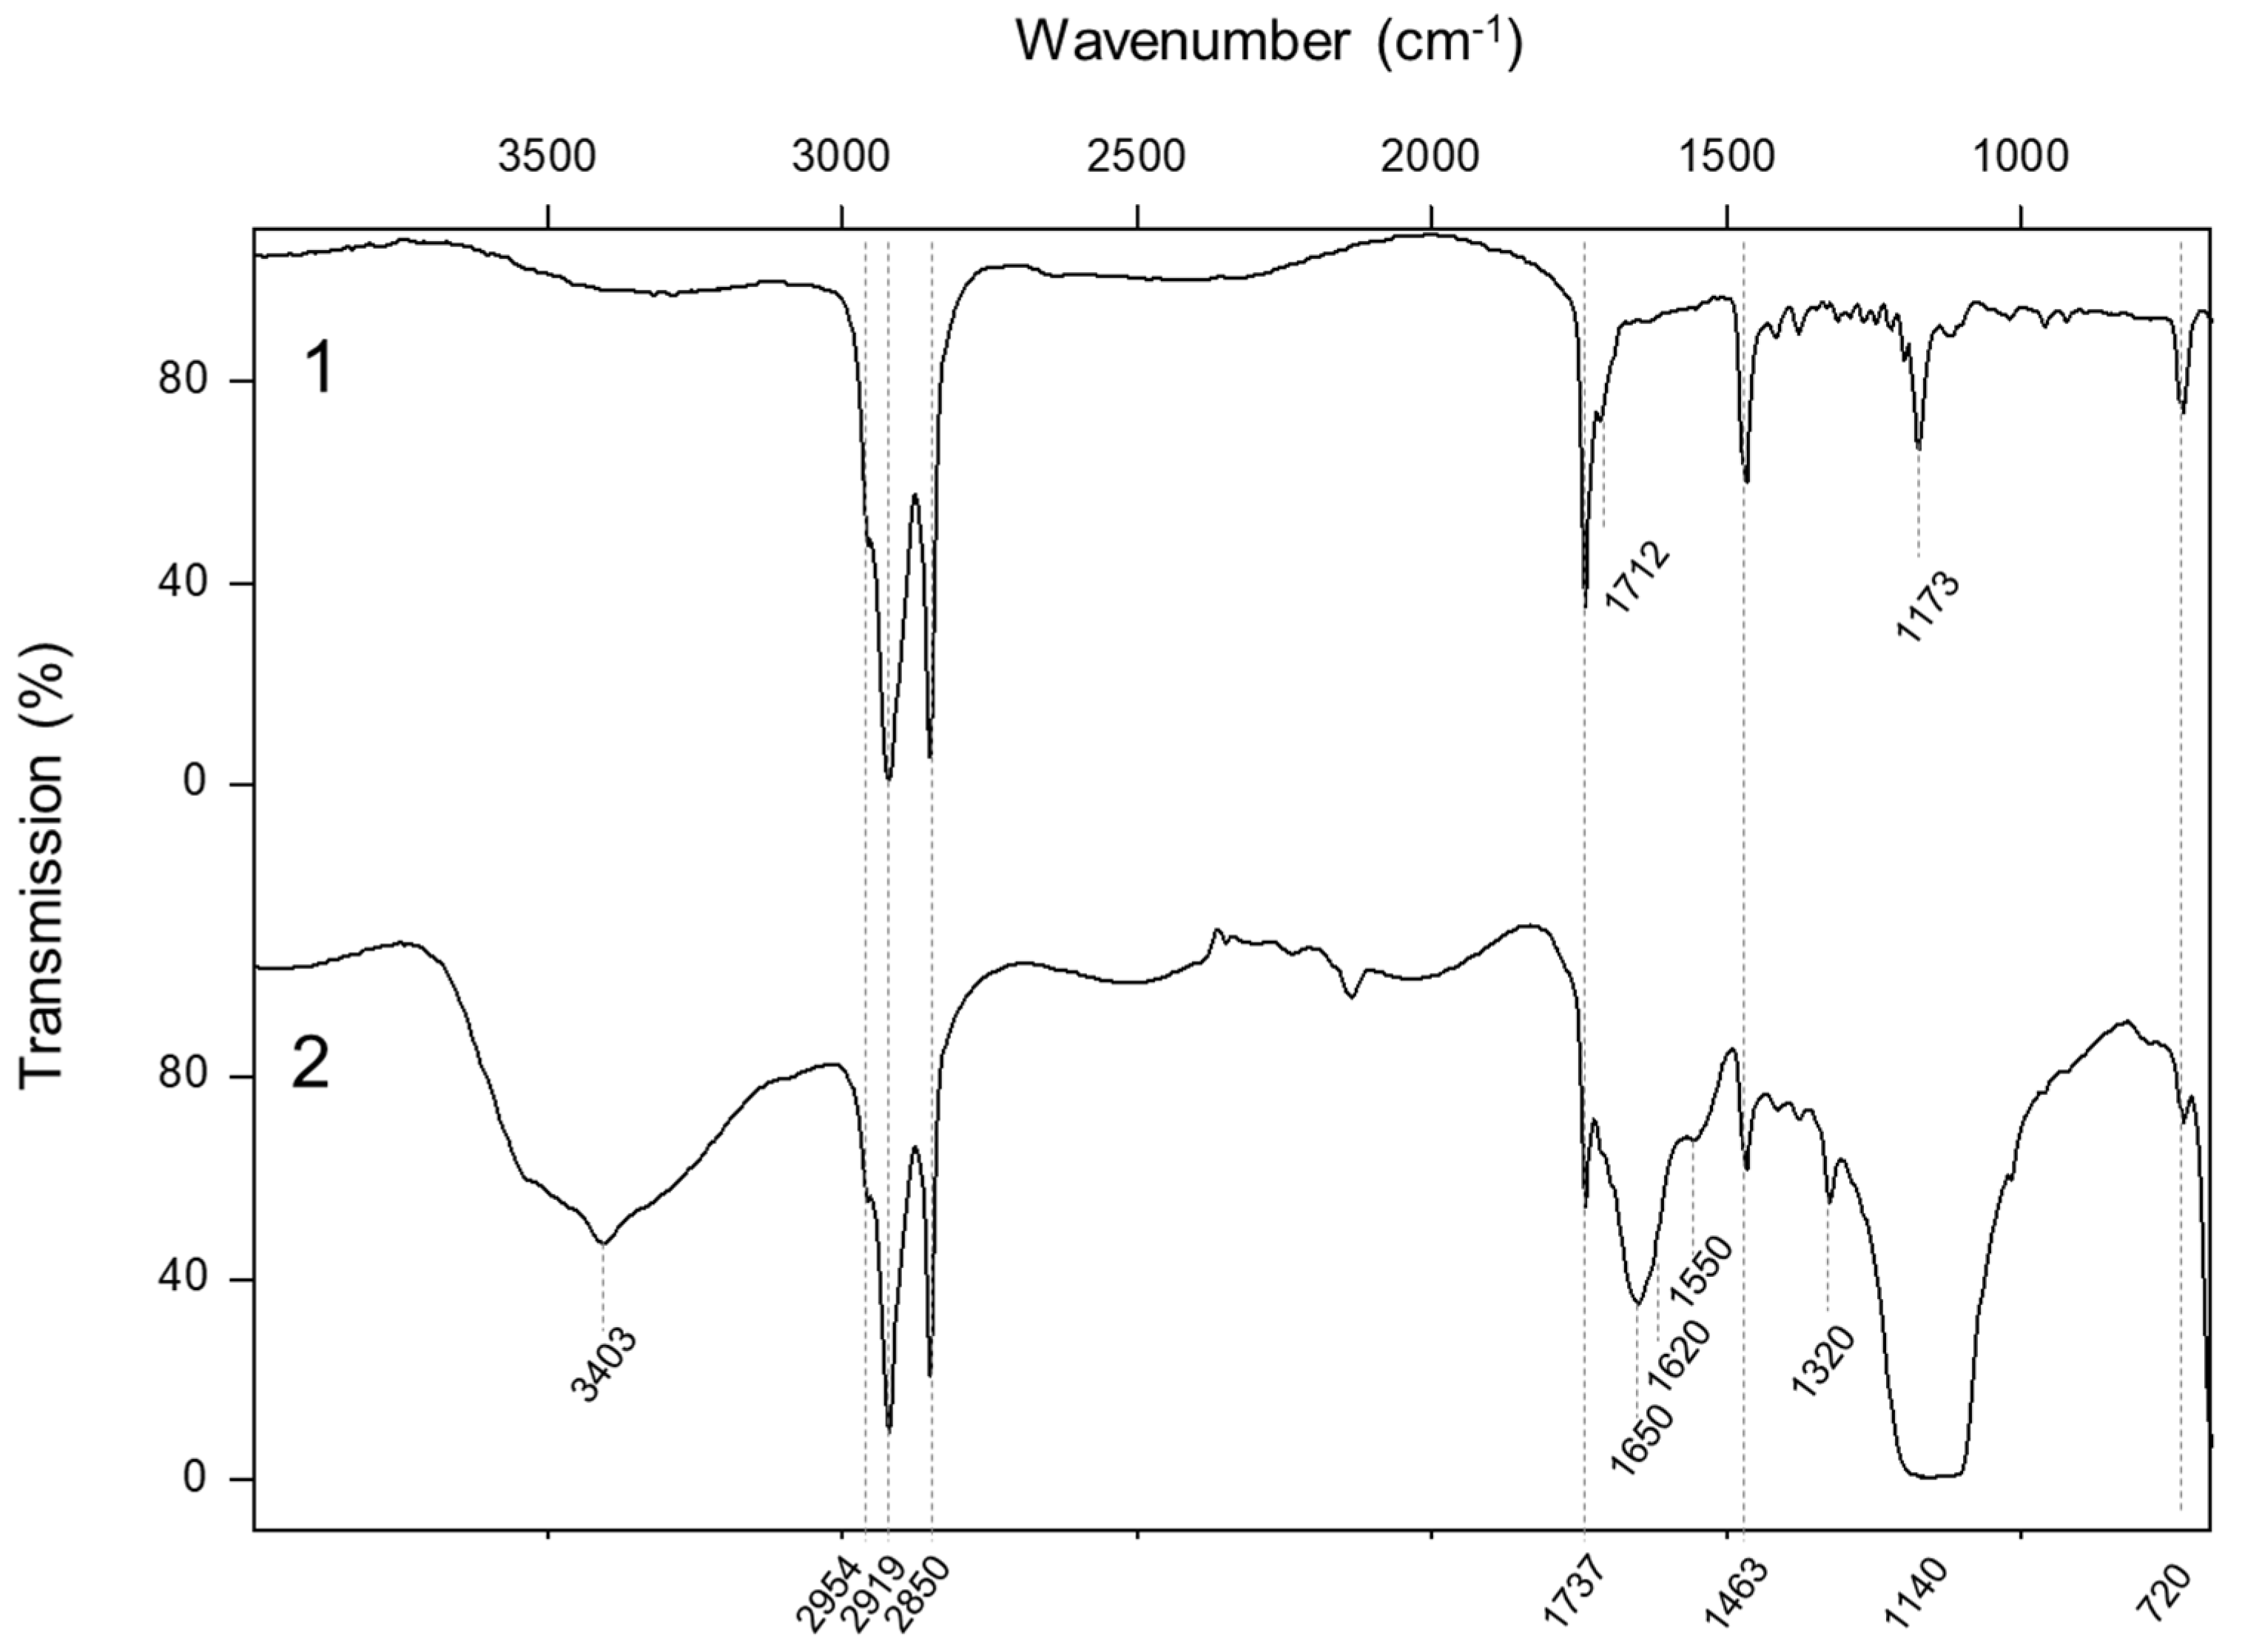
Beeswax characterized by the bands at 2954 cm1 (asymmetric stretching of CH3), 2910 and 2850 cm1 (stretching mode of CH2), 1737 cm1 (C=O stretching mode), 1463 cm1 (CH2 scissoring mode), 1173 cm1 (C=O stretching and CH bending vibrations) and 720 cm1 (CH2 rocking mode) [38];
-
Gypsum identified by the bands at 3403 cm−1 (OH stretching mode), 1620 cm1 (OH bending mode) and 1140 cm1 (asymmetric stretching ν3 of SO42−) [39,40];
-
Calcium oxalate detected by the band at 1320 cm1 (C-O stretching mode) [41];
-
Proteins revelated by the bands at 1650 and 1550 cm1, attributed to the carbonyl stretching vibration (C=O) of the amide I and to a mixture of N-H bending and C-N stretching modes of the amide II, respectively [42].
The analyses suggest the presence of a thin superimposed layer of beeswax over the original paint layers and an underlying thicker proteinaceous layer partially altered into calcium oxalate. The occurrence of gypsum may be attributed to migration from the preparatory layer. This insight into the composition of the superimposed layers aids in understanding the materials involved and guides the selection of appropriate cleaning treatments for the restoration of the 13th-century wooden painted cross.
To minimize the need for extensive sampling and ensure a non-invasive assessment of cleaning treatments, various non-invasive approaches were employed. The analyzed areas are delineated in Figure 3, with specific focus on three regions:
-
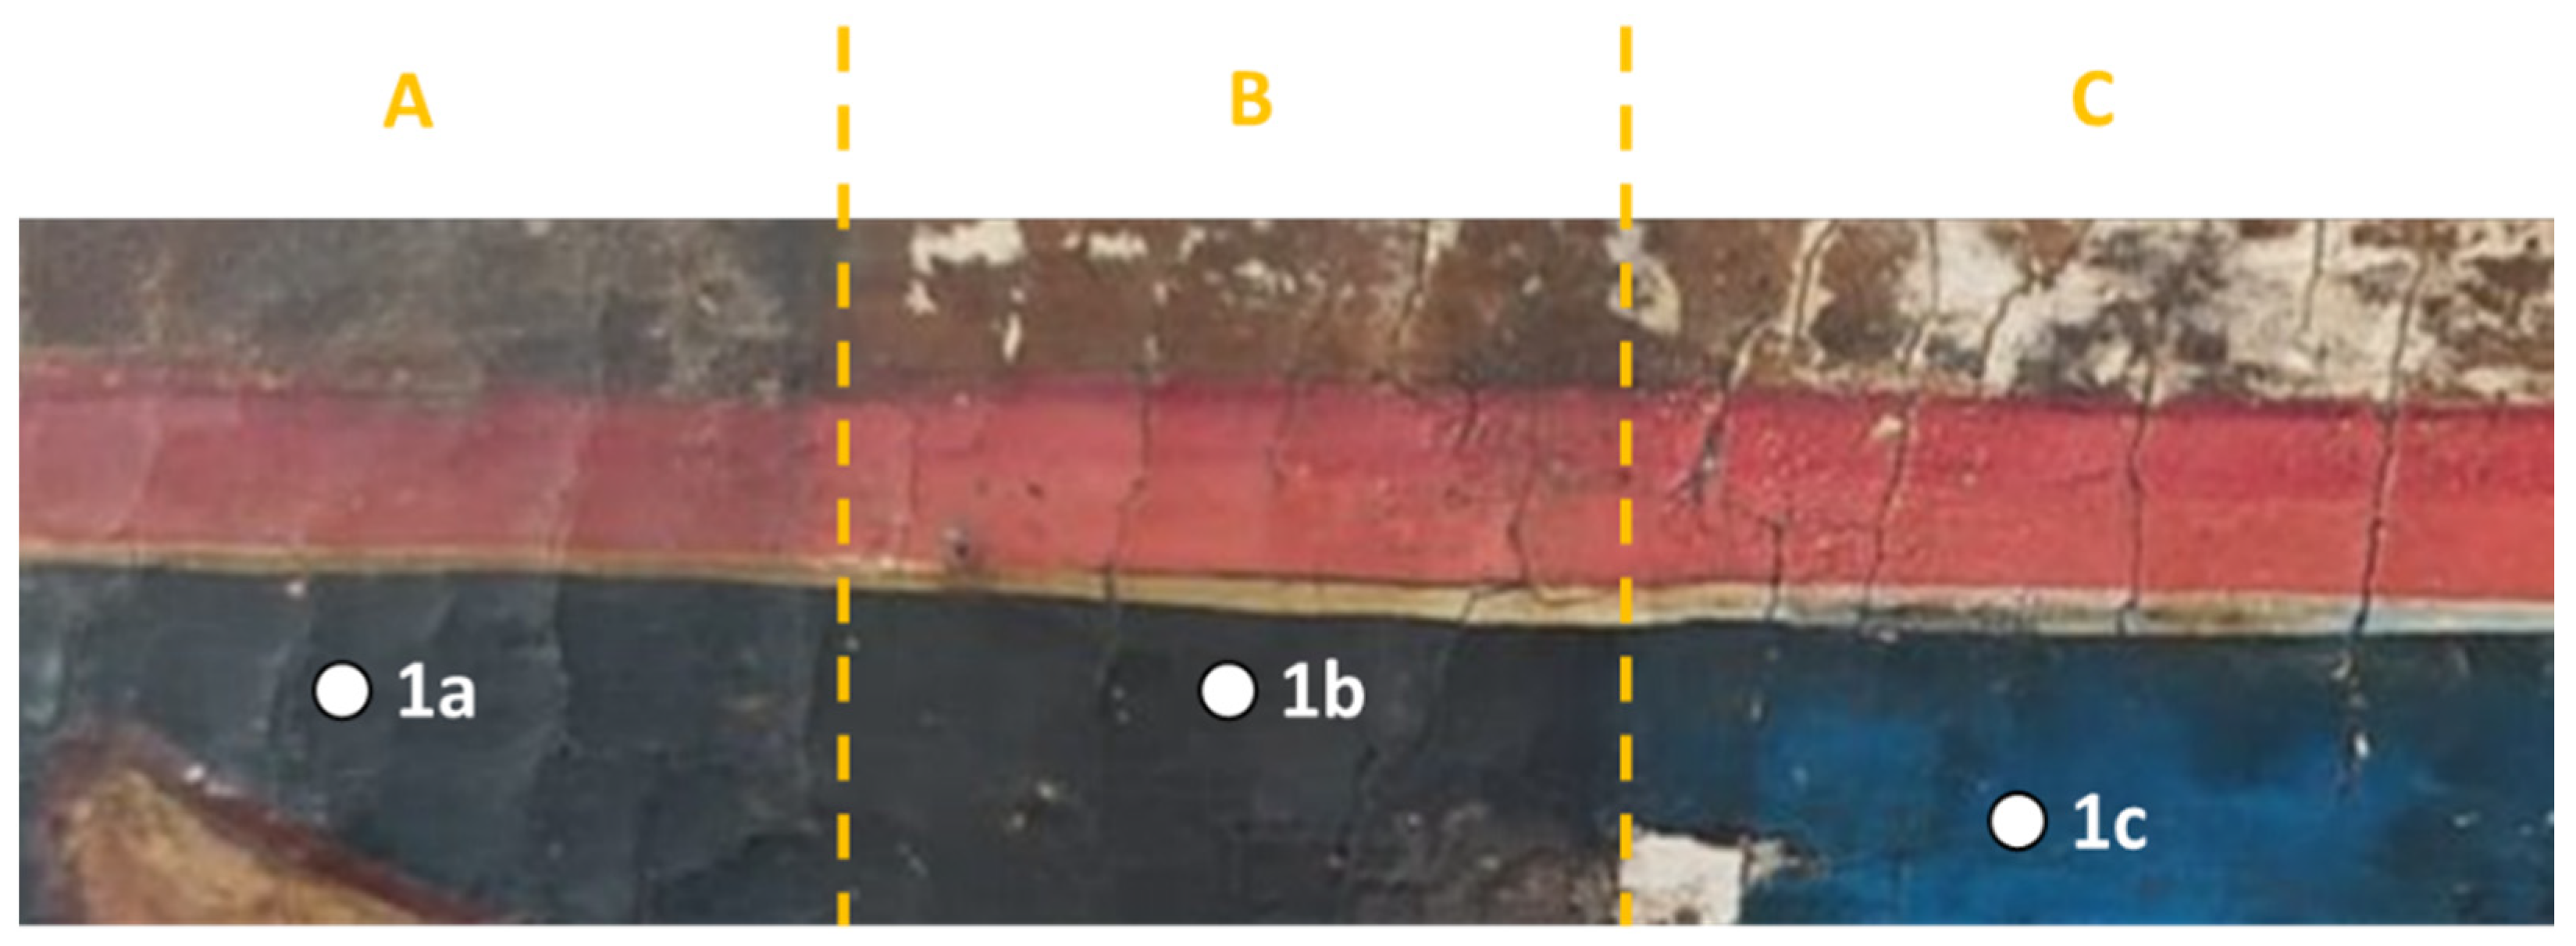
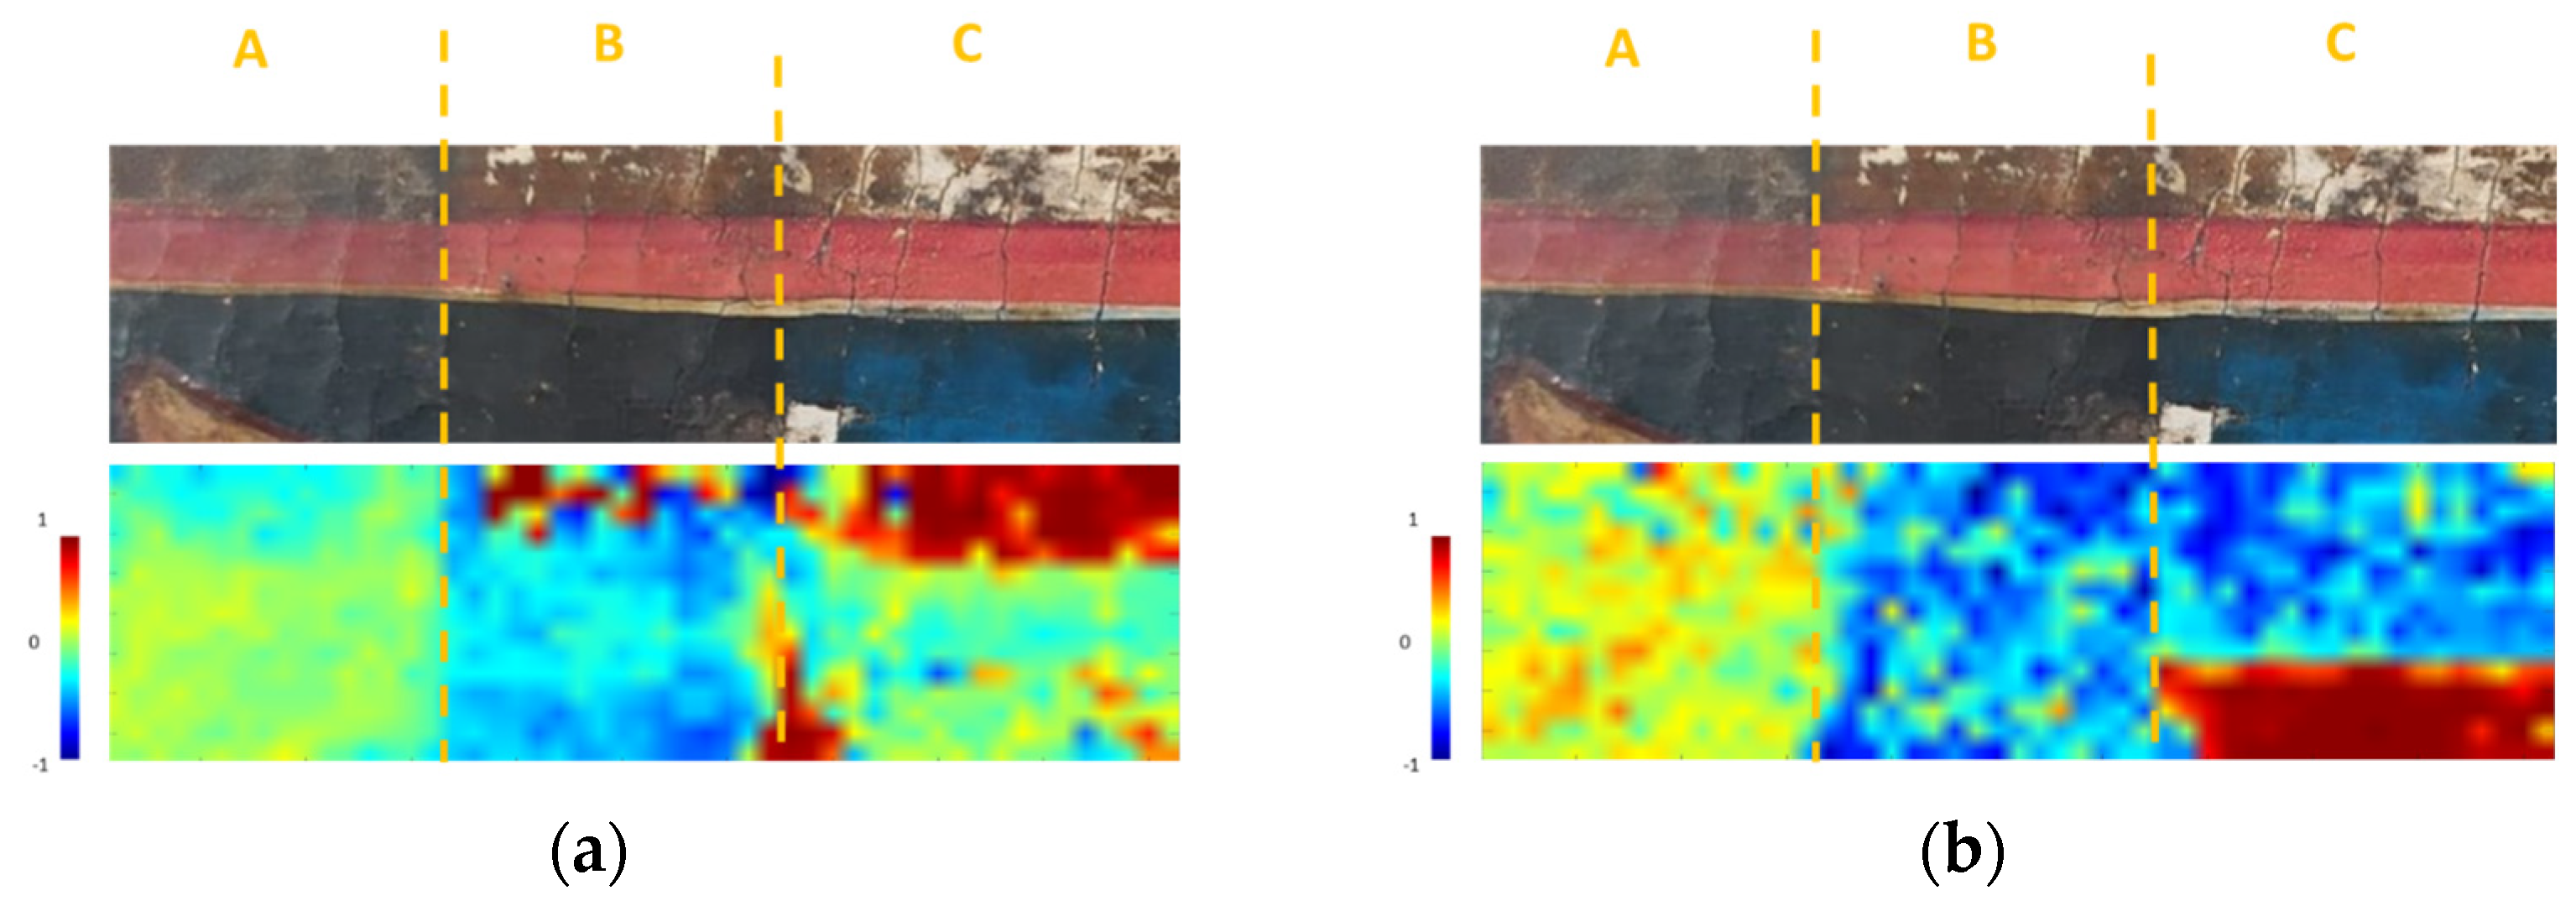
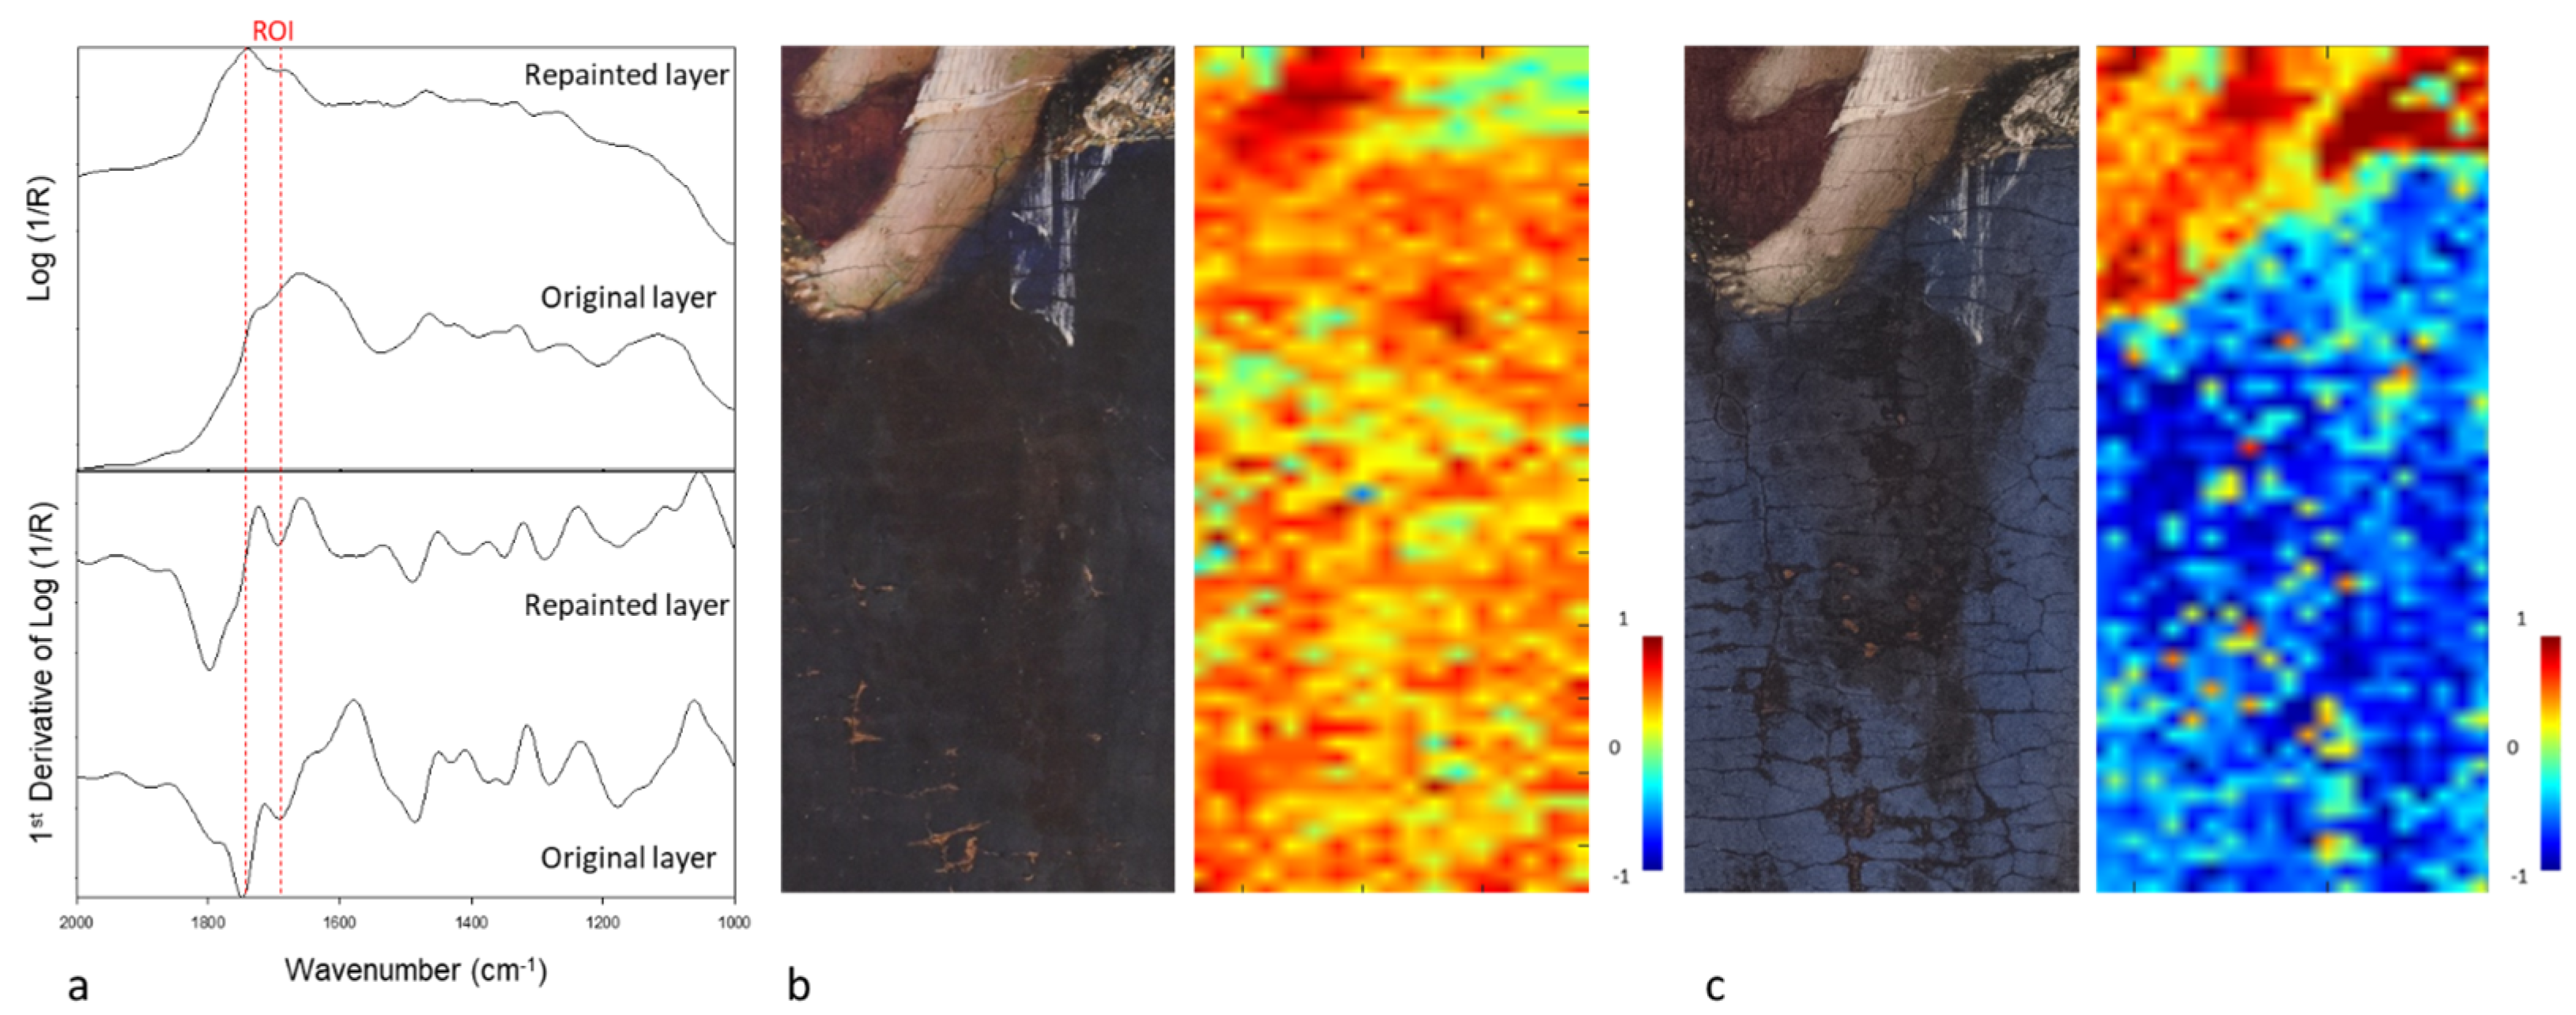
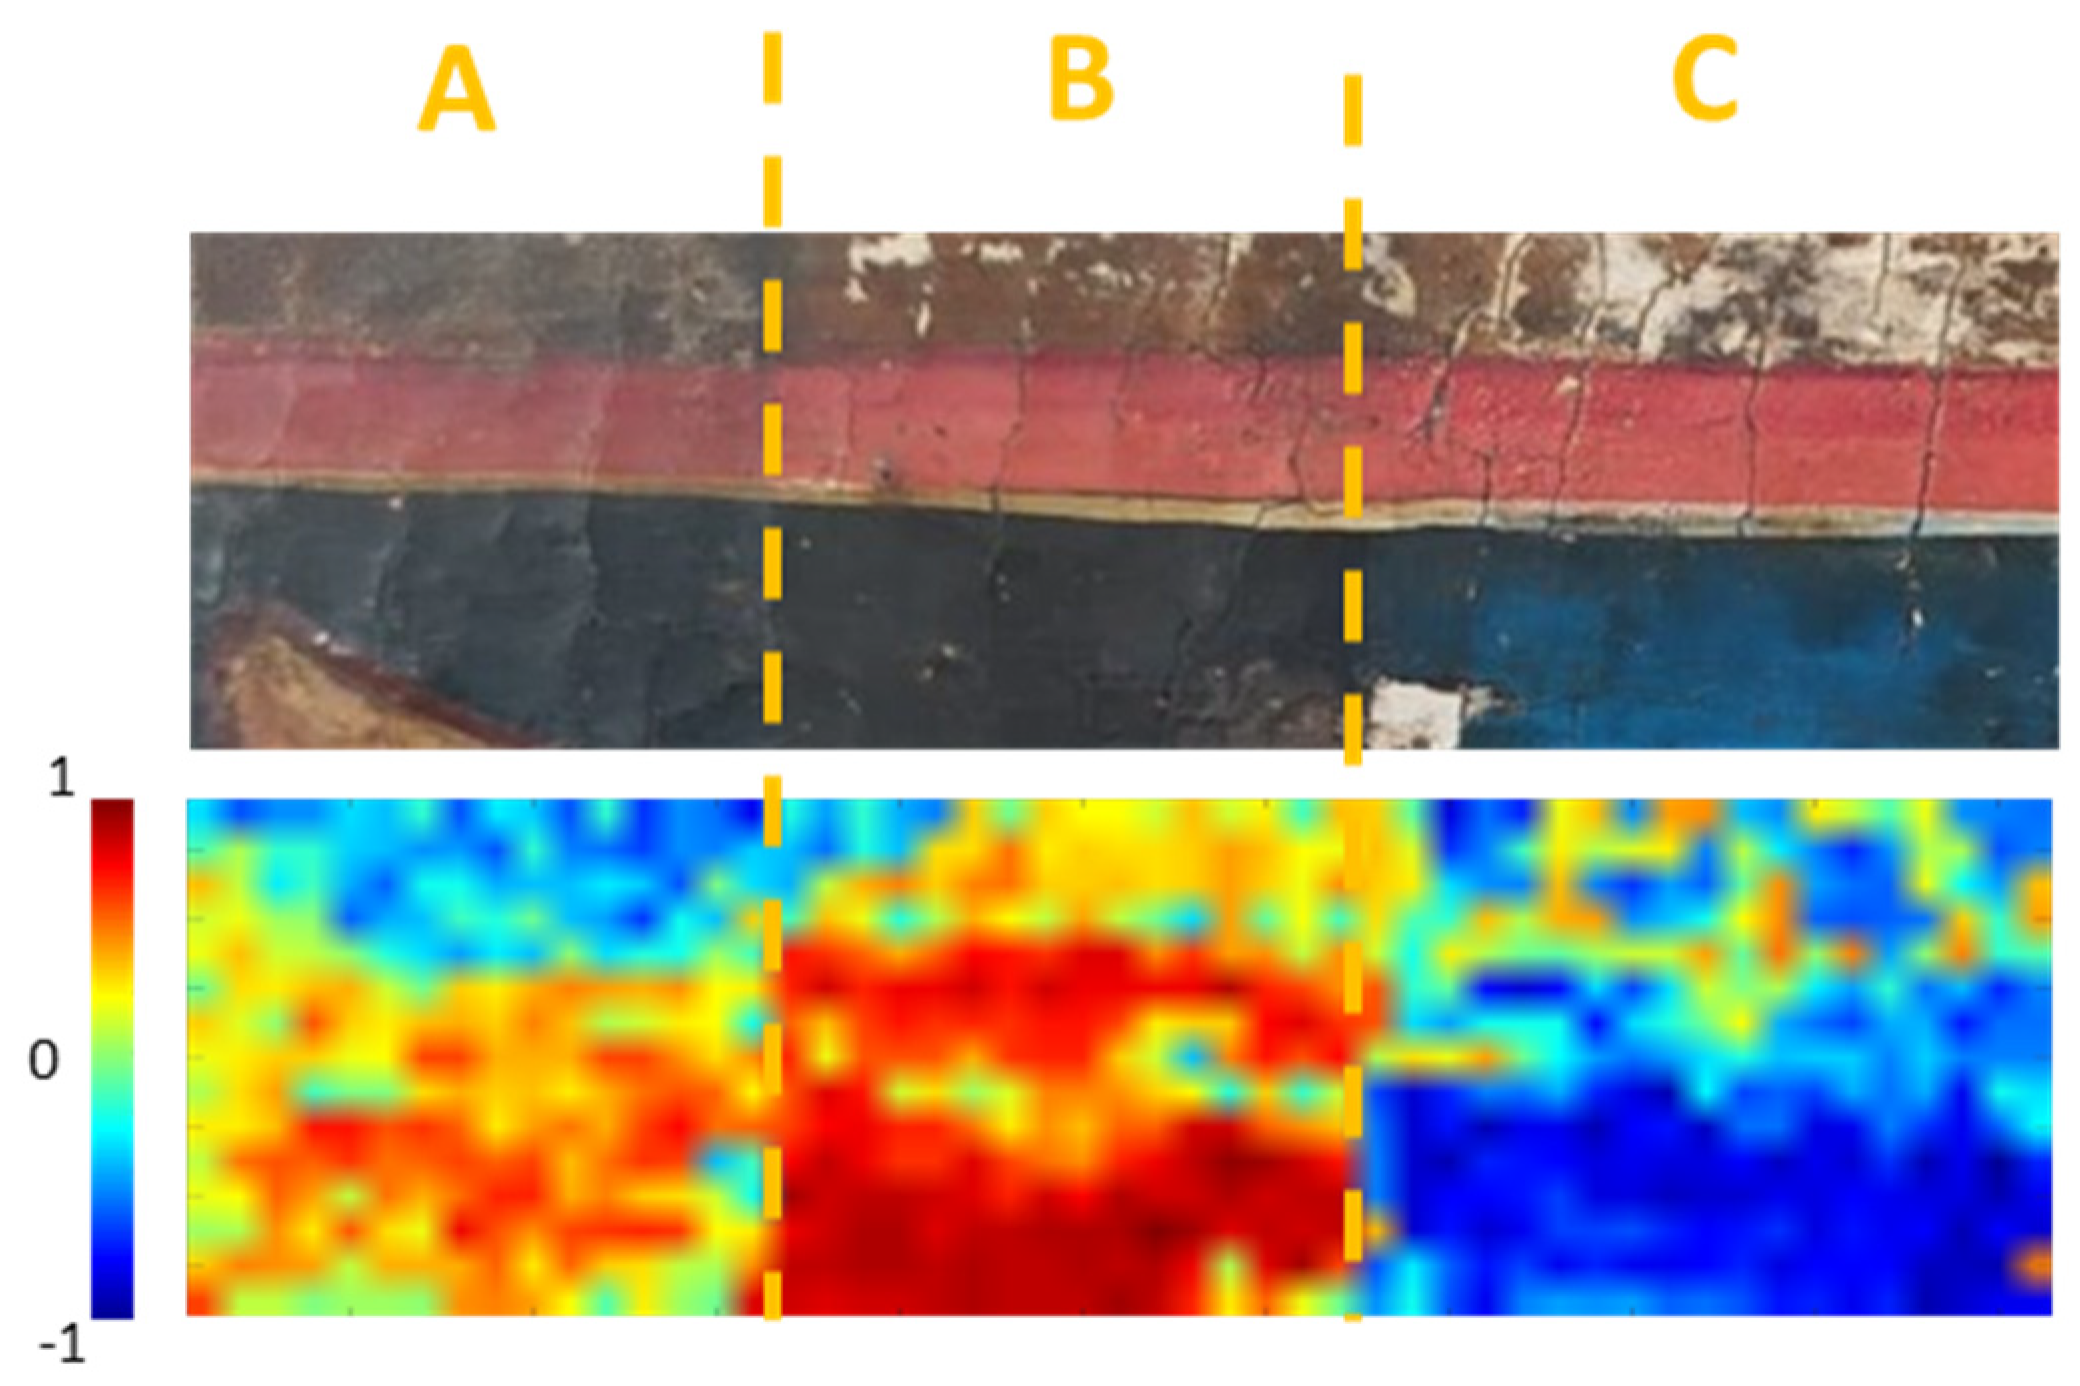
Area A represents the untreated surface, encompassing a superimposed layer covering the pictorial layer.
-
Area B corresponds to the region subjected to chemical cleaning.
-
Area C involves a combination of laser ablation and chemical cleaning.
This non-invasive monitoring strategy allows for the comprehensive evaluation of the impact and effectiveness of different cleaning interventions on the 13th-century wooden painted cross without the need for extensive and potentially damaging sampling.
The point-by-point rFTIR analysis conducted in the blue areas revealed that the spectrum of the non-original superimposed layer, displayed in Figure 4 (1a spectrum), primarily shows, as follows:
-
Lipid content that is identified by a doublet at 4330 and 4261 cm−1, attributed to the νa + δa and νs + δs of the aliphatic methylene groups [27] and three derivative-like bands at 2929, 2860 cm−1 and 1730 cm−1 [27,43];
-
Protein content that is detected by the amide II derivative-like band at 1550 cm−1 [43];
-
Calcium oxalates detected by the inverted band at 1616 cm−1 and the derivative-like band at 1316 cm−1 [44,45];
-
Gypsum identified by the inverted band at 1140 cm−1 and two derivative-like bands at 680 and 600 cm−1 [39,40]. Moreover, the derivative like-band at 3400 cm–1 is observed [46];
-
Silicates that are recognized by inverted bands between 1120 and 1020 cm−1 and iron ores detected by the bands between 550 and 400 cm−1 [47,48,49,50,51];
-
Calcium carbonate that is identified by an inverted band at 1410 cm−1 and a derivative-like band at 875 cm−1 [52];
-
Natural resins detected by a band at 1375 cm–1 (CH3 bending) [43].
Additionally, the presence of azurite as a blue pigment was indicated by the detection of the overtone 3ν3 of CO32− and the combination ν + δ (OH) at 4376 and 4250 cm−1, respectively [52]. This insight into the composition of the non-original layer provides valuable information for understanding the materials involved and aids in the formulation of effective cleaning treatments during the restoration process. The assigned bands are reported in detail in Table 1.
The obtained results align with those from micro-FTIR, reinforcing the conclusion that the superimposed layer is predominantly composed of lipid and protein contents along with calcium oxalates. Notably, since micro-FTIR detected beeswax, the presence of lipids is attributed to this substance rather than the use of egg yolk. The identified silicates, iron ores and calcium carbonate are likely associated with dust, while gypsum may have migrated from the preparatory layer.
Following the chemical cleaning in the blue area, a significant reduction in the contribution of calcium carbonate, gypsum, and silicate is observable, as reported in Table 1. The spectrum, displayed in Figure 4 (1b spectrum), primarily exhibits intense bands of calcium oxalate (1620 *, 1316 * cm1), indicating that the initial cleaning process effectively removed the superficial layer containing beeswax, dust, and gypsum. However, the layer containing oxalates, situated above the azurite pictorial layer, remained largely intact.
Upon the application of the combined action of laser ablation and chemical cleaning, there is a substantial reduction in calcium oxalate, and the absorption bands of azurite become prominent (3440 *, 2590, 2555, 2503, 1466 *, 1423 * cm1) [52,53], as reported in Figure 4 (1c spectrum) and Table 1. This observation suggests that the cleaning process was successful in revealing the original pictorial layer, effectively eliminating the calcium oxalate layer.
Due to the potentially uneven distribution of cleaning processes on treated surfaces, MA-rFTIR was employed to primarily monitor the reduction in the calcium-oxalate-containing layer patina. The Pearson correlation coefficient algorithm was utilized for this purpose. The spectral features of calcium oxalate include an intense inverted band at 1620 cm1 and a less intense derivative-like band at 1320 cm1. Given the potential overlap of the first band with the amide I of the proteins, the correlation map was generated using the second band, with a selection of the 1400–1200 cm1 region of interest (ROI).
As depicted in Figure 5, calcium oxalate is not only present in the untreated area (specifically above the blue layer) but also characterizes the chemical composition of the surface after chemical cleaning, corroborating the results obtained from point-by-point analyses. Furthermore, calcium oxalate is notably distributed on the blue and red pictorial layers, suggesting the utilization of protein binders as media for these pigments. This information contributes to a comprehensive understanding of the cleaning process’s impact on different regions of the painted cross.
Following the combined laser and chemical treatment, the removal of the oxalate layer was significant, revealing the original pictorial and preparatory layers. This is vividly illustrated in Figure 6 through the observation of the correlation maps of gypsum (ROI: 1000–1200 cm−1) and azurite (ROI: 1380–1500 cm−1). Gypsum predominantly appears in the white areas and is attributed to the preparatory layer, which was created using gypsum and animal glue. By contrast, the characteristic bands of azurite in the mid-IR are only detected after the implementation of this combined cleaning treatment. This visual evidence underscores the effectiveness of the treatment in uncovering the authentic layers beneath the previously obscured surface.

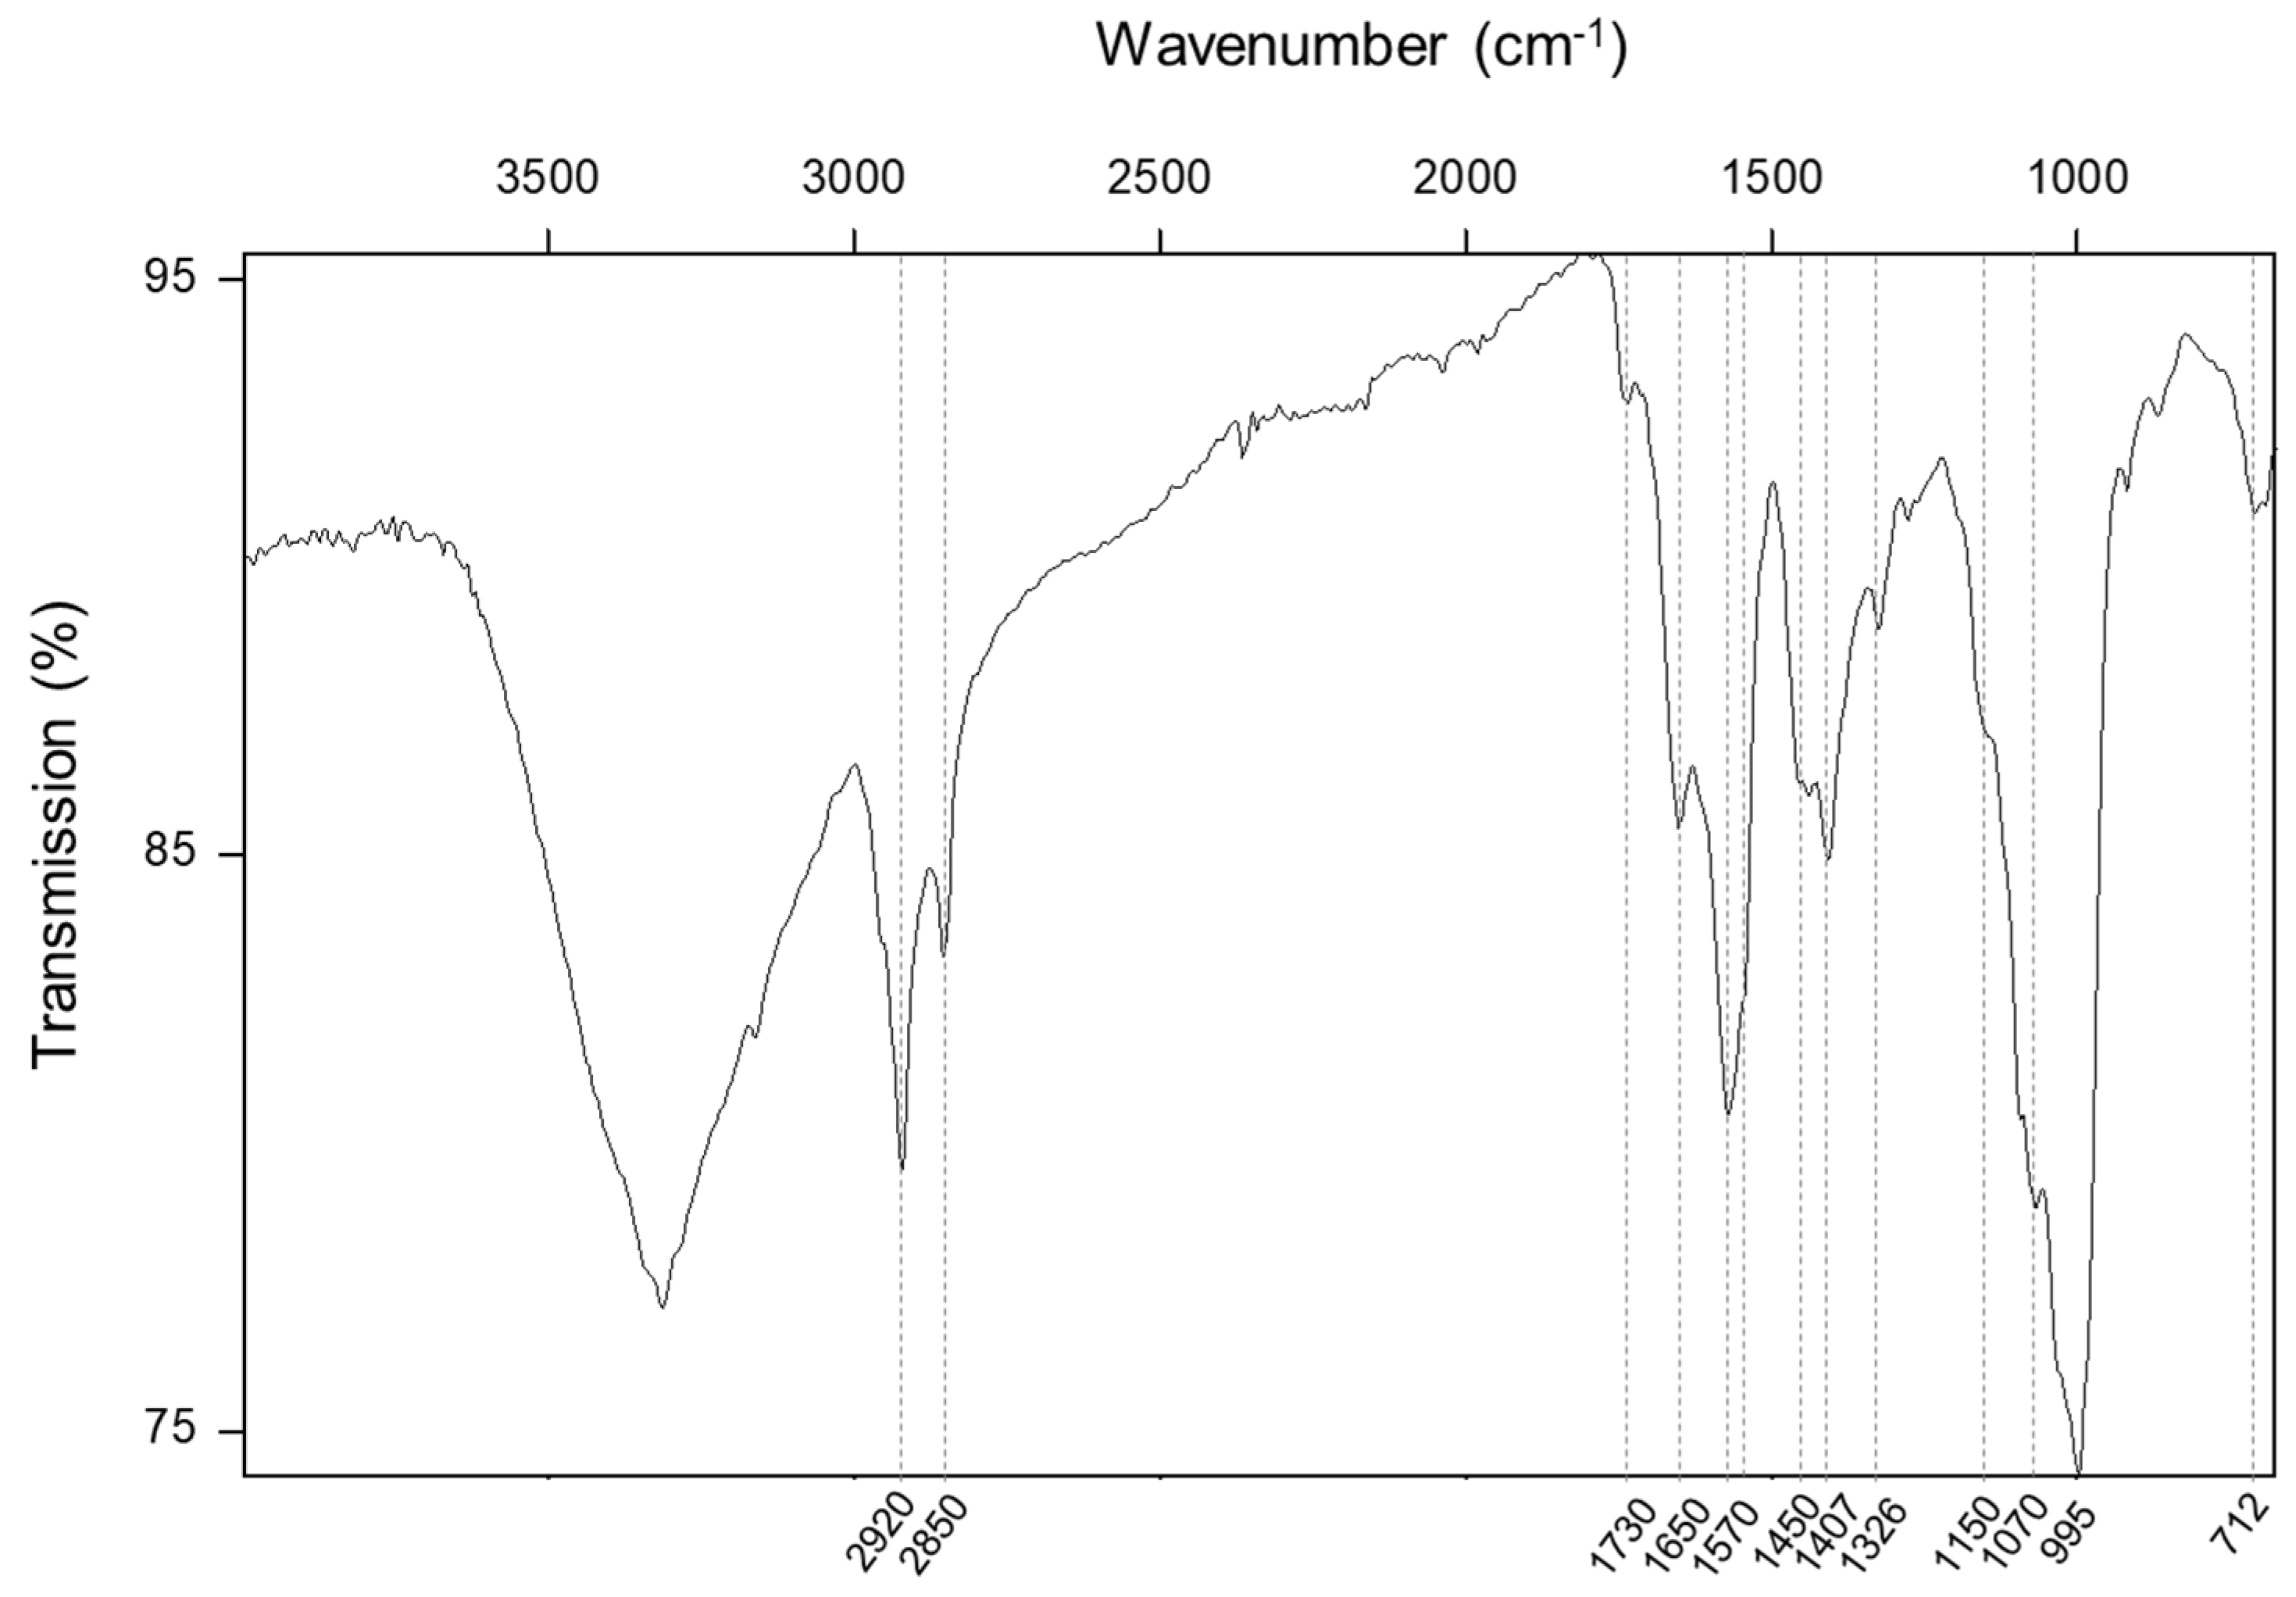
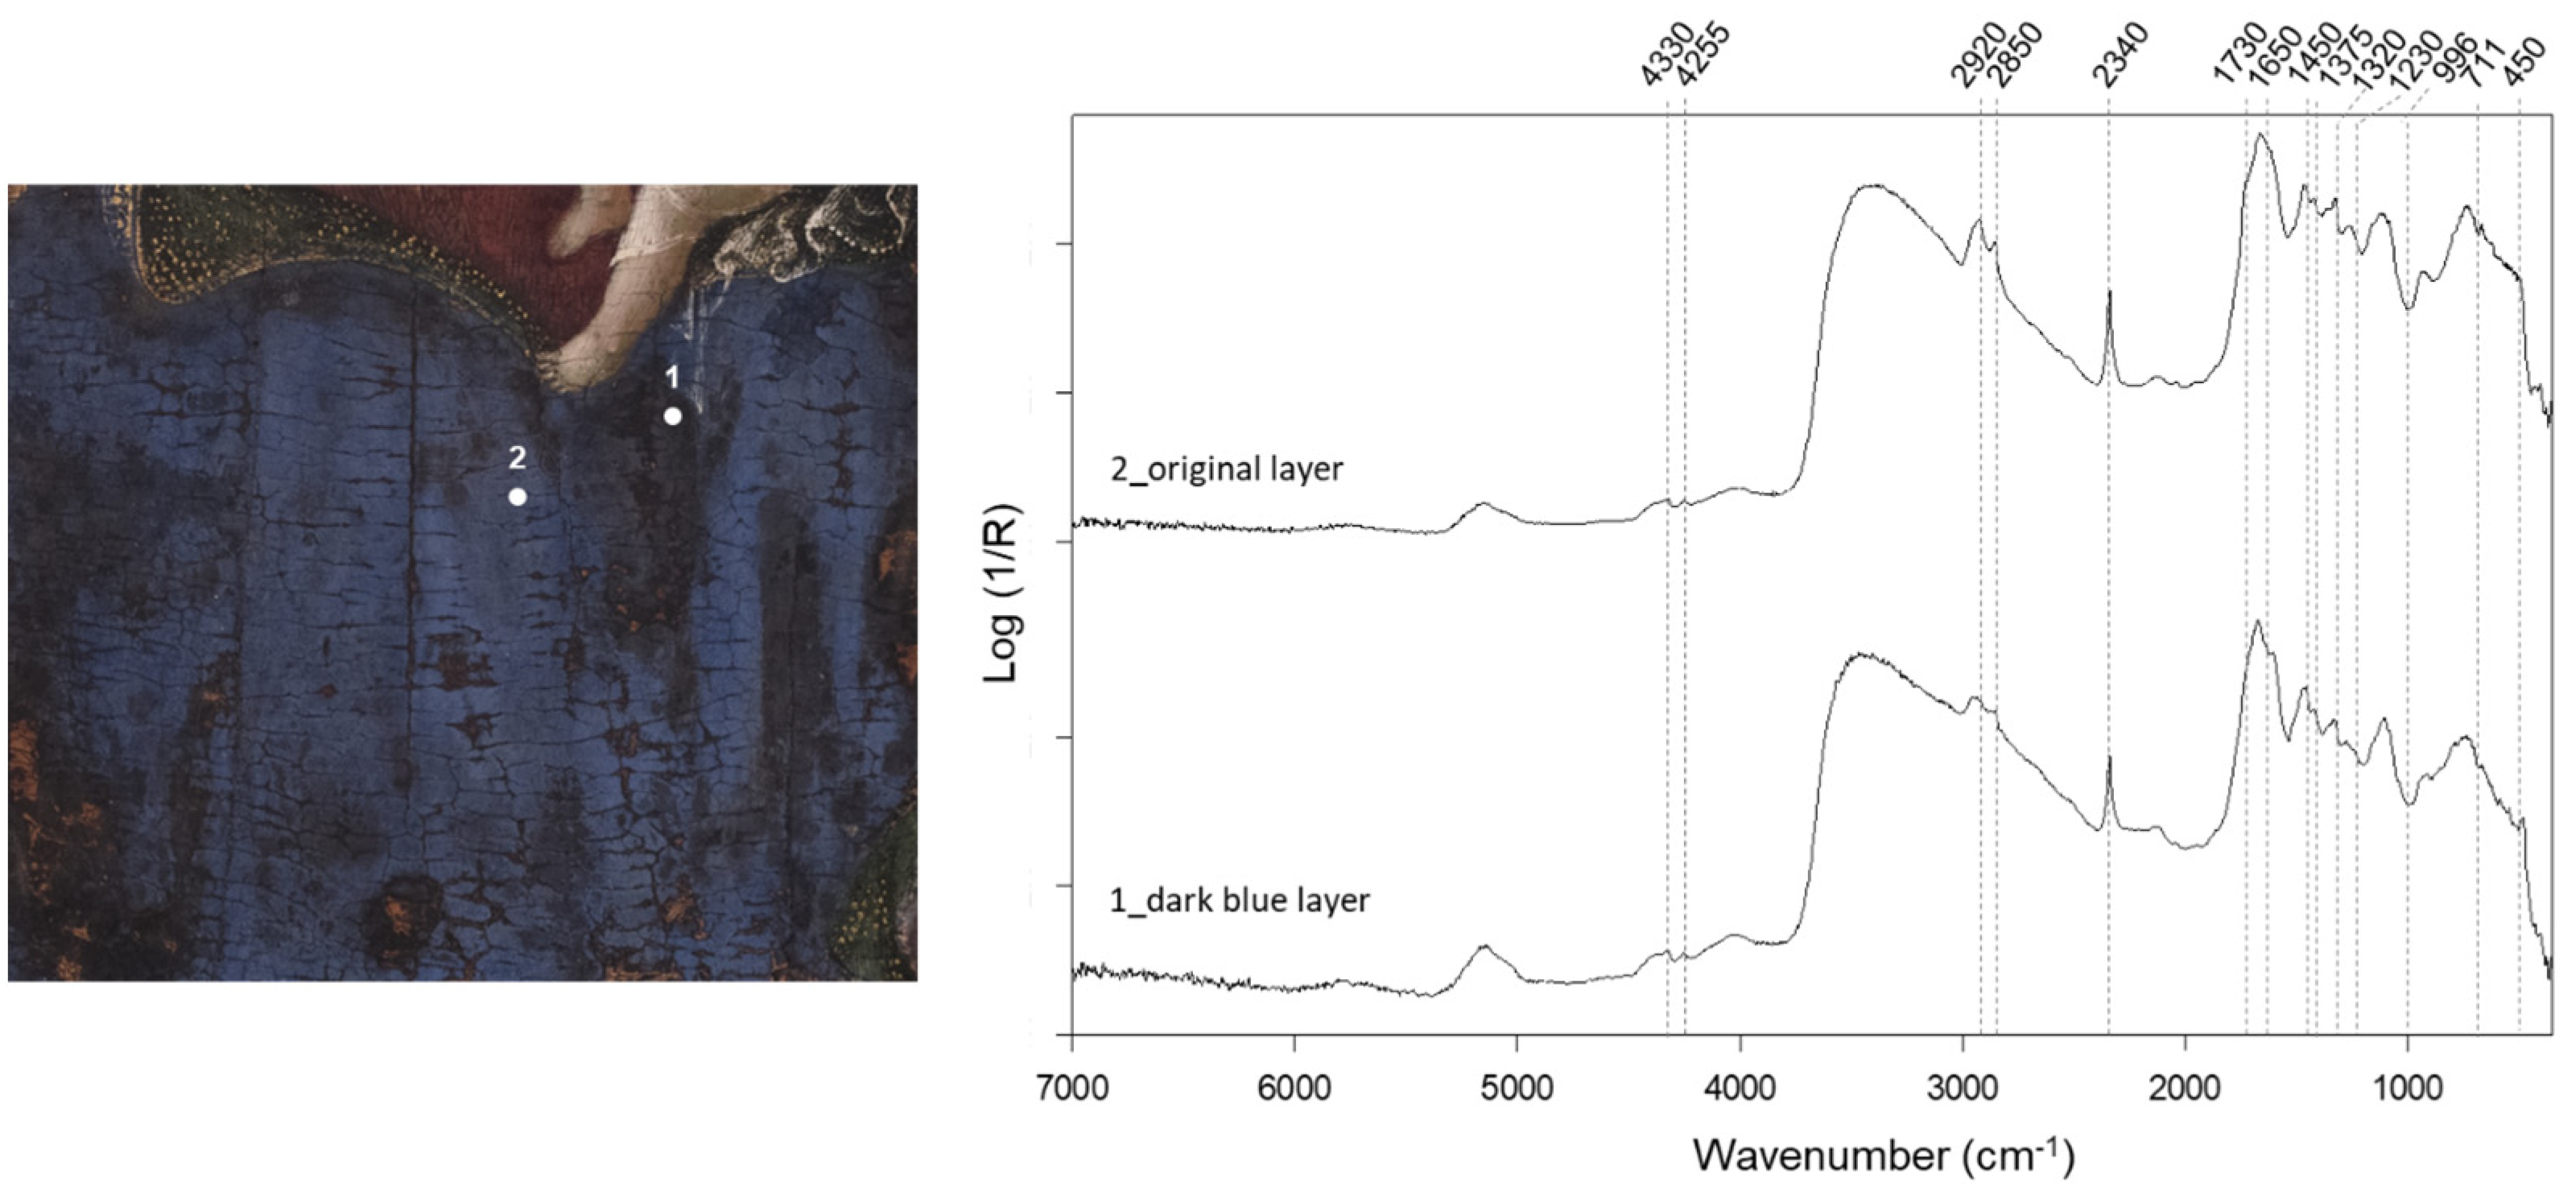
3.2. Panel Painting Titled “Madonna in Trono con Bambino, Miracolo delle Stimmate di San Francesco, Santi Antonio Abate e Bartolomeo, Crocefissione, San Cristoforo” by Arcangelo di Cola

The analyzed area of the panel painting is illustrated in Figure 7, with a specific focus on the Virgin’s mantle, which exhibits a repainted layer appearing as a dark blue layer, revealed after the removal of a superficial glue coating.
A micro-FTIR spectrum performed on a sample taken from the dark blue layer reveals the presence of lipid content (2920, 2850, 1720, 1450 and 711 cm−1) [43], proteins (1650, 1550, and 1450 cm−1) [42], calcium oxalate (1320 cm−1) [44], metal-carboxylates (1570 and 1540 cm−1, attributed to COO stretching mode) [44,54], calcium carbonate (1406 and 870 cm−1) [48], and aluminosilicates (995 cm−1 attributed to the O–Si–O anti-symmetric stretching mode) [55], as depicted in Figure 8. The results suggest that the pictorial layer is composed of a lipid binder (i.e., oil) and aluminosilicates (i.e., ultramarine blue) as the pigment. Additionally, the pictorial layer exhibits two degradation phenomena: carboxylates indicating the formation of metal soap [36] and calcium oxalates. Proteins and calcium carbonate may be attributed to contamination from the removed superficial layer.
The composition of the pictorial layer was further confirmed through point-by-point rFTIR spectra, as shown in Figure 9. These spectra exhibit absorption bands related to calcium oxalate (1620 *, 1320 + cm−1), a lipid substance (4340, 4260, 1730 +, 1450 + cm−1), and lapis lazuli pigment (2340, 996 *, 450 * cm−1) [52]. Particularly, the band at 2340 cm−1 is attributed to the presence of S6, to HS3, and to CO2 confined in the octahedral framework of the mineral during its formation [56].
The cleaning process, utilizing PVA/Borax and chelating gel, aimed to remove the repainted layer to reveal the original pictorial layer, even though it was interpenetrated within the original layer. Consequently, the analyses were directed towards assessing the reduction in the lipid content primarily associated with the binder of the repainted layer.
The point-by-point FT-IR analyses conducted after the cleaning processes indicated a significant reduction in lipid content, as shown in Figure 10. The revealed original pictorial layer is predominantly composed of a proteinaceous binder (1650 + cm−1) and lapis lazuli pigment (2340, 996 *, 450 * cm−1). Additionally, the presence of calcium oxalate (1320 + cm−1) was detected in the analysis.
Given that point-by-point analysis may not provide a comprehensive representation of material distribution, MA-rFTIR was employed to map the distribution of the carbonyl group (1730 cm−1) to evaluate the efficacy of repainted layer removal.
Due to the derivative-like appearance of the carbonyl band in reflection mode, a first derivative of the spectra was executed before applying the Pearson correlation coefficient. This step was taken to enhance and isolate the band attributed to lipid content, as depicted in Figure 11a. The correlation map of the carbonyl group before the restoration reveals an extensive distribution of lipid content in the Virgin’s mantle, which is almost entirely absent after the cleaning treatments, as shown in Figure 11b,c. A high correlation is also observed in the incarnate of the Child, associated with the presence of lead white, which presents a band at 1730 associated with ν1 + ν4 (CO32−) vibration modes [46]. Moreover, a notable correlation is identified on the Virgin’s robe and Child’s veil, attributed to the application of Paraloid b72, which exhibits a carbonyl group at 1730–1740 cm−1. This substantial reduction in lipid content demonstrates the effectiveness of the cleaning procedures.
Furthermore, we examined the distribution of calcium oxalate to assess if the cleaning processes contributed to its reduction. The correlation map of calcium oxalate (ROI: 1400–1200 cm−1) before treatment exhibits high correlation mainly in the central part of the Virgin’s mantle, as shown in Figure 12a. After the cleaning process, the distribution of oxalate appears significantly reduced, except for regions corresponding to dark areas in the visible image.
Additionally, a correlation map of lapis lazuli (ROI: 2290–2370 cm−1) before and after the cleaning treatments was generated, as displayed in Figure 12b, indicating the presence of this pigment in both the repainted and original layers. The non-uniform distribution of this pigment before treatment confirms the existence of a superimposed material, concealing the pigment signals beneath its thickness.

4. Conclusions

This study focuses on the potential of MA-FTIR for identifying superimposed patina and layers on original painted surfaces and evaluating the effectiveness of cleaning treatments.
Point-by-point FT-IR spectroscopy, as demonstrated in prior research, is a suitable technique for non-invasively detecting the efficacy of cleaning treatments. However, it falls short in achieving material distribution due to the high number of points that must be acquired. MA-rFTIR mapping addresses this limitation, allowing for the scanning of entire surfaces, obtaining an FT-IR spectrum for each point, and visualizing material distribution by using techniques like the Pearson correlation coefficient.
Two case studies were presented, showcasing the high capacity of MA-rFTIR mapping in assessing cleaning treatments on ancient pictorial artworks. For the 13th-century wooden painted cross, MA-rFTIR mapping revealed a layer containing calcium oxalate. After the combination of laser ablation and chemical cleaning, the calcium oxalate content was significantly reduced, revealing the original pictorial layer.
Similarly, MA-rFTIR mapping on the Virgin’s mantle of the “Madonna in trono con Bambino, miracolo delle stimmate di San Francesco, Santi Antonio Abate e Bartolomeo, Crocefissione, San Cristoforo” painting facilitated the evaluation of repainted layer removal after chemical cleaning with PVA/Borax and chelating gel.
In conclusion, MA-rFTIR mapping proves to be a valuable tool for assessing the efficiency of cleaning procedures and mapping material distribution on surfaces. Future advancements may include the application of precise chemometric analysis and the development of predictive models for monitoring material distribution. Moreover, since the IR depth penetration for FTIR measurements in reflection mode depends mainly on the optical transparency and refractive index of materials, the roughness of the surfaces, and the wavenumber, dedicated tests are required in order to evaluate the precise thicknesses being investigated.

Author Contributions

Conceptualization, L.P. and M.R.; methodology, L.P., M.R., M.I., F.F., A.D., E.C., I.S., G.T. and S.S.; formal analysis, L.P., M.R. and M.I.; data elaboration, L.P.; resources, M.C.G.; writing—original draft preparation, L.P.; writing—review and editing, M.R., F.F., M.I., A.D., I.S. and E.C.; supervision, M.C.G.; project administration, M.C.G. All authors have read and agreed to the published version of the manuscript.

Funding

Project PE 0000020 CHANGES-CUP B83C22005060006, NRP Mission 4 Component 2 Investment 1.3, Funded by the European Union-NextGenerationEU. ARTEMISIA project: Det. G07413 del 16.06.2021, pubblicata sul BURL n. 61 del 22.06.2021, Atto di Impegno del 18.10.2021, Avviso pubblico di LAZIO INNOVA, società in house della Regione Lazio, Accordo di programma quadro “Ricerca, Innovazione Tecnologica, Reti Telematiche” (APQ6)-Stralcio “Attuazione degli interventi programmatici e dei nuovi interventi relativi al Distretto Tecnologico per le nuove tecnologie applicate ai beni e alle attività culturali”. Intervento TE1-Invito al Centro di Eccellenza a presentare progetti per la seconda fase-Progetti RSI.

Institutional Review Board Statement

Not applicable.

Informed Consent Statement

Not applicable.

Data Availability Statement

Data are contained within the article.

Acknowledgments

We are grateful for the technical support of Giacomo Viviani and Vittorio Sciarra (INFN-LNF staff). We thank Antonella Balerna (INFN-LNF), the scientist responsible for the Project PE 0000020 CHANGES.

Conflicts of Interest

The authors declare no conflicts of interest.

References

  1. Ciofini, D.; Striova, J.; Camaiti, M.; Siano, S. Photo-oxidative kinetics of solvent and oil-based terpenoid varnishes. Polym. Degrad. Stab. 2016, 123, 47–61. [Google Scholar] [CrossRef]
  2. Mallégol, J.; Gonon, L.; Lemaire, J.; Gardette, J.L. Long-term behaviour of oil-based varnishes and paints 4. Influence of film thickness on the photooxidation. Polym. Degrad. Stab. 2001, 72, 191–197. [Google Scholar] [CrossRef]
  3. Casadio, F.; Keune, K.; Noble, P.; Van Loon, A.; Hendriks, E.; Centeno, S.A.; Osmond, G. (Eds.) Metal Soaps in Art; Springer: Berlin/Heidelberg, Germany, 2019. [Google Scholar] [CrossRef]
  4. Monico, L.; Rosi, F.; Miliani, C.; Daveri, A.; Brunetti, B.G. Non-invasive identification of metal-oxalate complexes on polychrome artwork surfaces by reflection mid-infrared spectroscopy. Spectrochim. Acta Part A Mol. Biomol. Spectrosc. 2013, 116, 270–280. [Google Scholar] [CrossRef] [PubMed]
  5. Matsuda, Y.; Ono, S.; Mizuochi, T.; Sanada, S.; Katagiri, M. Cleaning paintings using in situ monitoring with complementary imaging techniques: Three-dimensional morphological measurements and reflection FTIR spectroscopy. In Proceedings of the ICOM-CC 19th Triennial Conference, Beijing, China, 14–18 September 2020. [Google Scholar]
  6. Pereira, L.B. UV fluorescence photography of works of art: Replacing the traditional UV cut filters with interference filters. Int. J. Conserv. Sci. 2010, 1, 161–166. [Google Scholar]
  7. Aldovrandi, A.V. Caratterizzazione dei materiali pittorici nelle pitture murali mediante tecniche fotografiche. OPD Restauro 2011, 22, 55–80. [Google Scholar]
  8. Cardinali, M.; De Ruggieri, M.B.; Falcucci, C. Diagnostica Artistica: Tracce Materiali per la Storia Dell’arte e per la Conservazione; Palombi: Roma, Italy, 2007; ISBN 8860600529. [Google Scholar]
  9. Pelagotti, A.; Pezzati, L.; Piva, A.; Mastio, A. Del Multispectral uv Fluorescence Analysis of Painted Surfaces. In Proceedings of the 14th European Signal Processing Conference (EUSIPCO 2006), Florence, Italy, 4–8 September 2006; p. 5. [Google Scholar]
  10. Liang, H. Advances in multispectral and hyperspectral imaging for archaeology and art conservation. Appl. Phys. A Mater. Sci. Process. 2012, 106, 309–323. [Google Scholar] [CrossRef]
  11. Thoury, M.; Elias, M.; Frigerio, J.M.; Barthou, C. Nondestructive Varnish Identification by Ultraviolet Fluorescence Spectroscopy. Appl. Spectrosc. 2007, 61, 1275–1282. [Google Scholar] [CrossRef] [PubMed]
  12. Nevin, A.; Echard, J.P.; Thoury, M.; Comelli, D.; Valentini, G.; Cubeddu, R. Excitation emission and time-resolved fluorescence spectroscopy of selected varnishes used in historical musical instruments. Talanta 2009, 80, 286–293. [Google Scholar] [CrossRef] [PubMed]
  13. Nevin, A.; Comelli, D.; Osticioli, I.; Toniolo, L.; Valentini, G.; Cubeddu, R. Assessment of the ageing of triterpenoid paint varnishes using fluorescence, Raman and FTIR spectroscopy. Anal. Bioanal. Chem. 2009, 395, 2139–2149. [Google Scholar] [CrossRef]
  14. Marinelli, M.; Pasqualucci, A.; Romani, M.; Verona-Rinati, G. Time resolved laser induced fluorescence for characterization of binders in contemporary artworks. J. Cult. Herit. 2017, 23, 98–105. [Google Scholar] [CrossRef]
  15. Pronti, L.; Romani, M.; Verona-Rinati, G.; Tarquini, O.; Colao, F.; Colapietro, M.; Pifferi, A.; Cestelli-Guidi, M.; Marinelli, M. Post-Processing of VIS, NIR, and SWIR Multispectral Images of Paintings. New Discovery on the The Drunkenness of Noah, Painted by Andrea Sacchi, Stored at Palazzo Chigi (Ariccia, Rome). Heritage 2019, 2, 2275–2286. [Google Scholar] [CrossRef]
  16. Góra, M.; Targowski, P.; Kowalczyk, A.; Marczak, J.; Rycyk, A. Fast spectral Optical Coherence Tomography for monitoring of varnish ablation process. In Lasers in the Conservation of Artworks; CRC Press: Boca Raton, FL, USA, 2008; pp. 23–27. [Google Scholar] [CrossRef]
  17. Prati, S.; Sciutto, G.; Mazzeo, R.; Torri, C.; Fabbri, D. Application of ATR-far-infrared spectroscopy to the analysis of natural resins. Anal. Bioanal. Chem. 2011, 399, 3081–3091. [Google Scholar] [CrossRef]
  18. Moretti, P.; Rosi, F.; Miliani, C.; Daugherty, M.; van den Berg, K.J.; Cartechini, L. Non-invasive reflection FT-IR spectroscopy for on-site detection of cleaning system residues on polychrome surfaces. Microchem. J. 2020, 157, 105033. [Google Scholar] [CrossRef]
  19. Cestelli Guidi, M.; Pronti, L.; Romani, M.; Piccirillo, A.; Tranquilli, G. Applications of portable infrared spectroscopy (FT-IR) for monitoring of cleaning treatments on painted surfaces. In Proceedings of the 2nd Conference DTC Lazio-Centre of Excellence (Lazio Technological District for Cultural Heritage), Rome, Italy, 4 November 2021; Camilla Arcangioli, M.S.S., Ed.; L’Erma di Bretschneider: Rome, Italy, 2022. [Google Scholar]
  20. Carretti, E.; Rosi, F.; Miliani, C.; Dei, L. Monitoring of Pictorial Surfaces by mid-FTIR Reflectance Spectroscopy: Evaluation of the Performance of Innovative Colloidal Cleaning Agents. Spectrosc. Lett. 2005, 38, 459–475. [Google Scholar] [CrossRef]
  21. Iwanicka, M.; Moretti, P.; van Oudheusden, S.; Sylwestrzak, M.; Cartechini, L.; van den Berg, K.J.; Targowski, P.; Miliani, C. Complementary use of Optical Coherence Tomography (OCT) and Reflection FTIR spectroscopy for in-situ non-invasive monitoring of varnish removal from easel paintings. Microchem. J. 2018, 138, 7–18. [Google Scholar] [CrossRef]
  22. Dal Fovo, A.; Martínez-Weinbaum, M.; Oujja, M.; Castillejo, M.; Fontana, R. Reflectance Spectroscopy as a Novel Tool for Thickness Measurements of Paint Layers. Molecules 2023, 28, 4683. [Google Scholar] [CrossRef]
  23. Rosi, F.; Miliani, C.; Braun, R.; Harig, R.; Sali, D.; Brunetti, B.G.; Sgamellotti, A. Molecular Imaging of Paintings Noninvasive Analysis of Paintings by Mid-infrared Hyperspectral Imaging. Angew. Chem. Int. Ed 2013, 52, 5258–5261. [Google Scholar] [CrossRef]
  24. Alfeld, M. MA-XRF for Historical Paintings: State of the Art and Perspective. Microsc. Microanal. 2020, 26, 72–75. [Google Scholar] [CrossRef]
  25. Gómez-Morón, M.A.; Ortiz, R.; Colao, F.; Fantoni, R.; Gómez-Villa, J.L.; Becerra, J.; Ortiz, P. Monitoring the Restoration of a Seventeenth-Century Wooden Artwork Using Laser-Induced Fluorescence and Digital Image Analysis. Appl. Spectrosc. 2021, 75, 70–80. [Google Scholar] [CrossRef]
  26. Legrand, S.; Alfeld, M.; Vanmeert, F.; De Nolf, W.; Janssens, K. Macroscopic Fourier transform infrared scanning in reflection mode (MA-rFTIR), a new tool for chemical imaging of cultural heritage artefacts in the mid-infrared range. Analyst 2014, 139, 2489–2498. [Google Scholar] [CrossRef]
  27. Rosi, F.; Daveri, A.; Moretti, P.; Brunetti, B.G.; Miliani, C. Interpretation of mid and near-infrared reflection properties of synthetic polymer paints for the non-invasive assessment of binding media in twentieth-century pictorial artworks. Microchem. J. 2016, 124, 898–908. [Google Scholar] [CrossRef]
  28. Mobaraki, N.; Amigo, J.M. HYPER-Tools. A graphical user-friendly interface for hyperspectral image analysis. Chemom. Intell. Lab. Syst. 2018, 172, 174–187. [Google Scholar] [CrossRef]
  29. Amigo, J.M.; Babamoradi, H.; Elcoroaristizabal, S. Hyperspectral image analysis. Tutorial. Anal. Chim. Acta 2015, 896, 34–51. [Google Scholar] [CrossRef]
  30. Neto, A.M.; Victorino, A.C.; Fantoni, I.; Zampieri, D.E.; Ferreira, J.V.; Lima, D.A. Image processing using Pearson’s correlation coefficient: Applications on autonomous robotics. In Proceedings of the 2013 13th International Conference on Autonomous Robot Systems, Lisbon, Portugal, 24 April 2013. [Google Scholar] [CrossRef]
  31. Lippi, D.; Cianca, E.; Sinceri, I.; Fumelli, F.; Tranquilli, G.; Ioele, M. Studio e intervento di restauro di un raro esempio di quadro-tabernacolo composto da una Croce medievale, in Kermes, 130, 2013, 25–34. ISBN 9788832029628.
  32. Signorini, E.; Cremonesi, P. Un Approccio Alla Pulitura Dei Dipinti Mobili; Talenti, Il Prato: Prato, Italy, 2013; 256p, ISBN 10 8863361916. [Google Scholar]
  33. Cremonesi, P. L’ambiente Acquoso per la Pulitura di Opere Policrome; Talenti, Il Prato: Prato, Italy, 2011; 112p, ISBN 10 8863361193. [Google Scholar]
  34. Cremonesi, P. L’ambiente Acquoso per il Trattamento di Manufatti Artistici; Talenti, Il Prato: Prato, Italy, 2019; 128p, ISBN 10 8863364885. [Google Scholar]
  35. Cianca, E.; Sinceri, I.; Fumelli, F.; Ioele, M.; Priori, G.; Pronti, L.; Cestelli Guidi, M.; Romani, M.; Gorga, E.; Viviani, G.; et al. Applicazione laser Er:YAG e Nd:YAG per la pulitura di una croce dipinta del XIII secolo, Atti del convegno Aplar 8, Napoli 13–15 Dicembre 2023, in press.
  36. Chiara Riedo, C.; Caldera, F.; Poli, T.; Chiantore, O. Poly(vinylalcohol)-borate hydrogels with improved features for the cleaning of cultural heritage surfaces. Herit Sci. 2015, 23, 11. [Google Scholar] [CrossRef]
  37. Altobelli, A.; Cennamo, P.; Trojsi, G.; Barone Limaga, M.R.; Carpentieri, A.; Fatigati, G. Experimentation of a PVA-Borax hydrogel for the removal of Paraloid B72® from artifacts of archaeological interest from the National Archaeological Museum in Naples, Italy. Acta IMEKO 2023, 12, 3. [Google Scholar] [CrossRef]
  38. Svečnjak, L.; Baranović, G.; Vinceković, M.; Prđun, S.; Bubalo, D.; Tlak Gajger, I. An Approach for Routine Analytical Detection of Beeswax Adulteration Using FTIR-ATR Spectroscopy. J. Apic. Res. 2015, 59, 37–49. [Google Scholar] [CrossRef]
  39. Salvadori, B.; Errico, V.; Mauro, M.; Melnik, E.; Dei, L. Evaluation of Gypsum and Calcium Oxalates in Deteriorated Mural Paintings by Quantitative FTIR Spectroscopy. Spectrosc. Lett. Int. J. Rapid Commun. 2006, 36, 501–513. [Google Scholar] [CrossRef]
  40. Bishop, J.L.; Lane, M.D.; Dyar, M.D.; King, S.J.; Brown, A.J.; Swayze, G.A. Spectral properties of Ca-sulfates: Gypsum, bassanite, and anhydrite. Am. Mineral. 2014, 99, 2105–2115. [Google Scholar] [CrossRef]
  41. White, R.L. Infrared Spectroscopic Investigations of Calcium Oxalate Monohydrate (Whewellite) Dehydration/Rehydration. Minerals 2023, 13, 783. [Google Scholar] [CrossRef]
  42. Barth, A. Infrared spectroscopy of proteins. Biochim. et Biophys. Acta 2007, 1767, 1073–1101. [Google Scholar] [CrossRef]
  43. Invernizzi, C.; Rovetta, T.; Licchelli, M.; Malagodi, M. Mid and Near-Infrared Reflection Spectral Database of Natural Organic Materials in the Cultural Heritage Field. Int. J. Anal. Chem. 2018, 2018, 7823248. [Google Scholar] [CrossRef]
  44. Rosi, F.; Cartechini, L.; Monico, L.; Gabrieli, F.; Vagnini, M.; Buti, D.; Doherty, B.; Anselmi, C.; Brunetti, B.G.; Miliani, C. Tracking Metal Oxalates and Carboxylates on Painting Surfaces by Non-invasive Reflection Mid-FTIR Spectroscopy. In Metal Soaps in Art; Springer: Berlin/Heidelberg, Germany, 2019; pp. 173–193. [Google Scholar] [CrossRef]
  45. Asyana, V.; Haryanto, F.; Fitri, L.A.; Ridwan, T.; Anwary, F.; Soekersi, H. Analysis of urinary stone based on a spectrum absorption FTIR-ATR. J. Phys. Conf. Ser. 2016, 694, 012051. [Google Scholar] [CrossRef]
  46. Jones, F. Infrared investigation of barite and gypsum crystallization: Evidence for an amorphous to crystalline transition. CrystEngComm 2012, 14, 8374–8381. [Google Scholar] [CrossRef]
  47. Madejová, J.; Gates, W.P.; Petit, S. Chapter 5—IR Spectra of Clay Minerals. In Bergaya, Developments in Clay Science; Gates, W.P., Kloprogge, J.T., Madejová, J., Eds.; Elsevier: Amsterdam, The Netherlands, 2017; Volume 8, pp. 107–149. ISBN 9780081003558. [Google Scholar] [CrossRef]
  48. Bishop, J.L. Chapter 3—Remote Detection of Phyllosilicates on Mars and Implications for Climate and Habitability. In Grin, from Habitability to Life on Mars; Nathalie, A., Edmond, A.C., Eds.; Elsevier: Amsterdam, The Netherlands, 2018; pp. 37–75. ISBN 9780128099353. [Google Scholar] [CrossRef]
  49. Saikia, B.J. Spectroscopic Estimation of Geometrical Structure Elucidation in Natural SiO2 Crystal. J. Mater. Phys. Chem. 2014, 2, 28–33. [Google Scholar] [CrossRef]
  50. Chukanov, N.V. Infrared Spectra of Mineral Species; Springer: Berlin/Heidelberg, Germany, 2014; Volume 1, ISBN 978-94-007-7127-7. [Google Scholar]
  51. Volpi, F.; Vagnini, M.; Vivani, R.; Malagodi, M.; Fiocco, G. Non-invasive identification of red and yellow oxide and sulfide pigments in wall-paintings with portable ER-FTIR spectroscopy. J. Cult. Herit. 2023, 63, 158–168. [Google Scholar] [CrossRef]
  52. Miliani, C.; Rosi, F.; Daveri, A.; Brunetti, B.G. Reflection infrared spectroscopy for the non-invasive in situ study of artists’ pigments. Appl. Phys. A Mater. Sci. Process. 2012, 106, 295–307. [Google Scholar] [CrossRef]
  53. Vetter, W.; Latini, I.; Schreiner, M. Azurite in medieval illuminated manuscripts: A refection-FTIR study concerning the characterization of binding media. Herit Sci. 2019, 7, 21. [Google Scholar] [CrossRef]
  54. Otero, V.; Sanches, D.; Montagner, C.; Vilarigues, M.; Carlyle, L.; Lopes, J.A.; Melo, M.J. Characterisation of metal carboxylates by Raman and infrared spectroscopy in works of art. J. Raman Spectrosc. 2013, 45, 1197–1206. [Google Scholar] [CrossRef]
  55. Bruni, S.; Cariati, F.; Casadio, F.; Toniolo, L. Spectrochemical characterization by micro-FTIR spectroscopy of blue pigments in different polychrome works of art. Vib. Spectrosc. 1999, 20, 15–25. [Google Scholar] [CrossRef]
  56. Favaro, M.; Guastoni, A.; Marini, F.; Bianchin, S.; Gambirasi, A. Characterization of lapis lazuli and corresponding purified pigments for a provenance study of ultramarine pigments used in works of art. Anal. Bioanal. Chem. 2012, 402, 2195–2208. [Google Scholar] [CrossRef] [PubMed]
Figure 1. (a) Wooden painted cross from the 13th century, (b) Panel painting “Madonna in trono con Bambino, miracolo delle stimmate di San Francesco, Santi Antonio Abate e Bartolomeo, Crocefissione, San Cristoforo” by Arcangelo Di Cola. The areas under investigation are indicated by the highlighted yellow rectangles and they measure approximately 3 × 10 cm2.
Coatings 14 00511 g001
Figure 2. Micro-FTIR spectra of the beeswax reference (1) and of superimposed layer (2).
Coatings 14 00511 g002
Figure 3. The analyzed areas using non-invasive approaches; area (A) represents the untreated surface, area (B) signifies the region cleaned with chemical treatments, and area (C) involves the portion subjected to a combination of laser ablation and chemical cleaning. Additionally, specific points denoted as 1a, 1b, and 1c correspond to the locations of point-by-point analyses within these areas. This strategic selection of points allows for a detailed examination of the effects of different cleaning methods on the 13th-century wooden painted cross without resorting to extensive and potentially damaging sampling.
Coatings 14 00511 g003
Figure 4. rFTIR spectra of 1a, 1b, and 1c points. The spectral features assigned to azurite are labeled as “*”.
Coatings 14 00511 g004
Figure 5. Visible image (top) and correlation map of calcium oxalate (bottom). Area (A) represents the untreated surface, area (B) signifies the region cleaned with chemical treatments, and area (C) involves the portion subjected to a combination of laser ablation and chemical cleaning.
Coatings 14 00511 g005
Figure 6. (a) Visible image (top) and correlation map highlighting gypsum (bottom). (b) Visible image (top) and correlation map emphasizing azurite (bottom). Area (A) represents the untreated surface, area (B) signifies the region cleaned with chemical treatments, and area (C) involves the portion subjected to a combination of laser ablation and chemical cleaning.
Coatings 14 00511 g006
Figure 7. (a) The panel painting before the restoration. (b) The panel painting after the restoration. (c) A closer view of the analyzed area is presented before the restoration process. (d) A closer view of the analyzed area is presented after the restoration process.
Coatings 14 00511 g007
Figure 8. Micro-FTIR spectrum of the dark blue layer.
Coatings 14 00511 g008
Figure 9. r-FTIR spectrum of the dark blue layer.
Coatings 14 00511 g009
Figure 10. r-FTIR spectra of the original layer (point 2) and the dark blue layer (point 1) acquired after the cleaning processes.
Coatings 14 00511 g010
Figure 11. (a) Spectra of the repainted and original layer along with their first derivative spectra. (b) Visible image and the correlation map of the carbonyl group (ROI: 1790–1700 cm−1) before the cleaning processes. (c) Visible image and the correlation map of the carbonyl group (ROI: 1790–1700 cm−1) after the cleaning processes.
Coatings 14 00511 g011
Figure 12. (a) Visible image and the correlation map of the calcium oxalate (ROI: 1400–1200 cm1) before the cleaning processes. (b) Visible image and the correlation map of the calcium oxalate (ROI: 1400–1200 cm1) after the cleaning processes. (c) Visible image and the correlation map of lapis lazuli (ROI: 2290–2370 cm1) before the cleaning processes. (d) Visible image and the correlation map of lapis lazuli (ROI: 2290–2370 cm1) after the cleaning processes.
Coatings 14 00511 g012
Table 1. Band assessment of the superimposed layer. Derivative-like shape and inversion band are reported in this work as “+” and “*”, respectively. The presence of a band is labeled as “x”, whereas its absence is labeled as “-”.
Wavenumber
(cm−1)
1a1b1cBand Assignment
4376xxxovertone 3ν3 of CO32− (azurite) [52]
4330xxxνa + δa of the aliphatic methylene groups (lipid content) [27]
4261xxxνs + δs of the aliphatic methylene groups (lipid content) [27]
4250xxxν + δ (OH) (azurite) [52]
3440 *--xOH stretching mode (azurite) [52]
3400 +xxxO-H stretching mode (gypsum) [52]
2929 +xxxasymmetric stretching mode of CH2 (lipid content) [43]
2860 +x-xsymmetric stretching mode of CH2 (lipid content) [43]
2590--xν1 + ν3 combination band of CO32− (azurite) [52]
2555--xν1 + ν3 combination band of CO32− (azurite) [52]
2503--xν1 + ν3 combination band of CO32− (azurite) [52]
1730 +x--C=O stretching mode (lipid content) [43]
1616 *xx-C=O stretching mode (calcium oxalate) [45]
1550 +x--N-H bending and C-N stretching modes of the amide II (protein content) [43]
1466 *--xstretching mode of CO32− azurite [53]
1423 *--xstretching mode of CO32− azurite [53]
1410 *x--asymmetric stretching mode of CO32− (calcium carbonate) [52]
1375 +x--δs (CH3) (natural resins) [43]
1316 +xx-C-O stretching mode (calcium oxalate) [39]
1140 *x--asymmetric stretching ν3 of SO42−(gypsum) [46]
1120 *x--asymmetric stretching ν3 of SO42− (gypsum) [46]
1020 *xx-Si-O antisymmetric stretching modes (silicates) [46]
875 +x--ν4 in-plane bending of CO32− (calcium carbonate) [46]
780 +x--C-O bending mode (calcium oxalate) [39]
680 +x--asymmetric stretching ν4 of SO42− (gypsum) [40]
600 +x--asymmetric stretching ν4 of SO42− (gypsum) [40]
530 +x--stretching of Fe-O (iron ores) [40]
475 +x--stretching of Fe-O (iron ores) [40]
Disclaimer/Publisher’s Note: The statements, opinions and data contained in all publications are solely those of the individual author(s) and contributor(s) and not of MDPI and/or the editor(s). MDPI and/or the editor(s) disclaim responsibility for any injury to people or property resulting from any ideas, methods, instructions or products referred to in the content.

