
Design and Application of Rich Bottom Layer Mixtures


1
China Railway Investment Group Co., Ltd., Beijing 100097, China
2
School of Transportation Science and Engineering, Harbin Institute of Technology, Harbin 150090, China
3
Northwest Research Institute Co., Ltd. of C.R.E.C, Lanzhou 730030, China
4
Jilin Provincial Transportation Planning and Design Institute, Changchun 130021, China
*
Author to whom correspondence should be addressed.
Coatings 2024, 14(5), 519; https://doi.org/10.3390/coatings14050519
Submission received: 26 March 2024
/
Revised: 19 April 2024
/
Accepted: 21 April 2024
/
Published: 23 April 2024
(This article belongs to the Section Environmental Aspects in Colloid and Interface Science)
Abstract
:This study aims to summarize design indexes for rich bottom layer mixtures (RBLMs) and design asphalt mixtures with superior performance to reduce reflective cracks and fatigue cracking resulting from semi-rigid base cracking in the asphalt layer. First, this study synthesizes the research results about RBLMs and introduces the related design indexes. After that, using ABAQUS 6.13, finite element analysis was performed to analyze the change in bottom stress when the base cracked and the interlayer bond weakened. SBS-modified asphalt mixtures (SMMs) and composite-modified asphalt mixtures (CMMs) were subsequently developed as RBLMs utilizing the Marshall test method and applied on a test road. The research findings reveal that design indexes for RBLMs include a volume of air voids (VVs) within the range of 2.0%–3.0%, a maximum flexural strain exceeding 3500 με, and a dynamic stability surpassing 1000 cycles/mm. Both mixtures satisfy the design requirements, with the CMM demonstrating superior performance and offering promising application prospects. Future research endeavors will concentrate on prolonged monitoring of the test section to authenticate the effectiveness of an RBL in practical road applications.
1. Introduction
With the increase in traffic volume and loading, the cracking issue of the semi-rigid base in asphalt pavements becomes more severe. This leads to more prominent pavement reflection cracks and fatigue cracking problems, which seriously shorten the service life of the asphalt pavement [1,2]. Consequently, delaying the generation of semi-rigid base cracks and their development is critical to extending the service life of asphalt pavement and improving its durability [3].
One of the most effective methods researchers propose to reduce reflection cracks in asphalt pavements is installing a stress-absorbing layer [4,5]. This layer, typically 1.0–2.5 cm thick, is positioned between the surface and either a semi-rigid or rigid base [6]. The stress-absorbing layer comprises modified asphalt (asphalt content of about 8.0%) and aggregates with particle sizes beneath 4.75 mm, contributing to its excellent performance characteristics [7]. However, due to its low modulus of elasticity and relatively small thickness, the layer primarily serves as a functional barrier to delay the propagation of reflection cracks [8]. Still, it is prone to deformation. As a result, further innovative solutions must be explored to address fatigue cracking more comprehensively in practical applications.
Research has focused on designing a rich bottom layer (RBL) with excellent performance in durable pavement structures to solve the problems of fatigue cracking and reflection cracking in asphalt pavements [9,10]. An RBL is placed on the top of the flexible base in the United States and Canada [10]. In China, these structures are usually combined with a semi-rigid base asphalt pavement framework. An RBL is usually incorporated between the base and the surface layers to fulfill the requirements of crack resistance and the long-term durability of the overall pavement structure [11]. An RBL is a structural layer with multiple functions, such as waterproofing, fatigue resistance, and reflection cracking resistance. It is typically designed for thicknesses between 4 and 8 cm. It is essential to note that the RBL mixture’s maximum engineering grain size falls within the 9.5–13.2 mm range, and the binding material utilized is styrene–butadiene–styrene (SBS)-modified asphalt [11,12].
More comprehensive research is needed on the mixtures’ design indexes and conventional properties of RBL materials, despite existing studies primarily focusing on RBL’s mechanical response and rich bottom layer mixtures’ (RBLMs) fatigue properties. Similarly, it is notable that SBS-modified asphalt is the predominant choice for RBLM applications, whereas alternative mixture types are less commonly utilized. In this study, we synthesize the research findings on RBLMs and introduce the relevant design indexes. We have also designed two types of mixtures, SBS-modified asphalt mixture (SMM) and composite-modified asphalt mixture (CMM), as RBLMs and implemented them on a test pavement. This paper also describes the preparation process for composite-modified asphalt mixture and construction precautions in the field. These results serve as a crucial reference for advancing the research and practical application of an RBL in pavement engineering.
2. Requirements and Applications of RBLMs
2.1. Requirements
Temperature changes and drying and shrinking mainly cause cracks in the semi-rigid subbase. This phenomenon is more pronounced in northern regions. When cracks exist in the subbase, the cracks lead to a concentration of stress at the bottom of the surface, generating tensile stresses. In addition, these cracks reduce interlayer bonding, further increasing the value of tensile stress. As a result, when subjected to vehicular traffic loads, the pavement surface is prone to fatigue cracking and reflection cracks. The service life of the road pavement will be reduced [13].
To enhance the resistance of the pavement to cracking, reducing the tensile strain generated by the surface is essential. One practical approach towards achieving this is by increasing the thickness of the structural layer, as it helps decrease the tensile strain [14]. Furthermore, opting for mixtures with a higher asphalt content for the surface material has been recognized as another successful strategy in crack prevention [15]. Thus, incorporating a rich bottom structural layer stands out as a pragmatic method to enhance cracking resistance and prolong the longevity of pavements.
In this study, the proposed pavement structure primarily includes an additional RBL between the base and the asphalt layer, as illustrated in Figure 1. This design is specifically intended to mitigate the surface cracking resulting from the semi-rigid base’s cracking, enhance the mechanical behavior of the pavement structure, and ultimately prolong the pavement’s service life [16,17].
The RBLM is designed with a higher asphalt content to provide flexibility and effectively disperse stress concentrations. This mixture also possesses some load-bearing capacity to prevent excessive plastic deformation. The low VVs contribute to pavement compactness, effectively deterring water intrusion into the base layers. This composition offers excellent crack resistance and resistance to tensile strains, resulting in an extended fatigue life cycle. Moreover, it demonstrates comparable water stability to surface mixtures, ensuring robust resistance against water-induced damage. In addition, the construction process of RBLMs is deliberately streamlined and straightforward to facilitate construction and widespread implementation.
2.2. Applications
In Canada, rich bottom layer mixtures (RBLMs) are characterized by a volume of air voids (VVs) of 4.0%, along with an extra 0.5%–1.0% asphalt content compared to conventional mixtures [9]. Similarly, in the United States, the VVs of RBLMs typically fall below 3.0%, while their asphalt content surpasses that of conventional mixtures. In the Czech Republic, the Technical Universities of Prague and Brno, Eurovia, and other road companies used RBLMs with a binder content of 0.5% higher than standard AC [12].
In China, an RBL was first applied in Beijing, Shandong, for durable asphalt pavement structures and the Shenshan highway reconstruction and expansion project. It is advised to use RBLMs with SBS-modified asphalt, with the technical parameters of the mixture being detailed in Table 1. It was also determined that the VVs value of the RBLM was lower than 3.0%, and the asphalt content was increased by 0.5% at the optimal asphalt dosage [11]. Furthermore, RBLM applications expand beyond highways to encompass railroads, aiming to mitigate fatigue cracking and expansion at nodes and prevent top-down reflection cracks [18]. The railroad mixtures are carefully managed within a VV range of 1.0%–3.0% while featuring an asphalt content approximately 0.5% higher than highway asphalt mixtures [19].
In this study, the existing indicators of RBLMs were summarized and analyzed, leading to the optimization and proposal of technical indexes for the mixture based on engineering application conditions. The design indexes and performance indicators are detailed in Table 1. Utilizing a finer mineral gradation, such as AC-10, is suggested for better low-temperature cracking resistance. Moreover, dynamic stability has been recommended to assess the mixture’s high-temperature performance and ensure good deformation resistance.
3. Materials and Methods
3.1. Materials
3.1.1. Asphalt
The asphalt binder includes SBS-modified asphalt and composite-modified asphalt, containing crumb rubber, SBS, and polyurethane prepolymer. The technical indexes of the two types of asphalt were tested using the test method specified in the JTG E20-2011 standard [20]. The results are presented in Table 2.
3.1.2. Aggregate
3.1.3. Mineral Powder
For the filler material, limestone mineral powder was chosen. The technical indexes of the filler were tested according to the JTG E42-2005 standard method. The results in Table 4 follow the technical requirements.
3.2. Finite Element Modeling Methods
3.2.1. Road Pavement Structure
3.2.2. Load Simplification
Triangular load distribution is utilized to simulate the impulses generated by a vehicle during travel. The traveling load action time is directly linked to the vehicle speed V and the length of the tire contact surface radius r. A load does not affect a point when its distance from that point is ≥6r. So, a single loading time can be expressed as follows in Equation (1). In the finite element simulation, the double-circle load is transposed into a rectangular load with a length of 19.2 cm, a width of 18.4 cm, and a spacing of 13.5 cm.
In the formulas, V is the vehicle travel speed (m/s), r is the tire contact surface length (m), and t is the loading time (s).
3.2.3. Contact between Layers
In this study, the contact between the structural layers of the pavement was simulated using penalty functions in ABAQUS 6.13. The coulomb friction model was implemented to characterize the frictional behavior of the contact surfaces, and the coefficient of friction f was used to model the interaction between these surfaces. The investigation encompassed the contact process between the surface and the base, spanning from complete continuity to complete sliding. Moreover, the contacts between the surfaces and between the bases were explicitly defined as continuously connected throughout the analysis.
3.2.4. Model Size and Cell Segmentation
The finite element model of the pavement structure, with dimensions of 5.0 m in length and width and 3.0 m in thickness, is illustrated in Figure 2. The model is subject to constraints at the bottom and sides with the boundary conditions set as U1 = U2 = UR3 = 0. A meshing approach utilizing plane-strain 4-node reduced integration cells enhances computational efficiency without compromising accuracy. A denser meshing scheme is implemented at the points of the applied loads, while a sparse meshing strategy is adopted at the model’s edges. This methodology strikes a balance between computational accuracy and efficiency [23].
3.3. Experimental Methods
3.3.1. Mixture Design
The Marshall test was utilized to develop the RBLM with an AC-10 design grading according to the JTG F40–2004 standard [24]. The RBLM had a 2.0%–3.0% VV, and the void filled with asphalt (VFA) was within 75%–90%. Four Marshall samples with a height of 63.5 ± 1.3 mm were prepared for each group for testing. The optimum asphalt content was determined and verified based on the volumetric indexes and Marshall stability.
3.3.2. Performance Validation
- (1)
- Immersing Marshall test and freeze–thaw split test
The water stability of the asphalt mixtures was evaluated using the immersion Marshall test (T 0709-2011) and freeze–thaw split test (T 0729-2000), with residual stability and the tensile strength ratio as evaluation indexes. Marshall samples with a height of 63.5 ± 1.3 mm were prepared for testing.
The residual stability of the mixture is calculated using the following formula:
In the formulas, MS0 is the residual stability (%). MS and MS1 are the Marshall stabilities of the samples before and after water immersion (kN).
The tensile strength ratio of the mixture is calculated using the following formula:
In the formulas, RT is the indirect tensile strength (MPa). PT is the test load value of the samples (N). h is the height of the samples (mm). TSR is the freeze–thaw split test tensile strength ratio (%). RT1 and RT2 are the indirect tensile strengths before and after the freeze–thaw cycles (MPa).
- (2)
- Freeze–thaw splitting test
The low-temperature fracture resistance of the asphalt mixtures was evaluated using the three-point bending test (T 0715-2011, test temperature −10 °C). The flexural-tensile strength and maximum flexural strain were used as the evaluation indexes. A sample with a size of 250 × 35 × 30 mm was prepared for testing.
The flexural-tensile strength and maximum flexural strain of the mixture is calculated using the following formula:
In the formulas, RB and εB are the mixture’s flexural-tensile strength (MPa) and maximum flexural strain (με) at breakage. b and h are the width and height of the section (mm). L is the span (mm), taken as 200. PB is the peak load (N). d is the middle span deflection (mm).
- (3)
- Wheel-tracking test
The wheel-tracking test (T 0719-2011) evaluates the high-temperature stability of the mixtures. Dynamic stability was chosen as the evaluation index. A beam sample with a size of 300 × 300 × 50 mm was prepared for testing. The number of samples in the individual tests is shown in Table 6. The test flow is shown in Figure 3.
The dynamic stability of the mixture is calculated using the following formula:
In the formulas, DS represents the dynamic stability of the asphalt mixture (cycles/mm). d1 is the deformation corresponding to time t1 (mm). d2 is the deformation corresponding to time t2 (mm). N is the milling rate (cycles/min), taken as 42. C1 is the machine-type coefficient, taken as 1. C2 is the specimen coefficient, taken as 1.
4. Results
4.1. Finite Element Modeling
The stress response of the bottom of the surface and the bottom of the base is calculated for different friction coefficients between the surface and the base: f = ∞, f = 1, f = 0.5, and f = 0. Among these scenarios, f = ∞ simulates the interlayer bonding state when completely continuous. And f = 1 simulates the interlayer bonding state when the actual pavement is undamaged. f = 0.5 and f = 0 simulate the interlayer bond state when the interlayer bond deteriorates and slides completely. The results of these calculations are illustrated in Figure 4.
As f approaches infinity, compressive stress is experienced at the bottom of the surface, while tensile stress occurs at the bottom of the base. When f is 1, the compressive stress at the bottom of the surface decreases, and the tensile stress at the bottom of the base increases. When f is 0.5, both the bottom of the surface and the bottom of the base are subjected to tensile stress. With the inter-layer contact state weakening, the tensile stress at the bottom of each layer gradually increases. It is important to note that the compressive stress at the bottom of the surface evolves into tensile stress as the value of stress gradually rises. This phenomenon elucidates the development of cracks on the pavement, even though, theoretically, no tensile stresses are generated in the laminated elastic system.
Additionally, when the base cracks, the bottom stresses are significantly higher than when the base is intact. Specifically, the bottom tensile stress of the surface is more significant. This is due to the cracks in the base leading to uncoordinated deformation between layers, thereby altering the stress state of the surface bottom. Furthermore, when the base cracks, the critical point of the bottom stress of the surface from compressive to tensile is advanced with the change in the interlayer contact, and tensile stresses also appear at f = 1.
4.2. Mixture Design
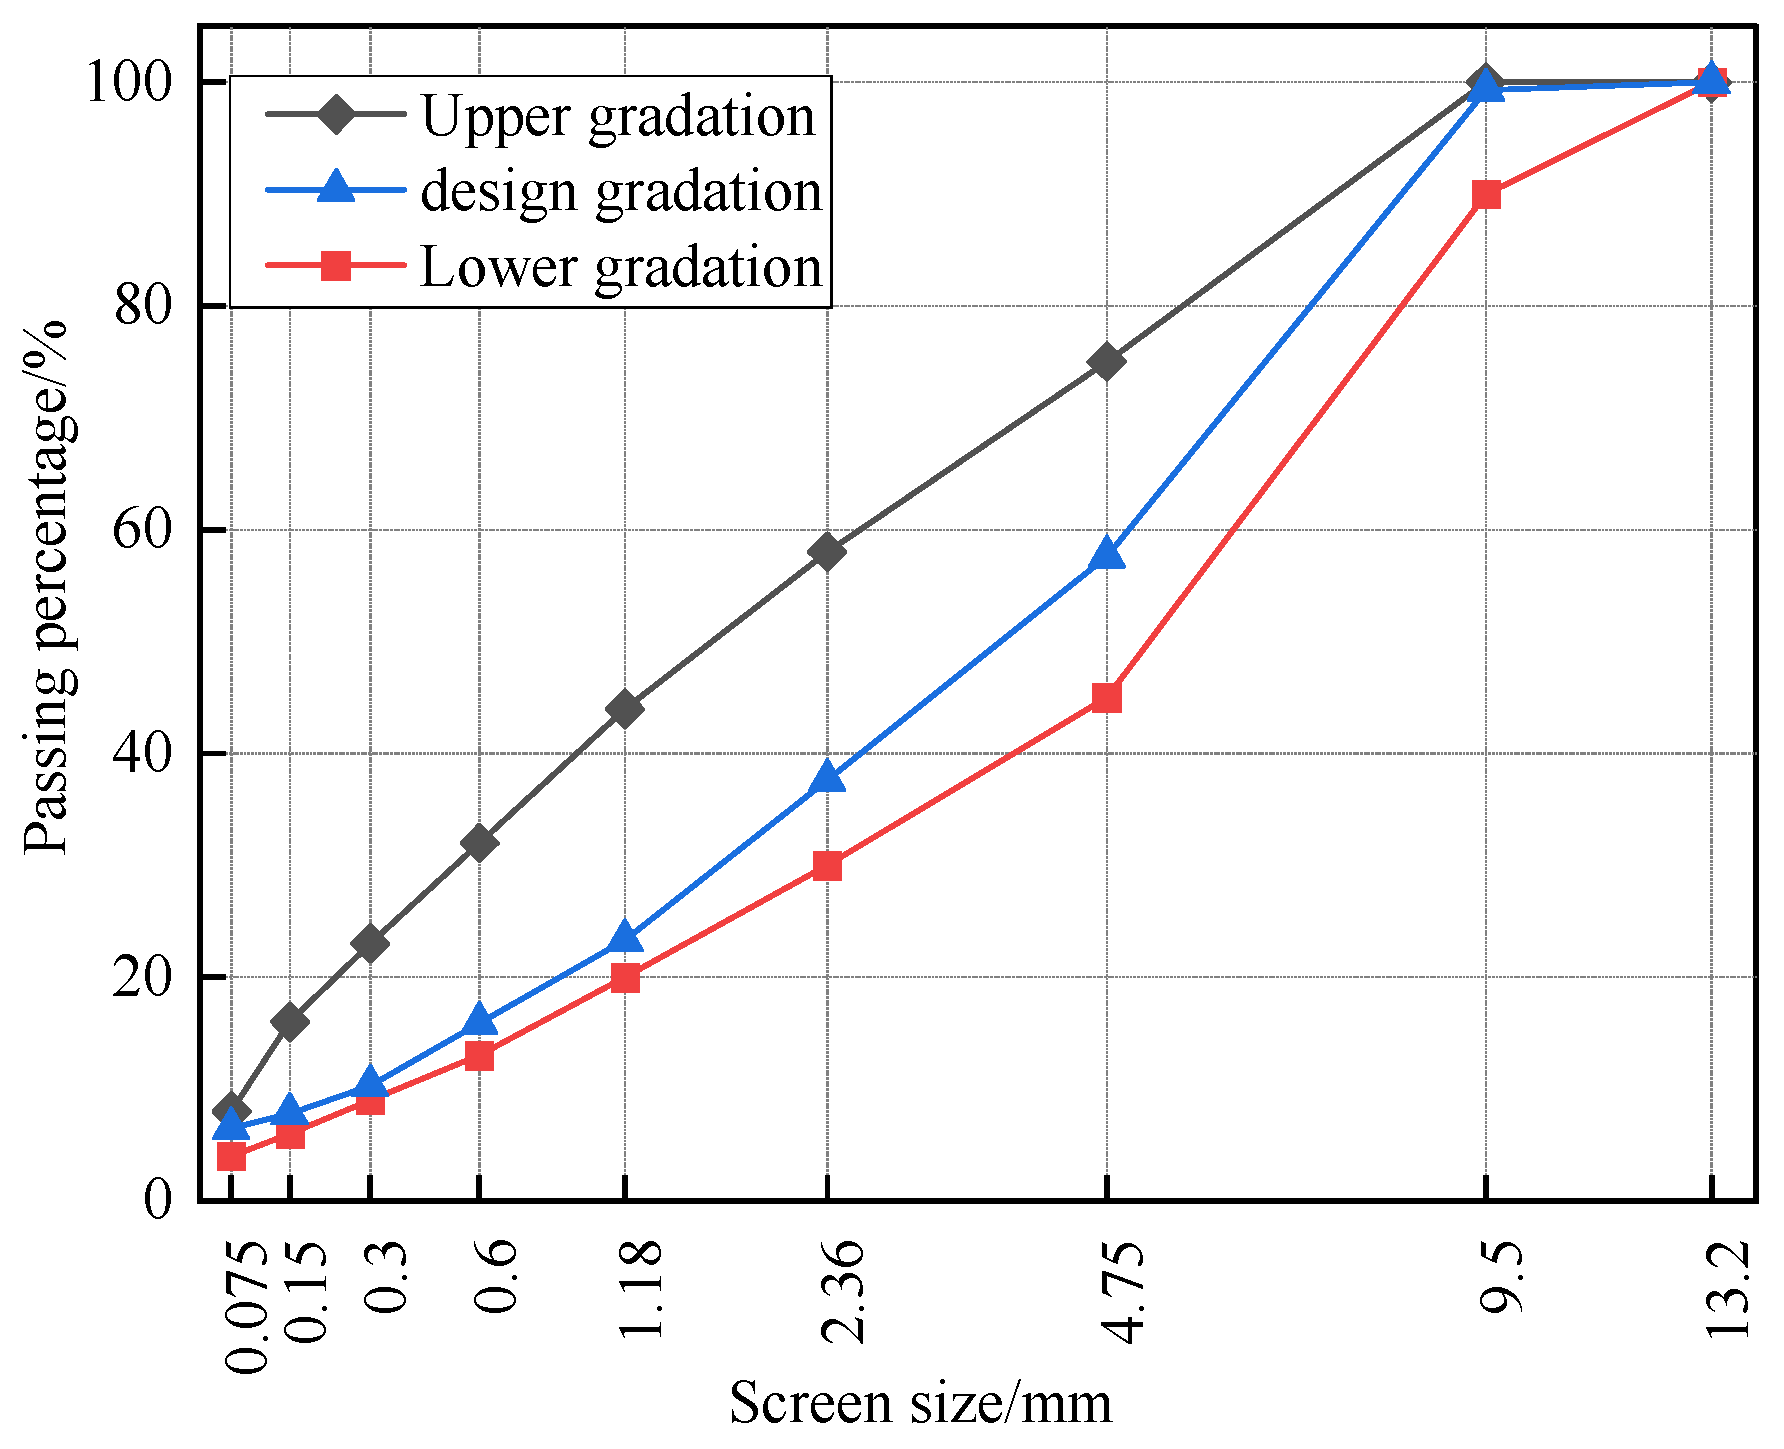
Figure 5 shows the AC-10 gradation curves. According to the Marshall test method in the JTG F40-2004 standard, the oil/stone ratios of the SMM and CMM were determined to be 6.30% and 7.50%, respectively. The volume index test results in Table 7, Table 8 and Table 9 meet the design requirements.
The substantial disparity in the viscosity of the binder contributes significantly to the difference in the oil/stone ratio between the two mixtures [25,26]. SBS-modified asphalt exhibits a viscosity of approximately 300 mPa·s at 180 °C, functioning as a lubricant that enhances the interaction between the aggregates. In contrast, the composite-modified asphalt demonstrates a viscosity of about 2200 mPa·s, impeding the mixture from achieving the desired compaction level under the same compaction effort. Consequently, the CMM necessitates an increase in the asphalt content to decrease the VVs, thereby optimizing the compaction density of the mixture [27].
The Marshall stability of the CMM with a much higher oil/stone ratio is still more significant than that of the SMM due to the difference in the binder. As shown in Table 2, the penetration of composite-modified asphalt is lower than that of SBS-modified asphalt. This shows that the hardness of composite-modified asphalt is higher, which is reflected in the mixture level as high Marshall stability. In addition, due to the high viscosity of the composite-modified asphalt, the bond to the aggregate is strong. Therefore, the aggregates are challenging to move relative to each other under the action of the load, which can carry a more significant load.
4.3. Performance Validation
4.3.1. Immersing Marshall Test
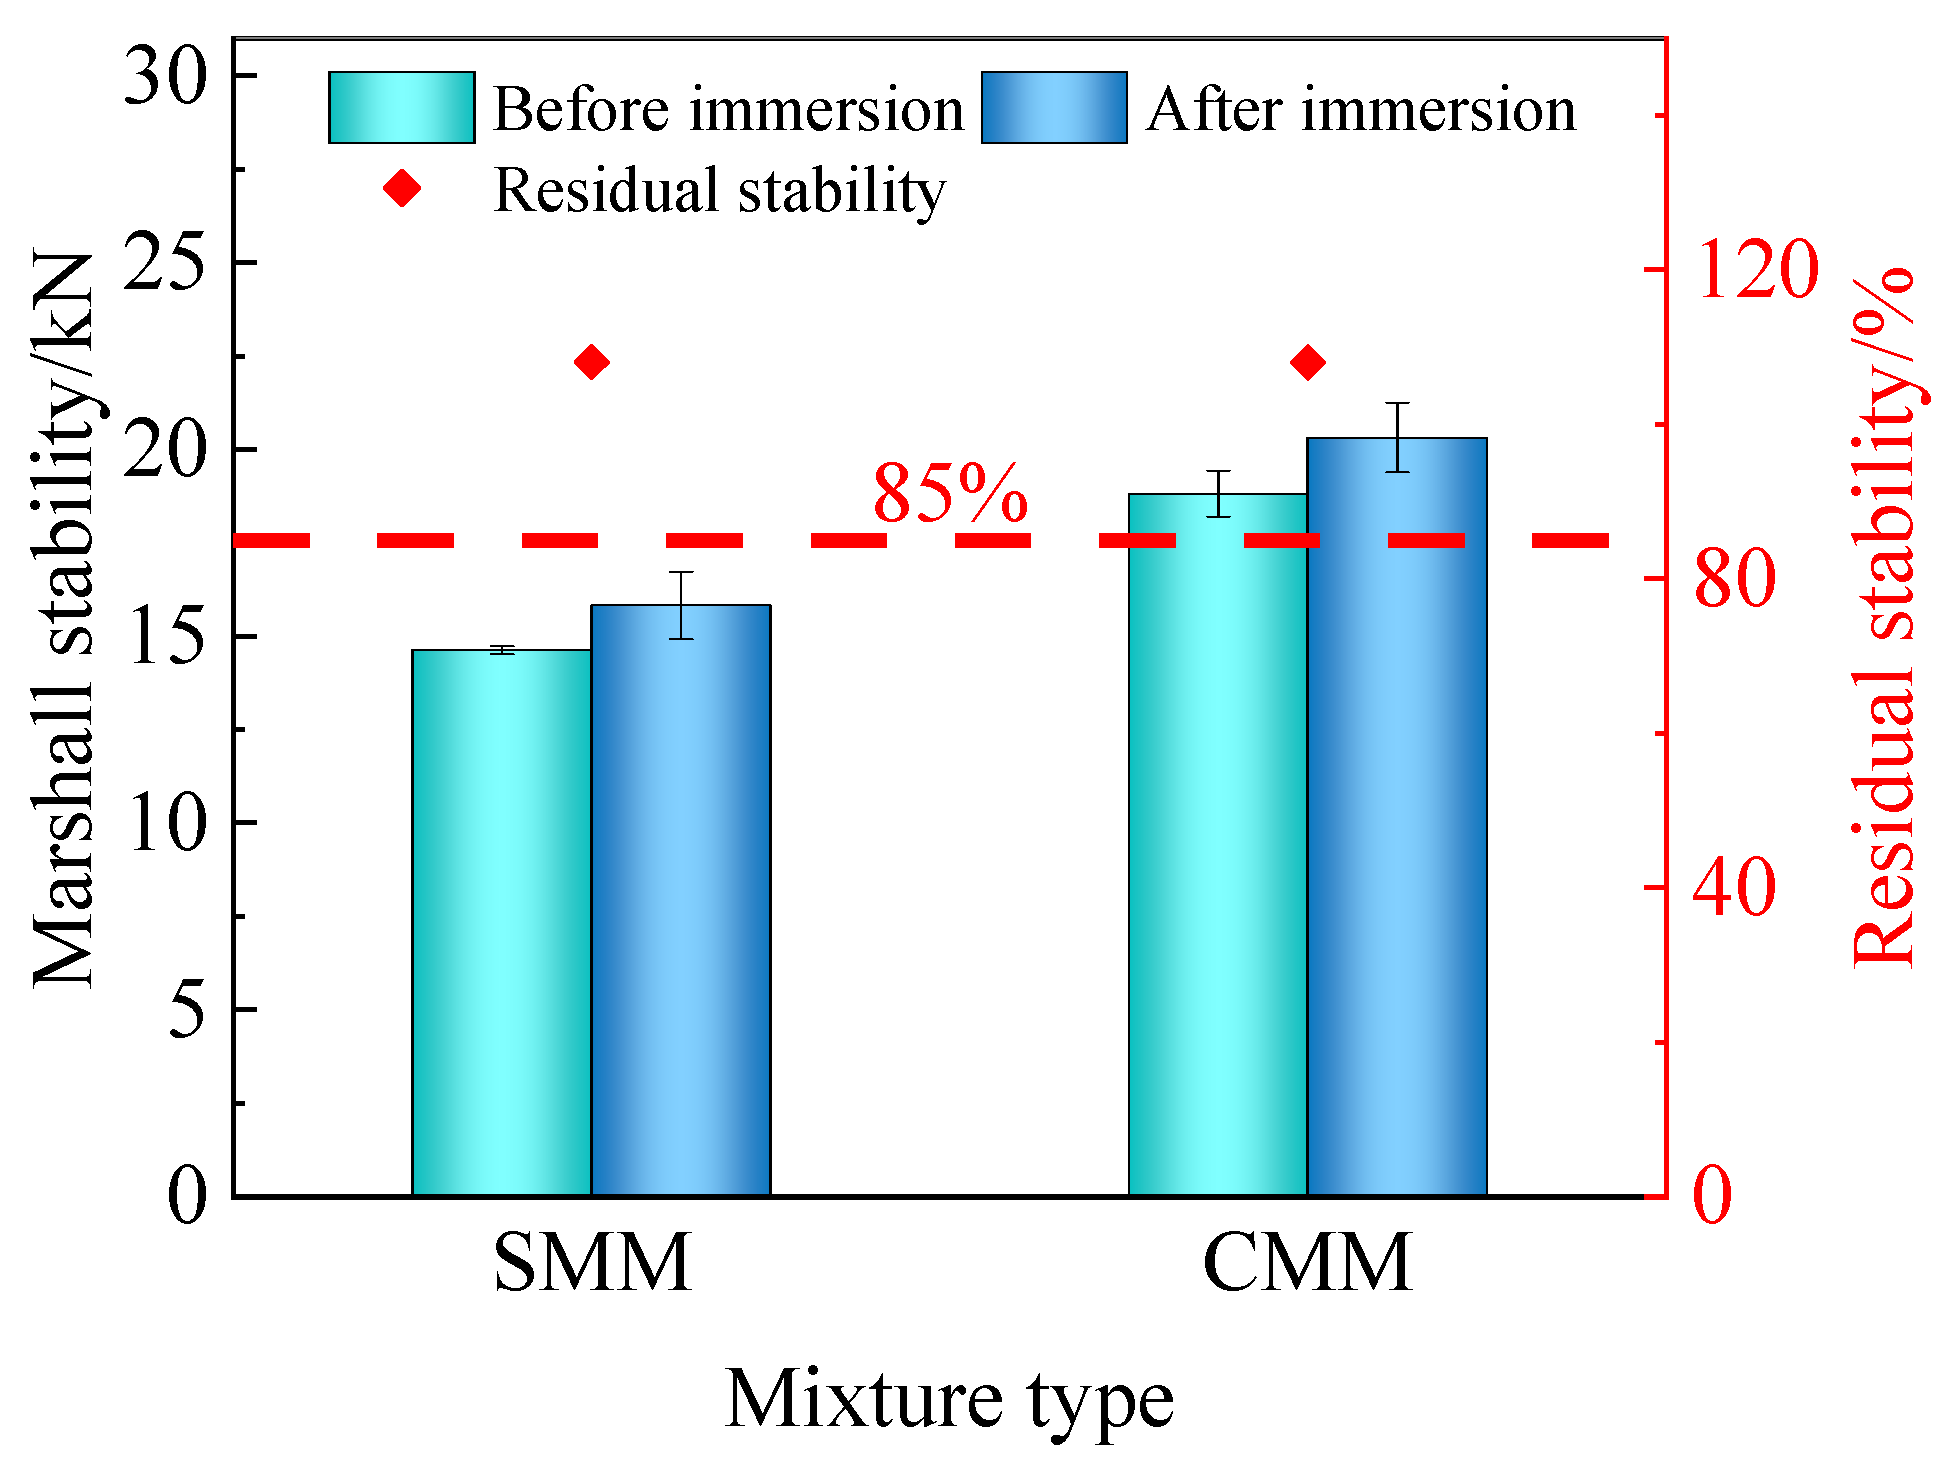
The residual stability of the RBLM, as illustrated in Figure 6, remains consistently above 100%. An interesting observation is noted in this trend: the stability after immersion exceeds that observed before immersion. The increase in stability after immersion is mainly attributed to several important factors. Primarily, the delicate gradation of the RBLM and the higher asphalt content play a crucial role. The abundance of asphalt present enables complete aggregate coverage, thereby enhancing overall stability. Additionally, the smaller VV inherent in the mixture limits the capacity for water infiltration into the asphalt aggregate bonding surface, acting as a protective barrier that effectively mitigates the risks associated with water-induced damage.
4.3.2. Freeze–Thaw Splitting Test
The chosen methodology for evaluating the water stability of the RBLM for comparative performance analysis in this study was a freeze–thaw split test with more rigorous conditions. The results of this test, as illustrated in Figure 7, highlight that the tensile strength ratio value of the CMM notably surpasses that of the SMM, with values of 103.7% and 88.8%, respectively. This significant difference indicates the superior water stability of the CMM compared to the SMM counterpart. The CMM’s tensile strength ratio of over 100% was attributed to polyurethane prepolymers. The polyurethane prepolymer’s continued reaction in the composite-modified asphalt during the freeze–thaw process increases mixture strength.
4.3.3. Three-Point Bending Test
Figure 8 displays the results of the three-point bending test. The flexural-tensile strength and maximum bending strain of the CMM are superior to those of the SMM. This improvement can be attributed to adding rubber powder in the composite-modified asphalt, which helps reduce the material’s temperature sensitivity [28]. The crumb rubber enables the CMM to have good low-temperature performance and high-temperature stability. Furthermore, including polyurethane prepolymer enhances the toughness of the CMM, leading to an increased deformation capacity.
4.3.4. Wheel-Tracking Test
The high asphalt content in the RBLM renders it more prone to deformation and rutting disease than conventional asphalt mixtures. Therefore, assessing high-temperature stability is crucial in evaluating the RBLM’s performance. The wheel-tracking test results shown in Figure 9 reveal that the dynamic stability of the CMM exceeds that of the SMM by approximately three times. Consequently, the CMM exhibits superior high-temperature stability. This result is similar to Table 1. The softening point of composite-modified asphalt is much larger than that of SBS-modified asphalt, making it less prone to deformation at high temperatures.
In conclusion, both RBLMs meet the design indexes, with CMM’s performance outperforming the SMM. This demonstrates the effectiveness of composite-modified asphalt in enhancing performance characteristics.
5. Test Road
5.1. Overview
A test road with an RBL was constructed as part of the pavement project on the Yanchang Expressway Yantongshan to Changchun Section. The test road spans from K414 + 125 to K414 + 800 on the right side, covering 675 m. This road has two main sections: a 300 m long SMM section and a 375 m long CMM section, while the left side is the control road. The specific pavement structure of the test road is outlined in Table 10.
5.2. Construction Process
To improve the pavement construction quality, both asphalt and aggregate heating temperatures need to meet the specified requirements. The mixtures are strictly monitored before leaving the factory. The temperatures at each stage should follow the provisions in Table 11.
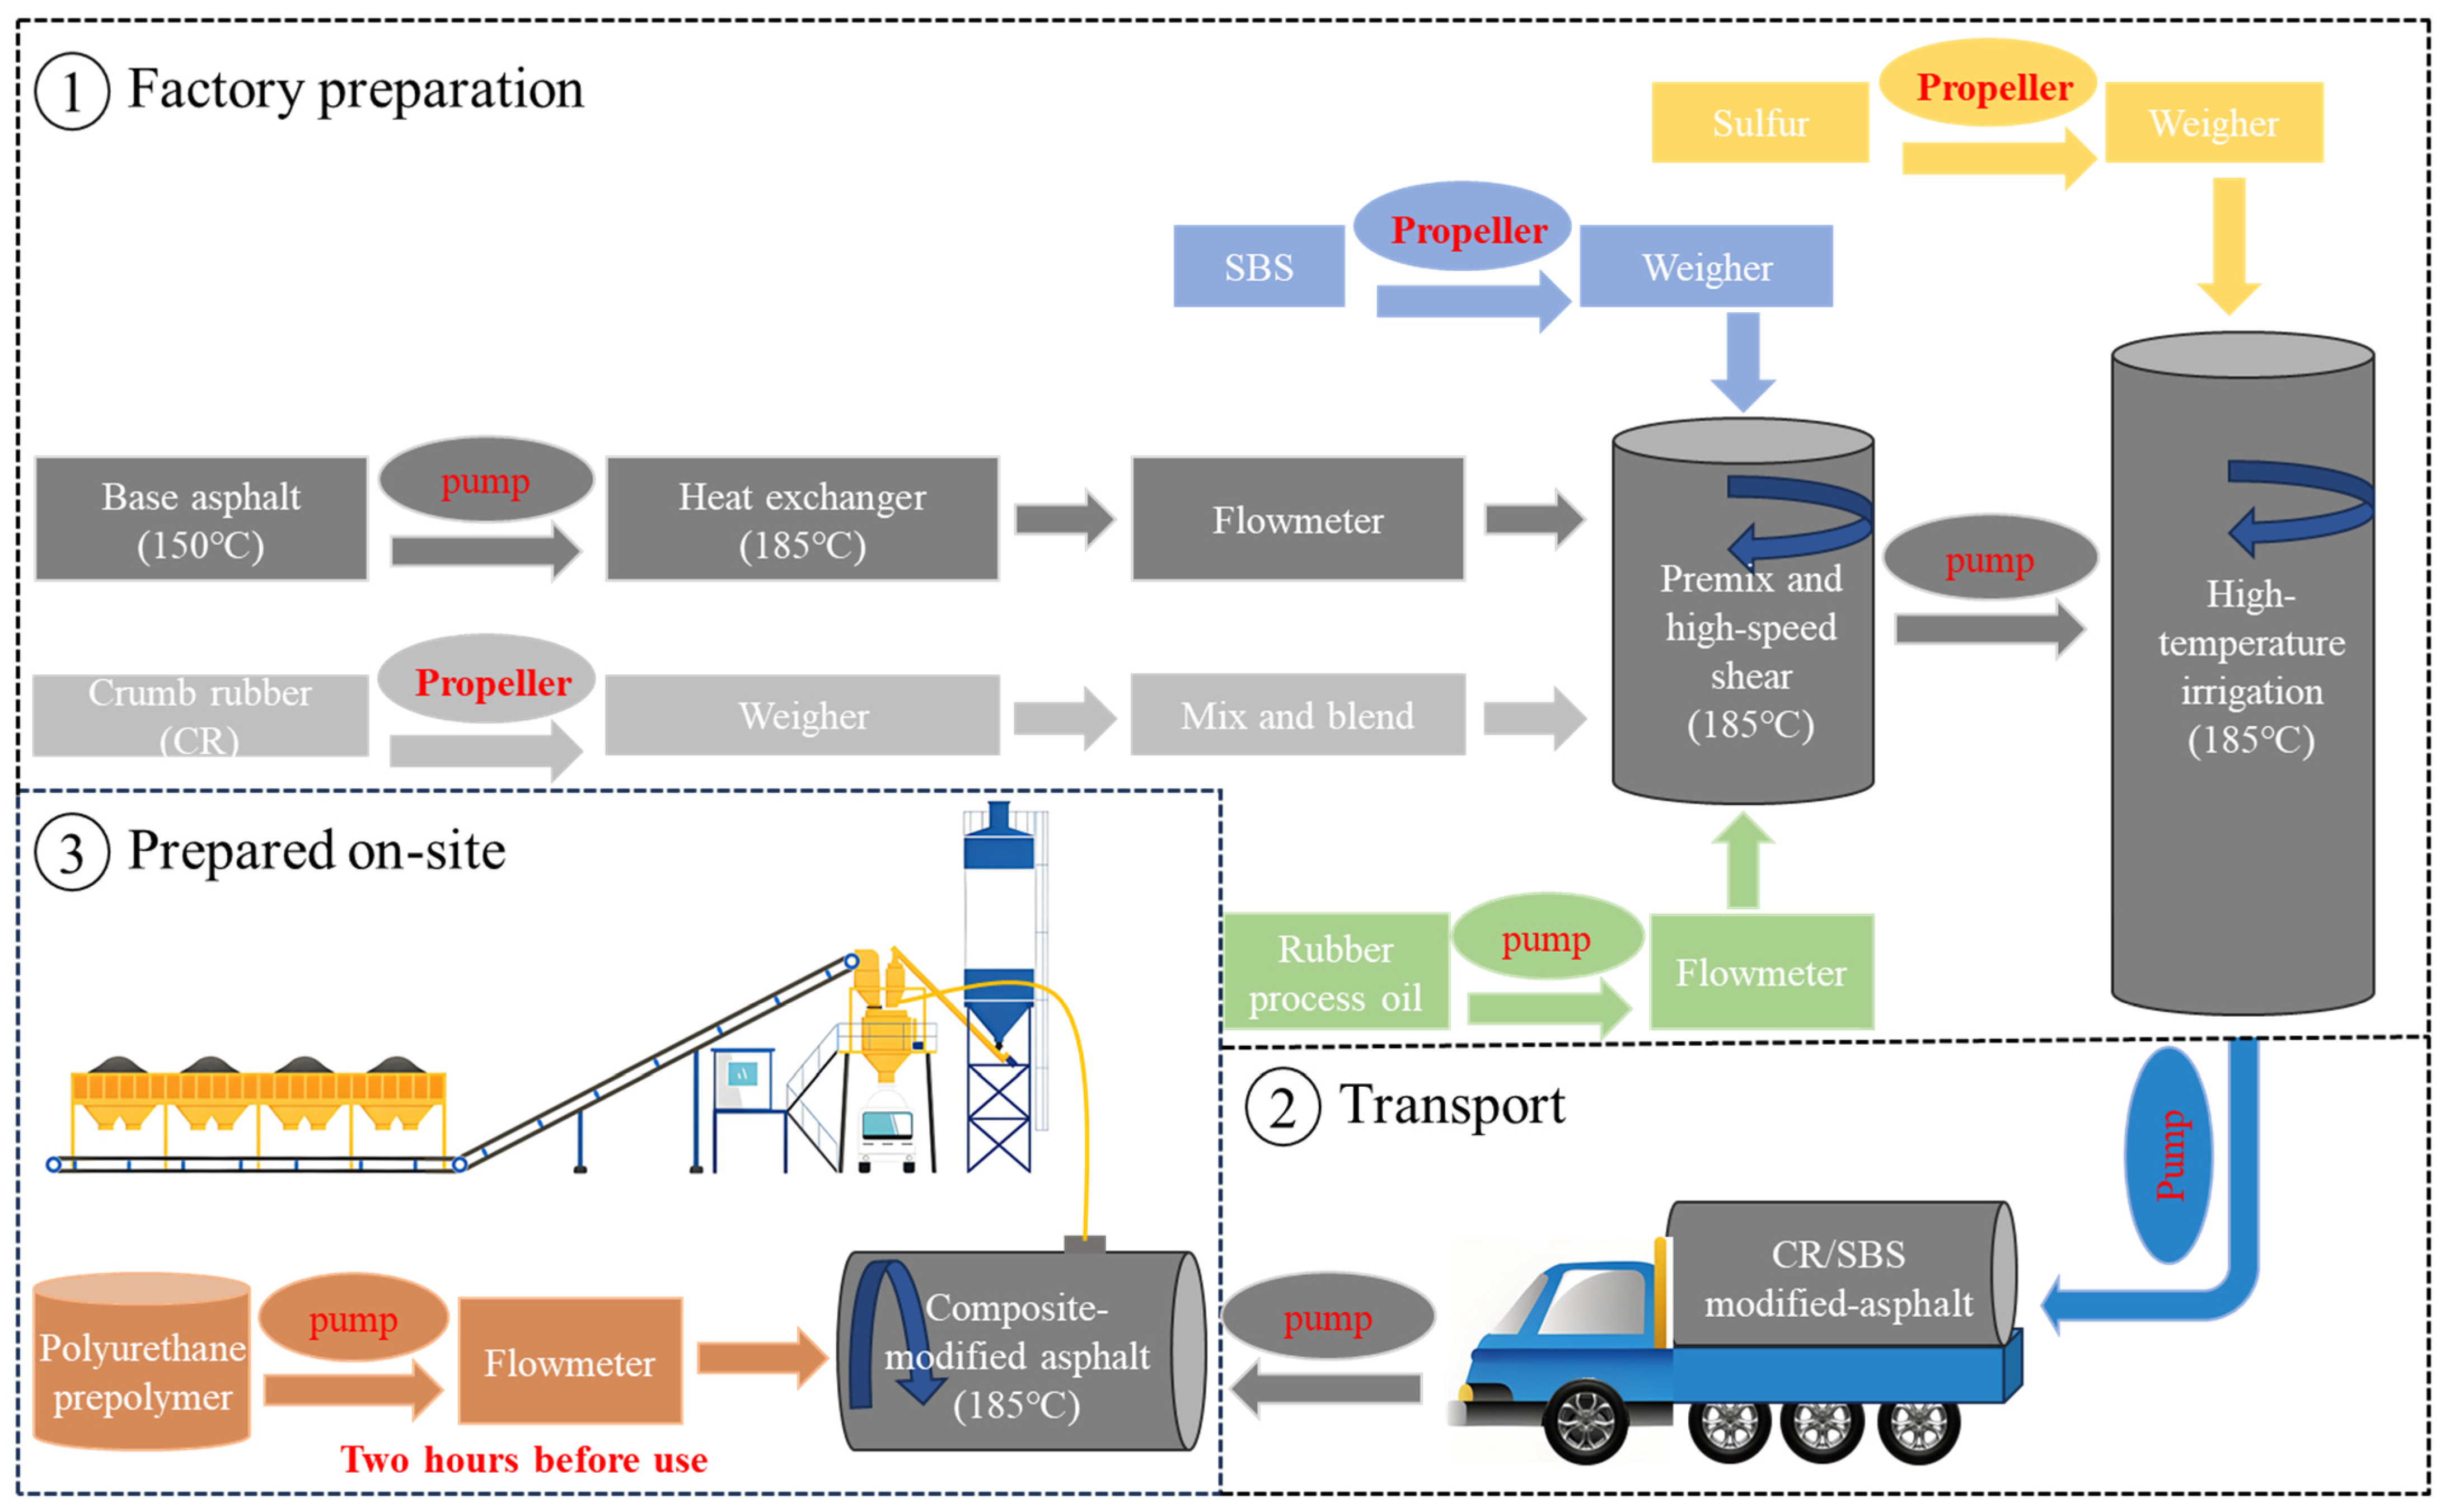
The RBLM’s total mixing time is about 50 s to achieve optimal mixing results. The dry mixing time is approximately 5–10 s, and the wet mixing time is approximately 40–45 s. In contrast to SBS-modified asphalt, composite-modified asphalt must be prepared on-site. It necessitates pouring the polyurethane prepolymer into the CR/SBS-modified asphalt storage tube at least 2 h before mixing to ensure adequate blending. This staged approach is crucial for promoting the homogeneous dispersion of the components, thereby enhancing the overall properties of the asphalt. The detailed process of the CMM is depicted in Figure 10. Understanding and following the CMM production steps can ensure and improve the quality of asphalt pavement construction.
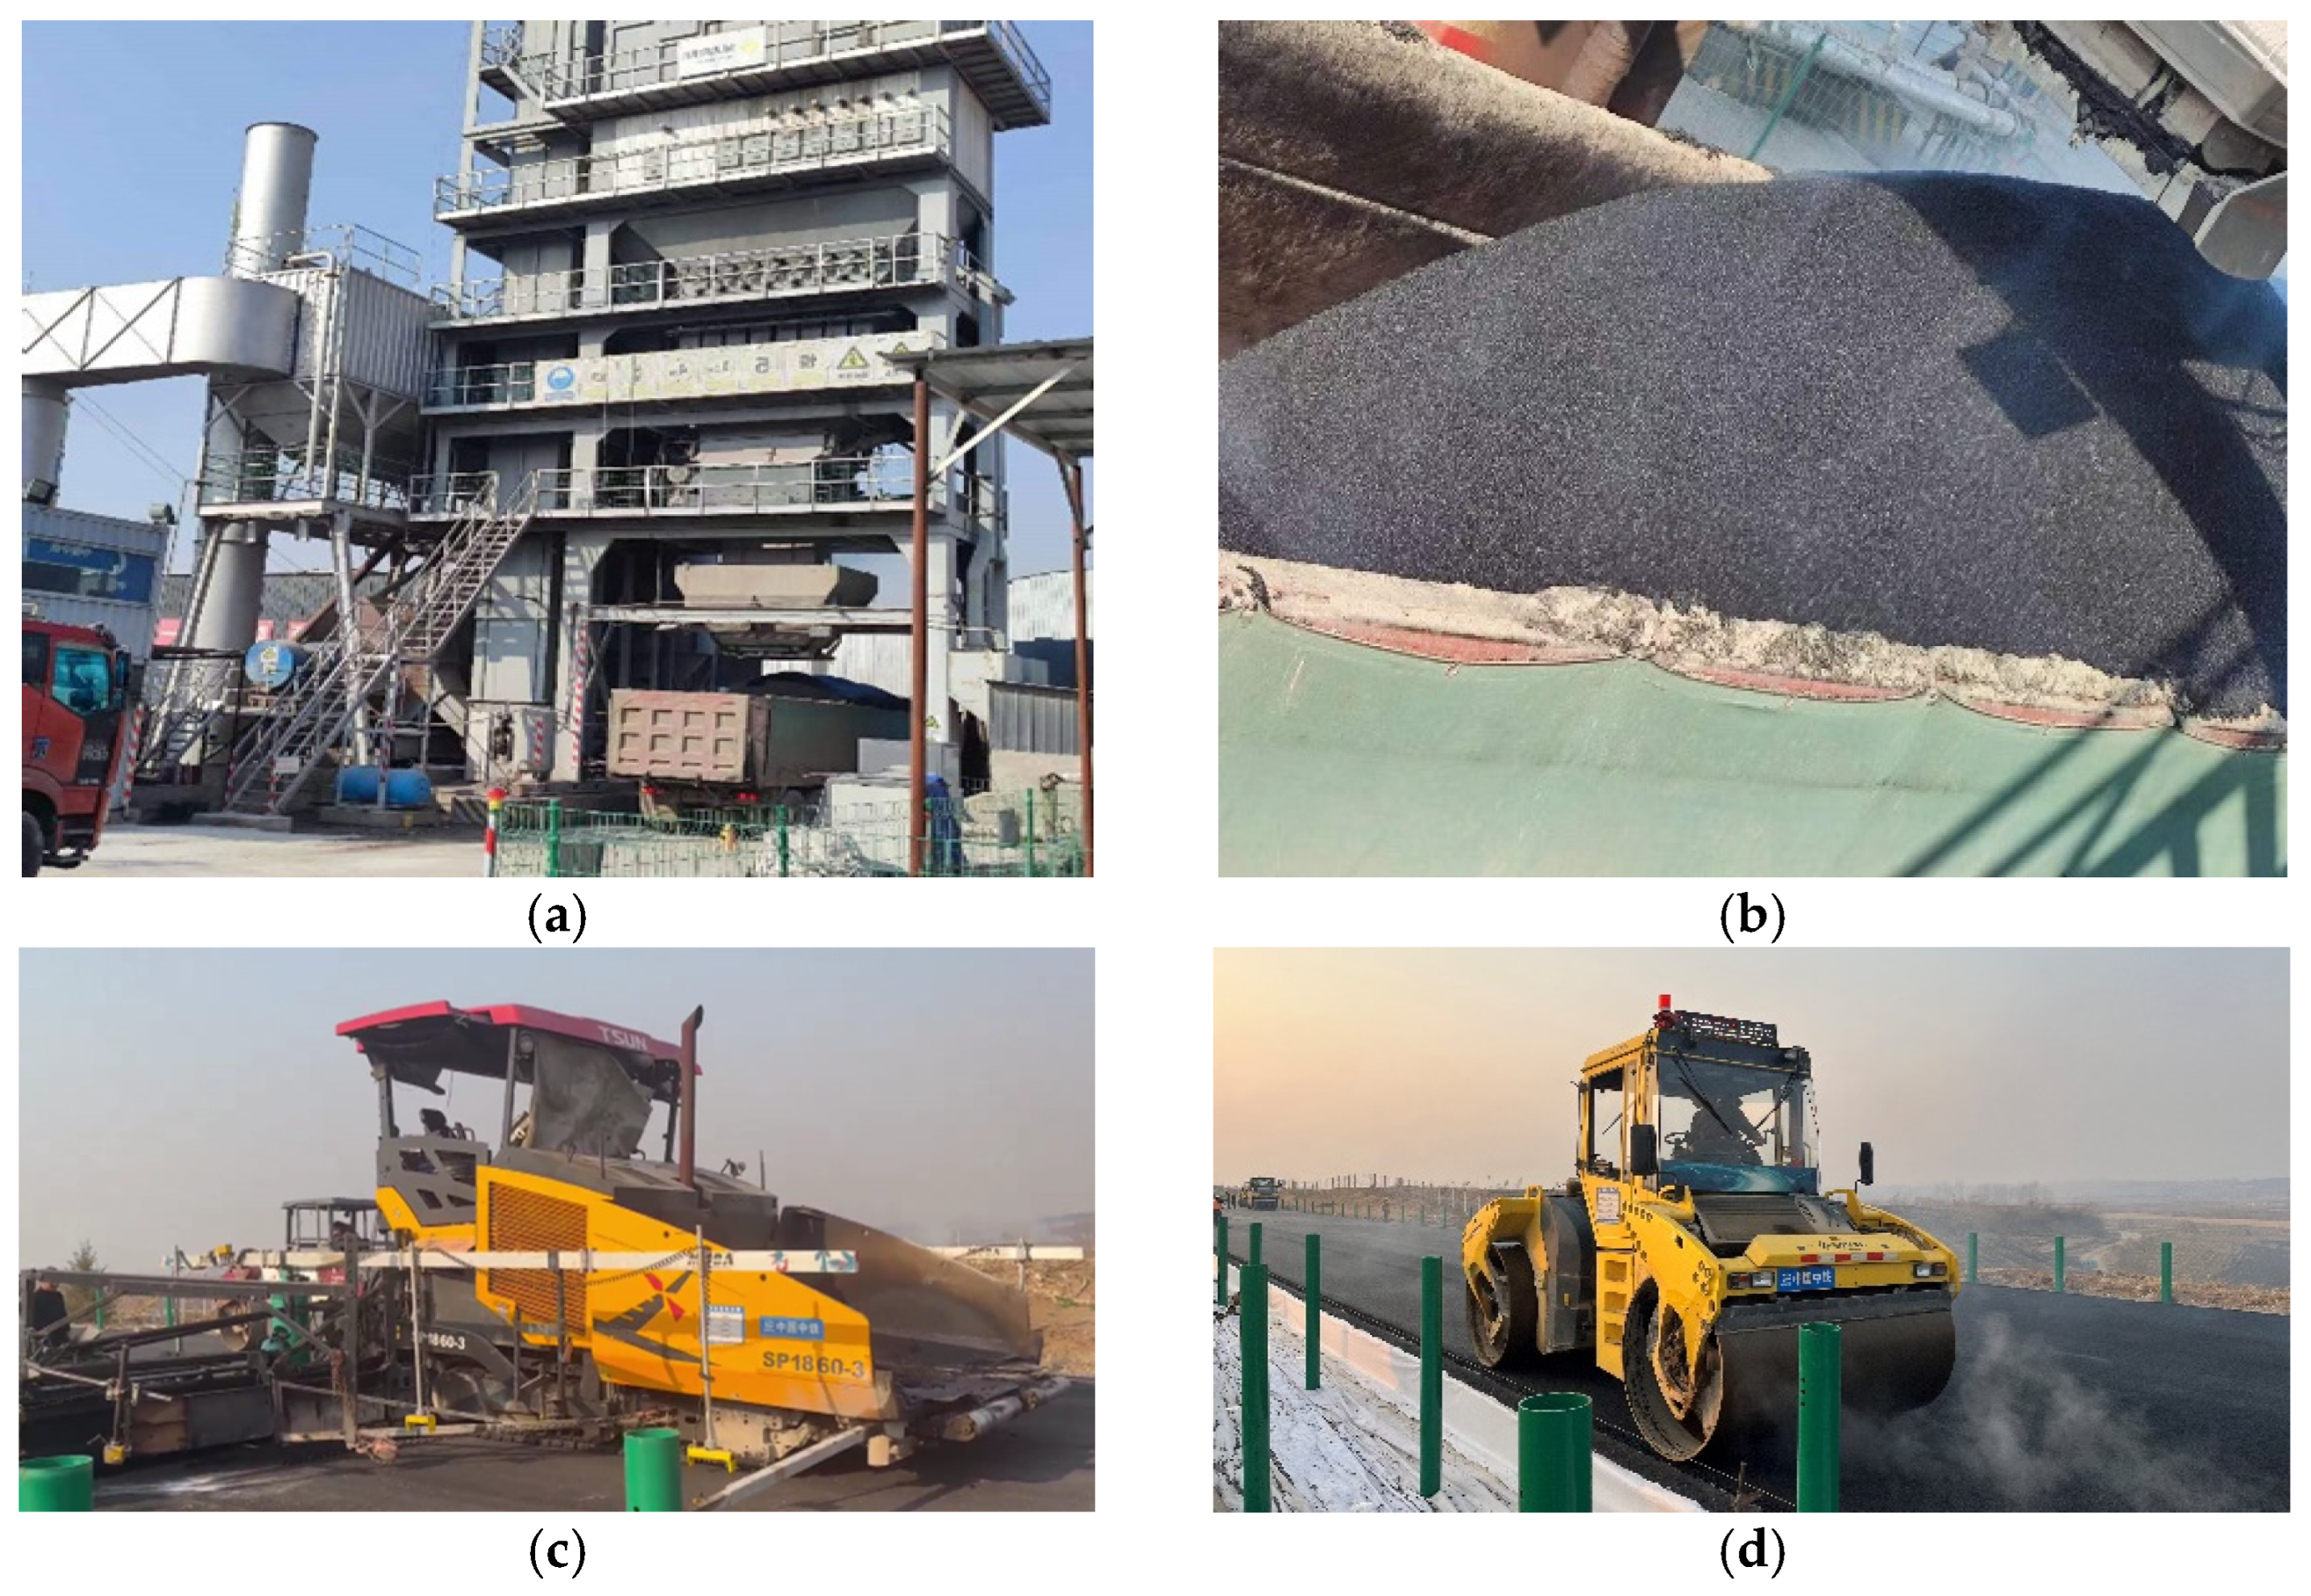
The RBL construction phase comprises four key stages: mixing, transporting, paving, and rolling. To ensure optimal mixture loading, it is essential to maneuver the delivery truck back and forth at least three times. It is imperative to cover the mixture adequately during transportation to prevent segregation and excessive cooling. Maintaining an even thickness is crucial when laying the mixture, with a controlled thickness of 4 ± 0.5 cm. Steel wheel rollers, not tire rollers, should be used to roll the RBLM to prevent the asphalt binding material from rubbing and causing uplift. The remaining construction process aligns with that of traditional asphalt mixtures. For a visual representation of the construction process, please refer to Figure 11.
6. Conclusions
This study synthesized relevant studies on an RBL in real engineering, summarizing the proposal of design and road performance indexes. Two types of RBLMs were designed, and test roads were subsequently paved. The specific conclusions extracted from the study are as follows:
- (1)
- As the base layer experiences cracking and the interlayer contact weakens, the stress at the bottom of the surface undergoes a transition from compressive stress to tensile stress, gradually increasing.
- (2)
- The VVs range from 2.0% to 3.0%, with the maximum strain observed in the three-point bending test exceeding 3500 με. Furthermore, the dynamic stability recorded in the wheel-tracking test surpasses 1000 cycles/mm, indicating their potential viability as design benchmarks for the RBLM.
- (3)
- An SMM and CMM were developed as RBLMs with optimal oil/stone ratios of 6.3% and 7.5%, respectively, meeting the design indexes.
- (4)
- The CMM emerges as the preferred option, showcasing superior performance and holding more significant promise for widespread adoption than the SMM.
Moreover, long-term monitoring is crucial to validate the efficacy of an RBL in real-world road applications. Such continuous observation will offer valuable insights and be a practical reference for addressing pavement issues like reflection cracking and fatigue cracking. By focusing on extended monitoring, comprehensive data can be gathered further to enhance the sustainability and durability of road infrastructure. Future research endeavors will concentrate on prolonged monitoring of the test section to authenticate the effectiveness of an RBL in practical road applications.
Author Contributions
Z.W. and A.A.: conceptualization and writing—Original draft. Z.W. and J.Y.: methodology. X.Z. and H.C.: investigation. A.A. and J.Y.: writing—review and editing. X.Z., H.C. and J.Y.: supervision, project administration, and funding acquisition. All authors have read and agreed to the published version of the manuscript.
Funding
This research was funded by China Railway Group Limited Science and Technology Development Program (2021-Key-42).
Institutional Review Board Statement
Not applicable.
Informed Consent Statement
Not applicable.
Data Availability Statement
The original contributions presented in the study are included in the article, further inquiries can be directed to the corresponding author.
Conflicts of Interest
Author Zhiqiang Wei was employed by the company China Railway Investment Group Co., Ltd. Author Xiangqing Zhao was employed by the company Northwest Research Institute Co., Ltd. of C.R.E.C. Author Honghai Cui was employed by the company Jilin Provincial Transportation Planning and Design Institute. The remaining authors declare that this research was conducted in the absence of any commercial or financial relationships that could be construed as potential conflicts of interest.
References
- Shan, J.; Zhang, Y.; Wu, S.; Wu, Q.; Jiao, Y.; Du, Y. Cracking behavior of asphalt pavement with a graded gravel layer based on computational granular mechanics. Constr. Build. Mater. 2022, 345, 128199. [Google Scholar] [CrossRef]
- Wang, T.; Wei, X.; Cheng, Z.; Zhang, D.; Lu, Q. Review of Improvement Measures for Fatigue Performance of SMA Mixture. J. Munic. Technol. 2023, 41, 238–246. [Google Scholar]
- Yu, L.; Wu, Y.; Meng, Y.; Huang, G.; Li, R.; Pei, J. Study on fatigue crack propagation failure in semi-rigid base. Constr. Build. Mater. 2023, 409, 134007. [Google Scholar] [CrossRef]
- Sun, Y.; Yan, T.; Wu, C.; Sun, X.; Wang, J.; Yuan, X. Analysis of the Fatigue Crack Propagation Process of the Stress-Absorption Layer of Composite Pavement Based on Reliability. Appl. Sci. 2018, 8, 2093. [Google Scholar] [CrossRef]
- Pan, R.; Li, Y. Effect of warm mix rubber modified asphalt mixture as stress absorbing layer on anti-crack performance in cold region. Constr. Build. Mater. 2020, 251, 118985. [Google Scholar] [CrossRef]
- Zhang, K.; Zhang, Z.; Luo, Y. Material Composition Design and Anticracking Performance Evaluation of Asphalt Rubber Stress-Absorbing Membrane Interlayer (AR-SAMI). Adv. Mater. Sci. Eng. 2018, 2018, 8560604. [Google Scholar] [CrossRef]
- Wang, S.; Yan, K.; Ge, D.; Hong, Z. Laboratory research on the performance of stress-absorption interlayer (SAI) of waste tire rubber and amorphous ploy alpha olefin modified asphalt. Constr. Build. Mater. 2019, 223, 830–840. [Google Scholar] [CrossRef]
- Zhang, H.; Peng, W.; Liu, J.; Li, P.; Li, Y. Influence of Air Voids on Performance of Paved Rubber Asphalt Stress Absorbing Layer. Gong Lu Jiao Tong Ke Ji 2022, 39, 22. [Google Scholar] [CrossRef]
- Willis, J.R.; Timm, D.H. Forensic Investigation of Debonding in Rich Bottom Pavement. Transp. Res. Rec. J. Transp. Res. Board 2007, 2040, 107–114. [Google Scholar] [CrossRef]
- Maher, M.L.J.; Uzarowski, L. From theory to practice: Rich bottom layer design. In Proceedings of the 11th International Conference on Asphalt Pavements, International Society for Asphalt Pavements, Nagoya, Japan, 1–6 August 2010. [Google Scholar]
- Wang, L.; Wei, J.; Wu, W.; Zhang, X.; Xu, X.; Yan, X. Technical development and long-term performance observations of long-life asphalt pavement: A case study of Shandong Province. J. Road Eng. 2022, 2, 369–389. [Google Scholar] [CrossRef]
- Bureš, P.; Fiedler, J.; Kašpar, J.; Sýkora, M.; Hýzl, P. Performance properties of asphalt mixes for rich bottom layers (RBL). IOP Conf. Ser. Mater. Sci. Eng. 2017, 236, 12004. [Google Scholar] [CrossRef]
- Li, L. Effect of Adhesion of Asphalt and Aggregate on Fatigue Performance of Asphalt Mixture. J. Munic. Technol. 2022, 40, 212–216. [Google Scholar]
- Huang, T.; Guo, P.; Peng, X.; Cao, Z.; Lv, S.; Liu, H.; Sheng, J. Three-Dimensional Failure Criterion of Asphalt Mixtures in Asphalt Pavement. J. Mater. Civ. Eng. 2022, 34, 04022149. [Google Scholar] [CrossRef]
- Newcomb, D.E.; Buncher, M.; Huddleston, I.J. Concepts of perpetual pavements. Transp. Res. Circ. 2001, 11, 503. [Google Scholar]
- Tarefder, R.A.; Bateman, D. Design of Optimal Perpetual Pavement Structure. J. Transp. Eng. 2012, 138, 157–175. [Google Scholar] [CrossRef]
- Abdukadir, A.; Pei, Z.; Zhou, W.; Yi, J. Optimization of composite-modified asphalt ratio and performance evaluation of rich bottom layer mixes. Constr. Build. Mater. 2024, 411, 134792. [Google Scholar] [CrossRef]
- Fang, M.; Hu, T.; Rose, J.G. Geometric composition, structural behavior and material design for asphalt trackbed: A review. Constr. Build. Mater. 2020, 262, 120755. [Google Scholar] [CrossRef]
- Xiao, X.; Cai, D.; Lou, L.; Shi, Y.; Xiao, F. Application of asphalt based materials in railway systems: A review. Constr. Build. Mater. 2021, 304, 124630. [Google Scholar] [CrossRef]
- JTG E20–2011; Standard Test Methods of Bitumen and Bituminous Mixtures for Highway Engineering. Ministry of Communications of the PRC: Beijing, China, 2011.
- JTG E42–2005; Test Methods of Aggregates for Highway Engineering. Ministry of Communications of the PRC: Beijing, China, 2005.
- Yan, M.; Wang, J. Application of ABAQUS Finite Element Softwarein Pavement Structural Analysis; Zhejiang University Press: Hangzhou, China, 2016. [Google Scholar]
- Li, X.; Ran, W. Dynamic response analysis of semi-rigid base asphalt pavement with interlayer contact and cracks. J. Shihezi Univ. (Nat. Sci.) 2020, 38, 586–592. [Google Scholar]
- JTG F40–2004; Technical Specification for Construction of Highway Asphalt Pavements. Ministry of Communications of the PRC: Beijing, China, 2004.
- Shi, X.; Zhai, J.; Wang, Y.; An, Y.; Li, Y.; Li, F. Study on Performance of SBS Compound Modified Low Content Rubber Asphalt. J. Munic. Technol. 2022, 40, 180–187. [Google Scholar]
- Chen, Q.; Lin, Y. Study on the Effect of Different Warm Mixing Agents on Property of Warm-mixed Rubber Asphalt Mixture. J. Munic. Technol. 2022, 40, 164–170. [Google Scholar]
- Zhang, Z. Study on Performance of Low Content Crumb Rubber Modified Asphalt and Mixture. J. Munic. Technol. 2022, 40, 57–61. [Google Scholar]
- Ren, S.; Liu, X.; Xu, J.; Lin, P. Investigating the role of swelling-degradation degree of crumb rubber on CR/SBS modified porous asphalt binder and mixture. Constr. Build. Mater. 2021, 300, 124048. [Google Scholar] [CrossRef]
Figure 1.
Road pavement structure with rich bottom layer (RBL).
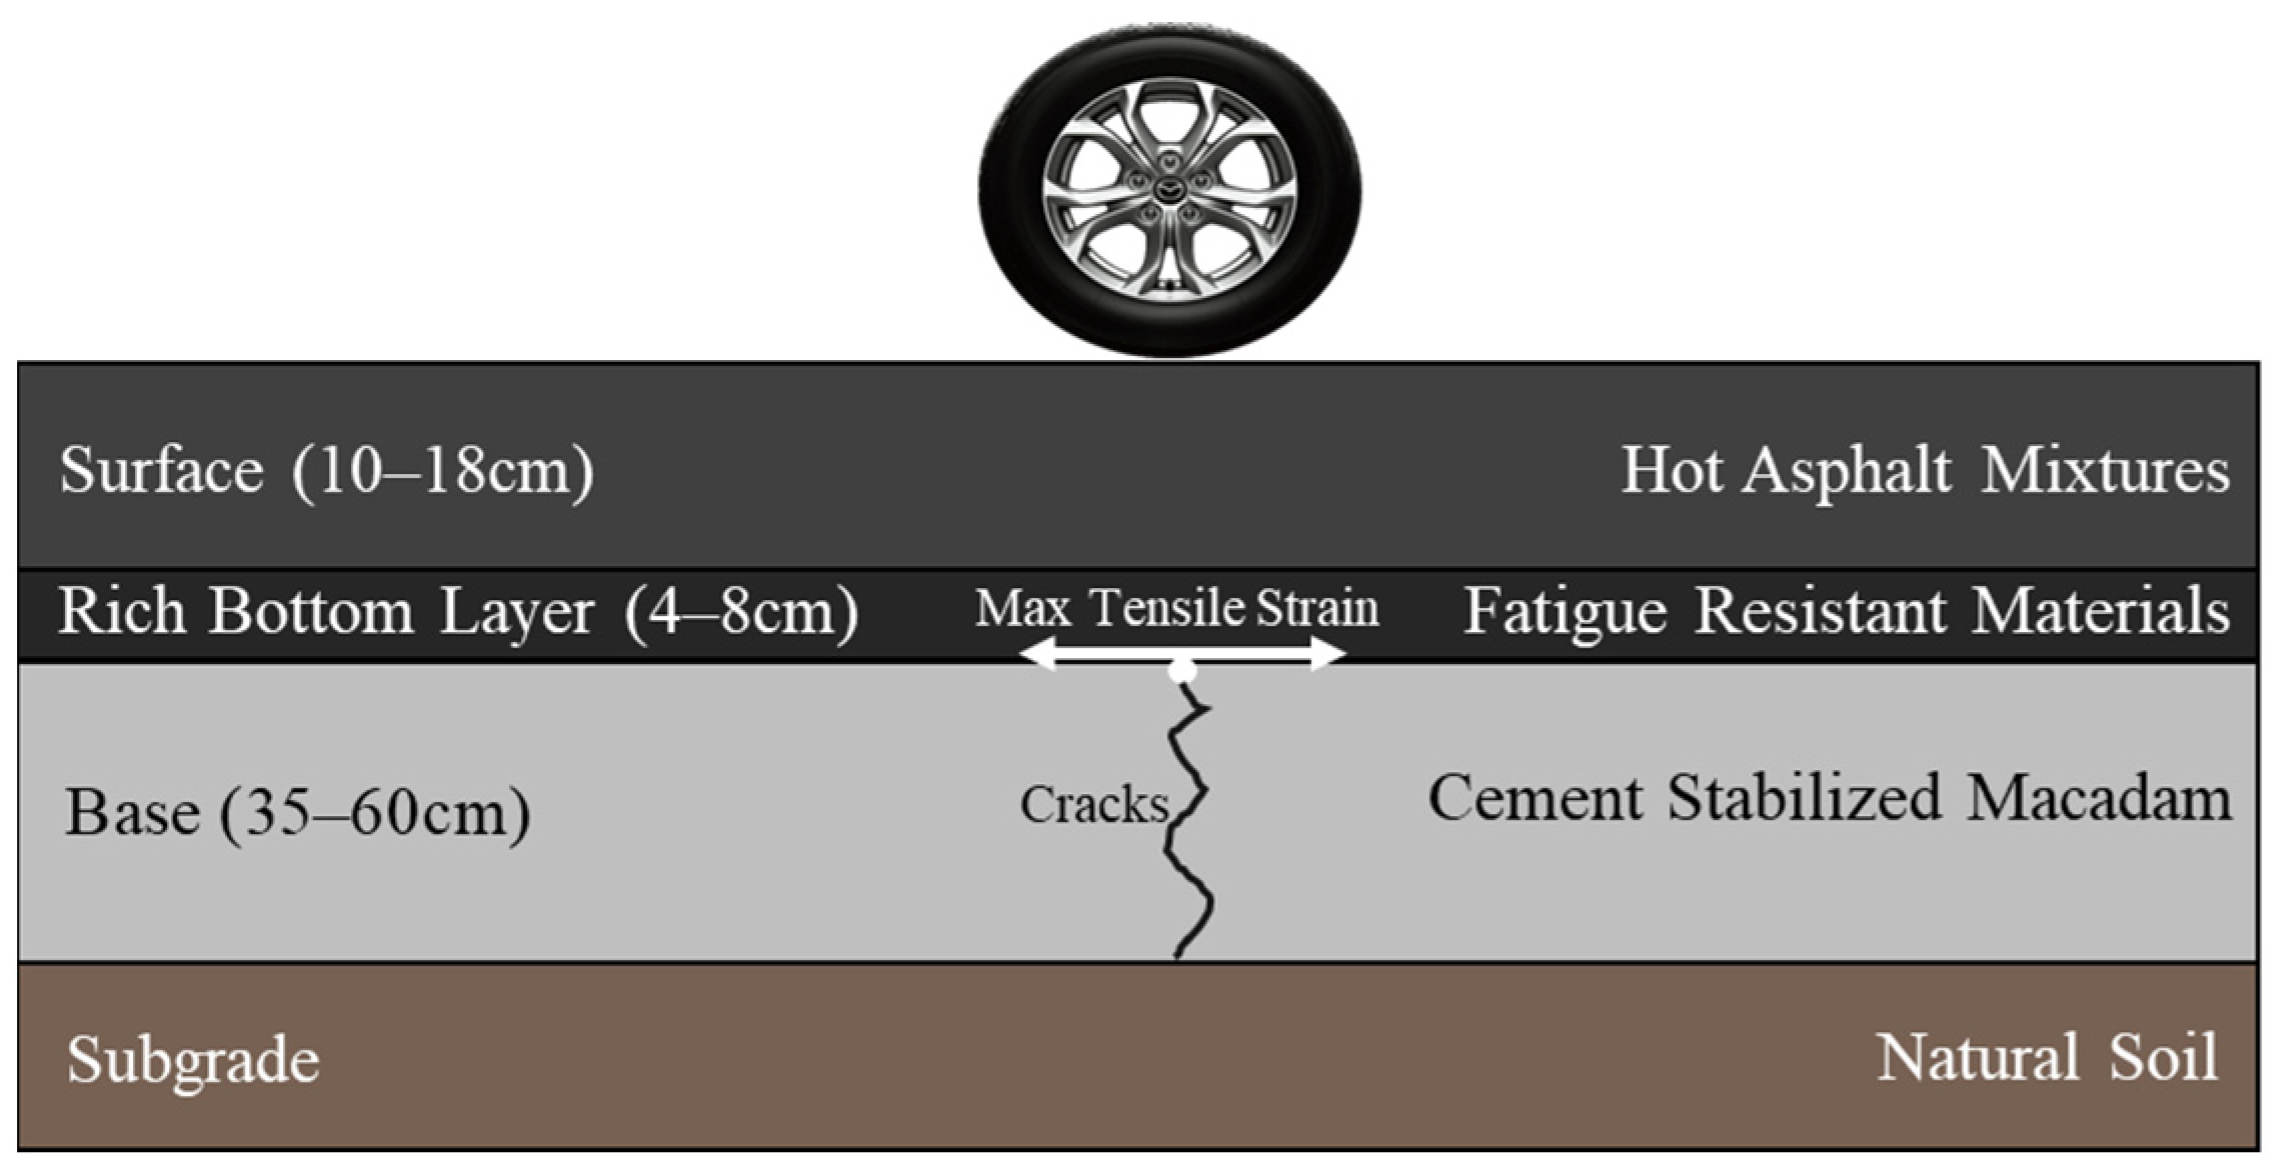
Figure 2.
Finite element model: (a) modeling; (b) cell division.
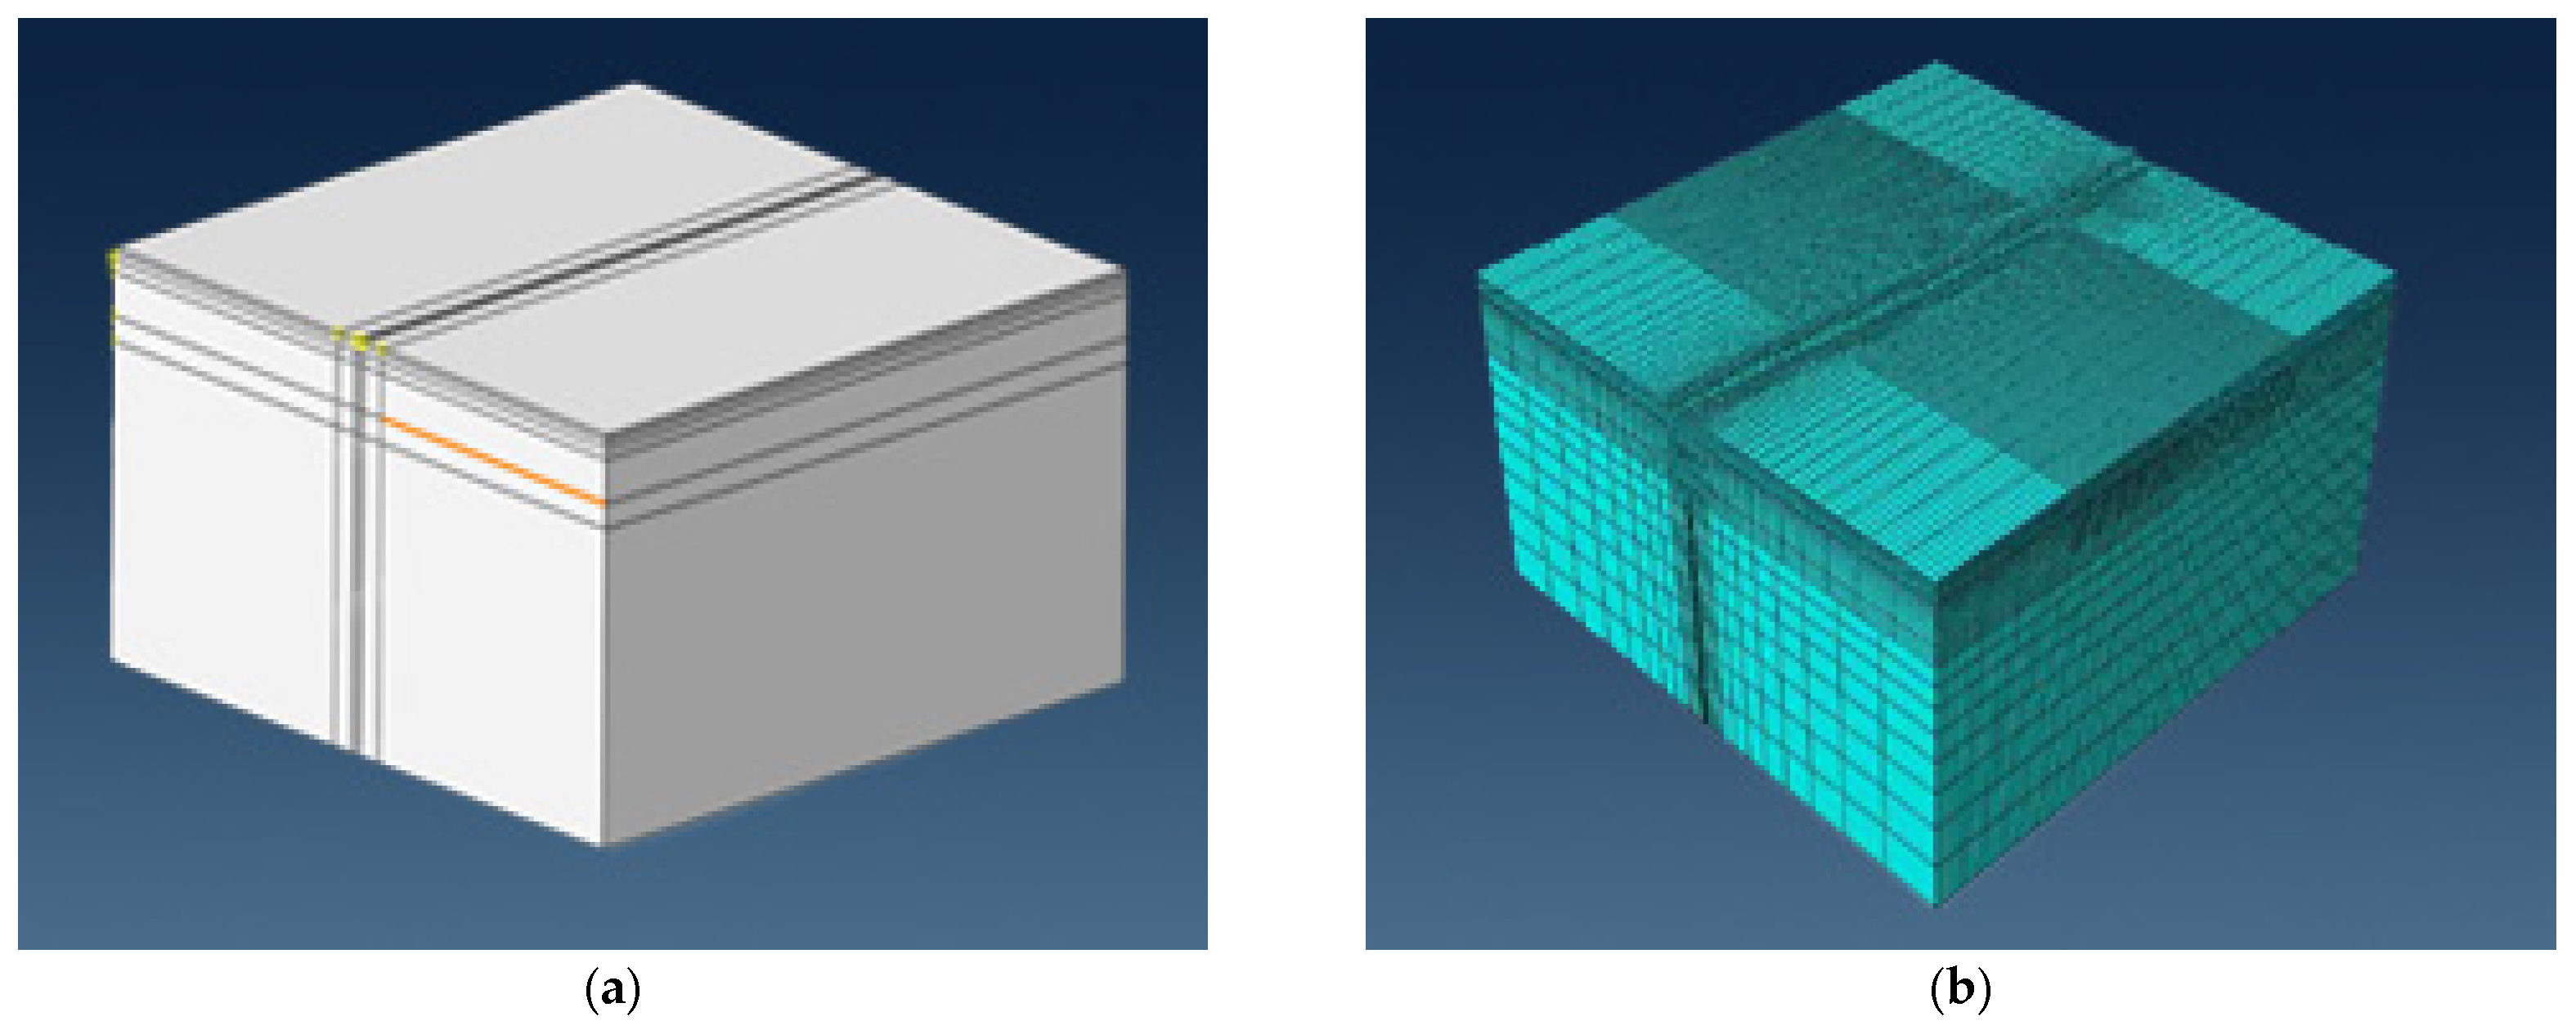
Figure 3.
Test flow.
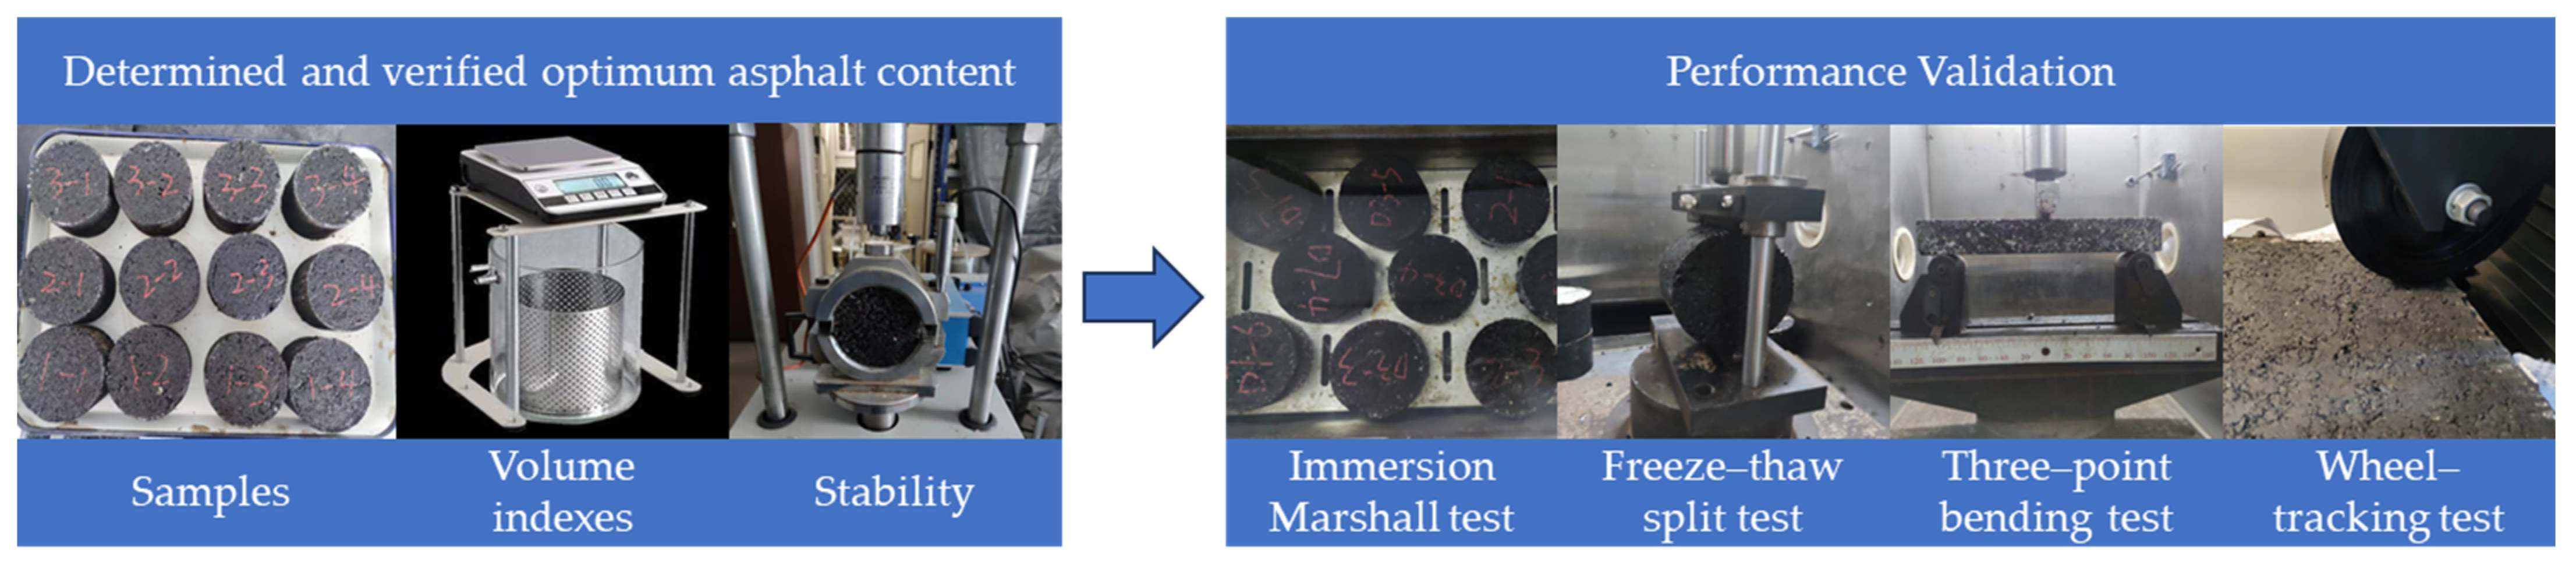
Figure 4.
Bottom stress of surface and base.
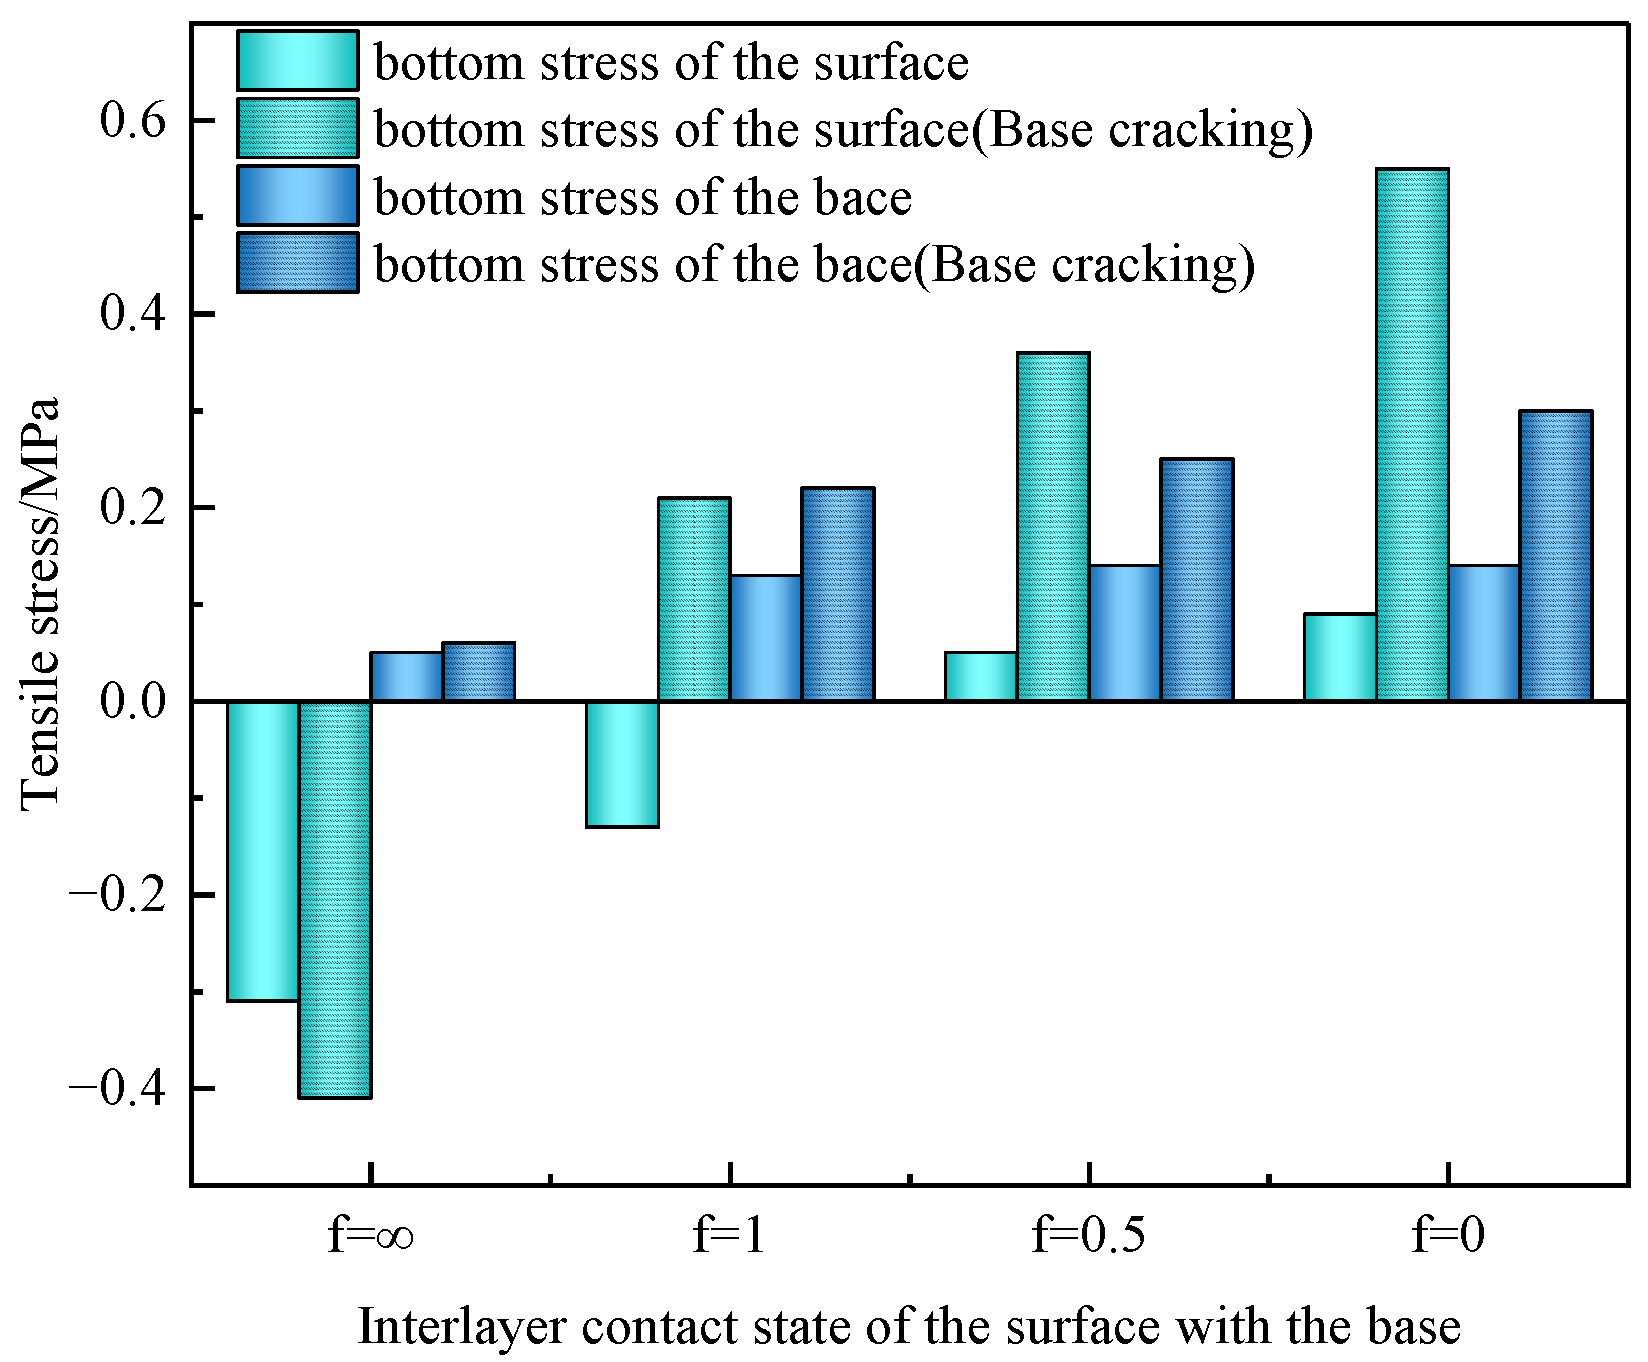
Figure 5.
Aggregate gradations.

Figure 6.
Immersing Marshall test.

Figure 7.
Freeze–thaw splitting test.

Figure 8.
Three-point bending test.

Figure 9.
Wheel-tracking test.

Figure 10.
The preparation process of composite-modified asphalt and its mixture.

Figure 11.
Construction process of RBLMs: (a) mixing; (b) transporting; (c) paving; (d) rolling.


Table 1.
Summary of technical indexes for RBLMs.
| Items | Technical Indexes | Test Method | |||
|---|---|---|---|---|---|
| National Highway G108 | Qinglan Expressway Reconstruction and Expansion | Shenshan Expressway Reconstruction and Expansion | This Study | ||
| Grading | FL-13 | AC-13 | AC-10 | AC-10 | - |
| Asphalt content/% | - | 5.3–6.0 | 5.7–6.0 | - | Marshall test |
| Volume of air voids/% | <3.0 | 2.0–3.0 | 2.0–3.0 | 2.0–3.0 | T 0705-2011 |
| Void filled with asphalt/% | - | >80 | 70–85 | 70–90 | T 0705-2011 |
| Marshall stability/kN | - | >8.0 | >9.0 | >9.0 | T 0709-2011 |
| Flow value/0.1 mm | - | 20–40 | 20–50 | 20–50 | T 0709-2011 |
| Residual stability/% | >85 | - | >85 | >85 | T 0709-2011 |
| Tensile strength ratio/% | >80 | >75 | >80 | >80 | T 0729-2000 |
| Maximum flexural strain/µε | ≥2500 | ≥2800 | ≥2800 | >3500 | T 0728-2000 |
| Dynamic stability/(cycles/mm) | - | - | - | >1000 | T 0719-2011 |
Table 2.
Asphalt technical indexes.
| Items | SBS-Modified Asphalt | Composite-Modified Asphalt | Test Method |
|---|---|---|---|
| Penetration/(25 °C, 0.1 mm) | 57.1 | 41.4 | T 0604 2011 |
| Softening point/°C | 64.0 | 86.8 | T 0606 2011 |
| Ductility/(15 °C, cm) | 30.5 | 15.8 | T 0605 2011 |
| Viscosity/(180 °C, mPa·s) | 312.8 | 2476 | T 0625 2011 |
Table 3.
Aggregate technical indexes.
| Items | Aggregate Type | Technical Indexes | Test Method | |
|---|---|---|---|---|
| 5–10 mm | 0–3 mm | |||
| Bulk specific gravity | 2.840 | 2.262 | >2.5 | T 0305-2005 |
| Apparent specific gravity | 2.910 | 2.718 | >2.6 | T 0328-2005 |
Table 4.
Filler technical indexes.
| Items | Bulk Specific Gravity | Water Absorption/% | Percent Passing/% | ||
|---|---|---|---|---|---|
| <0.6 mm | <0.15 mm | <0.075 mm | |||
| Test results | 2.798 | 0.91 | 100 | 92.7 | 80.3 |
| technical indexes | >2.5 | <1.0 | 100 | 90–100 | 75–100 |
| Test method | T 0352-2005 | T 0103-2005 | T 0351-2000 | ||
Table 5.
The road pavement structural and material parameters.
| Layer | Material | Thickness/cm | 20 °C Young’s Modulus/MPa | Density/(kg/m3) | Damping Value | Poisson’s Ratio |
|---|---|---|---|---|---|---|
| Upper surface | SMA-13 | 4.0 | 1159 | 2300 | 0.9 | 0.30 |
| Medium surface | AC-20 | 6.0 | 1454 | 2300 | 0.9 | 0.30 |
| Under surface | ATB-25 | 8.0 | 1592 | 2300 | 0.9 | 0.25 |
| Base | Cement stabilized macadam | 32.0 | 1500 | 2400 | 0.8 | 0.20 |
| Subbase | 18.0 | 1300 | 2400 | 0.6 | 0.20 | |
| Subgrade | Compressed soil | 232.0 | 45 | 1850 | 0.4 | 0.40 |
Table 6.
The number of samples in individual tests.
| Items | Immersion Marshall Test | Freeze–Thaw Split Test | Three–Point Bending Test | Wheel–Tracking Test |
|---|---|---|---|---|
| number | 8 | 8 | 6 | 2 |
Table 7.
SMMs ratio design.
| Oil/Stone Ratio/% | Relative Density of Gross Volume | Marshall Stability/kN | Flow Value/0.1 mm | Volume of Air Voids/% | Voids in Mineral Aggregate/% | Void Filled with Asphalt/% |
|---|---|---|---|---|---|---|
| 5.8 | 2.473 | 13.23 | 31.98 | 3.73 | 10.17 | 63.37 |
| 6.3 | 2.481 | 12.89 | 43.48 | 2.71 | 9.86 | 72.51 |
| 6.8 | 2.469 | 12.72 | 47.23 | 2.54 | 10.32 | 75.43 |
Table 8.
CMMs ratio design.
| Oil/Stone Ratio/% | Relative Density of Gross Volume | Marshall Stability/kN | Flow Value/0.1 mm | Volume of Air voids/% | Voids in Mineral Aggregate/% | Void Filled with Asphalt/% |
|---|---|---|---|---|---|---|
| 7.2 | 2.437 | 18.46 | 36.43 | 2.75 | 11.48 | 76.07 |
| 7.7 | 2.433 | 17.59 | 40.45 | 2.21 | 11.61 | 80.98 |
| 8.2 | 2.424 | 17.03 | 49.63 | 1.91 | 11.95 | 84.05 |
Table 9.
Verification of mixture volume indexes.
| Items | Oil/Stone Ratio/% | Relative Density of Gross Volume | Marshall Stability/kN | Flow Value/0.1 mm | Volume of Air Voids/% | Voids in Mineral Aggregate/% | Void Filled with Asphalt/% |
|---|---|---|---|---|---|---|---|
| SMM | 6.3 | 2.480 | 14.63 | 43.83 | 2.76 | 9.91 | 72.14 |
| CMM | 7.5 | 2.429 | 18.81 | 40.47 | 2.64 | 11.76 | 77.55 |
Table 10.
RBLMs test road pavement structure.
| Items | Test Road | Control Road |
|---|---|---|
| Upper surface | 4 cm SMA-13 | 4 cm SMA-13 |
| Medium surface | 6 cm AC-20 | 6 cm AC-20 |
| Under surface | 8 cm ATB-25 | 8 cm ATB-25 |
| Rich bottom layer | 4 cm AC-10 | - |
| Base and Subbase | 48 cm cement stabilized macadam | 52 cm cement stabilized macadam |
Table 11.
Mixtures construction temperature.
| Items | SMM | CMM |
|---|---|---|
| Asphalt heating temperature | 160 °C–165 °C | 180 °C–190 °C |
| Aggregate heating temperature | 190 °C–220 °C | 190 °C–220 °C |
| Mixtures waste temperature | 195 °C | 210 °C |
| Discharge temperature | 170 °C–185 °C | 180 °C–195 °C |
| Spreading temperature | >160 °C | >170 °C |
| Initial milling temperature | >150 °C | >155 °C |
| Final milling temperature | >90 °C | >120 °C |
| Environmental temperature | >15 °C | |
Disclaimer/Publisher’s Note: The statements, opinions and data contained in all publications are solely those of the individual author(s) and contributor(s) and not of MDPI and/or the editor(s). MDPI and/or the editor(s) disclaim responsibility for any injury to people or property resulting from any ideas, methods, instructions or products referred to in the content. |
© 2024 by the authors. Licensee MDPI, Basel, Switzerland. This article is an open access article distributed under the terms and conditions of the Creative Commons Attribution (CC BY) license (https://creativecommons.org/licenses/by/4.0/).
Share and Cite
MDPI and ACS Style
Wei, Z.; Abdukadir, A.; Zhao, X.; Cui, H.; Yi, J. Design and Application of Rich Bottom Layer Mixtures. Coatings 2024, 14, 519. https://doi.org/10.3390/coatings14050519
AMA Style
Wei Z, Abdukadir A, Zhao X, Cui H, Yi J. Design and Application of Rich Bottom Layer Mixtures. Coatings. 2024; 14(5):519. https://doi.org/10.3390/coatings14050519
Chicago/Turabian StyleWei, Zhiqiang, Abduhaibir Abdukadir, Xiangqing Zhao, Honghai Cui, and Junyan Yi. 2024. "Design and Application of Rich Bottom Layer Mixtures" Coatings 14, no. 5: 519. https://doi.org/10.3390/coatings14050519
Note that from the first issue of 2016, this journal uses article numbers instead of page numbers. See further details here.