

In Vitro Evaluation of Optimized PEEK Surfaces for Enhanced Osseointegration
by

Kadie Nobles
1,
Amol V. Janorkar
1, 
Michael D. Roach
1,
Lawrence Walker
2 and
Randall Scott Williamson
1,* 1
University of Mississippi Medical Center, Department of Biomedical Materials Science, Jackson, MS 39216, USA
2
Zavation Medical Products, LLC, Flowood, MS 39232, USA
*
Author to whom correspondence should be addressed.
Coatings 2024, 14(5), 518; https://doi.org/10.3390/coatings14050518
Submission received: 30 March 2024
/
Revised: 18 April 2024
/
Accepted: 19 April 2024
/
Published: 23 April 2024
(This article belongs to the Special Issue Advanced Biomaterials, Coatings and Techniques: Applications in Medicine and Dentistry)
Abstract
:The materials traditionally used for implant applications, such as titanium alloys, cobalt chromium, and zirconium, often require surface modifications to achieve the desired osseointegration. These materials still have the problematic stress-shielding effect. To limit stress shielding, PEEK is the superior alternative to fulfill implant needs. However, the traditional methods of modifying and functionalizing the surface of PEEK are often expensive, time consuming, and are not easily translated into commercialization. Sulfonation is a process, which is dependent on controllable factors. Thus far, no research has been performed to optimize the sulfonation process. Our data suggest that the process factors can be controlled and optimized. Cellular activity was examined on the optimized PEEK surfaces through testing with pre-osteoblast MC3T3-E1 cells through cell viability (MTT assay), cell proliferation (DNA assay), cell differentiation (ALP assay), and cell mineralization (Alizarin red assay). Overall, sulfonated and heat-treated PEEK exhibited a statistically significant increase in DNA content over the course of 21 days, indicating more cell proliferation and viability for that surface. In vitro testing results showed that the optimized sulfonated and heat-treated PEEK exhibited superior cell proliferation and mineralization performance over smooth PEEK and sulfonated-only PEEK.
1. Introduction
The need for orthopedic implants to treat musculoskeletal disorders has been on the rise and is expected to continue increasing as the age of the population increases. There was a 113% increase in spinal fusion procedures from 1998 to 2011 and a total of 1,390,611 spinal procedures in 2011 according to the HCUP Nationwide Inpatient Sample (NIS) [1]. However, up to 10% of these implants experience failure due to causes such as poor osseointegration, infection, and failure/breakage [2,3,4,5]. Osseointegration is the direct connection between living bone and the surface of an implant and is crucial for the long-term success of an implant [6]. Successful osseointegration into an implant interface is mainly influenced by material stiffness and porosity ranging in size from 100 to 600 µm; thus, it is critical to find the appropriate material and apply a surface modification, which will be conducive to enhanced osseointegration [6,7,8].
Polyetheretherketone (PEEK) is a semi-crystalline non-resorbable polymer, which is radiolucent, biocompatible, and resistant to most chemicals. PEEK has gained popularity as an alternative replacement for titanium-based implants in orthopedic applications, such as spine surgery, prosthodontics surgery, and maxilla-facial surgery, over recent decades [9,10,11,12,13]. PEEK has an elastic modulus of 3–8 GPa, which is similar to the 7–30 GPa range of human cortical bone; therefore, the problem of stress shielding often seen with titanium implants, which have an elastic modulus of 55–110 GPa, is diminished when a PEEK-based material is utilized [13,14,15,16,17,18]. One disadvantage of utilizing PEEK as an implant material is that the material is bioinert and requires surface modifications to elicit any desirable cellular responses [9,11,19,20,21,22].
Osseointegration is influenced by surface features such as roughness and wettability and is favorable to porous surfaces because they promote cellular attachment and allow cell infiltration. Osteoblasts range in size from 10 to 50 µm, but the typical pore sizes used for orthopedic applications, which have shown propitious osseointegration, are in the size range of 100–400 µm [8,23,24,25,26,27]. Surface roughness on the micro-scale, typically noted as 1–50 µm, can enhance cell adhesion and osseointegration by increasing early mechanical interlocking of the osteoblast cells, and roughness on the nano-scale of 1–1000 nm can act to signal cellular attachment and differentiation, since the roughness of natural bone is around 32 nm [23,24,25,26,28,29,30]. It is thought that a more hydrophilic surface, which allows for increased protein adsorption and favorable protein conformations, will improve cell attachment [23,31,32]. However, studies of how wettability influences osseointegration have produced contradicting results in the literature, which shows surfaces ranging from superhydrophobic (water contact angle >150°) to superhydrophilic (water contact angle approaching 0°) to be optimal for attachment and growth of osteoblasts [31,33,34,35,36]. The literature tends to point toward wettability being a secondary influence on osseointegration, whereas features such as porosity, roughness, and coatings are the primary influences [32,35,37,38].
Sulfonation, which is the use of sulfuric acid to etch a surface, has long been performed as a method to modify aromatic polymers for the production of proton-exchange membranes for technologies such as polymer fuel cells and electrodialysis [39,40,41]. The porous network left behind on the surface of the sulfonated PEEK has encouraged researchers to utilize the technology for biomedical applications [42,43,44,45]. PEEK sulfonation is an electrophilic reaction in which the hydroquinone unit benzene-1,4-diol, beside the ether bridge, is sulfonated, leaving behind a sulfonic acid, the -SO3H group, as seen in Figure 1 [39,41,44].
This sulfuric acid etching creates a porous structure on the PEEK surface, which can be conducive to cellular attachment; however, the residual -SO3H group left behind can be toxic to an in vitro/in vivo environment, thus needing to be removed through a de-sulfonation process. Hydrothermal treatment with water is a method, which can be used to remove the residual -SO3H groups, as seen in Figure 2. In the presence of water and heat, the water molecules react with hydrogen (H) on the sulfur trioxide (SO3) group, creating hydronium (H3O), which reacts with the benzene ring, causing SO3 to detach and leave as a gas when heated to its boiling point of 45 °C [47].
The purpose of this study was to investigate the potential effects sulfonation processing may have on modifying the surface of PEEK for enhanced osseointegration. Design of experiment (DOE) methods were performed to optimize surface features and surface porosity on PEEK. A hydrothermal treatment process was also utilized on the optimized sulfonated PEEK surface to remove the residual sulfocompound groups to render the surfaces advantageous to cellular attachment, proliferation, and differentiation. After successful optimization of the sulfonation process, an in vitro study with pre-osteoblast MC3T3-E1 cells was examined on the optimized PEEK surfaces though cell viability (MTT assay), cell proliferation (DNA assay), cell differentiation (ALP assay), and cell mineralization (Alizarin red assay).
2. Materials and Methods
2.1. Materials
Medical-grade PEEK rods with approximately ½” diameters were provided by Zavation Medical Products, LLC (Flowood, MS, USA). Concentrated sulfuric acid (95%–98%) was purchased from Sigma-Aldrich (Burlington, MA, USA). Silicon carbide grinding paper, grit 320, was purchased from Struers (Cleveland, OH, USA) for preparation of the PEEK surfaces before sulfonation.
2.2. Specimen Preparation
Disk-shaped specimens with a thickness of approximately 4 mm and a diameter of approximately 12.5 mm were cut from the PEEK rods using a Struers Accutom-50 sectioning saw (Cleveland, OH, USA). The disk specimens were then mounted in bakelite (Struers Citopress-20, Cleveland, OH, USA) and subsequently grinded for 15 s using a 320-grit silicon carbide grinding paper, washed, and grinded again for 15 s (Struers TegraPol, Cleveland, OH, USA). The specimens were removed from the mount and underwent a 5-stage wash cycle, consisting of the following: ultrasonic clean in Alconox® (Alconox Inc., White Plains, NY, USA) for 5 min, rinse with distilled water, ultrasonic clean in distilled water for 5 min, rinse with ethanol, and rinse with distilled water. The specimens were then allowed to air dry at room temperature and stored until further use.
2.3. Experimental Design—Optimizing the Sulfonated Surface
An altered design of experiment (DOE) approach was utilized to optimize the surface porosity on the PEEK specimen. Minitab® software Version 20.1.3.0 (State College, PA, USA) was used to generate some of the experimental designs; however, because some specimens early in the optimization process did not have measurable features (i.e., pore size), a qualitative approach to narrowing down the sulfonation processing factors had to be adopted. Therefore, DOE was employed to help design the experiments when many factors were under consideration, and then, intellectual intuition was used to narrow down the sulfonation factors until measurable porosity could be attained. Hence, the authors refer to this as an altered DOE approach. It took a total of six separate designs to ultimately reach the optimized surface, and those design parameters are shown in Table 1. The following sulfonation factors were identified as the most critical to investigate for this study: pre-surface condition, soak condition, acid concentration, soak time, and soak temperature. Pre-surface condition refers to the roughness of the sulfonated surface obtained by using different grit sized silicon carbide grinding paper. There are four soak conditions mentioned in Table 1, which are stirring (S), no stirring (NS), sonication only (SO), and sonication plus stirring (SS). Acid concentration alludes to the concentration of the sulfuric acid used for the sulfonation.
After Design #1 experimentation, many of the specimens did not have measurable porosity; therefore, it was not useful to put the responses in the DOE and narrow down the significant factors in that manner. Therefore, the authors examined each specimen qualitatively and made decisions on what factors to adjust or eliminate moving forward. The results from Design #1 indicated that a rougher surface was more conducive to initiating sulfonation on the PEEK surface; therefore, the high factor of 1200-grit grinding paper was eliminated, and stirring was also eliminated as a factor due to the creation of streaks on the sulfonated surface and addition of additional variables to control for in the process. Other factors, such as time and temperature, were also adjusted following Design #1. The soak time high of 10 min resulted in zero pores on the surface and made the surface appear melted; therefore, the authors chose to reduce the total soak time parameters significantly moving forward. Additionally, acid concentrations lower than fully concentrated sulfuric acid did not react with the PEEK surfaces to create porosity.
Design #2 and Design #3 were used to further refine the soak time and soak temperature. In between Design #3 and Design #4, the authors discovered that it would be fitting to look at a pre-surface condition, which more closely matched that of the specimen types, which would be generated by a manufacturer. A brief surface roughness side study was conducted to try and match the PEEK pre-surface condition to that of as-manufactured solid PEEK, and the authors discovered that a 320-grit grinding paper was optimal for that purpose and was therefore used going forward for Design #4–Design #6. Additionally, Minitab® was no longer used for generating designs after Design #3 was finished, and instead, designs were created based on intellectual intuition. During the design process, a beneficial method for removing the sulfuric acid and cleaning the specimen after soaking was discovered. This method involved the use of compressed air to lightly blast the acid off the surface, which enabled retention of the pores that formed during the sulfonation process. It was discovered through experimentation that the pores formed during sulfonation could be disrupted when the specimen was cleaned after soaking due to the exothermic reaction, which occurs when sulfuric acid is mixed with water.
Designs #4–#6 provided features, which were quantifiable, and thus, ImageJ software Version 1.53e (National Institutes of Health, Bethesda, MD, USA) was used to extract the pore size data for comparison between the specimens and factors.
2.4. Optimizing the Hydrothermal Treatment
Hydrothermal treatment experimentation began after optimized sulfonation factors were chosen, which provided a surface with a desirable porosity. The purpose of the hydrothermal treatment experiments was to provide an optimal range in which most of the residual sulfocompound (sulfur) groups were no longer present on the optimized sulfonated PEEK surface. The experiment was designed around a soak time low of 60 min and high of 90 min, and a soak temperature low of 45 °C and high of 80 °C, as listed in Table 2. A total of two designs were conducted for the hydrothermal treatment. The hydrothermally treated specimens were sulfonated according to the optimized parameters identified in Design #6 above and further detailed in the Results and Discussion sections. Water was continuously stirred during the hydrothermal treatment. Low and high values for the factors were initially chosen based on values originally cited in the literature [43,44]. The second design was chosen based on results from the first design. Fourier transform infrared spectroscopy (FTIR, Perkin-Elmer, Waltham, MA, USA) with a diamond/ZnSe crystal at a resolution of 4 cm−1 and scanned from 650 to 4000 cm−1 was utilized on smooth PEEK, sulfonated-only PEEK (sfPEEK), and sulfonated and heat-treated PEEK (sfPEEK-HT) to identify the functional groups of interest related to the successful removal of the residual sulfocompound groups from the optimized sulfonated PEEK surface.
2.5. Surface and Physical Characterization
2.5.1. Digital Imaging and Pore Size Measurements
All sulfonated surfaces were imaged and documented using a VHX digital microscope and its corresponding software (Keyence Corp., Osaka, Japan). Images were optimized using the contrasting and brightening features in Keyence before being processed using ImageJ software. ImageJ was used to measure the pore size and distribution data from the surfaces when applicable.
2.5.2. Atomic Force Microscopy
Atomic force microscopy (AFM, Bioscope Catalyst, Bruker, Santa Barbara, CA, USA) was performed on the optimized sulfonated and heat-treated specimens to determine the resulting surface roughness (Ra) values. The specimens were created in three batches (S1, S2, and S3) with n = 2 (A and B) for each batch. Scans with 50 µm × 50 µm area were acquired in ScanAssyst mode (0.100–0.25 Hz, and 512–256 samples/line) and further analyzed using Gwyddion software (version 2.41).
2.5.3. Contact Angle
Contact angle analysis was performed on the fully optimized surfaces from the AFM testing using 3 µL droplets of distilled water at ambient room temperature. Droplet images were captured using VHX digital microscopy (Keyence Corp., Osaka, Japan) and analyzed using Keyence software Version 1.2.0.2.
2.6. In Vitro Characterization
2.6.1. Cell Culture
MC3T3-E1 mouse pre-osteoblastic cells (American Type Culture Collection, Manassas, VA, USA) were maintained and expanded at 37 °C and 5% CO2 in alpha-modified Eagle’s minimum essential medium supplemented with L-glutamine, sodium pyruvate, 10% fetal bovine serum, and 1% penicillin-streptomycin, with the final pH adjusted to approximately 7.4. For experimentation, an osteogenic differentiation medium was formulated using alpha-modified Eagle’s minimum essential medium supplemented with L-glutamine and sodium pyruvate, 10% fetal bovine serum, 1% penicillin-streptomycin, 0.284 mM L-ascorbic acid, and 10 mM β-glycerophosphate. Approximately 50,000 cells/specimen were seeded and acclimatized for a day; thereafter, the specimens were supplemented with 1 mL of differentiation media every 48 h for a total of 21 days. The specimen types used for all in vitro experimentations were smooth PEEK, sfPEEK, sfPEEK-HT, with n = 3 for each testing method. The sfPEEK-HT specimen was sulfonated according to the parameters identified during the optimization experimentation detailed earlier. The smooth PEEK specimens were used as negative control in this study because it was anticipated that cells will not proliferate or readily mineralize on the smooth surface compared to the treated surface specimens.
2.6.2. Cell Viability
To assess cell viability at Day 7 and Day 21, a CyQuant™ MTT cell proliferation assay kit (ThermoFisher, Waltham, MA, USA) was used according to the manufacturer’s protocol. Each specimen was incubated with 12 mM MTT stock solution and media for 4 h, followed by solution removal and addition of DMSO. Absorbance was read at 540 nm with an ELX-800 plate reader (Winooski, VT, USA).
2.6.3. Biochemical Analysis
Cells were trypsinized and collected off each specimen at the designated time points of Days 1, 7, 14, and 21 and stored at −80 °C until use. Cells were lysed via sonication for 1 min at 10% amplitude. DNA and alkaline phosphatase (ALP) assays were performed in triplicate.
2.6.4. Cell Proliferation
A CyQuant™ DNA cell proliferation assay (ThermoFisher, Waltham, MA, USA) was used according to the manufacturer’s protocol on the lysed cells. Standard cell wells were conducted in duplicate. Fluorescence was measured at an excitation wavelength of 460 nm and emission wavelength of 520 nm on a Biotek FLx800 plate reader (Winooski, VT, USA).
2.6.5. Cell Differentiation
An alkaline phosphatase (ALP) assay was performed on the lysed cells to measure cellular differentiation. A QuantiChrom ALP assay kit (BioAssay Systems, Hayward, CA, USA) was used according to the manufacturer’s protocol at an absorbance of 405 nm on an ELX-800 plate reader.
2.6.6. Cell Mineralization
To verify mineralization of the pre-osteoblasts on each specimen, calcium deposition was visualized using Alizarin red staining via osteogenesis quantitation kit (EMD Millipore, Billerica, MA, USA) according to the manufacturer’s protocol. A control specimen containing no cells for each specimen type was analyzed as well. A VHX digital microscope was used to image the mineralized staining.
2.7. Statistical Analysis
Welch ANOVA (α = 0.05) was used to determine any differences among the specimen groups in terms of pore size measurement, AFM, contact angle, mechanical testing, and in vitro experiments. For statistical comparison among the specimen groups, a Dunnett post hoc test was performed. Normality was checked using a Shapiro–Wilk test before calculating the ANOVA. For the specimen groups with extremely large counts for pore size measurements, any slight variations in normality were ignored due to ANOVA being robust against deviations in normality, resulting in a small effect on Type I error rate. All statistical analyses were performed using GraphPad Prism Software (version 8.3.0).
3. Results
3.1. Optimized Sulfonated Surface
Measurable surface porosity was not achieved in the first few designs, leading to each experiment being scored qualitatively by visually examining the surface and determining which surface experienced changes, such as the porosity present, similar porosity distribution across the surface, and an even sulfonated surface texture. The parameters from the most visually desirable surfaces on the specimen(s) from each design were chosen, and subsequent designs were built around those factors until a fully optimized surface was attained. Contact angle analysis and surface roughness were only measured on the fully optimized surfaces, since those properties were secondary to attaining ideal porosity for this study. Each design had specimens sulfonated in random order to avoid any nuisance factors. Original non-treated PEEK has a yellowish-brown appearance in color, and once sulfonated, the surface appears white, but due to differences in lighting with the digital microscope and different surface features present on the specimens, all images were collected in the black and white color mode for pore measurements. An optimal soak time of 1 min and a soak temperature of 65 °C were determined from Design #5, but the optimal soak condition was still under investigation. Additionally, it was discovered that blasting the sulfonated surface with compressed air allowed the removal of sulfuric acid while preserving the porosity, which formed during sulfonation.
Design #6 was performed with the ideal time and temperature identified from Design #5 but with the soak condition of sonication only and sonication plus stirring under investigation. The results from this design showed similar pore surface coverage, pore count, and pore diameter, as shown in Table 3. Since similar results were obtained across the specimen types, the authors chose to move forward with in vitro studies using the sonication-only method, since this was more controllable, and using stirring would have required further refinement in terms of stirring speed and specimen location within the stirring vortex. Figure 3 below shows the specimens from Design #6 sulfonated with sonication only, and the images shown were enhanced in black and white for easier identification of the pores using ImageJ software. Ultimately, the optimized sulfonation parameters were a pre-surface condition using a 320-grit grinding paper, sonication-only soak method, soak time of 1 min, and soak temperature of 65 °C.
3.2. Hydrothermal Treatment
Specimens were prepared according to the Design #6 sample type configurations for the first hydrothermal treatment (HT) experiment (Design #1). The experiment was designed around a soak time low of 60 min and high of 90 min, and a soak temperature low of 45 °C and high of 80 °C, as listed in Table 2. Digital imaging of the specimens before and after HT showed no evidence of changing surface features, indicating that the HT only removes residual sulfocompound groups and does not change surface morphology. Fourier transform infrared spectroscopy (FTIR) was performed on each sample to identify the functional groups of interest. The spectra for samples from the hydrothermal treatment Design #1 are shown in Figure 4a. In Figure 4 graphs, sfPEEK refers to the positive control specimen, which is sulfonated PEEK without hydrothermal treatment, and H6 and sfPEEK—1 h HT both have the hydrothermal treatment parameters. The specimen labeled PEEK is the negative control, comprising untreated PEEK. In Figure 4a, there is a large, broad peak around 3400 cm−1 on the sfPEEK specimen, indicating the presence of the residual -SO3H group, and another peak at approximately 1070–1100 cm−1, which represents O=S=O stretching. The other specimen types in Figure 4a exhibit decreasing intensities of the peaks at 3400 and 1070 cm−1. These data suggest that the removal of residual sulfur groups is more dependent upon time rather than temperature. Therefore, it was decided by the authors to move forward in Design #2 with 45 °C and simply adjust the time and investigate the time points of 2, 3, 4, and 5 h, as shown in Table 2. The FTIR data from the hydrothermal treatment Design #2 are shown in Figure 4b–d. The 2 h and 4 h time points were removed to better visualize the results and not overcrowd the graphs. Figure 4c shows all the results from Figure 4b on the same baseline, and Figure 4d is an enlarged portion of Figure 4b. Figure 4b–d reveal no peak in the 3400 cm−1 range and no peak in the 1070 cm−1 range on the untreated PEEK specimen, which is what is expected, given the peaks shown on the sfPEEK specimen. The data in Figure 4a–c show lower intensities of the peaks of interest, but similar values are noted for the specimen at 1, 3, and 5 h, suggesting that a hydrothermal treatment performed at 45 °C in the range of 1–5 h would be sufficient for reducing residual sulfur compound groups.
3.3. Atomic Force Microscopy
The surface roughness of the sulfonated PEEK specimens is very tortuous, with varying degrees of topography, as can be seen in the wide range of roughness values shown in Figure 5a. However, across each specimen, there was no significant difference in the mean roughness values, which were 0.298 ± 0.108 µm, 0.308 ± 0.042 µm, 0.592 ± 0.231 µm, 0.671 ± 0.089 µm, 0.538 ± 0.337 µm, and 0.440 ± 0.143 µm for specimens S1-A–S3-B. There were 15 different statistical comparisons for these specimens, and each had a p < 0.05, indicating no significant difference.
3.4. Contact Angle Analysis
Figure 5b shows that all specimens recorded hydrophilic contact angles below 90°, and there was no significant difference among the specimens. All 15 specimen comparisons had a p < 0.05, indicating no significance. The lowest recorded mean was 59.62°, and the highest was 71.47°.
3.5. In Vitro Evaluation
3.5.1. Cell Viability
To assess cell viability, an MTT assay was performed on the cultured specimens after 7 and 21 days. Figure 6 shows significantly higher cell viability for PEEK specimens over sfPEEK (p-value ≤ 0.0001) and sfPEEK-HT (p-value ≤ 0.0001) after Day 7, and for PEEK specimens over sfPEEK (p-value ≤ 0.0001) and sfPEEK-HT (p-value = 0.0024) on Day 21. The sfPEEK-HT specimen had higher viability compared to sfPEEK on Day 7 (p-value = 0.0017) and on Day 21 (p-value = 0.0001).
3.5.2. Cell Proliferation and Differentiation
Cell proliferation and differentiation on Days 1, 7, 14, and 21 were measured using a DNA and ALP assay kit, respectively. Figure 7a shows increasing cell proliferation for all specimens across each time point. Significantly more DNA content was measured for sfPEEK-HT on Day 7 (p-value ≤ 0.0001), Day 14 (p-value = 0.0029), and Day 21 (p-value = 0.0301) compared to PEEK, and significantly more DNA was measured for sfPEEK-HT on Day 7 (p-value ≤ 0.0001), Day 14 (p-value ≤ 0.0001), and Day 21 (p-value = 0.0136) compared to sfPEEK. Both sfPEEK and sfPEEK-HT had significantly higher cell proliferation than PEEK on Day 1 (p-value ≤ 0.0001). However, PEEK had significantly higher values on Day 14 compared to sfPEEK (p-value = 0.0011). Figure 7b shows low ALP activity on Day 1 for all specimens, but then, a large increase in ALP activity for all specimens occurs by Day 7. PEEK (p-value = 0.0072) and sfPEEK (p-value ≤ 0.0001) have significantly higher ALP activity than sfPEEK-HT on Day 7. Additionally, PEEK (p-value = 0.0063) and sfPEEK (p-value ≤ 0.0001) have significantly higher ALP activity on Day 14 compared to sfPEEK-HT. ALP activity by Day 21 is still significantly higher for sfPEEK compared to the other two specimen types: PEEK (p-value = 0.0337) and sPEEK-HT (p-value = 0.0005).
3.5.3. Cell Mineralization
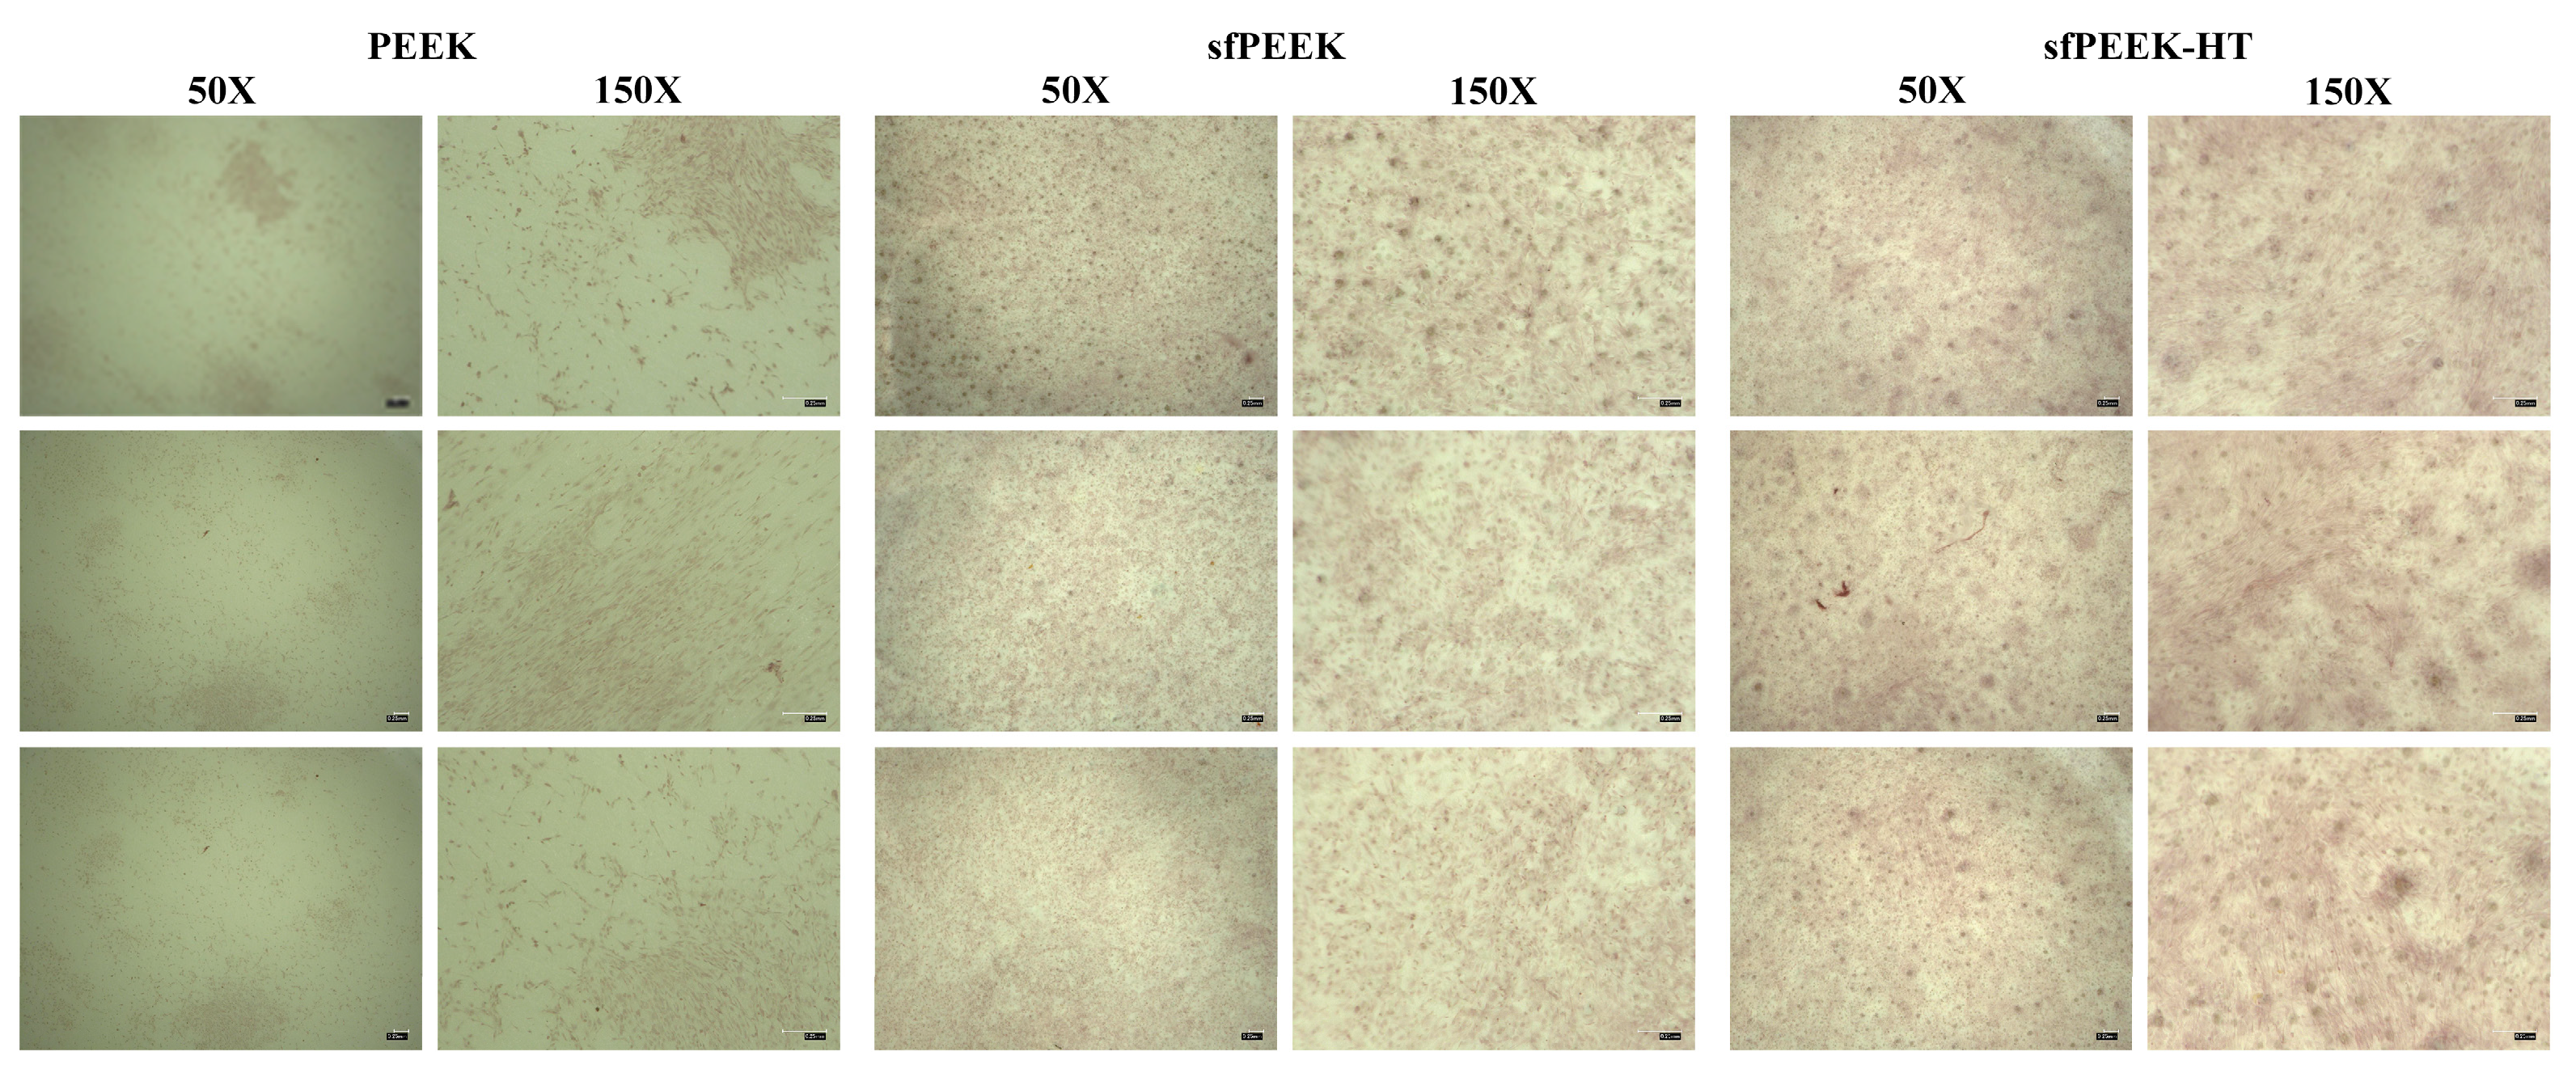
The Alizarin red staining technique and subsequent digital imaging were performed to determine whether the osteoblast cells matured and mineralized on the different specimen surfaces. Controls were used to verify that the surfaces did not uptake any of the red stain and interfere with cell identification. Alizarin red stains calcium deposits from mature osteoblasts in red. Figure 8 shows some red stained cells present on the PEEK specimens and copious amounts of red for the sfPEEK and sfPEEK-HT specimen types. This indicates more overall cell differentiation and mineralization for the sfPEEK and sfPEEK-HT specimen types compared to PEEK.
4. Discussion
The data from this study conclude that pore size and distribution may be optimized by varying the sulfonation processing factors. The most critical factors for sulfonation of PEEK are soak time, soak temperature, soak condition, and post-soak cleaning. The optimal sulfonated surface was achieved using a soak time of 1 min and a soak temperature of 65 °C. It was also determined that the best soak condition is either sonication or sonication with stirring. However, since the data of specimens with sonication only versus sonication with stirring were similar, a more efficient and controllable sulfonation process would be to use sonication only as the soak condition. Using air to blast away sulfuric acid before rinsing is the best method to clean the specimens after sulfuric acid soak.
These factors resulted in pores on the sfPEEK surface ranging from 85 to 108 µm in average size, which is in the 100–400 µm pore size range, which is conducive to osteoblast attachment and growth, which will lead to ultimately successful osseointegration [7,30]. Wan et al. studied the biomineralization ability of sulfonated PEEK with pore sizes ranging from 4.5 to 18.5 µm [46]. The research group concluded that a sulfonated PEEK with a low sulfur concentration and an average pore size of 6–14 µm had significantly higher amounts of cell adhesion and proliferation compared to untreated PEEK [46]. Another study performed by Wang et al. compared sulfonated PEEK specimen to sulfonated PEEK specimen coated with strontium and adiponectin [21]. The authors of this study showed no significant difference in cell viability for the specimen types after 5 days, no significant difference in ALP activity after 7 days, and no significant difference in the osteogenic related gene expression of Type I collagen, Runx2, or OPN [21]. However, Wang et al. did observe that the strontium and adiponectin specimen did have higher ALP activity and mineralization after Day 14, but this does not discredit the sulfonated-only PEEK, as it performed relatively well with no additional bioactive factors added [21].
The porosity distribution across the surfaces of sulfonated PEEK was visually well dispersed, as shown in Figure 3. Specimen types varied statistically when observing the pore sizes as a whole and in the 0–150 µm range. However, when the pore size range was narrowed to a range between 151 and 400 µm, there were no significant differences among the sulfonated PEEK specimens. Deviations in the total pore size averages most likely resulted from large pore size outliers or outliers caused by shadowing issues in ImageJ. Similar sizes between 151 and 400 µm are important because a pore size of at least 100 µm is considered a major influencing factor in enhancing osteogenesis [8,24]. Furthermore, the natural structure of cortical bone ranges in pore size from 10 to 500 µm, and the size of cancellous bone pores ranges from 0.2 to 1 mm [27,38]. Civantos et al. studied the osteointegration behavior of specimens with varying pore sizes of 100–200 µm, 250–355 µm, and 355–500 µm on titanium surfaces [7]. The researchers showed that there was no significant difference across the different sized porous specimens; however, all porous specimens had higher levels of ALP expression and calcium deposits compared to non-porous specimens [7]. Murphy et al. used MC3T3-E1 cells to experiment on scaffolds with mean pore sizes ranging from 85 µm to 325 µm to determine which pore size resulted in improved cell adhesion [30]. The authors showed that the initial cell attachment was approximately 62% for 325 µm pore sizes after 24 h and 48 h time points, and cell attachment for 120 µm sized pores was 45% after 24 h and 48 h [30]. No significant difference was found in cell attachment for the 85 µm, 164 µm, and 190 µm pore sized scaffolds, and the authors concluded that larger pore sizes lead to more overall cell infiltration, while smaller pore sizes have initially higher cell attachment [30].
The hydrothermal treatment experiments suggested that soaking sfPEEK in distilled water at 45 °C creates surfaces conducive to cellular growth. A study conducted by Ouyang et al. hydrothermally treated sulfonated PEEK specimens at 25 °C and 120 °C for 4 h, respectively. The EDS results showed a lower detection of sulfur content for the 120 °C treated group, and the same group displayed significantly higher amounts of cell proliferation and ALP activity compared to the 25 °C group and no hydrothermal treatment group [47]. The 25 °C hydrothermal treatment conducted by the researchers showed higher cell proliferation than the no hydrothermal treatment group; however, the sulfur content remaining was still too high to significantly outperform the 120 °C group [47]. The hydrothermal treatment experiments conducted for this study ranged in temperature from 45 °C to 80 °C, showing no difference in sulfur concentration based on temperature, but instead, the most notable difference in residual sulfur content was based on soak time. This would indicate that the temperature of 45 °C chosen is adequate for removing sulfur content from the sulfonated PEEK, which will allow proper cell viability.
FTIR was performed to observe the chemical changes, which occurred on the sulfonated PEEK after hydrothermal treatment. Figure 1 and Figure 2 are displayed in the preceding section to show the general mechanism of the sulfonation and desulfonation of PEEK. A residual -SO3H group is left on the sulfonated PEEK surface, and after hydrothermal treatment, this -SO3H group is removed. On the FTIR spectrum, a broad peak representing an OH- functional group can be seen around 3400 cm−1, and a small peak around 1050 cm−1 represents S=O vibrations [42,44,48]. Figure 4 shows higher intensities of the aforementioned peaks for specimens, which were not hydrothermally treated, compared to those, which were hydrothermally treated, which indicates the success of the treatment in removing residual sulfur groups. This is further supported by the contact angle analysis in Figure 5b displaying a significantly higher contact angle for sfPEEK-HT, which would be more hydrophobic due to no OH- group from the -SO3H being present, compared to sfPEEK [45].
The AFM data (Figure 5a) confirm no significant differences among the replicates, with average Ra values ranging from 0.298 to 0.671 µm. This changing topography indicates the presence of micro- and submicro-structures, which are texturing the surface. Loose definitions of macro-, micro-, submicro-, and nano-scale topography are present in the literature, but typically, the scale is less than 1 mm, 100 µm, 1 µm, and 100 nm, respectively [25,28,29]. This roughening of the PEEK surface following sulfonation is conducive to osteoblast adhesion, proliferation, and mechanical interlocking. Three specimen types with average surface roughness (Ra) values of 0.6 µm, 1.5 µm, and 0.5 µm for machined (MA), micro- (MACRO), and nano- (NANO) surfaces, respectively, were studied by Salou et al. to determine osseointegration capabilities using in vivo animal experimentation [37]. The researchers noted that after 4 weeks of implantation, the NANO surfaces showed higher performance values for pull-out force testing and bone growth compared to the MACRO and MA surfaces [37]. The contact angle analysis for this current study shown in Figure 5b shows no significant differences among the replicates. These data observed for the independent replicates give the authors confidence that the sulfonation process used for this study is repeatable.
The MTT testing in Figure 6 revealed PEEK specimens to have overall more viability compared to the other two specimen types for Day 7 and Day 21. Additionally, the sfPEEK-HT specimen had significantly higher viability than sfPEEK over the 21 days. However, PEEK and sfPEEK-HT generally show high levels of viability, and the viability of sfPEEK increases from Day 7 to Day 21, which could indicate the possible removal of residual sulfur groups over the testing period, resulting in a more favorable cell environment. The increase in viability coincides with the increase in DNA content on all specimen surfaces seen across Days 1, 7, 14, and 21 (Figure 7a). The DNA assay is performed to represent cell proliferation, while the ALP assay is performed to observe early osteoblast differentiation. Overall, sfPEEK-HT has the most significant and highest increase in DNA content over the course of the 21 days, indicating the highest cell proliferation and presence for that surface. The lower values of DNA content seen for the sfPEEK specimens could indicate that the cells on that surface have switched from proliferation to differentiation because the ALP activity for sfPEEK on Day 7 is significantly higher than sfPEEK-HT and significantly higher than PEEK and sfPEEK-HT on Days 14 and 21.
The mineralization seen in the Alizarin red staining in Figure 8 further confirms the switch from proliferation to differentiation, which occurred on the specimen surfaces, as indicated by the ALP activity in Figure 7b. Even though the PEEK specimens have a large increase in ALP activity on Day 7, which would indicate differentiation, the DNA content is low in Figure 7a compared to the other specimen types, meaning that the overall cell count on the surface could be lower, resulting in the lower overall mature osteoblast formation seen. In contrast, the sfPEEK and sfPEEK-HT surfaces have an abundant amount of red staining. Visually, it is difficult to determine whether sfPEEK or sfPEEK-HT have more mineralization; however, the DNA and ALP data suggest that cells proliferate more on sfPEEK-HT and eventually differentiate and mineralize, while the cells on sfPEEK proliferate less but differentiate more readily and subsequently mineralize.
5. Conclusions
Porosity and porosity distribution across PEEK surfaces were able to be optimized based on varying sulfonation process factors. A hydrothermal treatment was also successfully employed to reduce residual sulfur content on the sulfonated PEEK surfaces. This study concludes that the optimal sulfonation process—which will produce a PEEK surface with the desired porosity of approximately 88 µm–120 µm, reduced sulfur content for enhanced cell viability, and cell attachment—includes an acid soak time of 1 min and a soak temperature of 65 °C. This process is followed by quick bursts of air to remove the acid and a subsequent hydrothermal treatment at 45 °C for approximately 2.5 h. After the treatments, the resulting micro-scale and nano-scale features are similar across the surfaces, as indicated by AFM roughness measurements and contact angles. FTIR and contact angle analyses were performed to confirm successful hydrothermal treatment of the sulfonated and heat-treated PEEK specimens. Successful removal of the functional groups OH- and -SO3H, which are indicative of residual sulfur groups, was shown on the FTIR spectrum after specimens were hydrothermally treated. The contact angles went back to being more hydrophobic after hydrothermal treatment. In vitro experimentation proved the successful attachment and proliferation of MC3T3-E1 cells on each specimen type. Smooth PEEK had overall higher cell viability, followed by sulfonated and heat-treated PEEK. The sulfonated and heat-treated PEEK had significantly higher cell proliferation compared to smooth PEEK and sulfonated-only PEEK across all time points, indicating a favorable environment for the cells. ALP activity indicates early differentiation of the cells on smooth PEEK and sulfonated-only PEEK taking place on Day 7, while the sulfonated and heat-treated PEEK have a sustained period of differentiation due to the high amount of cell proliferation occurring. Maturation and mineralization of the osteoblast cells occurred on all specimen types, with sulfonated-only PEEK and sulfonated and heat-treated PEEK having the highest amount. Future testing should be conducted to determine sulfonated and heat-treated PEEK’s ability to have enhanced osseointegration in vivo, but overall, it can be suggested that the optimized sulfonated and heat-treated PEEK would have superior performance over smooth PEEK and sulfonated-only PEEK due to its porosity, high cell proliferation, and mineralization performance.
Author Contributions
Conceptualization, K.N., A.V.J. and R.S.W.; methodology, K.N., A.V.J., M.D.R., L.W. and R.S.W.; formal analysis, K.N.; investigation, K.N., A.V.J. and R.S.W.; resources, L.W. and R.S.W.; data curation, K.N.; writing—original draft preparation, K.N.; writing—review and editing, A.V.J., M.D.R., L.W. and R.S.W.; visualization, K.N. and R.S.W.; supervision, R.S.W.; project administration, R.S.W.; funding acquisition, R.S.W. All authors have read and agreed to the published version of the manuscript.
Funding
This research was funded by Zavation Medical Products, LLC. Flowood, MS, USA, 39232, grant number SP14350.
Institutional Review Board Statement
Not applicable.
Informed Consent Statement
Not applicable.
Data Availability Statement
The data presented in this study are available on request from the corresponding author due to patent pending.
Conflicts of Interest
Authors Kadie Nobles, Amol V. Janorkar, and R. Scott Williamson have a patent pending with the technology (Provisional Patent #63523624, “Sulfonation Treatment of Medical and Dental Implants”; Inventors: R. Scott Williamson, PhD, UMMC, Amol V. Janorkar, PhD, UMMC, an.d Kadie Nobles, PhD, Institute of Defense Analysis (Washington, DC, former UMMC PhD under R. Scott Williamson); Filing Date of 27 June 2023. The specific aspects of the patent are the sulfonation process and hydrothermal process for the Poly Aryl family of polymers for medical and dental applications). Author Lawrence Walker is an employee of Zavation Medical Products, LLC, who sponsored the research for this project (Kadie Nobles, PhD, Dissertation; Author R. Scott Williamson received grant funding for this project from Zavation Medical Products, LLC. Author Michael D. Roach declares no conflicts of interest).
References
- Watkins-Castillo, S.; Andersson, G. United States Bone and Joint Initiative: The Burden of Musculoskeletal Dieseases in the United States (BMUSA). 2014. Available online: http://www.boneandjointburden.org (accessed on 21 March 2024).
- Afewerki, S.; Bassous, N.; Harb, S.; Palo-Nieto, C.; Ruiz-Esparza, G.U.; Marciano, F.R.; Webster, T.J.; Furtado, A.S.A.; Lobo, A.O. Advances in dual functional antimicrobial and osteoinductive biomaterials for orthopaedic applications. Nanomed. Nanotechnol. Biol. Med. 2020, 24, 102143. [Google Scholar] [CrossRef]
- Bozic, K.J.; Kurtz, S.M.; Lau, E.; Ong, K.; Chiu, V.; Vail, T.P.; Rubash, H.E.; Berry, D.J. The epidemiology of revision total knee arthroplasty in the United States. Clin. Orthop. Relat. Res. 2010, 468, 45–51. [Google Scholar] [CrossRef]
- Landgraeber, S.; Jäger, M.; Jacobs, J.J.; Hallab, N.J. The pathology of orthopedic implant failure is mediated by innate immune system cytokines. Mediat. Inflamm. 2014, 2014, 185150. [Google Scholar] [CrossRef]
- Raphel, J.; Holodniy, M.; Goodman, S.B.; Heilshorn, S.C. Multifunctional coatings to simultaneously promote osseointegration and prevent infection of orthopaedic implants. Biomaterials 2016, 84, 301–314. [Google Scholar] [CrossRef] [PubMed]
- Parithimarkalaignan, S.; Padmanabhan, T.V. Osseointegration: An update. J. Indian Prosthodont. Soc. 2013, 13, 2–6. [Google Scholar] [CrossRef] [PubMed]
- Civantos, A.; Domínguez, C.; Pino, R.J.; Setti, G.; Pavón, J.J.; Martínez-Campos, E.; Garcia, F.J.G.; Rodríguez, J.A.; Allain, J.P.; Torres, Y. Designing bioactive porous titanium interfaces to balance mechanical properties and in vitro cells behavior towards increased osseointegration. Surf. Coat. Technol. 2019, 368, 162–174. [Google Scholar] [CrossRef]
- Zheng, J.-P.; Chen, L.-J.; Chen, D.-Y.; Shao, C.-S.; Yi, M.-F.; Zhang, B. Effects of pore size and porosity of surface-modified porous titanium implants on bone tissue ingrowth. Trans. Nonferr. Met. Soc. China 2019, 29, 2534–2545. [Google Scholar] [CrossRef]
- Hahn, B.-D.; Park, D.-S.; Choi, J.-J.; Ryu, J.; Yoon, W.-H.; Choi, J.-H.; Kim, J.-W.; Ahn, C.-W.; Kim, H.-E.; Yoon, B.-H.; et al. Osteoconductive hydroxyapatite coated PEEK for spinal fusion surgery. Appl. Surf. Sci. 2013, 283, 6–11. [Google Scholar] [CrossRef]
- Kurtz, S.M.; Devine, J.N. PEEK biomaterials in trauma, orthopedic, and spinal implants. Biomaterials 2007, 28, 4845–4869. [Google Scholar] [CrossRef]
- Mahjoubi, H.; Buck, E.; Manimunda, P.; Farivar, R.; Chromik, R.; Murshed, M.; Cerruti, M. Surface phosphonation enhances hydroxyapatite coating adhesion on polyetheretherketone and its osseointegration potential. Acta Biomater. 2017, 47, 149–158. [Google Scholar] [CrossRef]
- Mishra, S.; Chowdhary, R. PEEK materials as an alternative to titanium in dental implants: A systematic review. Clin. Implant. Dent. Relat. Res. 2019, 21, 208–222. [Google Scholar] [CrossRef] [PubMed]
- Zhang, J.; Tian, W.; Chen, J.; Yu, J.; Zhang, J.; Chen, J. The application of polyetheretherketone (PEEK) implants in cranioplasty. Brain Res. Bull. 2019, 153, 143–149. [Google Scholar] [CrossRef] [PubMed]
- Evans, N.T.; Torstrick, F.B.; Lee, C.S.; Dupont, K.M.; Safranski, D.L.; Chang, W.A.; Macedo, A.E.; Lin, A.S.; Boothby, J.M.; Whittingslow, D.C.; et al. High-strength, surface-porous polyether-ether-ketone for load-bearing orthopedic implants. Acta Biomater. 2015, 13, 159–167. [Google Scholar] [CrossRef] [PubMed]
- Kaur, M.; Singh, K. Review on titanium and titanium based alloys as biomaterials for orthopaedic applications. Mater. Sci. Eng. C 2019, 102, 844–862. [Google Scholar] [CrossRef] [PubMed]
- Li, J.; Qin, L.; Yang, K.; Ma, Z.; Wang, Y.; Cheng, L.; Zhao, D. Materials evolution of bone plates for internal fixation of bone fractures: A review. J. Mater. Sci. Technol. 2020, 36, 190–208. [Google Scholar] [CrossRef]
- Murr, L.E.; Gaytan, S.M.; Medina, F.; Lopez, H.; Martinez, E.; Machado, B.I.; Hernandez, D.H.; Martinez, L.; Lopez, M.I.; Wicker, R.B.; et al. Next-generation biomedical implants using additive manufacturing of complex, cellular and functional mesh arrays. Philos. Trans. A Math Phys. Eng. Sci. 2010, 368, 1999–2032. [Google Scholar] [CrossRef]
- Wang, X.; Xu, S.; Zhou, S.; Xu, W.; Leary, M.; Choong, P.; Qian, M.; Brandt, M.; Xie, Y.M. Topological design and additive manufacturing of porous metals for bone scaffolds and orthopaedic implants: A review. Biomterials 2016, 83, 127–141. [Google Scholar] [CrossRef] [PubMed]
- Liu, X.; Han, F.; Zhao, P.; Lin, C.; Wen, X.; Ye, X. Layer-by-layer self-assembled multilayers on PEEK implants improve osseointegration in an osteoporosis rabbit model. Nanomedicine 2017, 13, 1423–1433. [Google Scholar] [CrossRef]
- Sun, Y.; Liu, X.; Tan, J.; Lv, D.; Song, W.; Su, R.; Li, L.; Liu, X.; Ouyang, L.; Liao, Y. Strontium ranelate incorporated 3D porous sulfonated PEEK simulating MC3T3-E1 cell differentiation. Regen. Biomater. 2021, 8, rbaa043. [Google Scholar] [CrossRef]
- Wang, S.; Yang, Y.; Li, Y.; Shi, J.; Zhou, J.; Zhang, L.; Deng, Y.; Yang, W. Strontium/adiponectin co-decoration modulates the osteogenic activity of nano-morphologic polyetheretherketone implant. Colloids Surf. B Biointerfaces 2019, 176, 38–46. [Google Scholar] [CrossRef]
- Gao, C.; Wang, Z.; Jiao, Z.; Wu, Z.; Guo, M.; Wang, Y.; Liu, J.; Zhang, P. Enhancing antibacterial capability and osseointegration of polyetheretherketone (PEEK) implants by dual-functional surface modification. Mater. Des. 2021, 205, 109733. [Google Scholar] [CrossRef]
- Chen, S.; Guo, Y.; Liu, R.; Wu, S.; Fang, J.; Huang, B.; Li, Z.; Chen, Z.; Chen, Z. Tuning surface properties of bone biomaterials to manipulate osteoblastic cell adhesion and the signaling pathways for the enhancement of early osseointegration. Colloids Surf. B Biointerfaces 2018, 164, 58–69. [Google Scholar] [CrossRef]
- Necula, B.; Apachitei, I.; Fratila-Apachitei, L.; van Langelaan, E.; Duszczyk, J. Titanium bone implants with superimposed micro/nano-scale porosity and antibacterial capability. Appl. Surf. Sci. 2013, 273, 310–314. [Google Scholar] [CrossRef]
- Perez, R.A.; Mestres, G. Role of pore size and morphology in musculo-skeletal tissue regeneration. Mater. Sci. Eng. C Mater. Biol. Appl. 2016, 61, 922–939. [Google Scholar] [CrossRef] [PubMed]
- Torstrick, F.B.; Lin, A.S.; Potter, D.; Safranski, D.L.; Sulchek, T.A.; Gall, K.; Guldberg, R.E. Porous PEEK improves the bone-implant interface compared to plasma-sprayed titanium coating on PEEK. Biomaterials 2018, 185, 106–116. [Google Scholar] [CrossRef] [PubMed]
- Souza, J.C.M.; Sordi, M.B.; Kanazawa, M.; Ravindran, S.; Henriques, B.; Silva, F.S.; Aparicio, C.; Cooper, L.F. Nano-scale modification of titanium implant surfaces to enhance osseointegration. Acta Biomater. 2019, 94, 112–131. [Google Scholar] [CrossRef]
- Coelho, P.G.; Jimbo, R.; Tovar, N.; Bonfante, E.A. Osseointegration: Hierarchical designing encompassing the macrometer, micrometer, and nanometer length scales. Dent. Mater. 2015, 31, 37–52. [Google Scholar] [CrossRef]
- Gittens, R.A.; Olivares-Navarrete, R.; Schwartz, Z.; Boyan, B.D. Implant osseointegration and the role of microroughness and nanostructures: Lessons for spine implants. Acta Biomater. 2014, 10, 3363–3371. [Google Scholar] [CrossRef] [PubMed]
- Murphy, C.M.; Haugh, M.G.; O’Brien, F.J. The effect of mean pore size on cell attachment, proliferation and migration in collagen-glycosaminoglycan scaffolds for bone tissue engineering. Biomaterials 2010, 31, 461–466. [Google Scholar] [CrossRef]
- Wei, J.; Igarashi, T.; Okumori, N.; Igarashi, T.; Maetani, T.; Liu, B.; Yoshinari, M. Influence of surface wettability on competitive protein adsorption and initial attachment of osteoblasts. Biomed. Mater. 2009, 4, 045002. [Google Scholar] [CrossRef]
- Zhao, G.; Raines, A.; Wieland, M.; Schwartz, Z.; Boyan, B. Requirement for both micron- and submicron scale structure for synergistic responses of osteoblasts to substrate surface energy and topography. Biomaterials 2007, 28, 2821–2829. [Google Scholar] [CrossRef]
- Eriksson, C.; Nygren, H.; Ohlson, K. Implantation of hydrophilic and hydrophobic titanium discs in rat tibia: Cellular reactions on the surfaces during the first 3 weeks in bone. Biomaterials 2004, 25, 4759–4766. [Google Scholar] [CrossRef] [PubMed]
- Kennedy, S.B.; Washburn, N.R.; Simon, C.G., Jr.; Amis, E.J. Combinatorial screen of the effect of surface energy on fibronectin-mediated osteoblast adhesion, spreading and proliferation. Biomaterials 2006, 27, 3817–3824. [Google Scholar] [CrossRef]
- Rodriguez-Contreras, A.; Guadarrama Bello, D.; Nanci, A. Surface nanoporosity has a greater influence on osteogenic and bacterial cell adhesion than crystallinity and wettability. Appl. Surf. Sci. 2018, 445, 255–261. [Google Scholar] [CrossRef]
- Buck, E.; Li, H.; Cerruti, M. Surface Modification Strategies to Improve the Osseointegration of Poly(etheretherketone) and Its Composites. Macromol. Biosci. 2020, 20, e1900271. [Google Scholar] [CrossRef] [PubMed]
- Salou, L.; Hoornaert, A.; Louarn, G.; Layrolle, P. Enhanced osseointegration of titanium implants with nanostructured surfaces: An experimental study in rabbits. Acta Biomater. 2015, 11, 494–502. [Google Scholar] [CrossRef] [PubMed]
- Wang, F.; Shi, L.; He, W.-X.; Han, D.; Yan, Y.; Niu, Z.-Y.; Shi, S.-G. Bioinspired micro/nano fabrication on dental implant–bone interface. Appl. Surf. Sci. 2013, 265, 480–488. [Google Scholar] [CrossRef]
- Huang, R.Y.M.; Shao, P.; Burns, C.M.; Feng, X. Sulfonation of poly(ether ether ketone)(PEEK): Kinetic study and characterization. J. Appl. Polym. Sci. 2001, 82, 2651–2660. [Google Scholar] [CrossRef]
- Khomein, P.; Ketelaars, W.; Lap, T.; Liu, G. Sulfonated aromatic polymer as a future proton exchange membrane: A review of sulfonation and crosslinking methods. Renew. Sustain. Energy Rev. 2021, 137, 110471. [Google Scholar] [CrossRef]
- Zaidi, S.M.J. Polymer sulfonation—A versatile route to prepare proton-conducting membrane material for advanced technologies. Arab. J. Sci. Eng. Sect. B Eng. 2003, 28, 183–194. [Google Scholar]
- He, M.; Huang, Y.; Xu, H.; Feng, G.; Liu, L.; Li, Y.; Sun, D.; Zhang, L. Modification of polyetheretherketone implants: From enhancing bone integration to enabling multi-modal therapeutics. Acta Biomater. 2021, 129, 18–32. [Google Scholar] [CrossRef] [PubMed]
- Sun, Z.; Ouyang, L.; Ma, X.; Qiao, Y.; Liu, X. Controllable and durable release of BMP-2-loaded 3D porous sulfonated polyetheretherketone (PEEK) for osteogenic activity enhancement. Colloids Surf. B Biointerfaces 2018, 171, 668–674. [Google Scholar] [CrossRef] [PubMed]
- Wang, W.; Luo, C.J.; Huang, J.; Edirisinghe, M. PEEK surface modification by fast ambient-temperature sulfonation for bone implant applications. J. R. Soc. Interface 2019, 16, 20180955. [Google Scholar] [CrossRef]
- Zhao, Y.; Wong, H.M.; Wang, W.; Li, P.; Xu, Z.; Chong, E.Y.; Yan, C.H.; Yeung, K.W.; Chu, P.K. Cytocompatibility, osseointegration, and bioactivity of three-dimensional porous and nanostructured network on polyetheretherketone. Biomaterials 2013, 34, 9264–9277. [Google Scholar] [CrossRef] [PubMed]
- Wan, T.; Jiao, Z.; Guo, M.; Wang, Z.; Wan, Y.; Lin, K.; Liu, Q.; Zhang, P. Gaseous sulfur trioxide induced controllable sulfonation promoting biomineralization and osseointegration of polyetheretherketone implants. Bioact. Mater. 2020, 5, 1004–1017. [Google Scholar] [CrossRef] [PubMed]
- Ouyang, L.; Zhao, Y.; Jin, G.; Lu, T.; Li, J.; Qiao, Y.; Ning, C.; Zhang, X.; Chu, P.K.; Liu, X. Influence of sulfur content on bone formation and antibacterial ability of sulfonated PEEK. Biomaterials 2016, 83, 115–126. [Google Scholar] [CrossRef]
- Qin, W.; Li, Y.; Ma, J.; Liang, Q.; Cui, X.; Jia, H.; Tang, B. Osseointegration anvd biosafety of graphene oxide wrapped porous CF/PEEK composites as implantable materials: The role of surface structure and chemistry. Dent. Mater. 2020, 36, 1289–1302. [Google Scholar] [CrossRef]
Figure 1.
Chemical reaction for creating sulfonated PEEK [46].
Figure 1.
Chemical reaction for creating sulfonated PEEK [46].
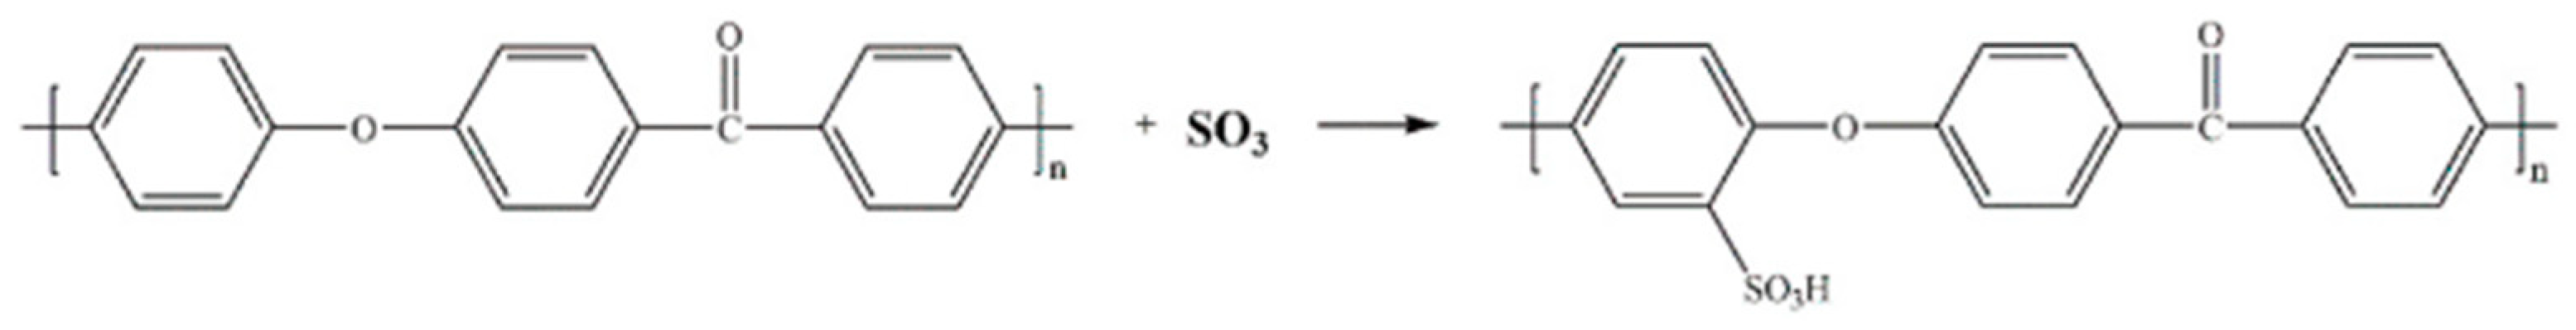
Figure 2.
Schematic representation of what happens to the residual sulfur groups during hydrothermal treatment.
Figure 2.
Schematic representation of what happens to the residual sulfur groups during hydrothermal treatment.
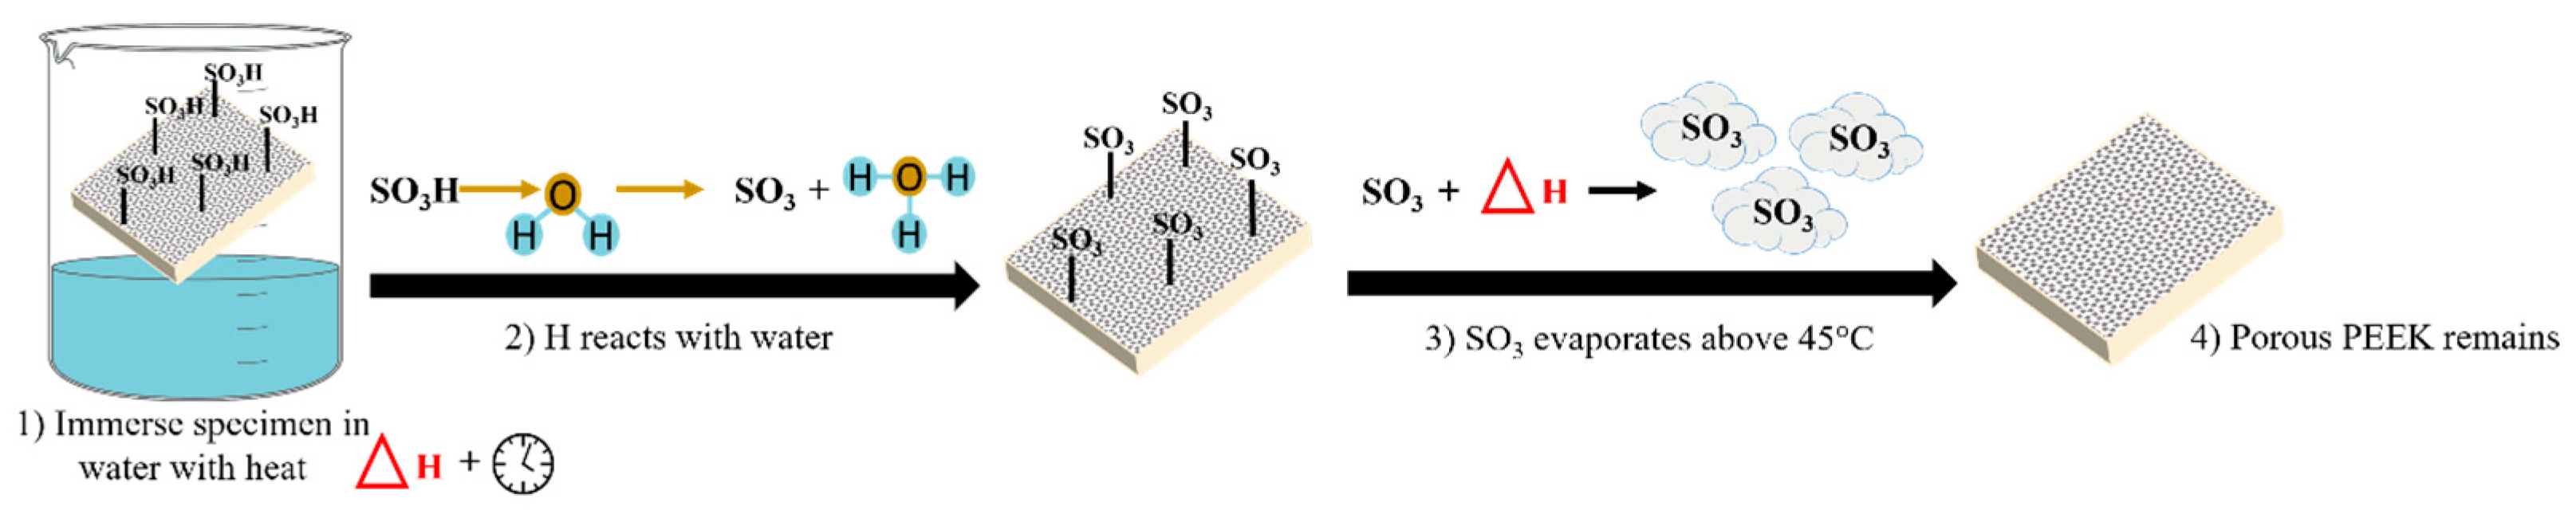
Figure 3.
Digital images of the sulfonated specimens in Design #6. The red pores outlined show which ones were identified and counted by ImageJ software.
Figure 3.
Digital images of the sulfonated specimens in Design #6. The red pores outlined show which ones were identified and counted by ImageJ software.
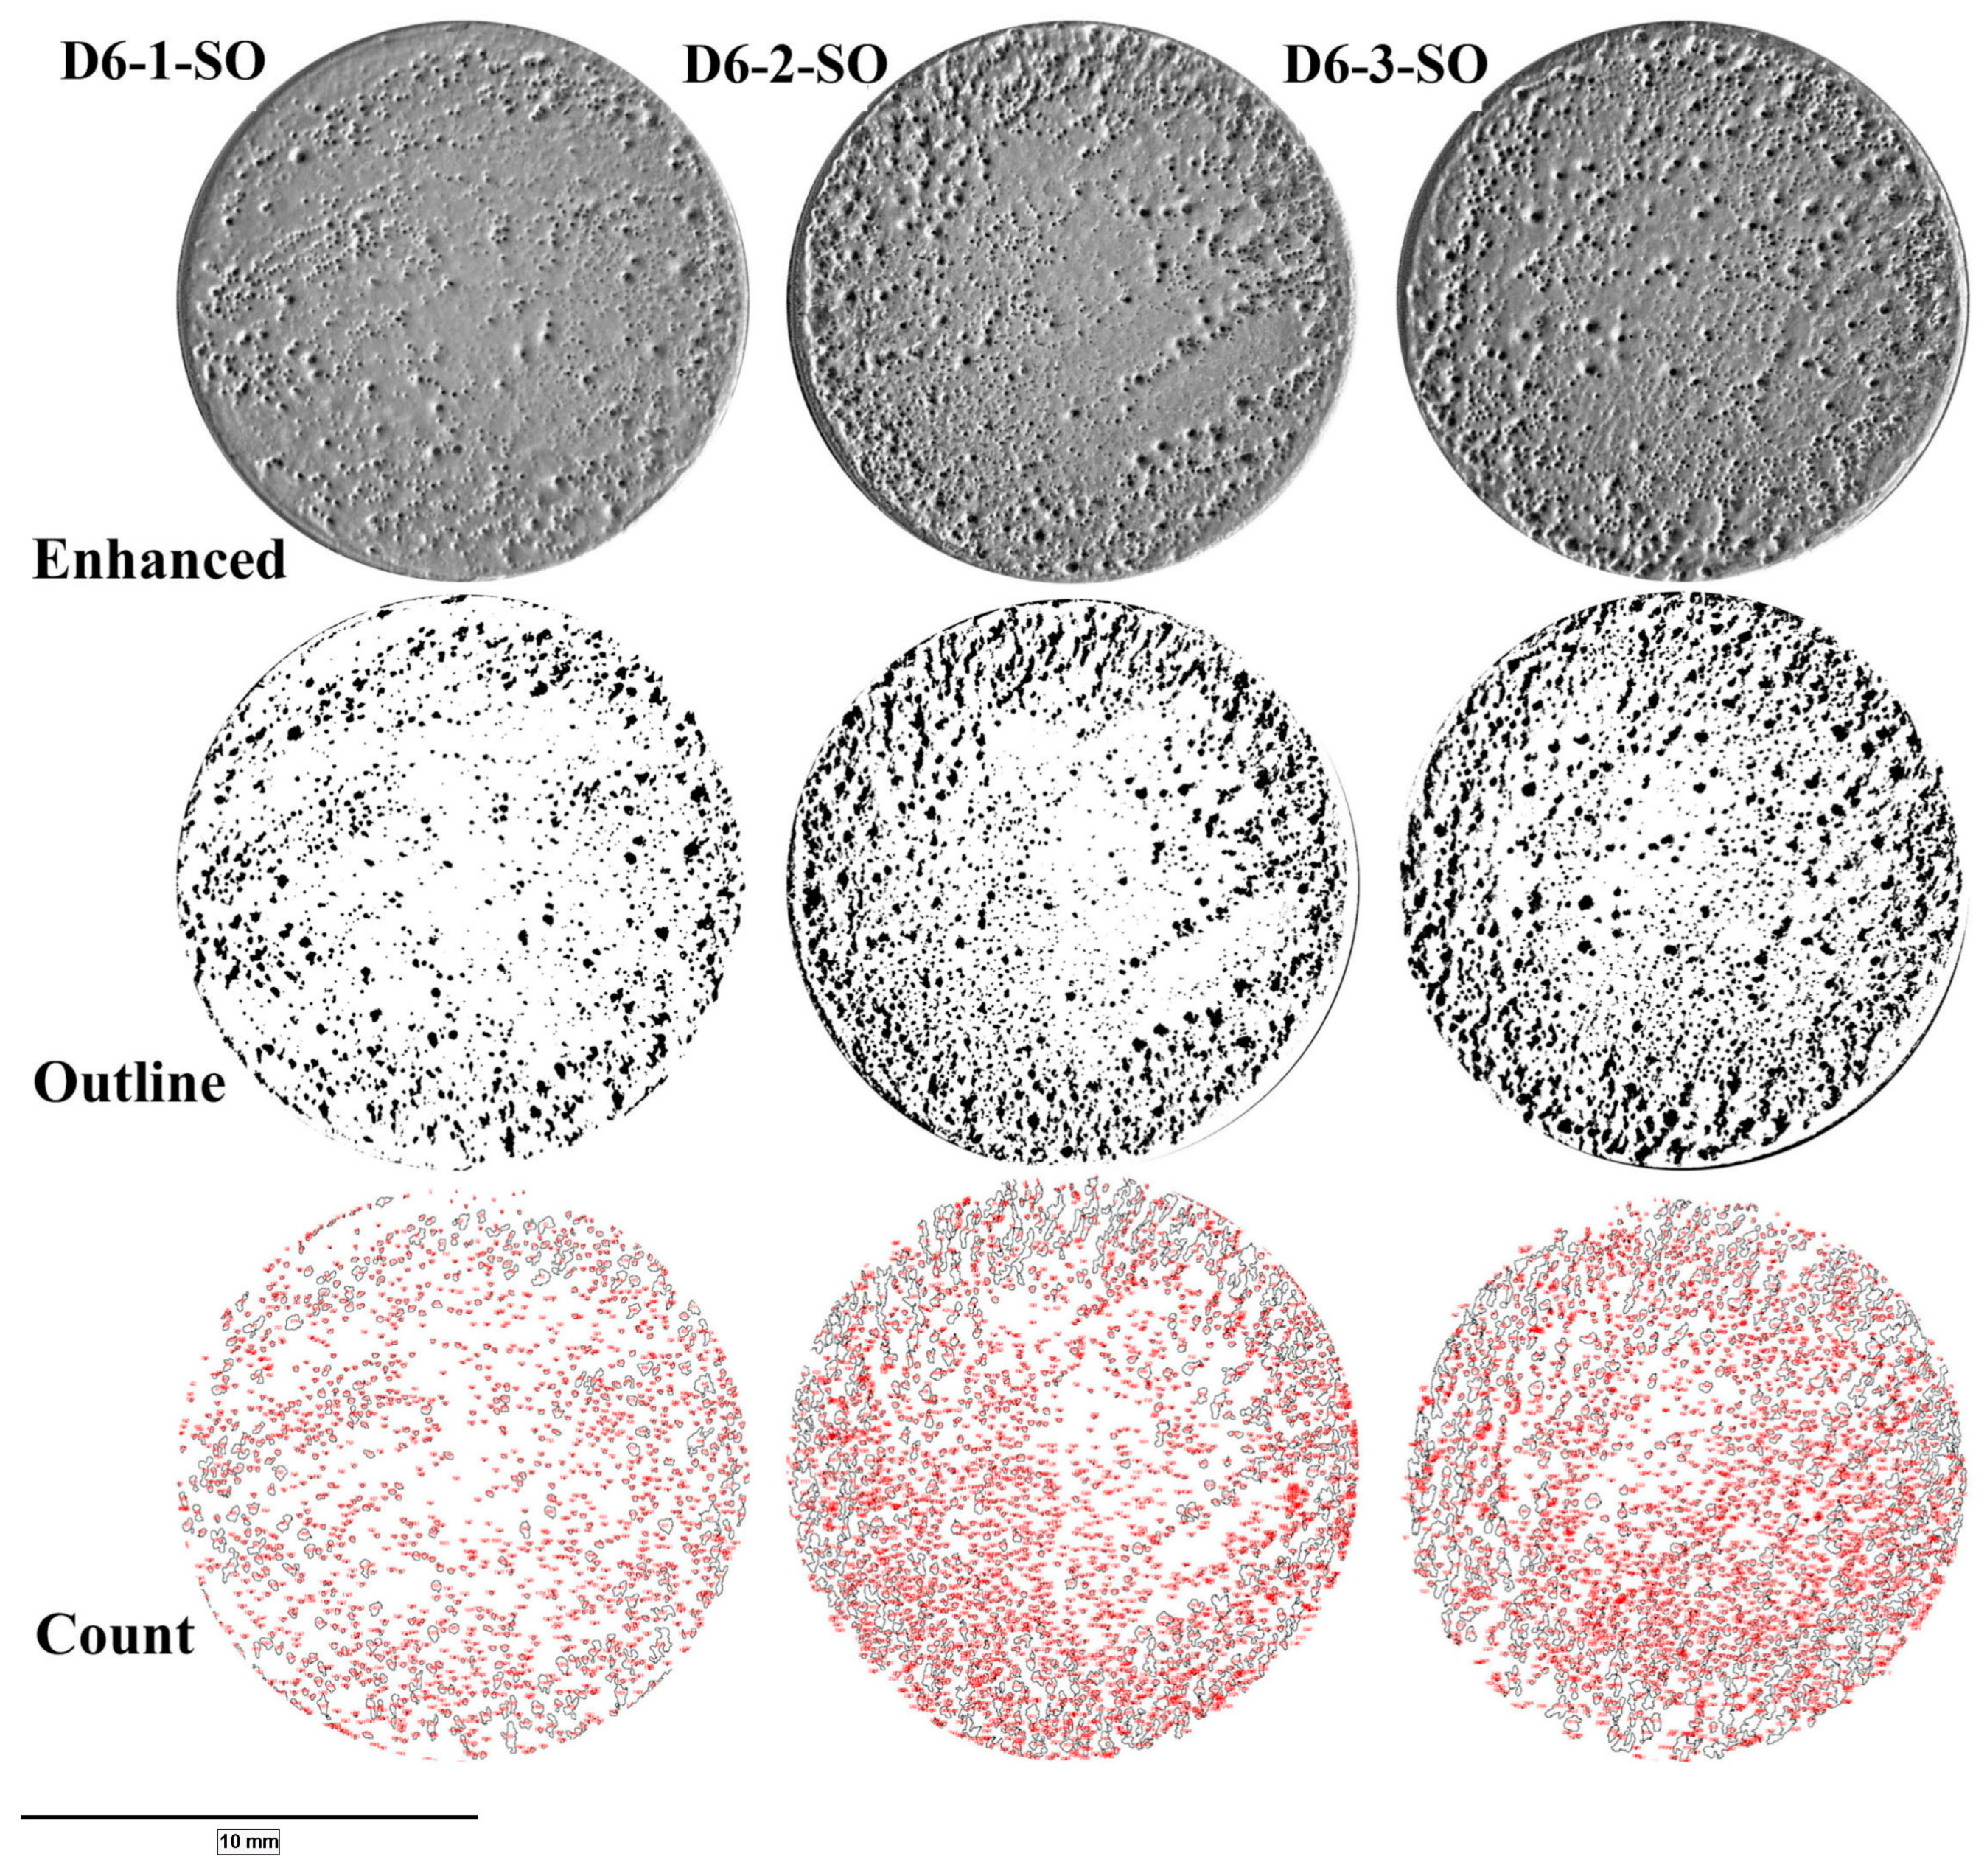
Figure 4.
(a) FTIR spectra data for hydrothermal treatment Design #1; (b) FTIR spectra data for hydrothermal treatment Design #2; (c) FTIR spectra data for Design #2 showing wavelengths of interest in the range of 500–4000 cm−1 all on the same baseline; (d) FTIR spectra data enlarged from graph (b) showing Design #2 and the wavelengths of interest in the range of 1000–1150 cm−1, which is the location of the S=O vibration peak.

Figure 5.
(a) Average roughness (Ra) values obtained using the atomic force microscope. (b) Average wetting angle obtained for each independent replicate. There were no significant differences found between any of the groups. The specimens were created in three batches (S1, S2, and S3), with n = 2 (A and B) for each batch, as further described in Section 2 earlier.
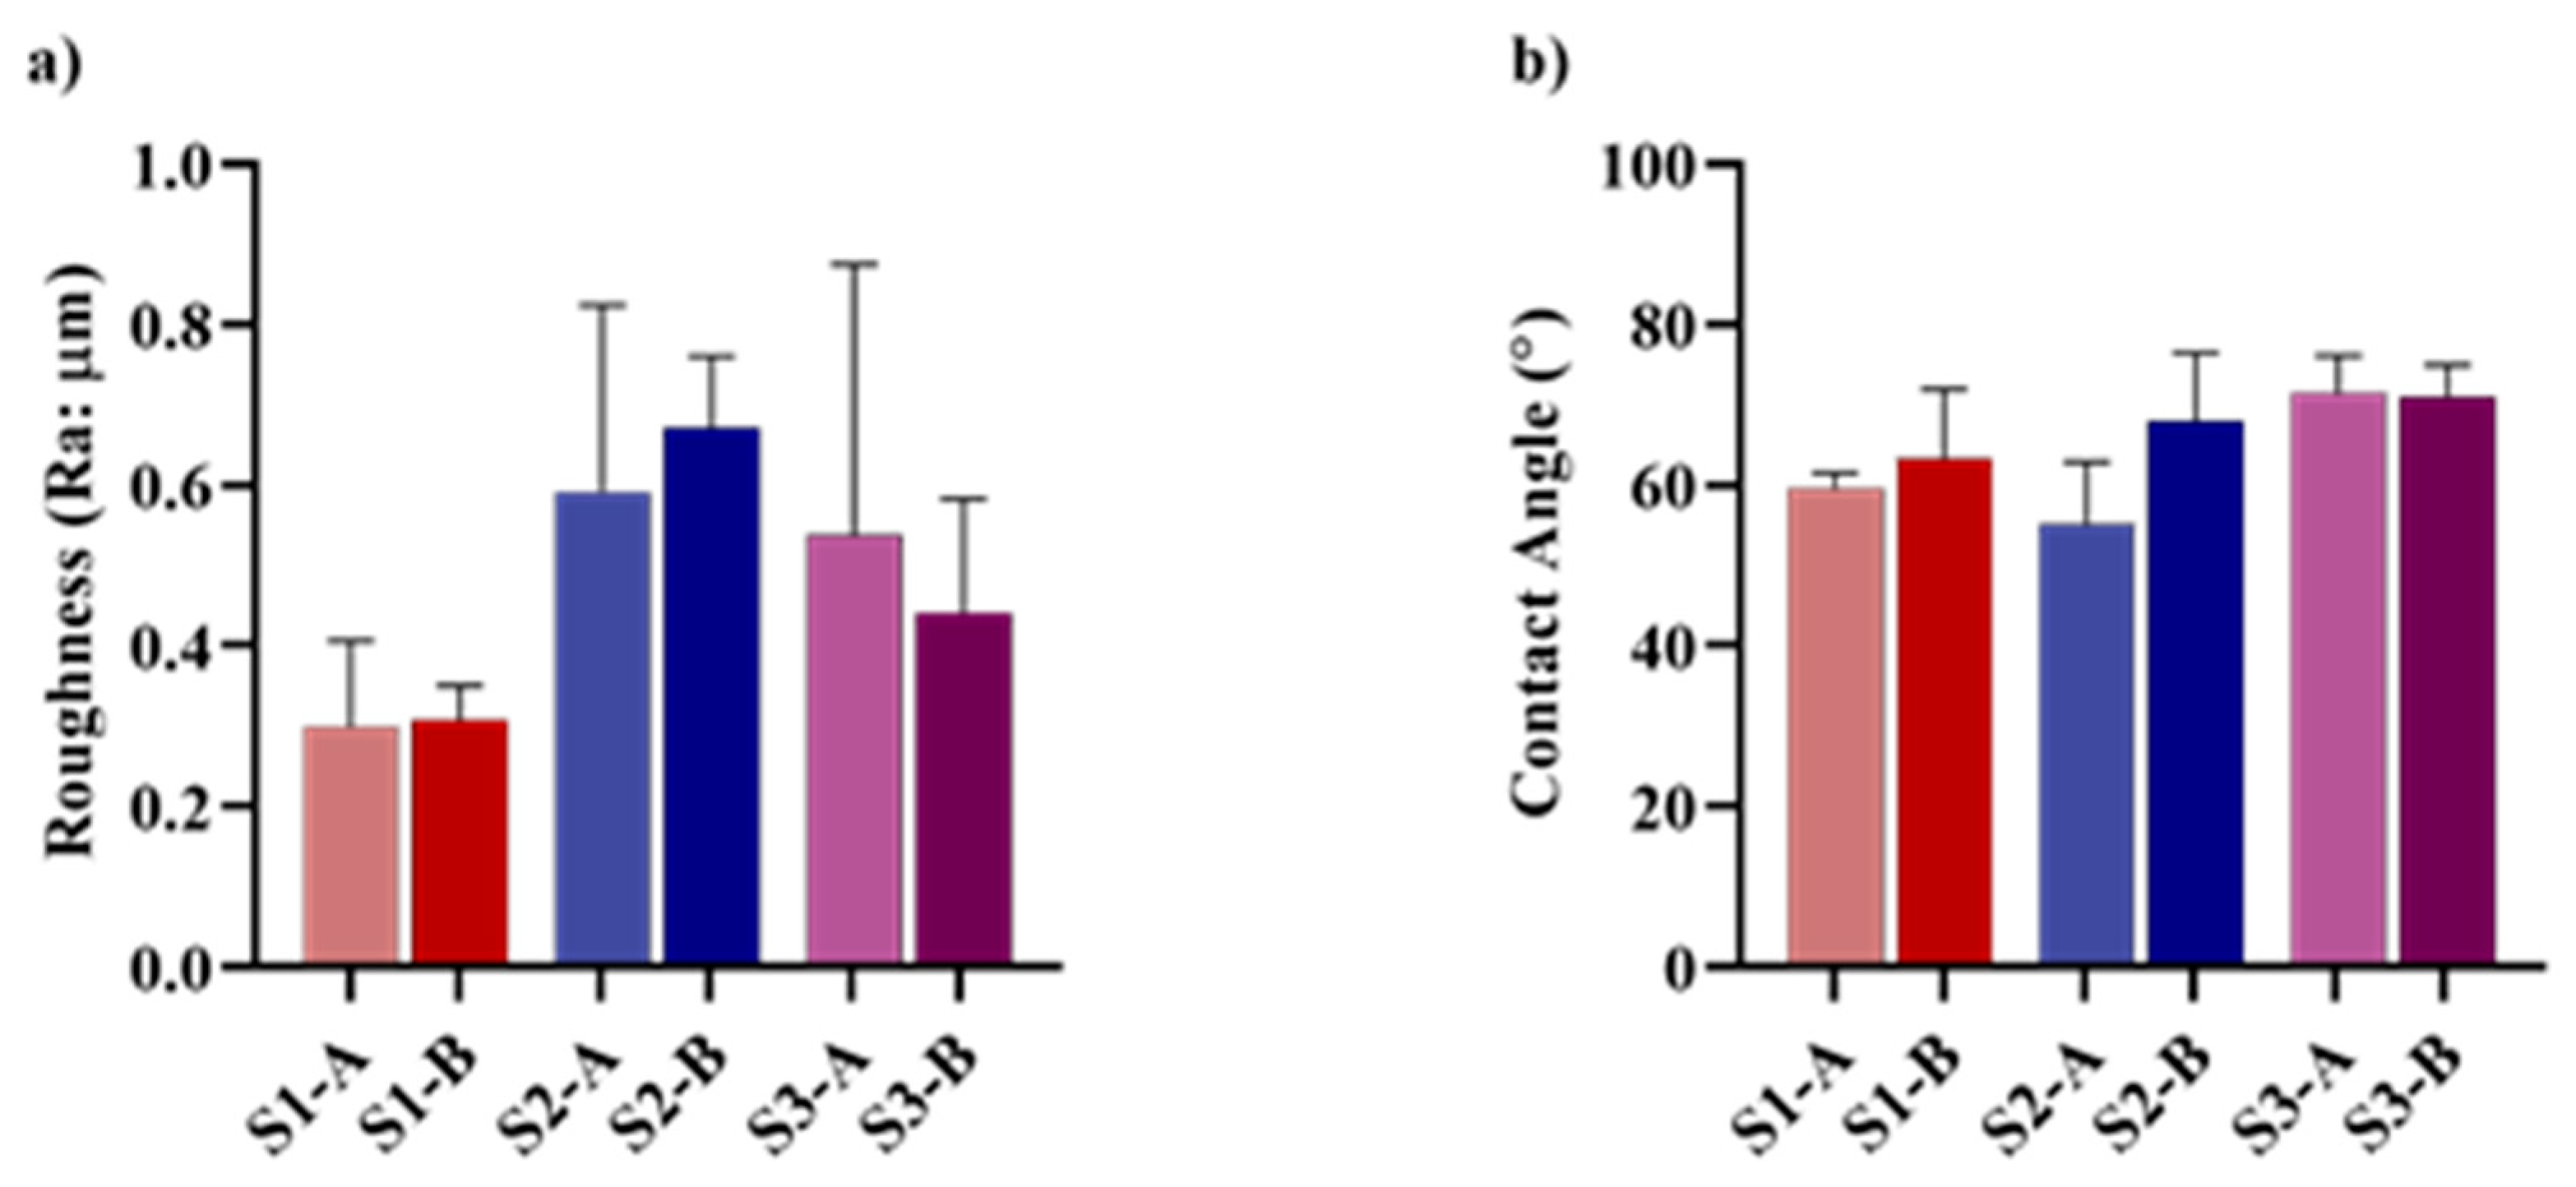
Figure 6.
Absorbance readings for cells on specimen surfaces after 7 and 21 days. The MTT assay was used. The * is compared to PEEK, and a is compared to sfPEEK; significance noted at p < 0.05.
Figure 6.
Absorbance readings for cells on specimen surfaces after 7 and 21 days. The MTT assay was used. The * is compared to PEEK, and a is compared to sfPEEK; significance noted at p < 0.05.

Figure 7.
(a) DNA results for each specimen type at the designated time point. (b) ALP results for specimens at each time point. The * is compared to PEEK, and a is compared to sfPEEK; significance noted at p < 0.05.
Figure 7.
(a) DNA results for each specimen type at the designated time point. (b) ALP results for specimens at each time point. The * is compared to PEEK, and a is compared to sfPEEK; significance noted at p < 0.05.

Figure 8.
Mineralized cells stained with Alizarin red on each specimen type. Staining was performed on n = 3 samples of each specimen type, and the example images from each specimen are shown.
Figure 8.
Mineralized cells stained with Alizarin red on each specimen type. Staining was performed on n = 3 samples of each specimen type, and the example images from each specimen are shown.

Table 1.
Factors and related levels for each design space for optimization of surface porosity.
| Design Space | Pre-Surface Condition (Grit) | Soak Condition | Acid Conc. | Soak Time (min) | Soak Temp. (°C) | |||||
|---|---|---|---|---|---|---|---|---|---|---|
| Low | High | S/NS/SO/SS | % | Low | Center | High | Low | Center | High | |
| Design #1 | 220 | 1200 | S/NS | 80–100 | 1 | - | 10 | 22 | - | 60 |
| Design #2 | 220 | - | NS | 100 | 1 | 2.5 | 4 | 50 | 65 | 80 |
| Design #3 | 220 | - | NS | 100 | 2.5 | 3.75 | 5 | 55 | 65 | 80 |
| Design #4 | 320 | - | SO | 100 | 1 | 2.5 | 5 | 55 | 60 | 65 |
| Design #5 | 320 | - | SO/SS | 100 | 1 | 1.45 | 2.5 | 55 | 60 | 65 |
| Design #6 | 320 | - | SO/SS | 100 | 1 | - | - | 65 | - | - |
Table 2.
Designs and related levels for the hydrothermal treatment experiments on the optimized sulfonated PEEK surfaces.
Table 2.
Designs and related levels for the hydrothermal treatment experiments on the optimized sulfonated PEEK surfaces.
| Specimen ID | Soak Time (min) | Soak Temp. (°C) | |
|---|---|---|---|
| Design #1 | H1 | 90 | 45 |
| H2 | 60 | 80 | |
| H3 a | 0 | 0 | |
| H4 | 75 | 63 | |
| H5 | 90 | 80 | |
| H6 b | 60 | 45 | |
| Design #2 | sfPEEK—2 h HT | 120 (2 h) | 45 |
| sfPEEK—3 h HT | 180 (3 h) | ||
| sfPEEK—4 h HT | 240 (4 h) | ||
| sfPEEK—5 h HT | 300 (5 h) |
a H3 is used as the control specimen, i.e., sulfonated PEEK without HT treatment. H3 and sfPEEK refer to the same condition when used in this paper. b The conditions used for H6 are the same as those used for sfPEEK—1 h HT in future sections.
Table 3.
Porosity data from specimens in Design #6. The diameter reported is the Feret diameter.
| Specimen ID | Pore Coverage (% Area) | Pore Count | Pore Diameter (Avg: µm) |
|---|---|---|---|
| D6-1-SS | 13 | 2124 | 103 ± 128 |
| D6-2-SS | 17 | 4179 | 88 ± 97 |
| D6-3-SS | 11 | 2531 | 94 ± 92 |
| D6-1-SO | 11 | 1574 | 120 ± 109 |
| D6-2-SO | 18 | 2558 | 115 ± 151 |
| D6-3-SO | 21 | 2671 | 118 ± 160 |
Disclaimer/Publisher’s Note: The statements, opinions and data contained in all publications are solely those of the individual author(s) and contributor(s) and not of MDPI and/or the editor(s). MDPI and/or the editor(s) disclaim responsibility for any injury to people or property resulting from any ideas, methods, instructions or products referred to in the content. |
© 2024 by the authors. Licensee MDPI, Basel, Switzerland. This article is an open access article distributed under the terms and conditions of the Creative Commons Attribution (CC BY) license (https://creativecommons.org/licenses/by/4.0/).
Share and Cite
MDPI and ACS Style
Nobles, K.; Janorkar, A.V.; Roach, M.D.; Walker, L.; Williamson, R.S. In Vitro Evaluation of Optimized PEEK Surfaces for Enhanced Osseointegration. Coatings 2024, 14, 518. https://doi.org/10.3390/coatings14050518
AMA Style
Nobles K, Janorkar AV, Roach MD, Walker L, Williamson RS. In Vitro Evaluation of Optimized PEEK Surfaces for Enhanced Osseointegration. Coatings. 2024; 14(5):518. https://doi.org/10.3390/coatings14050518
Chicago/Turabian StyleNobles, Kadie, Amol V. Janorkar, Michael D. Roach, Lawrence Walker, and Randall Scott Williamson. 2024. "In Vitro Evaluation of Optimized PEEK Surfaces for Enhanced Osseointegration" Coatings 14, no. 5: 518. https://doi.org/10.3390/coatings14050518
Note that from the first issue of 2016, this journal uses article numbers instead of page numbers. See further details here.