Article

An Experimental Study of Surface Icing Characteristics on Blade Airfoil for Offshore Wind Turbines: Effects of Chord Length and Angle of Attack

1
College of Engineering, Northeast Agriculture University, Harbin 150030, China
2
College of Arts and Sciences, Northeast Agriculture University, Harbin 150030, China
*
Author to whom correspondence should be addressed.
Coatings 2024, 14(5), 623; https://doi.org/10.3390/coatings14050623
Submission received: 25 April 2024 / Revised: 11 May 2024 / Accepted: 13 May 2024 / Published: 15 May 2024

Abstract

:
Offshore wind turbines operating in frigid and humid climates may encounter icing on the blade surface. This phenomenon adversely impacts the aerodynamic efficiency of the turbine, consequently diminishing power generation efficacy. Investigating the distribution characteristics of icing on the blade surface is imperative. Hence, this study undertook icing wind tunnel tests on segments of DU25 airfoil, a prevalent type for offshore wind turbines, to examine such characteristics as different chord lengths and angles of attack. The results show a simultaneous increase in the blade icing area and growth rate of the net icing area with augmenting the chord length and angles of attack. The total icing area rate decreases by a factor of two when the chord length is doubled. The relative positioning of icing and the average icing thickness remain consistent across the airfoil blades with varying chord lengths. Comparing the icing shapes on blades of varying scales shows a similarity ranging from 84.06% to 88.72%. The results of this study provide insight into the icing characteristics of offshore wind turbines.

1. Introduction

Wind energy as a form of renewable energy is gradually becoming an important part of the energy sector [1,2,3]. For onshore wind turbines operating in cold and humid climates, the surface of wind turbine blades is prone to icing [4,5]. However, for offshore wind power, which is exposed to a much colder and harsher ocean climate, the problem of blade icing also exists. This icing phenomenon changes the airfoil profile of wind turbine blades, impacting their aerodynamic performance and reducing efficiency [6,7]. Additionally, it alters the load distribution and structural features of the blades, thereby affecting the structural integrity and fatigue life of the turbine, potentially leading to safety risks and significant accidents [8,9,10].
The methods used to research icing mainly include the numerical simulation method, field observation experiment method, and icing wind tunnel experiment method [11,12,13,14]. The numerical simulation method is used to obtain the icing type, icing distribution, and aerodynamic performance of blades under different climatic conditions through software [6,15,16]. The numerical simulation method often results in some differences between the simulation results and the actual icing conditions due to the imperfect analytical model and complex simulation conditions. Field observation experiments assess the effect of icing on the load distribution and output power of wind turbines by monitoring the operating status and icing distribution of icing wind turbines [17]. However, field observation experiments are affected by natural climatic conditions and are dependent on a certain degree of chance. The icing wind tunnel experimental method simulates the icing of the test model under natural climatic conditions through an icing wind tunnel, which makes it easier to obtain results similar to the natural icing conditions compared to other methods. The icing wind tunnel test methodology allows for an in-depth investigation of the theoretical aspects of wind energy and the actual situation [18]. Hoang et al. [19] clarified the aerodynamic characteristics of an iced airfoil model in a wind tunnel by means of airfoil performance tests in a wind tunnel. The analysis results show that at higher wind speeds, the icing airfoil has a higher power rating than the clean airfoil, but the maximum output power decreases. The overall weight of the blade increases due to blade icing, resulting in an increase in the amplitude of the lateral moment at the root of the blade after icing. Sun et al. [20] explored the effect of surface wettability on the anti-icing performance of wind turbine blades through icing wind tunnel tests. The results showed that the surface wettability could significantly change the anti-icing characteristics and proposed a new concept of superhydrophobic–dry anti-icing. Liu et al. [21] prepared ice-phobic coatings by surface-modified pyrolysis and the hydrothermal reaction of rice straw digestate. And the icing wind tunnel test was carried out under the conditions of a wind speed of 10 m/s and temperature of −10 °C. The tests showed that the coatings were effective, and the icing area and mass were reduced by 10.54% and 30.08%, respectively, after using the coatings. All of the above icing wind tunnel tests were conducted to investigate the actual icing phenomenon using the blade scaling model, which is mainly due to the limitations of the wind tunnel size and blockage ratio. Therefore, we need to consider the similarity between small-scale blade airfoil icing and the actual wind turbine blade icing. Wang et al. [22] proposed an improved computational strategy for the Improved Ruff Icing Scaling Method (IRISM). This method was applied to calculate the relevant parameters, and then numerical simulations were used to assess the effect of the icing conditions on the similarity. The scaling and similarity of ice accumulation on rotating wind turbine blades was investigated by Ibrahim et al. [23]. The scaling approach was tested via the numerical simulation of icing and the results were compared to verify the feasibility of the scaling approach. The parameters of the icing scaling method for rotating blades are proposed based on the velocity, droplet trajectory, pressure coefficient distribution, ice thickness and ice shape. In addition, Ibrahim et al. [24] analyzed a dimensionless model of the flow field and droplet trajectories on rotating wind turbine blades with glaze ice accumulation, developed new scaling parameters for determining the ice fouling conditions based on geometric scaling factors for wind turbine blades, and performed numerical CFD fouling simulations using the ANSYS FENSAP ICE software based on smaller-scale blade cross-sections that were tested in a laboratory environment, which provided new insights into the modeling of glaze ice accumulations on large wind turbine blades. There are more wind tunnel test studies for exploring the aerodynamic performance of wind turbines using scaled-down models [25,26], but there are fewer icing wind tunnel test studies that address the icing similarity rate. In order to strengthen the connection between the experimental model and real wind turbine blades, it is necessary to investigate the distribution of blade icing at different chord lengths and whether the airfoil icing phenomenon of the scaled-down model is also applicable to real wind turbine blade icing.
Exploring the similarity of icing on blades with different chord lengths can provide a basis for investigating the actual icing phenomenon by using the scaling model. Therefore, this paper selects the blade section of a DU25 wind turbine as the research object, and investigates the influence of four chord lengths and two angles of attack on the distribution characteristics of icing on the blade surface, and quantitatively analyzes it through the icing thickness, icing area and icing rate. The icing shape similarity criterion is utilized to study the similarity rate of icing for different chord lengths, and the results of the study can provide insight into the icing characteristics of offshore wind turbines.

2. Experimental Methods

2.1. Experimental Systems

In this study, experimental tests were conducted in a reflux icing wind tunnel constructed at Northeast Agricultural University. As illustrated in Figure 1, the icing wind tunnel system comprises a refrigeration system, a spray system, and a recirculation wind channel. The test section exhibits cross-sectional dimensions of 250 mm × 250 mm, with the spray system’s nozzle positioned at the center of the stabilization section’s cross-section. Water droplets are emitted from the nozzle, converging with the frigid airflow within the icing wind tunnel. In the course of their movement, the droplets disperse heat, transforming into super-cooled water droplets. Prior to the initiation of each icing test, the surface of the test blade underwent a thorough cleansing with alcohol and subsequent drying to ensure the pristine condition of the model surface. The purified blade model was securely affixed to a fixture within the icing test section of the wind tunnel. The blades underwent pre-cooling to attain an ambient temperature before the commencement of the test. Upon reaching the designated values for temperature and wind speed, the spray system was activated to execute the icing test, with the ice formation on the blade surface being documented by a high-speed camera (model Phantom v5.1, boasting a resolution of 1024 × 1024 pixels). Upon the elapse of the preset icing duration, the spray system was deactivated.

2.2. Experimental Models

The DU25 airfoil is used in NREL 5MW offshore wind turbines [27,28,29]. Therefore, the DU25 airfoil blade section was selected for icing tests. The selection of aluminum alloy as the material for the blade airfoil was based on its isotropic nature and stability in heat transfer. The blade airfoil segments are schematically shown in Figure 2. The chord lengths (ci) are 75, 100, 150, and 200 mm, the wingspan length (h) is 20 mm, and the surface roughness is 6.313 µm. The blockage area ratio of the blade at the test section does not exceed 4%, which meets the test requirements.

2.3. Experimental Schemes

2.3.1. Parameters for Icing Experiment on Blade of Different Chord Lengths

This experiment investigates the icing distribution of wind turbine blades under different chord lengths. Adhering to the blockage ratio requirement in the icing wind tunnel test section, blade airfoils with chord lengths (c) of 75 mm, 100 mm, 150 mm, and 200 mm were chosen for a 5 min icing test under angles of attack (AOA) of 0° and 10°. The test temperature (T) was −10 °C, the wind speed (v) was 10 m/s, the liquid water content (LWC) was 0.7 g·m−3, the medium volume droplet diameter (MVD) was 0.5 µm, and the sampling time interval ∆t was 1 min The specific parameters are shown in Table 1. The angle of attack is the angle between the icing wind tunnel’s incoming wind speed and the chord length of the blade, as shown by α in Figure 3.

2.3.2. Icing Similarity Experiment Scheme

The icing shape similarity criterion is based on the ADEC criterion, ONERA criterion, and improved icing similarity theory, and the icing similarity criterion centered on seven parameters such as the modified inertia parameter, aggregation factor, experimental wind speed, and Weber number based on the thickness of the water film is determined, and the order of the selection of icing similarity parameters for the stationary blades is also given as follows:
  • Selection of the characteristic length for subscale models:
c m = k c f
2.
Selection of test wind speeds for subscale models:
v m = v f
3.
Determine the test temperature T using similar thermodynamic properties:
T m = T f
4.
The test medium volume droplet diameter d was obtained using the modified inertia parameter K ¯ :
d m = c m c f 1 2 κ P m P f κ 2 κ T m T f κ 2 κ v m v f κ 1 2 κ d f
5.
The liquid water content LWC for the subscale modeling test was obtained based on the Weber number of the water film thickness:
L W C m = L W C f v m v f 3 d m d f P m P f
6.
Determine the test pressure P based on the dynamic pressure similarity principle:
P m = P f v m v f T m T f 2
7.
Determine the test time t based on the similarity of the aggregation factor A c :
t m = t f c m c f v m v f 1 L W C m L W C f 1
where cm is the characteristic length of the subscale model; cf is the characteristic length of the full-size model; k is the scaling factor; vm is the test wind speed of the subscale model; vf is the test wind speed of the full-size model; Tm is the test temperature of the subscale model; Tf is the test temperature of the full-size model; dm is the test MVD of the subscale model; df is the test MVD of the full-size model; (LWC)m is the test LWC for the subscale model; (LWC)f is the test LWC for the full-size model; Pm is the test pressure for the subscale model; Pf is the test pressure for the full-size model; tm is the test time for the subscale model; and tf is the test time for the full-size model.
The blade models with c4 = 200 mm and c3 = 150 mm chord lengths are designated as full-size, while those with c2 = 100 mm and c1 = 75 mm are regarded as subscale versions, employing a scaling factor (k) of 0.5 in Equation (1). Tests involving c1 vs. c3 and c2 vs. c4 chord lengths constitute two analogous sets. In Equation (4), κ is set to 0.35, and the full-size model test wind speed vf = 10 m/s; the full-size model test temperature Tf = −10 °C; and the full-size model liquid water content (LWC)f = 0.7 g·m−3. The medium volume droplet diameter is maintained at a constant level (dm df = 0.5 µm) to reduce the testing capacity demands. Full-size model test time tf = 4 min.
The specific parameters of the stationary blade icing similarity parameters were calculated according to the guidelines for selecting the parameters, and the icing similarity test program was finalized, as shown in Table 2.

2.4. Icing Experiment Scheme with Different Chord Lengths

To rigorously examine the distribution characteristics of icing on the blade surface, this study introduces quantitative metrics: the average icing thickness ( H i ), the growth rate of the net icing area (Vst), and the total icing area rate (TIAR). The respective equations are articulated below:
H i = S i L i ( i   = 1 ,   2 ,   n )
V s t = A i t ( i   = 1 ,   2 ,   n )
T I A R = i = 1 n A i A ( i   = 1 ,   2 ,   n )
where S i is the ice area in the normal direction of the airfoil surface in the corresponding region of the chord x i 1 ~ x i (i = 1, 2, 3…), and L i is the length of the curve of the airfoil surface in the corresponding region of the chord x i 1 ~ x i ( i = 1, 2, 3…), as defined in Figure 4. The blade chord length is dimensionless and labeled with position, where the positive horizontal coordinate is the upper surface side of the blade and the negative one is the lower surface side of the blade; c is the blade chord length; x/c is the relative position of the blade chord length, with the parameters as shown in Figure 5; A i is the net icing area; ∆t is the sampling time interval; and A is the blade cross-sectional area. The definitions are shown in Figure 6.

3. Results and Discussion

3.1. Icing Distribution

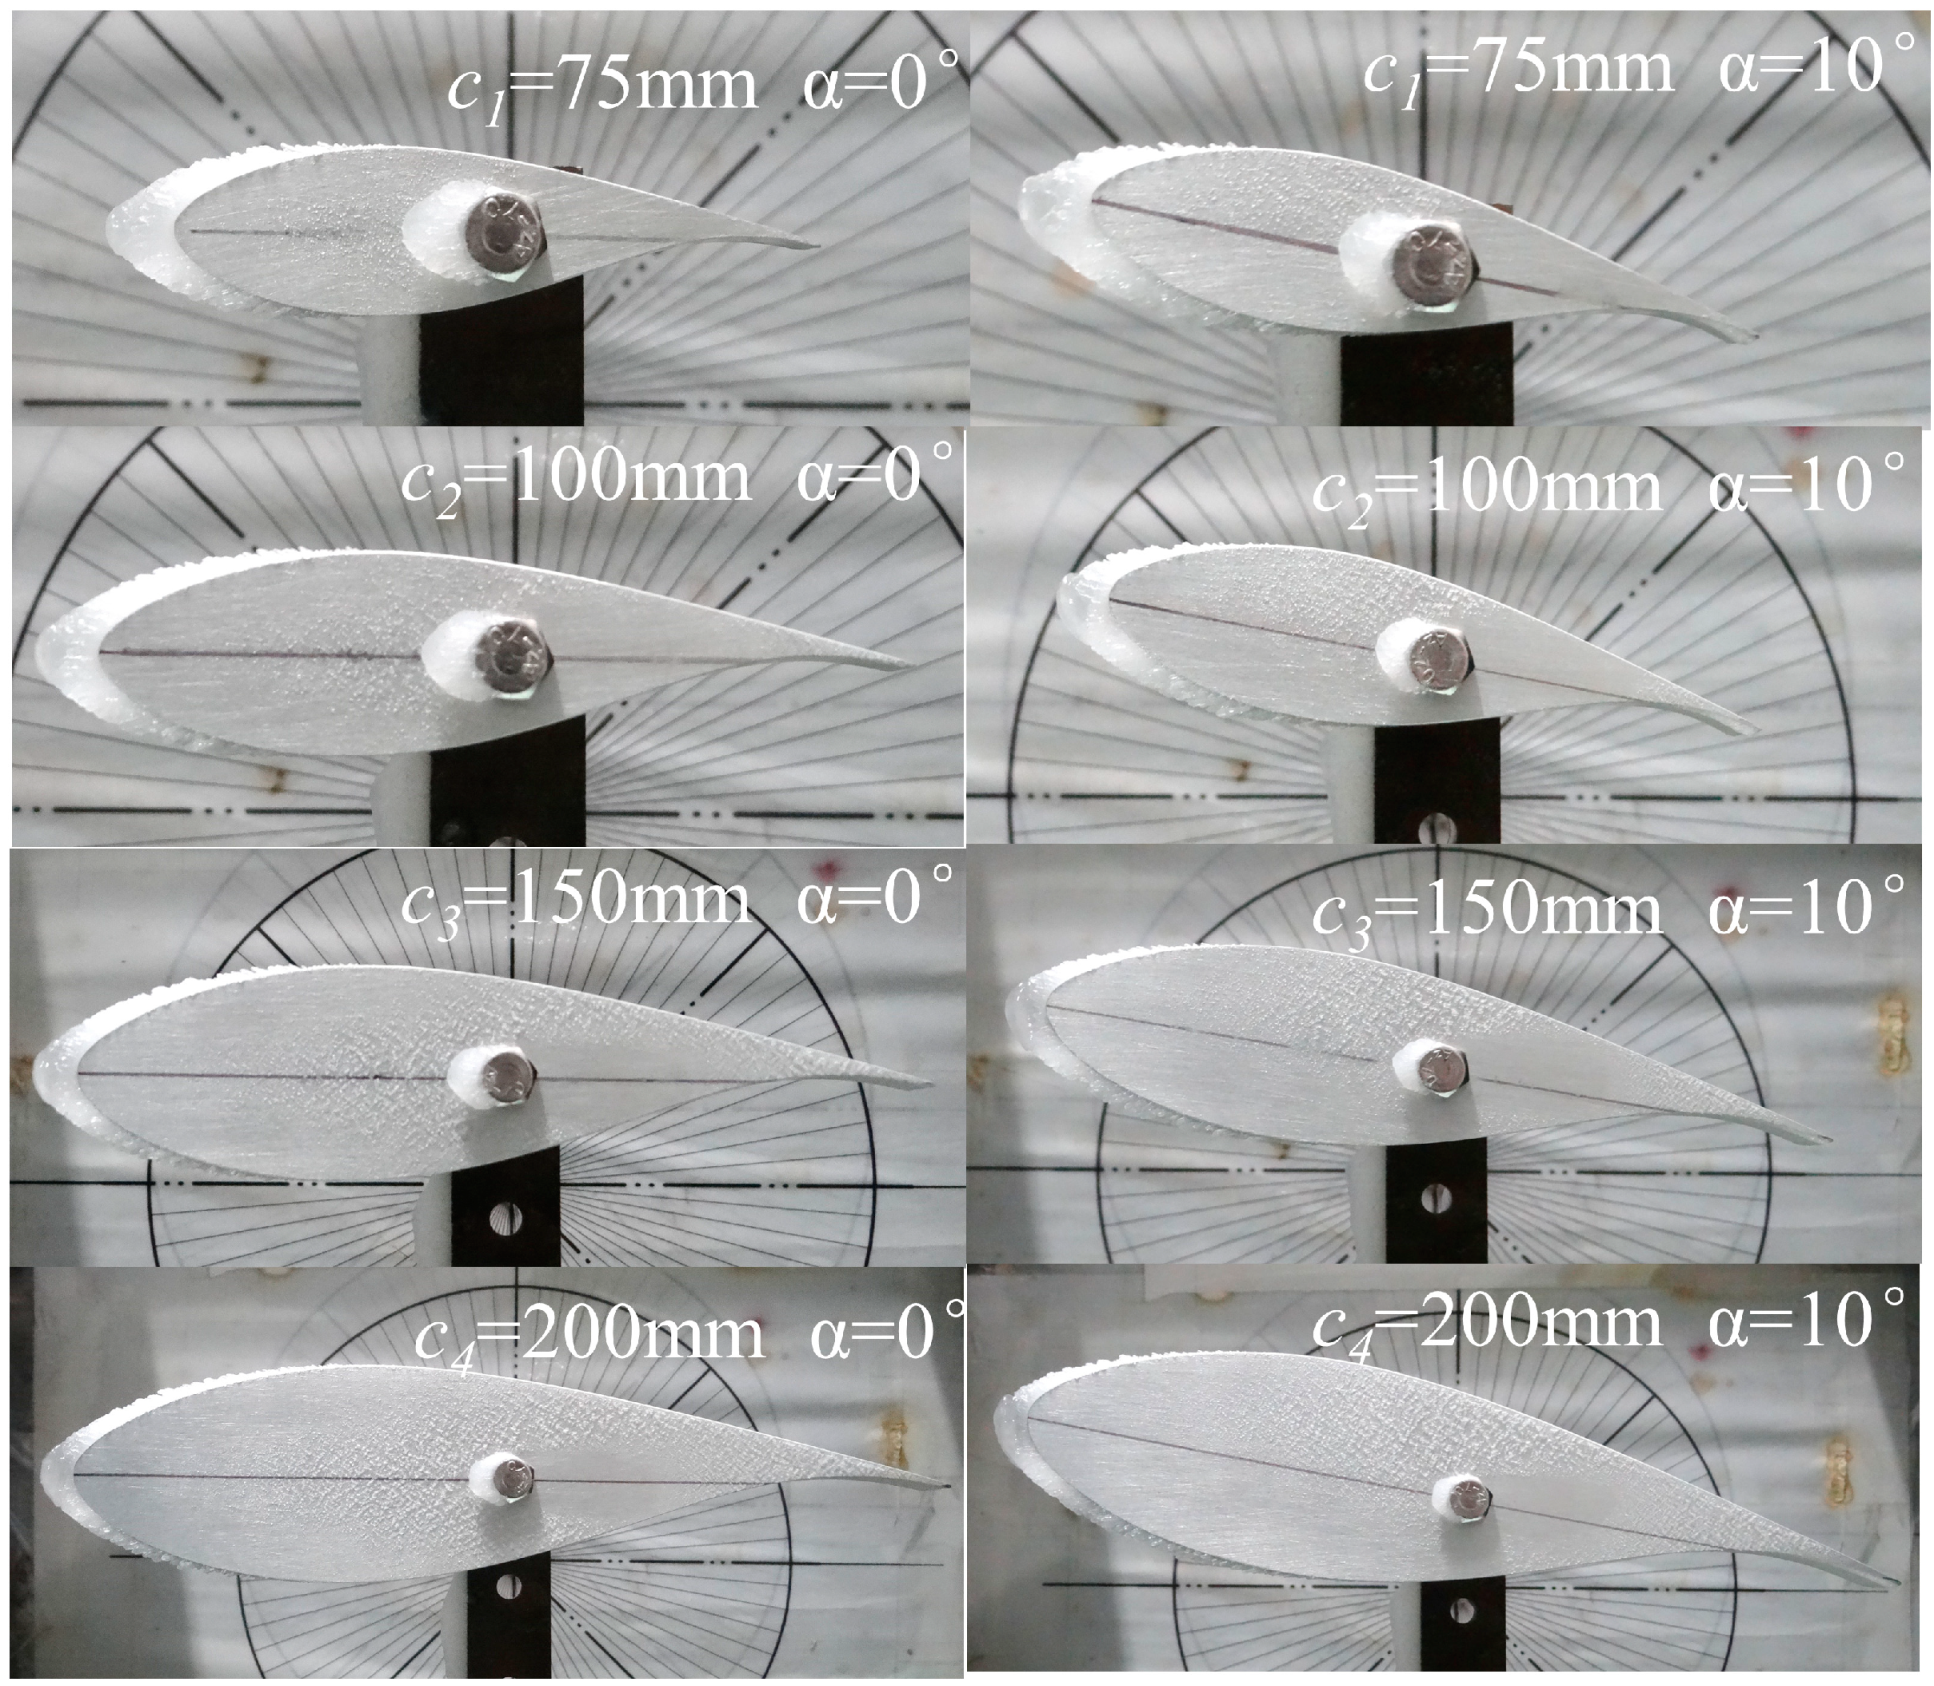
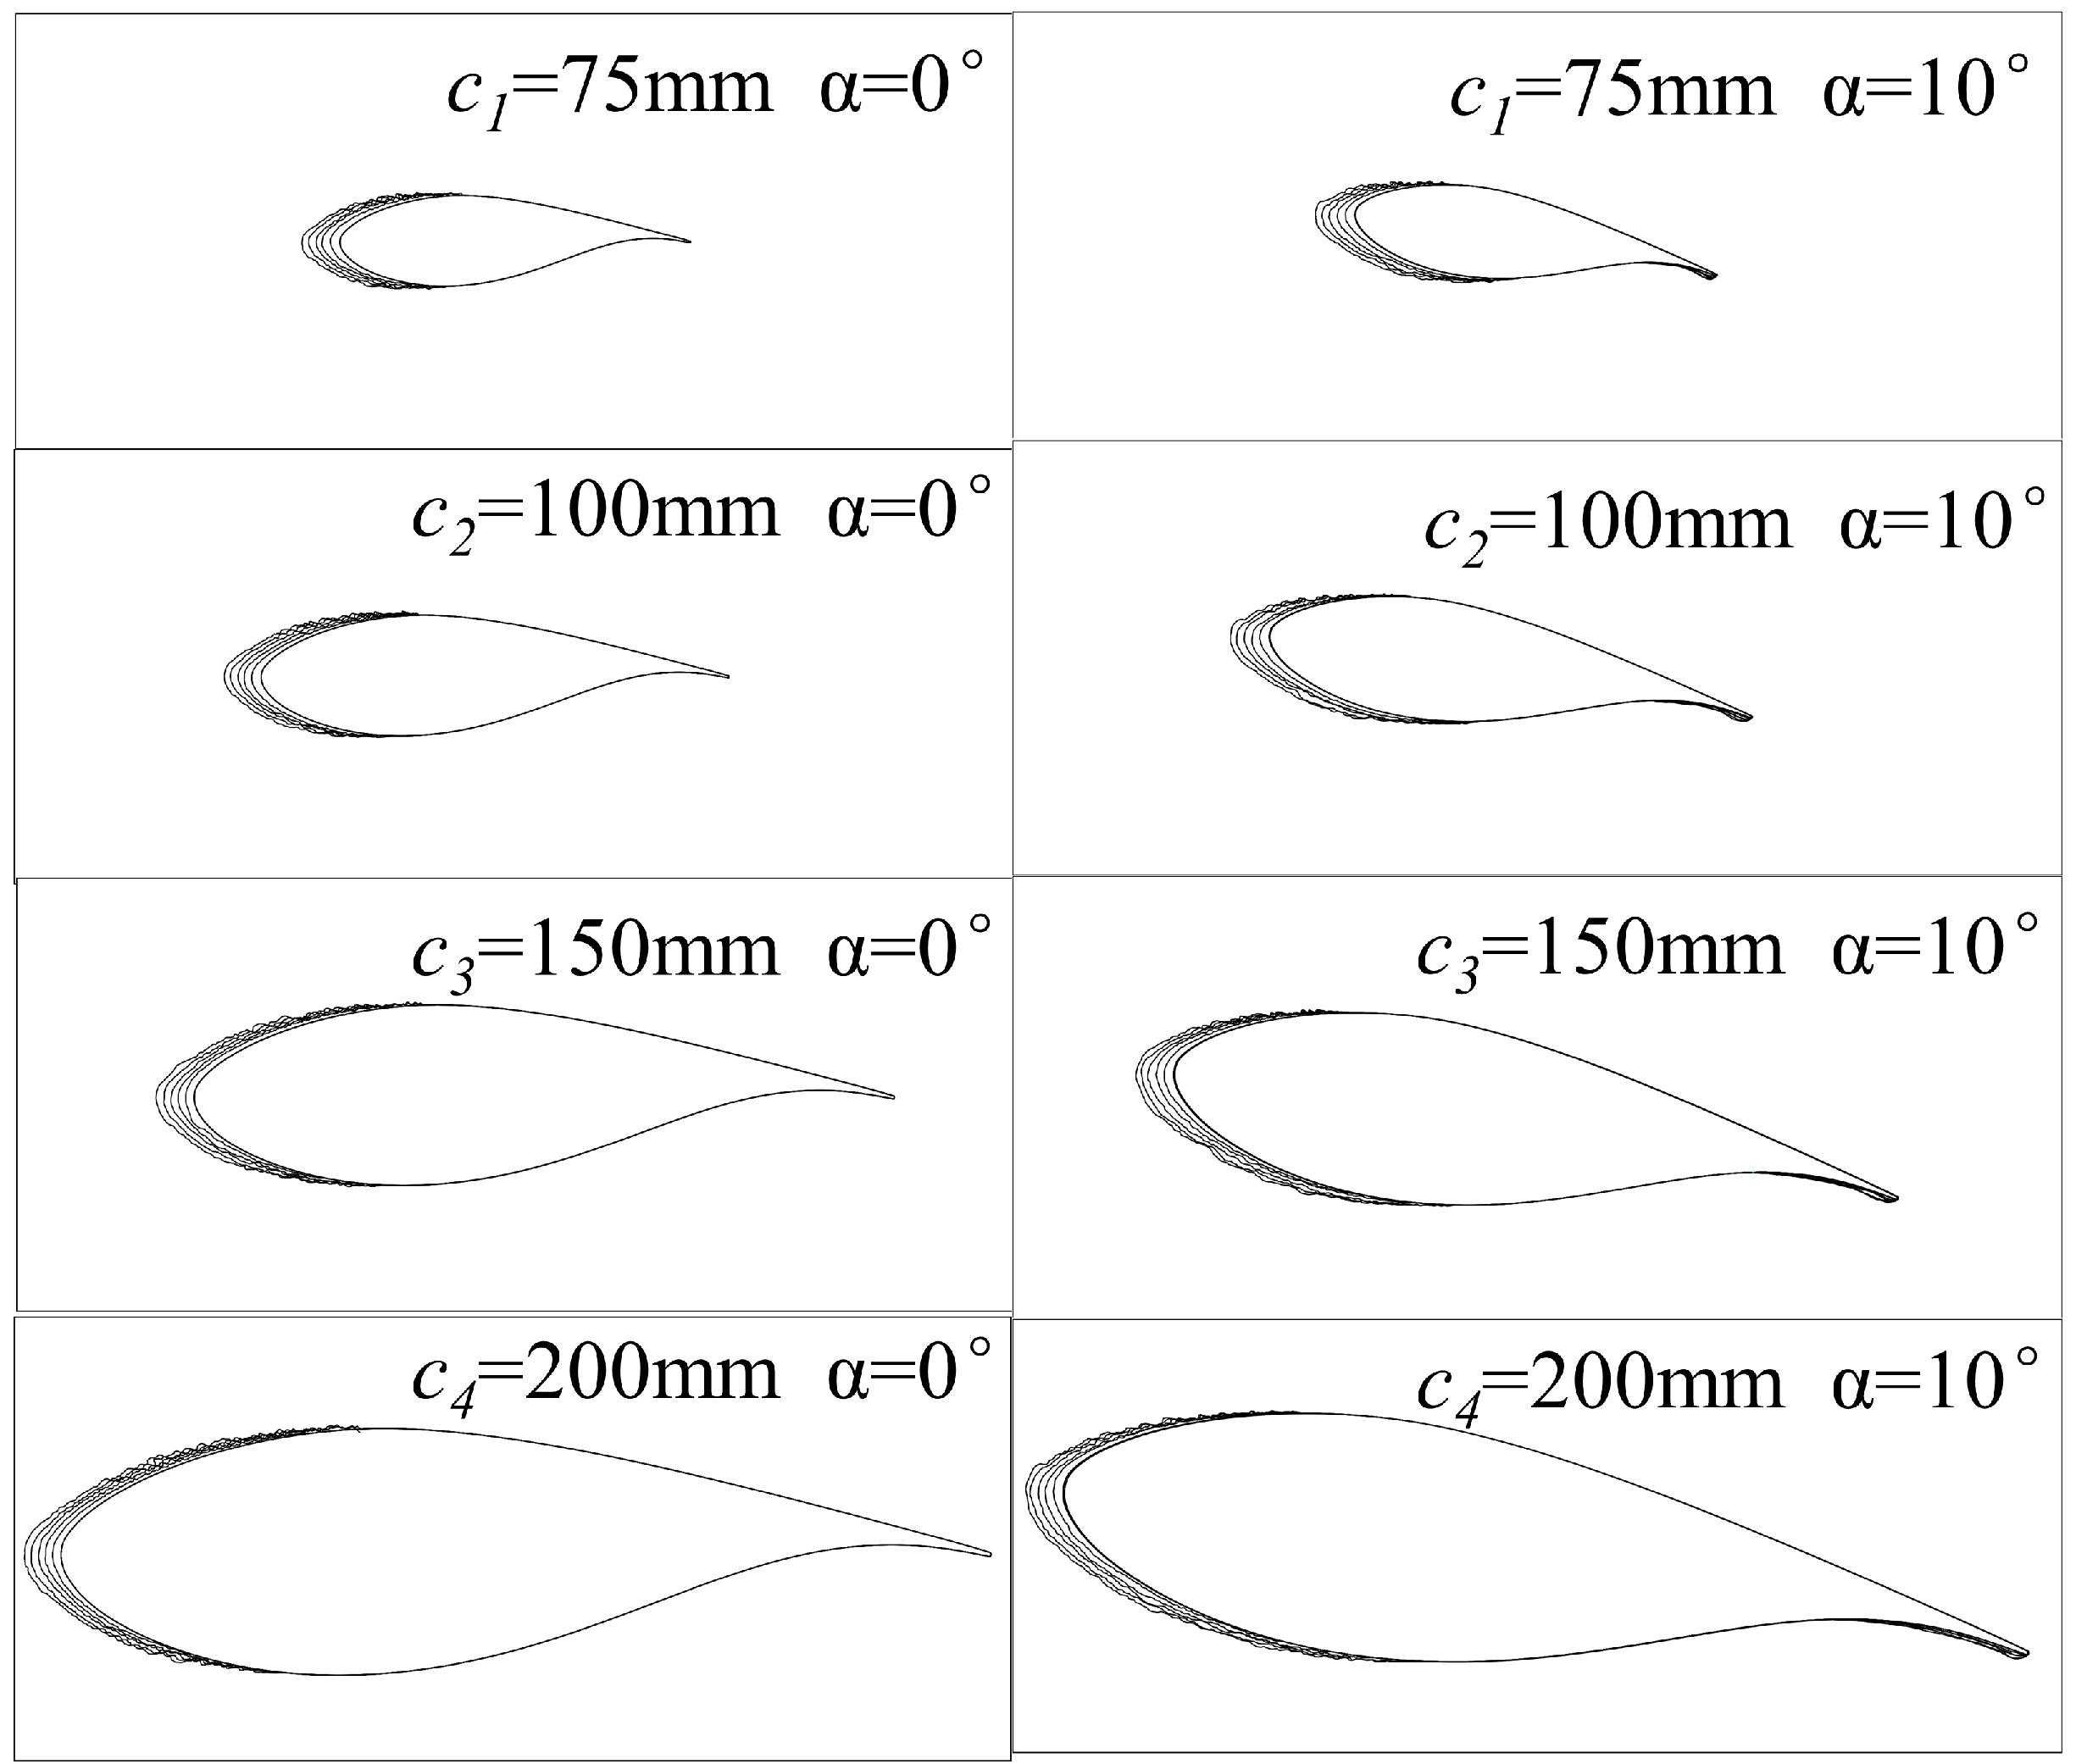
Figure 7 gives the results of the icing of the blade for four chord lengths (75, 100, 150, 200 mm) and two angles of attack (0°, 10°) over a period of 5 min. The type of icing observed was predominantly mixed ice, characterized by glazed ice near the leading edge of the blade and rime ice on the upper and lower surfaces of the blade. The maximum thickness of icing on the airfoils of different chord lengths was essentially the same over the 5 min icing duration. The distribution of icing was slightly different at different angles of attack. At α = 0°, icing was only found near the leading edge of the blade. At α = 10°, the icing area on the lower surface of the blade was larger than that on the upper surface, and a small amount of icing occurred at the trailing edge. Minute-by-minute photographs of the icing on the surface of the test blade were processed using a plotting software to obtain an outline of the shape of the ice, as shown in Figure 8.

3.2. Icing Area

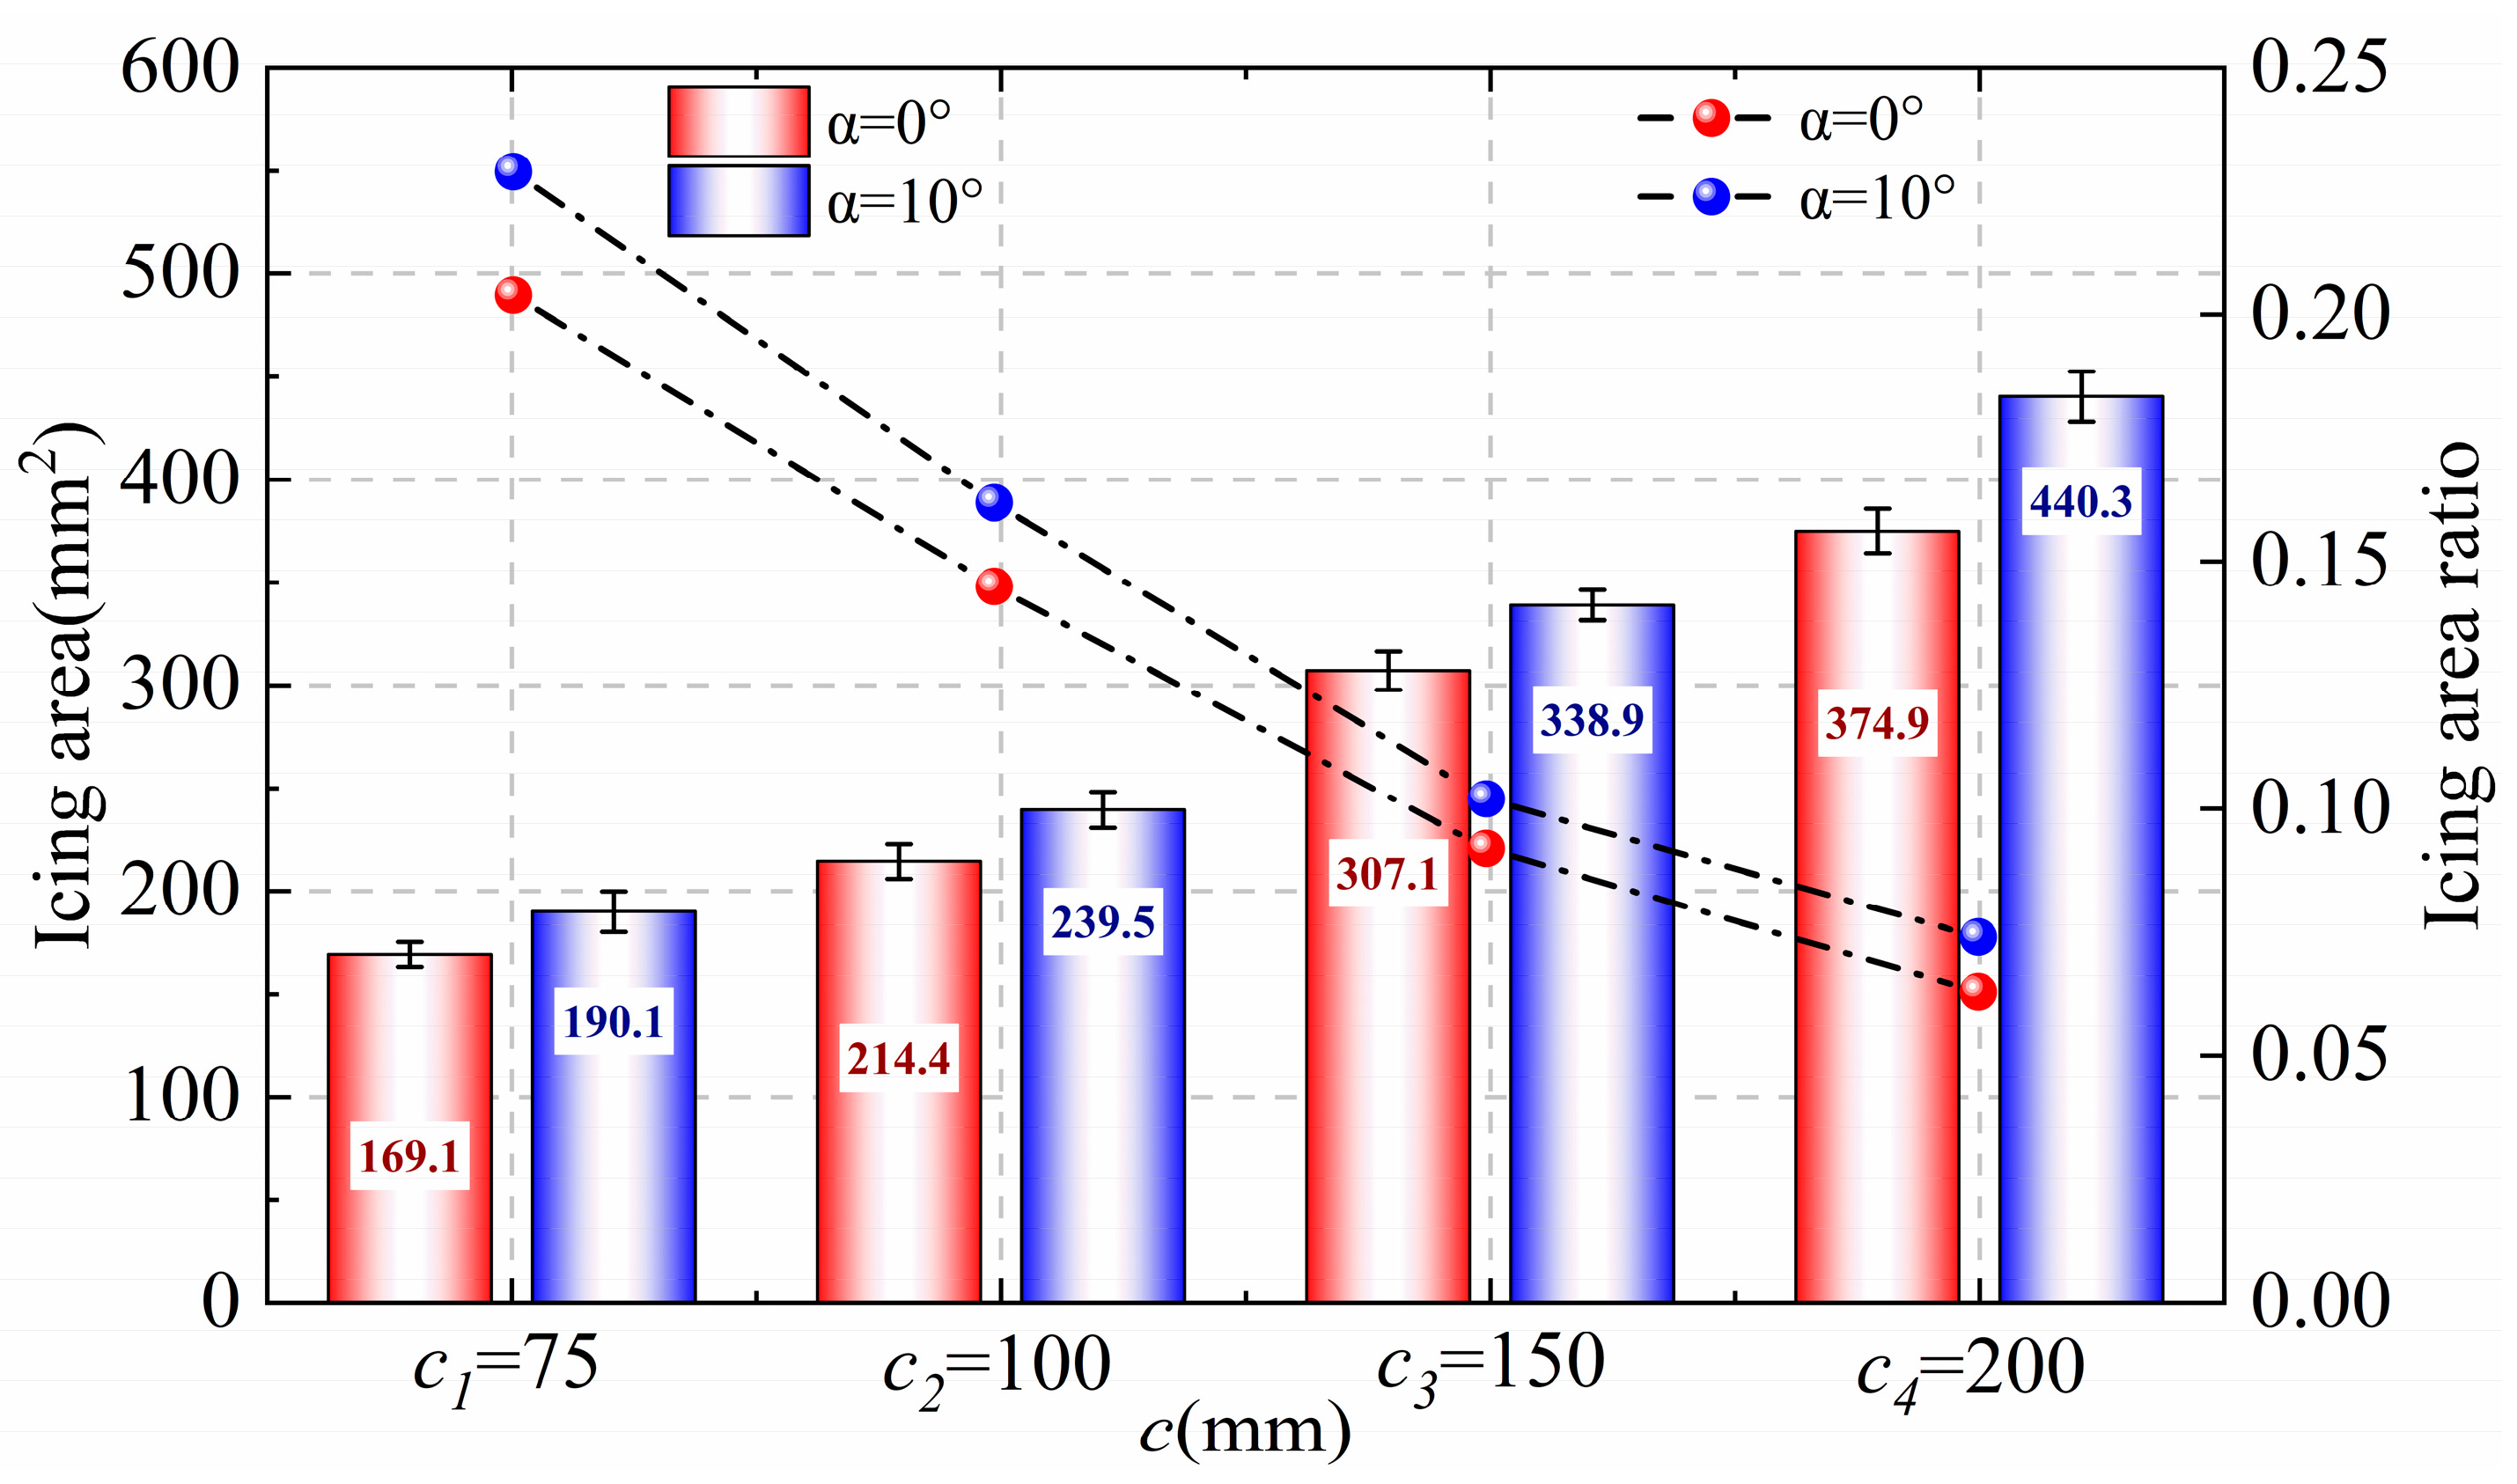
As can be seen in Figure 9, the icing area on the blade surface increases as the chord length increases. Specifically, for a given chord length, the icing area at α = 10° exceeds that at α = 0°. It can be seen that for chord lengths of 200 mm and α = 10°, the maximum icing area on the blade surface is 440.3 mm2 The main reason for this phenomenon is that the contact area between the blade surface and the super-cooled water droplets becomes larger. As the blade chord length ci increases, the maximum windward thickness of the blade also increases, which leads to an increase in the contact area between the blade surface and the incoming super-cooled water droplets, so there is an increasing trend in the icing area. The contact area between the blade surface and the incoming super-cooled water droplets at a 10° angle of attack is larger than that of the blade at a 0° angle of attack, so the icing area is larger at α = 10° under the same chord length condition. The icing area ratio is the ratio of the blade icing area to the blade cross-sectional area. As the chord length increases, the blade icing area ratio decreases. When α = 0°, the chord length doubles, and the icing area ratio decreases by about double. The icing area ratio of blades with the same chord length at α = 10° is larger than that at α = 0°.

3.3. Average Icing Thickness

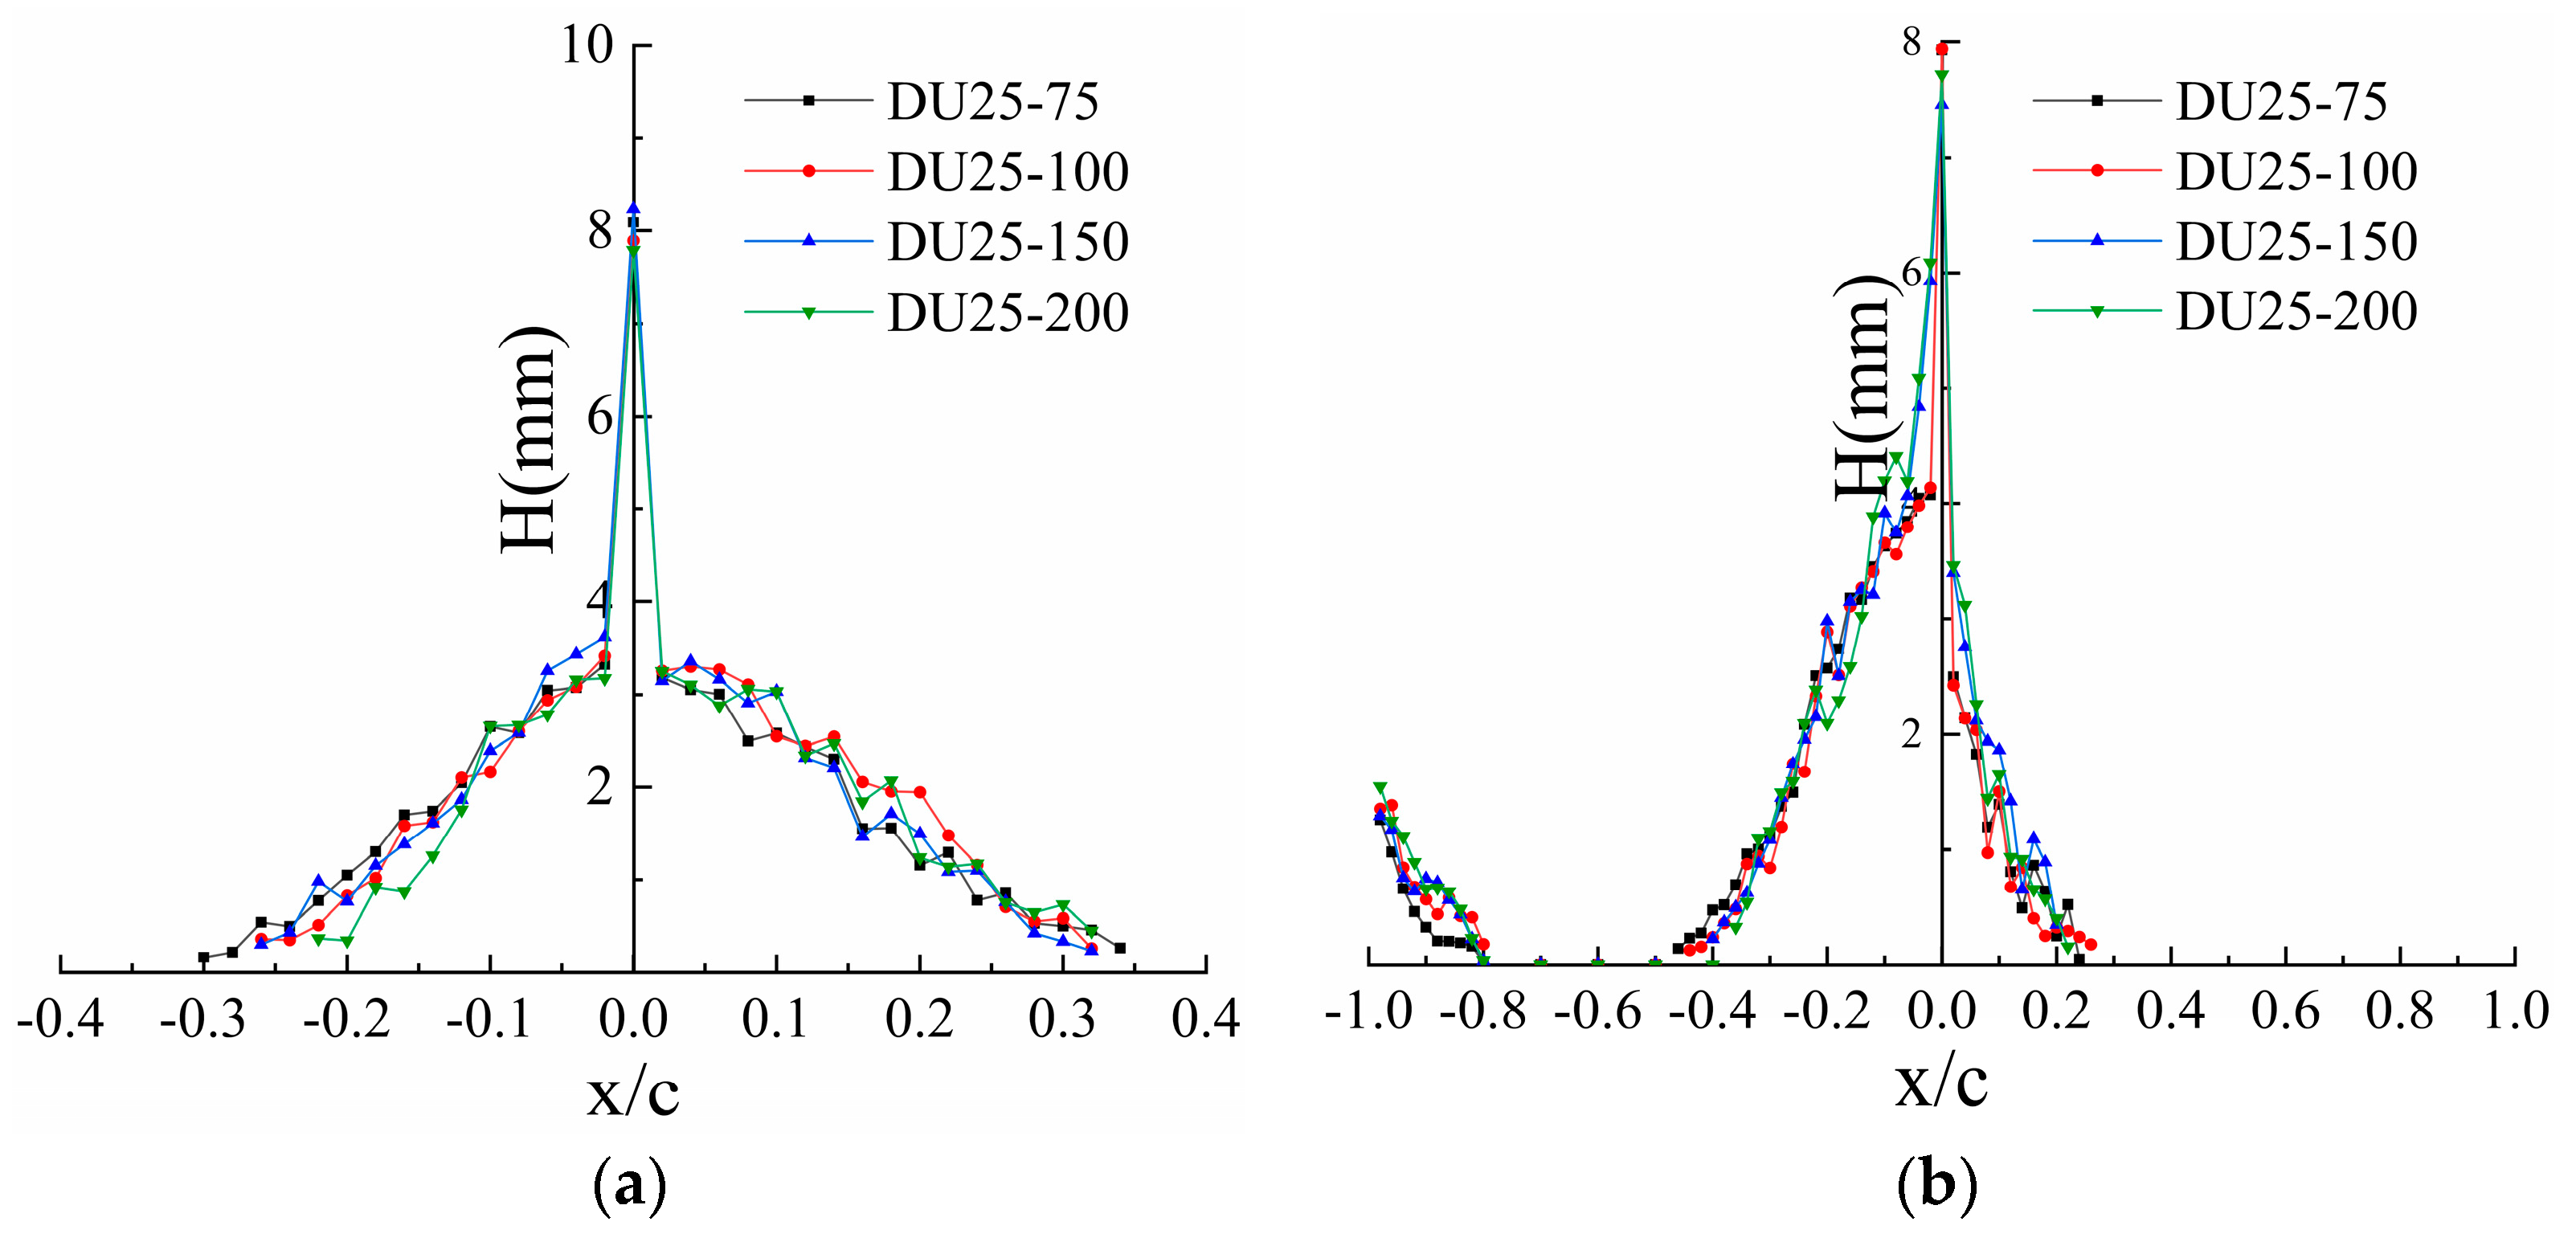
The average icing thickness for airfoils with varying chord lengths is illustrated in Figure 10. As depicted in Figure 10a, the icing on the blade, under 0° AOA, primarily occurs in the −30%~35% region of the leading edge. The asymmetry in the icing distribution is attributed to the inherent asymmetry of the airfoil, where the shapes of the upper and lower airfoils exhibit slight disparities, influencing the icing distribution range. At chord lengths of 75 mm, 100 mm, 150 mm, and 200 mm, the maximum average icing thicknesses at the leading edge of the blade are 8.092 mm, 7.894 mm, 8.239 mm, and 7.789 mm, respectively. Despite the nearly identical number of droplets impacting the model within the same time frame, subtle variations in the maximum average icing thickness at different chord lengths may arise from potential uncertainties in the stability of the icing wind tunnel. Overall, the relative positions of blade icing and their average icing thicknesses for varying chord lengths remain consistent. As depicted in Figure 10b, under a 10° AOA, the icing of blades with different chord lengths primarily occurs in the region of −50%~25% of the leading edge and −80%~100% of the lower airfoil surface. When comparing the average icing thicknesses at a 0° and 10° AOA, it becomes evident that, at a 10° AOA, the icing areas shift towards the lower airfoil surface. Likewise, the relative positions of the icing and the average icing thicknesses on the blades of airfoils with different chord lengths at 10° AOA remain generally consistent.

3.4. Icing Rate

The growth rate of the net icing area (Vst) for various chord lengths is illustrated in Figure 11. The graphical representation reveals that the growth curves of the net icing area for the blades, characterized by different chord lengths at a 0° and 10° AOA, exhibit an initial ascent followed by a subsequent descent, subsequently fluctuating within a defined range of variations. This pattern can be attributed to the early stages of icing on the blade surface, wherein super-cooled water droplets collide with and adhere to the blade surface, subsequently freezing rapidly. During this phase, direct contact between the super-cooled water droplets and the blade surface leads to swift heat transfer, resulting in the highest icing rate. As the ice layer attains a certain thickness on the blade surface, the super-cooled water droplets only interact with the overlying ice, resulting in a significantly reduced heat transfer rate compared to the initial interaction with the aluminum surface. Consequently, the Vst demonstrates an initial rise followed by a decline. Examining Figure 11a as an illustrative case, the Vst for blades with chord lengths of 200 mm, 150 mm, 100 mm, and 75 mm exhibits variations within the ranges of 1.14 to 1.33 mm2/s, 0.92 to 1.24 mm2/s, 0.54 to 0.91 mm2/s, and 0.39 to 0.73 mm2/s, respectively. Notably, the Vst for the airfoil with a larger chord length surpasses that of its smaller counterpart. This discrepancy can be attributed to the proportional increase in the contact area between the aluminum alloy blade and the incoming super-cooled water droplets as the blade chord length expands. Consequently, the high heat transfer rate results in a substantial augmentation of the Vst.
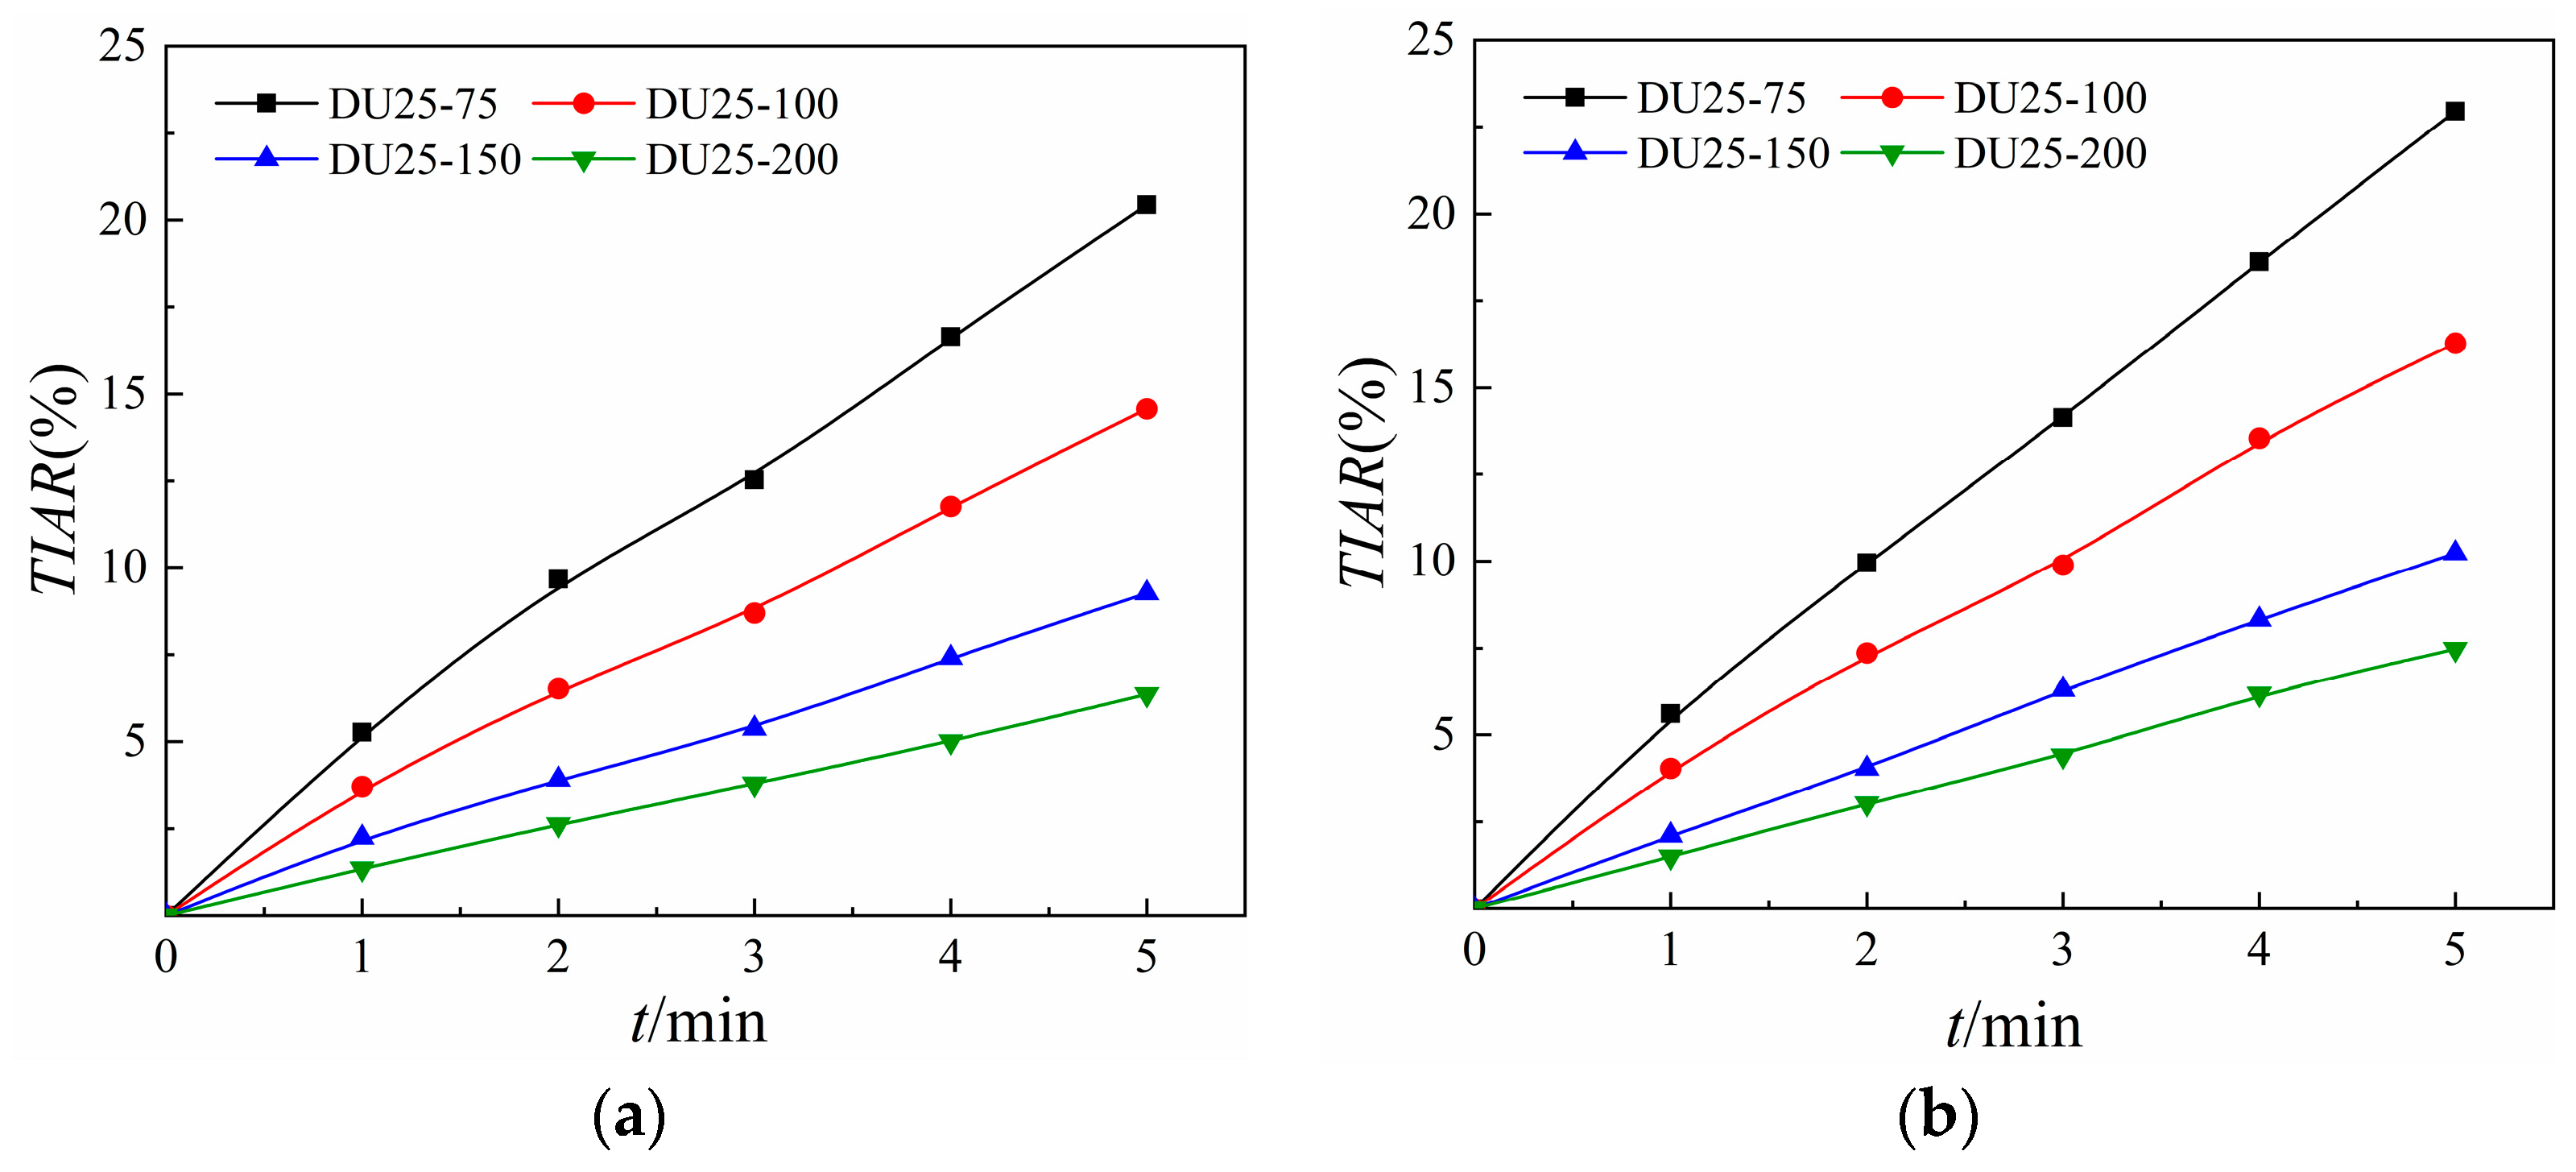
The variation in the total icing area rate for distinct chord lengths of blade airfoil is depicted in Figure 12. The total icing area rate of the blade exhibits an approximately linear increasing trend, with chord length exerting a substantial influence on this rate. Taking the example of the blade at 0° AOA, the total icing area rate for the 75 mm chord length blade reaches 20.43% during the 5-min icing period. Conversely, the total icing area rates for the 100 mm, 150 mm, and 200 mm chord length blades are 14.57%, 9.27%, and 6.36%, respectively. This observation suggests a more pronounced impact of icing on smaller-scale airfoils. Furthermore, the total icing area rate at 10° AOA is marginally higher than that at 0° AOA.

3.5. Icing Similarity

Following a quantitative analysis of the ice distribution characteristics on the surfaces of blades with varying chord lengths, certain patterns are summarized. Notably, the relative positions of icing and the average icing thickness on blades with different chord lengths exhibit a fundamental consistency. The total icing area rate of the full-size model at 4 min remains essentially the same as the total icing area rate of the downsized model at 2 min, underscoring a similarity in the icing behavior.
Based on the experimental scheme in Table 1, icing tests were performed and the icing shapes were obtained for airfoils with different chord lengths. Given that the icing images lack precision for a nuanced comparison of the congruence in icing configurations on the surfaces of the two blade scales, the diminished model blades and their icing configurations were proportionally magnified to match the dimensions of the full-scale blade model. This facilitated an assessment of the ice shapes under a consistent coordinate system, denoted as a normalized comparison. As depicted in Figure 13, the icing configurations on the surfaces of diverse blade scales exhibit a substantial degree of similarity under various conditions. While there exists a minor variance between the initiation and termination points of icing on the surfaces of distinct blade scales, the principal structure of the icing formations aligns closely. This marginal disparity may be attributed to the minor fluctuations in wind speed during the wind tunnel’s operational phases.
It is unscientific to judge whether the shapes of icing on the surface of models of different scales are similar only by visual inspection. So, the icing shape similarity rate Sim, a method used to evaluate the icing shape similarity, was validated. Therefore, the icing shape similarity evaluation method (the icing similarity rate Sim) was applied to verify. Five typical characteristic quantities, including the icing area, icing station thickness, icing upper and lower limits, and station deflection angle, were used as basic quantities, and each typical characteristic quantity was dimensionless. The dimensionless icing area ηs, the dimensionless icing standing point thickness ησ, the dimensionless icing upper limit ηLu, the dimensionless icing lower limit ηLd and the dimensionless icing standing point deflection angle ηα were introduced. By using the dimensionless typical characteristic quantities, the rate of variation in each typical characteristic quantity at different scales ξ i can be obtained. It is also necessary to consider the size of the influence of each characteristic quantity on the similarity when determining the similarity. According to the research results concerning different typical characteristic quantities, different characteristic quantities are weighted and averaged by using different weighting factors rx, and x denotes different characteristic quantities: rS = 0.3, rσ = 0.3, rLu = 0.15, rLd = 0.15, rα = 0.1. When the icing similarity rate is denoted as Sim and it is percentage, the following is obtained:
S i m = 1 r s ξ s + r σ ξ σ + r L u ξ L u + r L d ξ L d + r α ξ α ) ] × 100 %
By using the above method to evaluate the icing similarity rate, the icing shapes on the surfaces of the blades at different scales in the test program were quantitatively analyzed. The similarity rates of the icing shapes on the surfaces of the blades at two scales were obtained, as shown in Table 3. The lowest similarity rate in this test occurred in Condition 1, with chord lengths of c1 = 75 mm and c3 = 150 mm. The similarity of the icing shape on the blade surface was 84.06% for both scales. The highest similarity occurs in Condition 4, with chord lengths of c2 = 100 mm and c4 = 200 mm. The similarity of the icing shape on the blade surface was 88.72% for both scales. The data prove that the icing shape similarity criterion has a degree of accuracy.

4. Conclusions

Icing wind tunnel tests were conducted on blades with DU25 airfoil. Four kinds of chord lengths and two kinds of attack of angles were selected. The main conclusions are summarized as follows:
(1)
The relative positions of icing and the average icing thicknesses of the airfoil blades with different chord lengths are basically the same. At α = 0°, the relative position of icing is in the region of −30%~35% of the leading edge of the blade, and at α = 10°, the relative position of icing is in the region of −50%~25% of the leading edge of the blade and −80%~−100% of the trailing edge of the blade.
(2)
With an increase in the blade chord length, the growth rate of the net icing area varies from 0.39~0.73 mm2/s to 1.14~1.33 mm2/s at α = 0°, and from 0.57~0.77 mm2/s to 1.27~1.49 mm2/s at α = 10°. In addition, the total icing area rate of the blade decreases with an increase in the chord length, and with the doubling of the chord length, the summarized ice area rate decreases by about a factor of one. the total icing area rate would decrease by about half.
(3)
The icing similarity criterion was verified, and the similarity of the icing shapes on the surfaces of the blades at different scales was found to be 84.06%~88.72% under the test conditions.

Author Contributions

Conceptualization, D.L. and Y.L.; Formal analysis, D.L., P.Z. and H.S.; Funding acquisition, Y.L.; Investigation, S.Y. and H.C.; Methodology, D.L.; Supervision, Y.L.; Validation, D.L. and P.Z.; Writing—original draft, D.L.; Writing—review and editing, Y.L. and F.F. All authors have read and agreed to the published version of the manuscript.

Funding

This work was supported by Project grant NO.52376170 supported by National Natural Science Foundation of China (NSFC).

Institutional Review Board Statement

Not applicable.

Informed Consent Statement

Not applicable.

Data Availability Statement

The data presented in this study are not available due to privacy.

Conflicts of Interest

The authors declare no conflict of interest.

References

  1. Liu, Q.; Sun, Y.; Wu, M. Decision-making methodologies in offshore wind power investments: A review. J. Clean. Prod. 2021, 295, 126459. [Google Scholar] [CrossRef]
  2. Jung, C.; Schindler, D. Efficiency and effectiveness of global onshore wind energy utilization. Energy Convers. Manag. 2023, 280, 116788. [Google Scholar] [CrossRef]
  3. Zhang, Y.; Song, Y.; Shen, C.; Chen, N. Aerodynamic and structural analysis for blades of a 15MW floating offshore wind turbine. Ocean Eng. 2023, 287, 115785. [Google Scholar] [CrossRef]
  4. Donadei, V.; Koivuluoto, H.; Sarlin, E. The effect of mechanical and thermal stresses on the performance of lubricated icephobic coatings during cyclic icing/deicing tests. Prog. Org. Coat. 2022, 163, 106614. [Google Scholar] [CrossRef]
  5. Tao, C.; Tao, T.; He, S.; Bai, X.; Liu, Y. Wind turbine blade icing diagnosis using B-SMOTE-Bi-GRU and RFE combined with icing mechanism. Renew. Energy 2024, 221, 119741. [Google Scholar] [CrossRef]
  6. Yang, X.; Bai, X.; Cao, H. Influence analysis of rime icing on aerodynamic performance and output power of offshore floating wind turbine. Ocean Eng. 2022, 258, 111725. [Google Scholar] [CrossRef]
  7. Subeshan, B.; Usta, A.; Asmatulu, R. Deicing and self-cleaning of plasma-treated superhydrophobic coatings on the surface of aluminum alloy sheets. Surf. Interfaces 2020, 18, 100429. [Google Scholar] [CrossRef]
  8. Chuang, Z.; Li, C.; Liu, S.; Li, X.; Li, Z.; Zhou, L. Numerical analysis of blade icing influence on the dynamic response of an integrated offshore wind turbine. Ocean Eng. 2022, 257, 111593. [Google Scholar] [CrossRef]
  9. Liu, Z.; Feng, F.; Li, Y.; Sun, Y.; Tagawa, K. A corncob biochar-based superhydrophobic photothermal coating with micro-nano-porous rough-structure for ice-phobic properties. Surf. Coat. Technol. 2023, 457, 129299. [Google Scholar] [CrossRef]
  10. Dalili, N.; Edrisy, A.; Carriveau, R. A review of surface engineering issues critical to wind turbine performance. Renew. Sustain. Energy Rev. 2019, 13, 428–438. [Google Scholar] [CrossRef]
  11. Shu, L.; Li, H.; Hu, Q.; Jiang, X.; Qiu, G.; McClure, G.; Yang, H. Study of ice accretion feature and power characteristics of wind turbines at natural icing environment. Cold Reg. Sci. Technol. 2018, 147, 45–54. [Google Scholar] [CrossRef]
  12. Gao, L.; Hong, J. Wind turbine performance in natural icing environments: A field characterization. Cold Reg. Sci. Technol. 2021, 181, 103193. [Google Scholar] [CrossRef]
  13. Li, Y.; Yang, S.; Feng, F.; Tagawa, K. A review on numerical simulation based on CFD technology of aerodynamic characteristics of straight-bladed vertical axis wind turbines. Energy Rep. 2023, 9, 4360–4379. [Google Scholar] [CrossRef]
  14. Tong, G.; Li, Y.; Tagawa, K.; Feng, F. Effects of blade airfoil chord length and rotor diameter on aerodynamic performance of straight-bladed vertical axis wind turbines by numerical simulation. Energy 2023, 265, 126325. [Google Scholar] [CrossRef]
  15. Hu, L.; Zhu, X.; Hu, C.; Chen, J.; Du, Z. Wind turbines ice distribution and load response under icing conditions. Renew. Energy 2017, 113, 608–619. [Google Scholar] [CrossRef]
  16. Lu, H.; Xu, Y.; Li, H.; Zhao, W. Numerical Study on Glaze Ice Accretion Characteristics over Time for a NACA 0012 Airfoil. Coatings 2024, 14, 55. [Google Scholar] [CrossRef]
  17. Gao, L.; Tao, T.; Liu, Y.; Hu, H. A field study of ice accretion and its effects on the power production of utility-scale wind turbines. Renew. Energy 2021, 167, 917–928. [Google Scholar] [CrossRef]
  18. He, R.; Sun, H.; Gao, X.; Yang, H. Wind tunnel tests for wind turbines: A state-of-the-art review. Renew. Sustain. Energy Rev. 2022, 166, 112675. [Google Scholar] [CrossRef]
  19. Hoang, P.H.; Maeda, T.; Kamada, Y. Effect of icing airfoil on aerodynamic performance of horizontal axis wind turbine. J. Energy Resour. Technol. 2022, 144, 011303. [Google Scholar] [CrossRef]
  20. Sun, H.; Lin, G.; Jin, H.; Bu, X.; Cai, C.; Jia, Q.; Ma, K.; Wen, D. Experimental investigation of surface wettability induced anti-icing characteristics in an ice wind tunnel. Renew. Energy 2021, 179, 1179–1190. [Google Scholar] [CrossRef]
  21. Liu, Z.; Li, Y.; He, Z. Ice-phobic properties of MoS2-loaded rice straw biogas residue biochar-based photothermal and anti-corrosion coating with low oxygen to carbon ratio. Biochar 2023, 5, 74. [Google Scholar] [CrossRef]
  22. Wang, Q.; Yi, X. A computational strategy for determining the optimal scaled wind speed in icing wind tunnel experiments. Comput. Fluids 2023, 250, 105734. [Google Scholar] [CrossRef]
  23. Ibrahim, G.M.; Pope, K.; Naterer, G.F. Scaling formulation of multiphase flow and droplet trajectories with rime ice accretion on a rotating wind turbine blade. J. Wind Eng. Ind. Aerodyn. 2023, 232, 105247. [Google Scholar] [CrossRef]
  24. Ibrahim, G.M.; Pope, K.; Naterer, G.F. Extended scaling approach for droplet flow and glaze ice accretion on a rotating wind turbine blade. J. Wind Eng. Ind. Aerodyn. 2023, 233, 105296. [Google Scholar] [CrossRef]
  25. Huang, G.; Zhang, S.; Yan, B.; Yang, Q.; Zhou, X.; Ishihara, T. Thrust-matched optimization of blades for the reduced-scale wind tunnel tests of wind turbine wakes. J. Wind Eng. Ind. Aerodyn. 2022, 228, 105113. [Google Scholar] [CrossRef]
  26. Yang, W.; Yu, M.; Yan, B.; Huang, G.; Yang, Q.; Zhang, S.; Deng, X. Wind Tunnel Tests of Wake Characteristics for a Scaled Wind Turbine Model Based on Dynamic Similarity. Energies 2022, 15, 6165. [Google Scholar] [CrossRef]
  27. Wang, H.; Chen, B. Investigation on aerodynamic noise for leading edge erosion of wind turbine blade. J. Wind Eng. Ind. Aerodyn. 2023, 240, 105484. [Google Scholar] [CrossRef]
  28. Tabib, M.; Rasheed, A.; Siddiqui, M.S.; Kvamsdal, T. A full-scale 3D Vs. 2.5D Vs. 2D analysis of flow pattern and forces for an industrial-scale 5MW NREL reference wind-turbine. Energy Procedia 2017, 137, 477–486. [Google Scholar] [CrossRef]
  29. Wang, Y.; Wang, L.; Duan, C.; Zheng, J.; Liu, Z.; Ma, G. CFD simulation on wind turbine blades with leading edge erosion. J. Theor. Appl. Mech. 2021, 59, 579–593. [Google Scholar] [CrossRef]
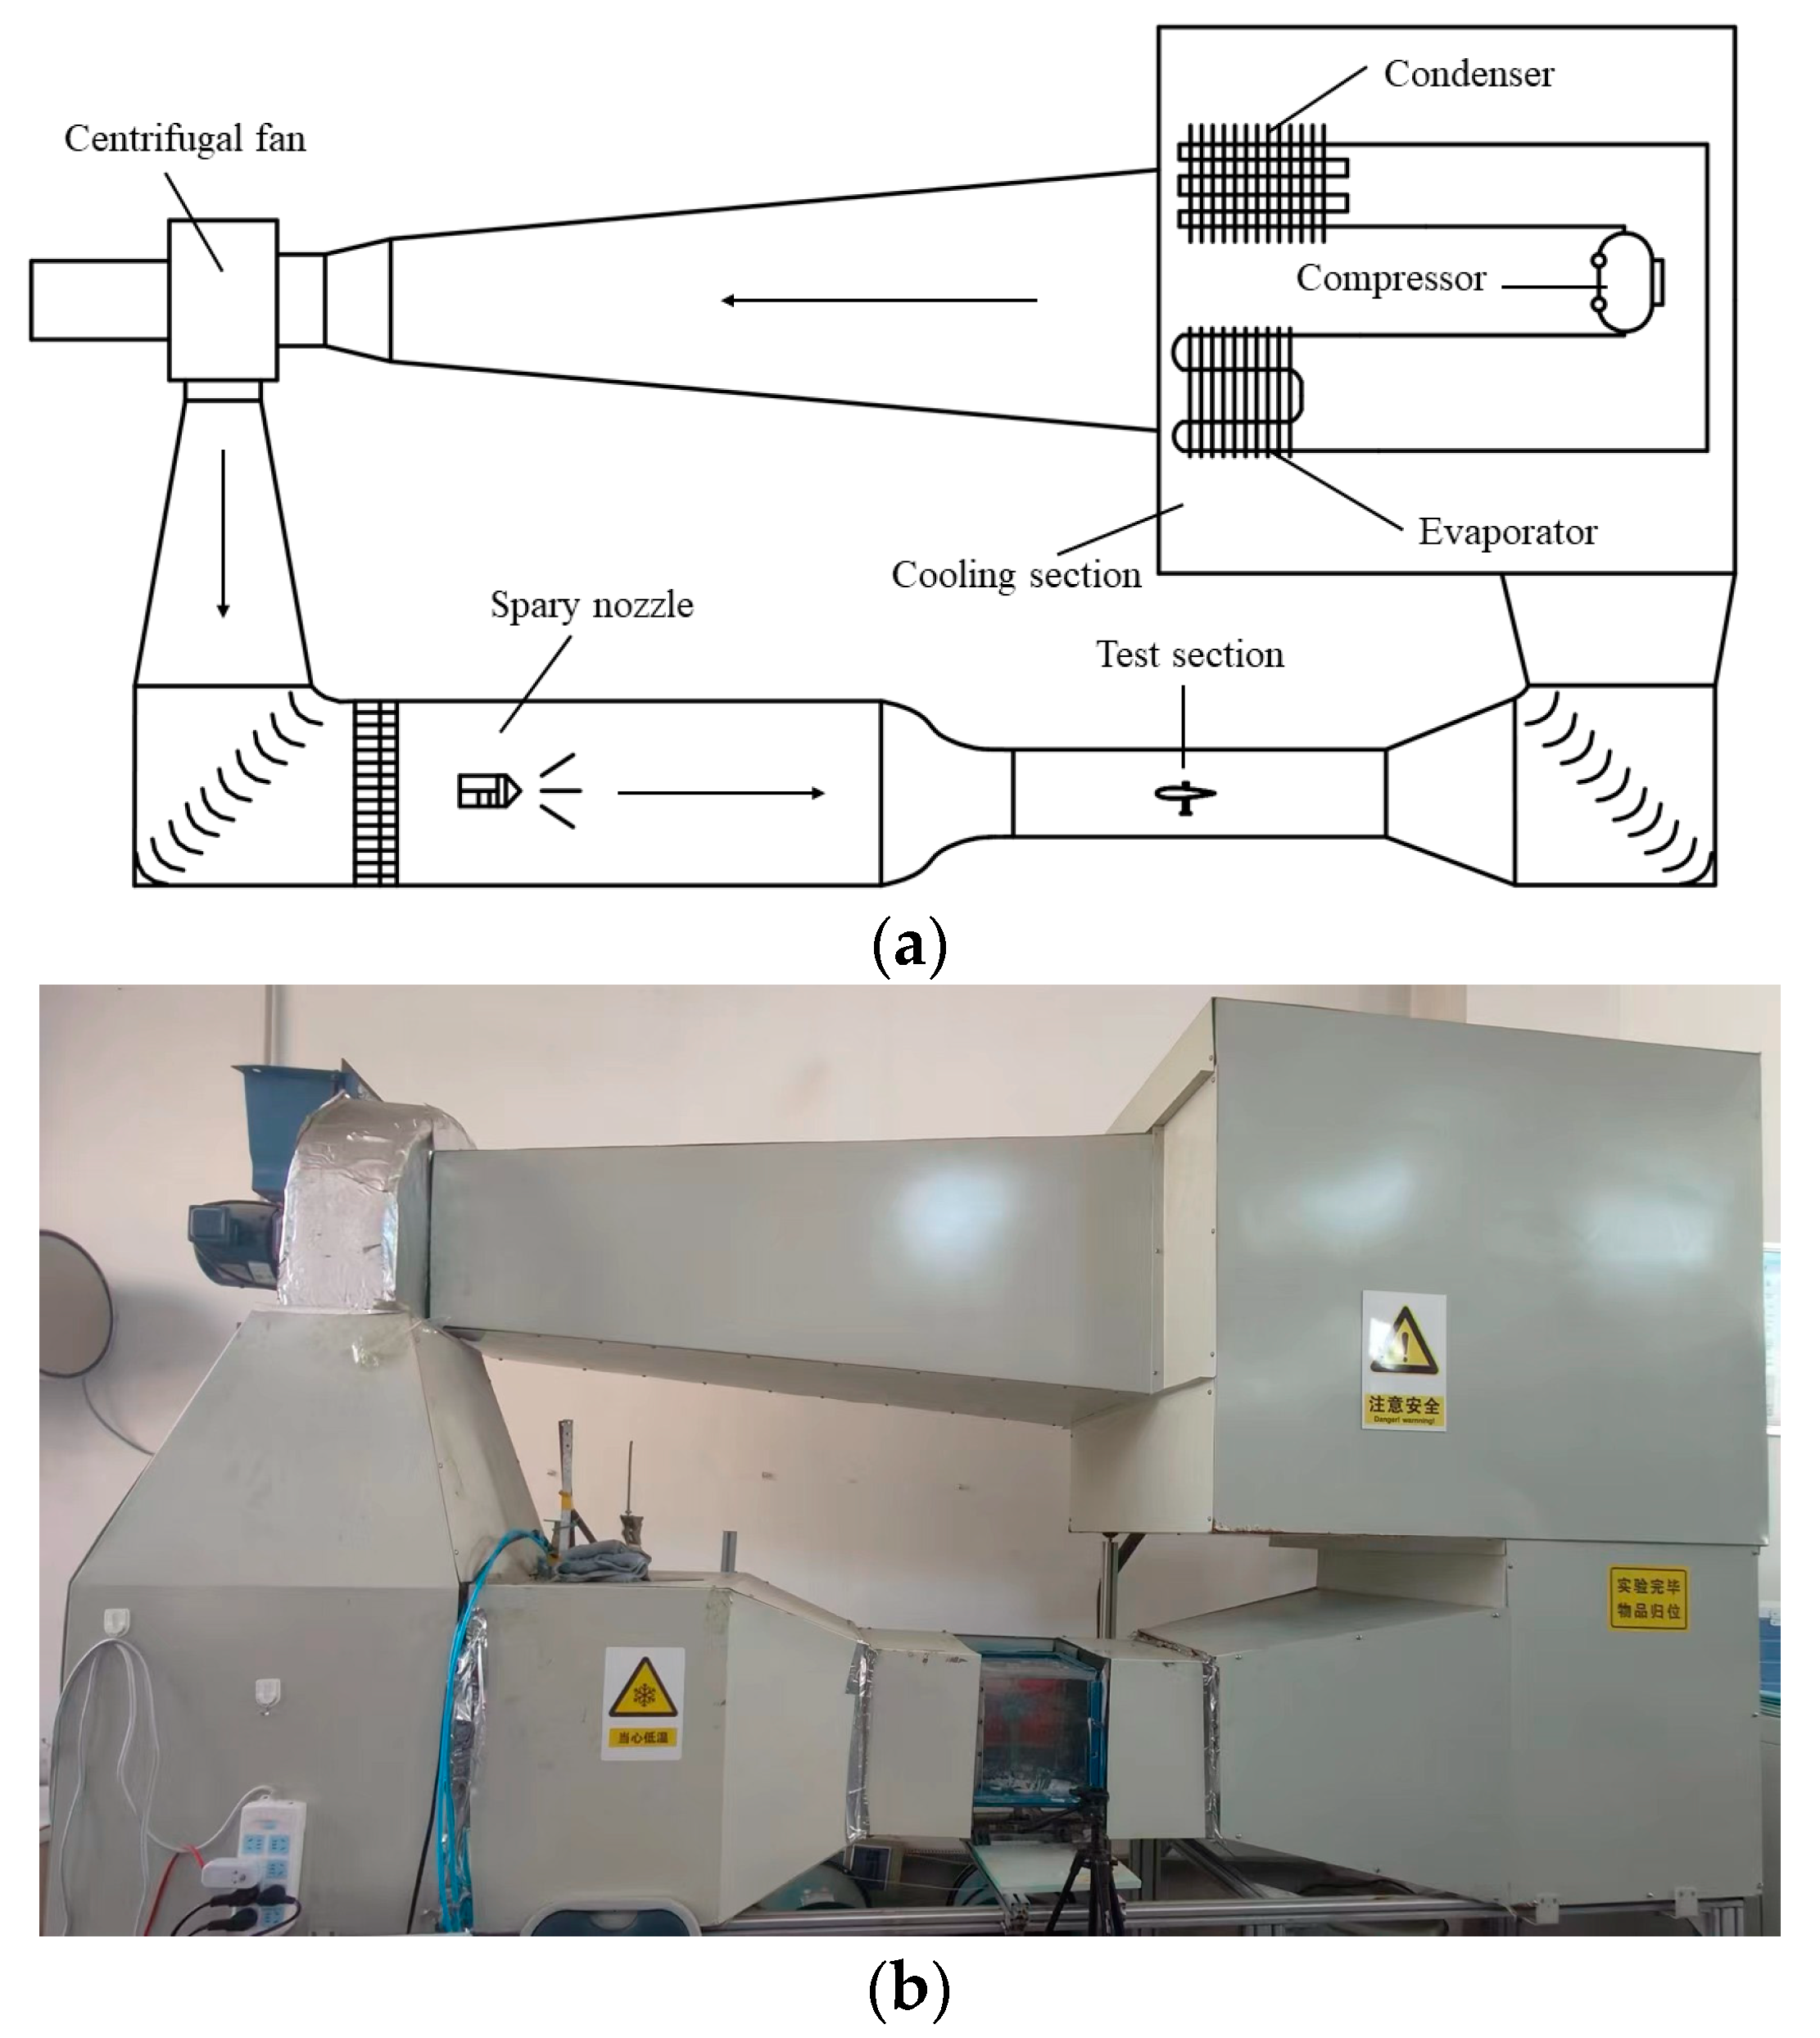
Figure 1. Reflux icing wind tunnel. (a) Schematic diagram; (b) Photo.
Coatings 14 00623 g001
Figure 2. Blade model and its schematic diagram.
Coatings 14 00623 g002
Figure 3. Schematic of angle of attack.
Coatings 14 00623 g003
Figure 4. Schematic of average icing thickness.
Coatings 14 00623 g004
Figure 5. Schematic diagram of the relative position of blade chord lengths.
Coatings 14 00623 g005
Figure 6. Schematic of net icing area.
Coatings 14 00623 g006
Figure 7. Effect of different chord lengths on the distribution of icing on the blade surface.
Coatings 14 00623 g007
Figure 8. Icing profiles of the blades with different chord lengths.
Coatings 14 00623 g008
Figure 9. Icing area for different chord lengths.
Coatings 14 00623 g009
Figure 10. Average icing thickness of blade with different chord lengths. (a) α = 0°; (b) α = 10°.
Coatings 14 00623 g010
Figure 11. The growth rate of the net icing area of blades with different chord lengths. (a) α = 0°; (b) α = 10°.
Coatings 14 00623 g011
Figure 12. Total icing area rate of blades with different chord lengths. (a) α = 0°; (b) α = 10°.
Coatings 14 00623 g012
Figure 13. Comparison of icing shape normalization under different conditions. (a) Condition 1; (b) Condition 2; (c) Condition 3; (d) Condition 4.
Coatings 14 00623 g013aCoatings 14 00623 g013b
Table 1. Test parameters.
Test ConditionsParameters
Temperature T/°C−10
Wind speed v/(m·s−1)10
LWC/(g·m−3)0.7
MVD/µm50
Chord length ci (i = 1, 2, 3, 4)/mm75, 100, 150, 200
AOA α/°0, 10
Test time t/min5
Sampling time interval ∆t/min1
Blade airfoilDU25
Table 2. Icing similarity test scheme.
Conditionv
/m·s−1
T
/°C
MVD
/µm
LWC
/g·m−3
Pressure
P/Pa
AirfoilAOA
α
Chord Length
c/mm
Icing Time/min
110−10500.71.01 × 106DU250c1, c32, 4
20c2, c42, 4
310c1, c32, 4
410c2, c42, 4
Table 3. Similarity of icing shape.
Condition1234
c (mm)c1c3c2c4c1c3c2c4
Sim84.06%84.38%86.99%88.72%
Disclaimer/Publisher’s Note: The statements, opinions and data contained in all publications are solely those of the individual author(s) and contributor(s) and not of MDPI and/or the editor(s). MDPI and/or the editor(s) disclaim responsibility for any injury to people or property resulting from any ideas, methods, instructions or products referred to in the content.