Article

Temperature–Power Simultaneous Effect on Physical Properties of BaxSr1−x TiO3 Thin Films Deposited by RF–Magnetron Cosputtering for 0 ≤ x ≤1

by
Juan Reséndiz-Muñoz
1,
Jorge Estrada-Martínez
2,3,
Miguel Ángel Meléndez-Lira
1,
Orlando Zelaya-Ángel
1,
José De Jesús Medel-Juárez
4,
Felipe Caballero-Briones
5 and
José Luis Fernández-Muñoz
2,*
1
Departamento de Física, CINVESTAV-IPN, Av. Instituto Politécnico Nacional 2508, Gustavo A. Madero, San Pedro Zacatenco, C.P. 07360 CDMX, Mexico
2
Laboratorio de Materiales Funcionales, Instituto Politécnico Nacional, CICATA-Legaría, Legaría 694 Col. Irrigación, C.P. 11500 CDMX, Mexico
3
Tecnológico Nacional de México, Instituto Tecnológico de Ciudad Madero, Centro de Investigación en Petroquímica Secundaria, Prol. Bahía de Aldhair y Av. de las Bahías, Parque de la Pequeña y Mediana Industria, Tecno, Altamira, C.P. 89440 Tamaulipas, Mexico
4
Laboratorio de Sistemas Inteligentes para la Automatización, Instituto Politécnico Nacional, CIC-IPN, Nueva Industrial Vallejo, C.P. 07738 CDMX, Mexico
5
Instituto Politécnico Nacional, Materiales y Tecnologías para Energía, Salud y Medioambiente (GESMAT), CICATA Altamira, Km 14.5, Carretera Tampico-Puerto Industrial Altamira, C.P. 89600 Altamira, Mexico
*
Author to whom correspondence should be addressed.
Coatings 2018, 8(10), 362; https://doi.org/10.3390/coatings8100362
Submission received: 21 August 2018 / Revised: 2 October 2018 / Accepted: 4 October 2018 / Published: 12 October 2018

Abstract

:
The combined effect on the variation of the in-situ deposition temperature and the variation of the applied power on the deposition rate (DR), gap energy (Eg), and resistivity (ρ) in barium strontium titanate thin films, deposited into RF (radio frequency)–magnetron cosputtering equipment, are presented in this research. The simultaneous action of two magnetrons (BaTiO3 and SrTiO3) is explained using the first and second derivative of Boltzmann’s sigmoidal equation. This found that a deposition gradient is a very novel analysis. Using the color-code lines built through MATLAB® and analyzing the trend information, taking into account the influence of the calculated “x” parameter, by means of the Boltzmann’s sigmoidal equation fit, we propose a method to set up an RF–magnetron cosputtering system to predict the DR(x,T), Eg(x,T), and ρ(x,T) values of BaxSr1−xTiO3 solid solutions with 0 ≤ x ≤ 1 for amorphous and crystalline phases. This method can be a versatile tool to optimize the deposition process with, or without, in situ deposition temperature.

1. Introduction

The solid solution BaxSr1−xTiO3 (BST) is a ceramic material with a perovskite structure, whose technological applications are extensive in the elaboration of optical devices, resistive memories, solar cells, and sensors, among others [1,2,3,4].
The effects of the stoichiometry defined by x and 1 − x parameters into the BST chemical formula have been investigated in some physical properties such as: Resistive switching [5,6], resistivity (ρ) in crystalline and amorphous phases [7,8,9], thickness [10], and band gap energy (Eg) [11,12,13]. Other properties widely studied are: Eg as a function of temperature and its effect on the improvement of crystallinity [14,15] and the amorphous to crystalline phase change [16,17,18], and the deposition rate (DR) and ρ values as a function of the applied power, for different deposition pressures in thin films of molybdenum by means of RF (radio frequency)–sputtering [19]. Based on a literature review, the combined effect of applied power and temperature ranges predict DR, Eg, and ρ values, taking into account an associated “x” parameter with values that cover 0 ≤ x ≤ 1 calculated by means of Boltzmann’s profile fit (BP), which have not yet been investigated hitherto.
The geometry between the magnetrons and the substrate, the gas pressure, the mass flow, and the percentage ratio of the Ar/O2 gases, the substrate temperature (in situ deposition temperature) and the applied power to the targets placed in each magnetron constitute the deposit system of RF–magnetron cosputtering. In this work, the applied power rates for each temperature remained constant, that is, the addition of the power applied to each target was constant.
This research represents an important step forward visualizing RF–magnetron cosputtering as a system to set up and provide a pathway to enable better control over BST thin film properties, such as stoichiometric content, Eg, thickness, and resistivity.

2. Experimental Details

BaxSr1−xTiO3 thin films were prepared through RF–magnetron cosputtering in a system equipped with two magnetrons, which can work simultaneously with different applied power: BaTiO3 (99.95%, SCI Engineered Materials Inc., Columbus, OH, USA) and SrTiO3 (99.9%, SCI Engineered Materials Inc.). The targets were 2” in diameter and had 0.125” thickness. Before thin film deposition, we evacuated the sputtering chamber until it reached a base pressure of around 1.2 × 10⁻³ Pa. Then, Ar flushing filled the chamber with a pressure of 3.9 Pa for 10 min. For the film substantial deposition, an Ar+/O2 gas mixture was introduced into the chamber with an Ar/O2 = 90/10 ratio at a 6.6 Pa initial pressure, igniting the plasma and performing a target presputtering for 15 min. After that, the working pressure was set at 3.9 Pa to carry out the deposition. Quartz substrates were rinsed with trichloroethylene, acetone, and ethanol before being deposited successively in 1 × 1.5 cm2. A stainless-steel substrate holder was fixed at 8 cm from the magnetron in an off-axis configuration. The substrate was rotated uniformly at 100 rpm, considering the substrate in situ temperature adjusted at: As-deposited, 375 °C, 435 °C, 495 °C, and 549 °C.
The total RF–magnetron applied power was 120 W, distributed between the two magnetrons as shown in Table 1, producing BaxSr1−xTiO3 films with different stoichiometric compositions. The sputter time for all samples was 68 min. Chemical composition was measured by means of energy dispersive X-ray spectroscopy (EDS) employing a Jeol JSM-5300 electron microscope (JEOL USA Inc., Peabody, MA, USA) equipped with a Kevex Delta 1 spectrometer. The optical transmission films spectra were obtained in a Perkin–Elmer (Waltham, MA, USA), Lambda 40 Spectrophotometer in a range between 250 and 800 nm. For the thicknesses of films, the transmittance spectra was employed, and the calculation was carried out using the SCOUT® 98 software. The X-ray diffract-grams (XRD) were acquired in a Phillips X’Pert diffractometer (JEOL USA Inc., Peabody, MA, USA) using Cu Kα = 1.54060 Å. The total applied power on both BaTiO3 and SrTiO3 targets for every discrete experiment required 120 W. Figures 1–3, 5–8 and 10 were made by Origin Pro 8.6 and Figures 4, 9 and 11 made by MATLAB® (version 7.5.0 R2007b).

3. Mathematical Model

An analysis of the experimental data point with applied mathematical models reported in literature on transition phenomena indicates the presence of patterns in their physical behavior and geometric descriptions. For instance, sigmoidal profile or patterns and inflection points are observed in the same transitions. Furthermore, if the development changes from continuous to discontinuous at the inflection point, the inflection point may correspond to the critical stage. The sigmoidal mathematical model (proposed by Boltzmann in 1879) was based on the following sigmoidal logistic Equation (1) [10]:
  y ( x ) = [ 1 1 + e x ]  
Equation (1) has been used to describe behaviors exhibited when a certain factor triggers a transition (reversible or not) from a steady state to another one [10].
Since the Ba concentration in the BaxSr1−xTiO3 solid solution as a function of the applied power follows a sigmoidal path, it is assumed that this curve can be fitted by means of Boltzmann’s sigmoidal equation, where the original function has been modified to contain the required geometric characteristics shown in Equation (2).
  y ( x ) = y f [ y f + y i A + e α ]  
In this work, Equation (2) is transformed by Equation (3):
  x ( p i ) = x f [ Δ x 1 + e Δ p i / α ]  
Here, x is the parameter in the BaxSr1−xTiO3 chemical formula, pi (0–120 W) the applied power on targets, and p0 is the applied power when x = 0.5 and 1 − x = 0.5, and α (applied power units) is a coefficient that describes the behavior of the slope process during the transition line from xi to xf. Thus, taking into account Equation (2), A = 1 because it is a continuous process.
Additionally, xi is the initial value, and xf is the final value and constants; Δx = xfxi, Δpi = pip0. Next, x’(Pi), Equation (4), and x”(Pi), Equation (5) represent the first and second derivatives of Equation (3), respectively:
  x ( p i ) = 1 α Δ x   e Δ P i / α ( 1 + e Δ P i / α ) 2  
  x ( p i ) = 1 α 2 Δ x   e Δ P i / α ( 1 + e Δ P i / α ) 2 2 Δ x   e 2 Δ P i / α α 2 ( 1 + e Δ P i / α ) 3  
The first derivative describes the deposition rate as a function of the applied power, having a maximum in x ( p 0 ) = ( x f + x i ) / 2 = 0.5 ;   x m a x ( p 0 ) = x / 4 α   . The second derivative can consider the minimum gradient value in   x m i n ( p 0 ) = 0 .

4. Results and Discussion

Figure 1 shows “x” and “1 − x” discrete experimental parameters obtained from EDS measurements; the colored solid lines represent the Boltzmann’s profile fit for each deposition in situ temperature, obtained through employing the best fitting of experimental data, using Equation (3). The BST/Quartz deposition effect can explain the difference among them at a glance on the films-rich zones of BaTiO3 and SrTiO3. This is due to the substrate effects and plasma geometry into the RF–sputtering deposition system, causing a differentiated distribution on substrate [20], such as what happens in thin films deposited by the direct current arc discharge plasma process [21].
The experimental “x” parameter values to build Figure 2 was taken thus: BST/Nichrome 495 °C (BPEDS) [6] is the Boltzmann’s profile fit, whose discrete experimental points were obtained by means of EDS measurements, and BST/Quartz 549 °C (BPXRD) [13] is the Boltzmann’s profile fit whose discrete experimental points were calculated from XRD reflection patterns of Samples S1–S9 (see Table 1) and T = 549 °C. BPAvT (BST/Quartz) is obtained from the experimental values of the “x” parameter calculated by averaging values of deposition at different temperatures: As-deposited, 375 °C, 435 °C, 495 °C, and 549 °C (see Table 2).
Figure 2a shows BPXRD, BPEDS, and BPAvT fits, whose experimental parameters were the same, except the deposition in situ temperature.
Comparing BPEDS and BPAvT, the substrate effect on the Ba/Sr ratio is evident. Assuming that the interface between the substrate and the film has no decisive influence on the Ba/Sr stoichiometric ratio and that “x” parameter measurements using XRD for the same thin films are more accurate than measurements by means of EDS [13], it is possible to associate each “x” value (obtained from BPXRD) with each applied power value, that is, xi with a specific value of the applied power pi. In turn, each pi can be associated to particular values of DR, Eg, and ρ (we can see in the next figures, respectively).
Figure 2b BPXRD (first derivative) represents the maximum peak, having a stoichiometric equilibrium ratio for Ba/Sr = 50%/50% (or x = 0.5 inside of the BaxSr1−xTiO3 chemical formula) using the simultaneously applied power ratio ≈ 45/75 (target one/target two). Figure 2c (BPXRD second derivative) represents the stoichiometric difference related to Δ(Sr − Ba)/Δ(P2P1) gradient. The positive gradient corresponds to the zone with Sr excess (ΔPSr ≈ 120 − 75 ≈ 45 for target one) and the negative gradient to the region with Ba excess (ΔPBa ≈ 120 − 45 ≈ 75 for target two). The area under the curve (ΔPSr, ymax) defines the magnitude of Sr excess that reaches a maximum peak and decreases until Δ(Sr − Ba) = 0. The negative gradient with an area above the curve (ΔPBa, ymin) is similarly interpreted. The BP second derivative helps to understand the joint operation of two magnetrons and deposit stages, where Ba has a higher sputtering yield than that of Sr due to its higher ionic radius. Accordingly, the highest content of Sr in the graphics made in MATLAB® (version 7.5.0 R2007b) in the range of 0–45 W and with a higher Ba content in the interval of 45–120 W, as will be shown.
Figure 3 shows DR discrete experimental values for each temperature: As-deposited, 375 °C, 495 °C, 549 °C, which follow an experimental equation shown in Equation (6):
  Y ( P ) = D R 0 + A e P / β  
where Y ( P ) is described as D R = d l / d t , l is thickness, and Y ( 0 ) = D R 0 is the Sr maximum deposition rate when simultaneous RF–magnetron applied power on two targets 0 W (BaTiO3) and 120 W (SrTiO3). A and β are adjustment constants and P is the applied power. In the DR average fit (discrete experimental data), the deposition ratio Ba/Sr ≈ 3/1 (value experimentally obtained) corresponds to maximum and minimum points (to applied 120 W on target one and 120 W on target two), respectively.
The inset in Figure 3 shows the DR vs. BP fit for 435 °C. This behavior is due to the fact that the erosion rate may vary when the reactive gas supply stays constant [20]. As is seen below, this in situ temperature is critical in the transition from the amorphous to the crystalline phases.
Figure 4 represents the DR projection values plot as a function of applied power and in situ temperature ranges. The ISO (isolines) prefix means that every different color line has the same value. The ISO color lines for DR (ISO–DR) indicate that DR decreases when the temperature ranges and Sr content also increase. Mainly, it is notorious when applied power = 45−120 W (BaTiO3 45–120 W and SrTiO3 0–75 W) and 435–549 °C in situ temperature ranges occur. The highest DR values are achieved in the applied power and temperature ranges established in 105–120 W and <375 °C, respectively. The temperature ranges 375–460 °C show an instability region by the transition from the amorphous to the crystalline phase. When the deposition temperature increases, the DR profile decreases. This condition can be explained by Ideal Gases Law (IGL) (PV = nRT), where “n” is an ionized argon atoms number; when a deposition in situ temperature increases, the working pressure also increases. For the system to keep constant, the reactive gas flow must decrease [20].
Figure 5a shows the transition of the amorphous to the crystalline phases for Sample S5, and the presence of the BST amorphous phase can be seen when the temperature has reached 549 °C (see 2θ ≈ 21.5°). The size peaks increase when the temperature also increases also (see 435 °C, 495 °C, 549 °C). A similar analysis can be made with Figure 5b, where the sample is S7.
In Table 1, we can see the applied power ratios 60/60 W (BaTiO3/SrTiO3 targets) and 90/30 W (BaTiO3/SrTiO3 targets), corresponding to S5 and S7 Samples, respectively. Seeing BPXRD in Figure 2a, the “x” parameter value represents the Ba content in the BST chemical formula. On the planes (110), where 2θ ≈ 31.5° of both samples, peak intensity is higher in Sample S7 compared to Sample S5, (a similar analysis can be made for all planes); therefore, the highest content of Ba favored crystallinity in BST films.
As can be seen in 549 °C Samples S5 and S7, new peaks appear in 2θ ≈ 28° and 2θ ≈ 34.5°, corresponding to planes (032) and (031), respectively. Both peaks are orthorhombic phases according to American Ceramic Society, “Orthorhombic phase BST-SS PDF Card 130522 J, “Kwestroo, Paping, 1959.
The other peaks are cubic phases, 2θ ≈ 38.5°, 2θ ≈ 45°, 2θ ≈ 50°, 2θ ≈ 55°corresponding to planes (111), (200), (210), and (211), respectively. The smallest peak, 2θ ≈ 58°, corresponds to plane (211) tetragonal phase according to International Centre for Diffraction Data (ICDD), “PDF cards 00-040-1500 (STO); 00-075-0215 (BTO); 00-034-0411 (BST-SS with x = 0.6)”, (1982–1997).
These results show that, beyond the amorphous phase, crystallinity has not been stabilized yet.
Figure 6a,b shows the transmittance spectrum and Tauc’s plot, respectively, of Samples S1–S9 at as-deposited temperature. Sample S1 (applied power ratio 0/120 of BaTiO3/ SrTiO3 targets) only contains SrTiO3, and Sample S9 (applied power ratio 120/0 of BaTiO3/ SrTiO3 targets) only contains BaTiO3). Therefore, it shows the Eg value decreasing when the Ba content is increasing.
Figure 7a,b shows the transmittance spectrum of Samples S5 and S7 (as-deposited temperature and 495 °C, respectively). Z1–Z5 are five different zones measured in every sample.
The difference in transmission percentage in the different zones of both samples can mainly be caused by the amorphous phase and different contents of Ba and Sr for every zone into BST films. The films thickness is uniform enough and it does not influence these results sensitively.
Figure 8 shows the Eg values for Samples S1–S9 and temperatures: As-deposited (50 °C as reference), 375 °C, 435 °C, 495 °C, and 549 °C. The broken red lines represent the lowest and highest Eg values of the BST referenced in literature and define the transition zone between the amorphous and crystalline phases. The solid line is the BP fit of the Eg average at each temperature. From the experimental data, Eg decreases when the temperature increases, according to [14,15,17]. The results of XRD confirm some samples for the temperatures 375 °C, 435 °C, 495 °C, and 549 °C having different crystallinity degrees, which suggests the presence of both crystalline and amorphous phases. In addition, the improvement in crystallinity increases with the temperature. The difference in amorphous and crystalline Eg values suggests there may be band bending in the amorphous phase and decreasing with increasing temperature to crystallinity. The reduction in the Eg with increasing crystallinity indicates that a long-range order and crystal size influence the separation between the levels of the oxygen and titanium ions.
The Eg values used in this work were taken from the literature [22,23,24]. The authors explain these differences due to: (a) The change in crystal structure [11]; (b) phase change [15]; (c) the increase in interatomic space due to excess volume and absence of long-range order in the lattice, in addition to the Bupein–Moss effect due to oxygen vacancies [14]; (d) the change in the size of the microstructure [16]; and (e) the presence of amorphous material and the effect of quantum size [25,26,27,28].
For the temperature of 549 °C, the XRD spectrum (see Figure 5) defines a polycrystalline film with cubic, tetragonal, and orthorhombic phases [13]. These results suggest that the crystalline structure passes through a transition state to achieve stability, and that Eg values can decrease with higher deposition temperatures.
Figure 9 represents the Eg projection values plot of applied power and temperature ranges. The ISO (isolines) color lines for Eg (ISO–Eg) show a transition zone with the highest Eg values in the applied power 45–60 W and temperature 375–495 °C ranges. These zones are transitions between the amorphous and crystalline phases, shown in Figure 8 and confirmed by XRD. The Eg value is affected by the stoichiometric ratio of Sr-rich and/or Ba-rich areas, from where the transmission spectrum was taken.
The trend when “x” increases is according to [11,12,13,22], that is, Eg decreases. However, this behavior is not always the same; for example, when comparing Eg between 375–495 °C and 45–75 W, the behavior is different. In Figure 5a,b, it is verified that the more significant content of Sr favors the amorphous phase, and therefore, the increase in the Eg value.
Table 3 shows the applied power ratio and temperature relationships concerning the “x” parameter, where the ISO–Eg found the Eg and “x” parameter values according to [11,14,15,16,17,18,25,26,27,28] for amorphous and crystalline phases. The Eg values obtained are very close to those in literature (see Ref.).
Figure 10 shows ρ values concerning Samples S1–S9 for all temperatures studied. The profile of the S-shaped ρ average is very similar to that of BP, which reports the compositions of “x” from 10% to 70%, and temperatures oscillating between −150 and 150 °C [7]. In the bottom-values of ρ for all compositions, the effect of the temperature from as-deposited up to 375 °C influences the result, since the change from an amorphous to a crystalline phase occurs in that temperature interval. It is evident that, at 375 °C, there is a much more marked transition into phases.
Figure 11 represents the Eg projection values plot of applied power and temperature ranges. The ISO color lines for ρ (ISO–ρ), show a tendency towards higher values of ρ when the temperature and Sr content increases [14], particularly when applying power of 0–45 W and temperature of 495–549 °C. The applied power and temperature ranges would indicate conductivity (into the white zone) and the necessity for more samples and measurements. Other authors reported only lower resistivity when Sr increased [15,20].
Table 4 shows the DR, Eg, and ρ maximum and minimum values (ρ with normalized values) in the ranges where Sr and Ba have the largest content, that is, applied power ranges of 0–45 W and 45–120 W, respectively, into deposition temperature of 375–435 °C, 435–495 °C, and 495–549 °C. This analysis projects the content of the “x” parameter through the ISO lines to interpret the values of DR(x,T), Eg(x,T), and, ρ(x,T).
Therefore, the analysis of the maximum (Max.) and minimum (Min.) values for material properties confirm the trends mentioned in this research work:
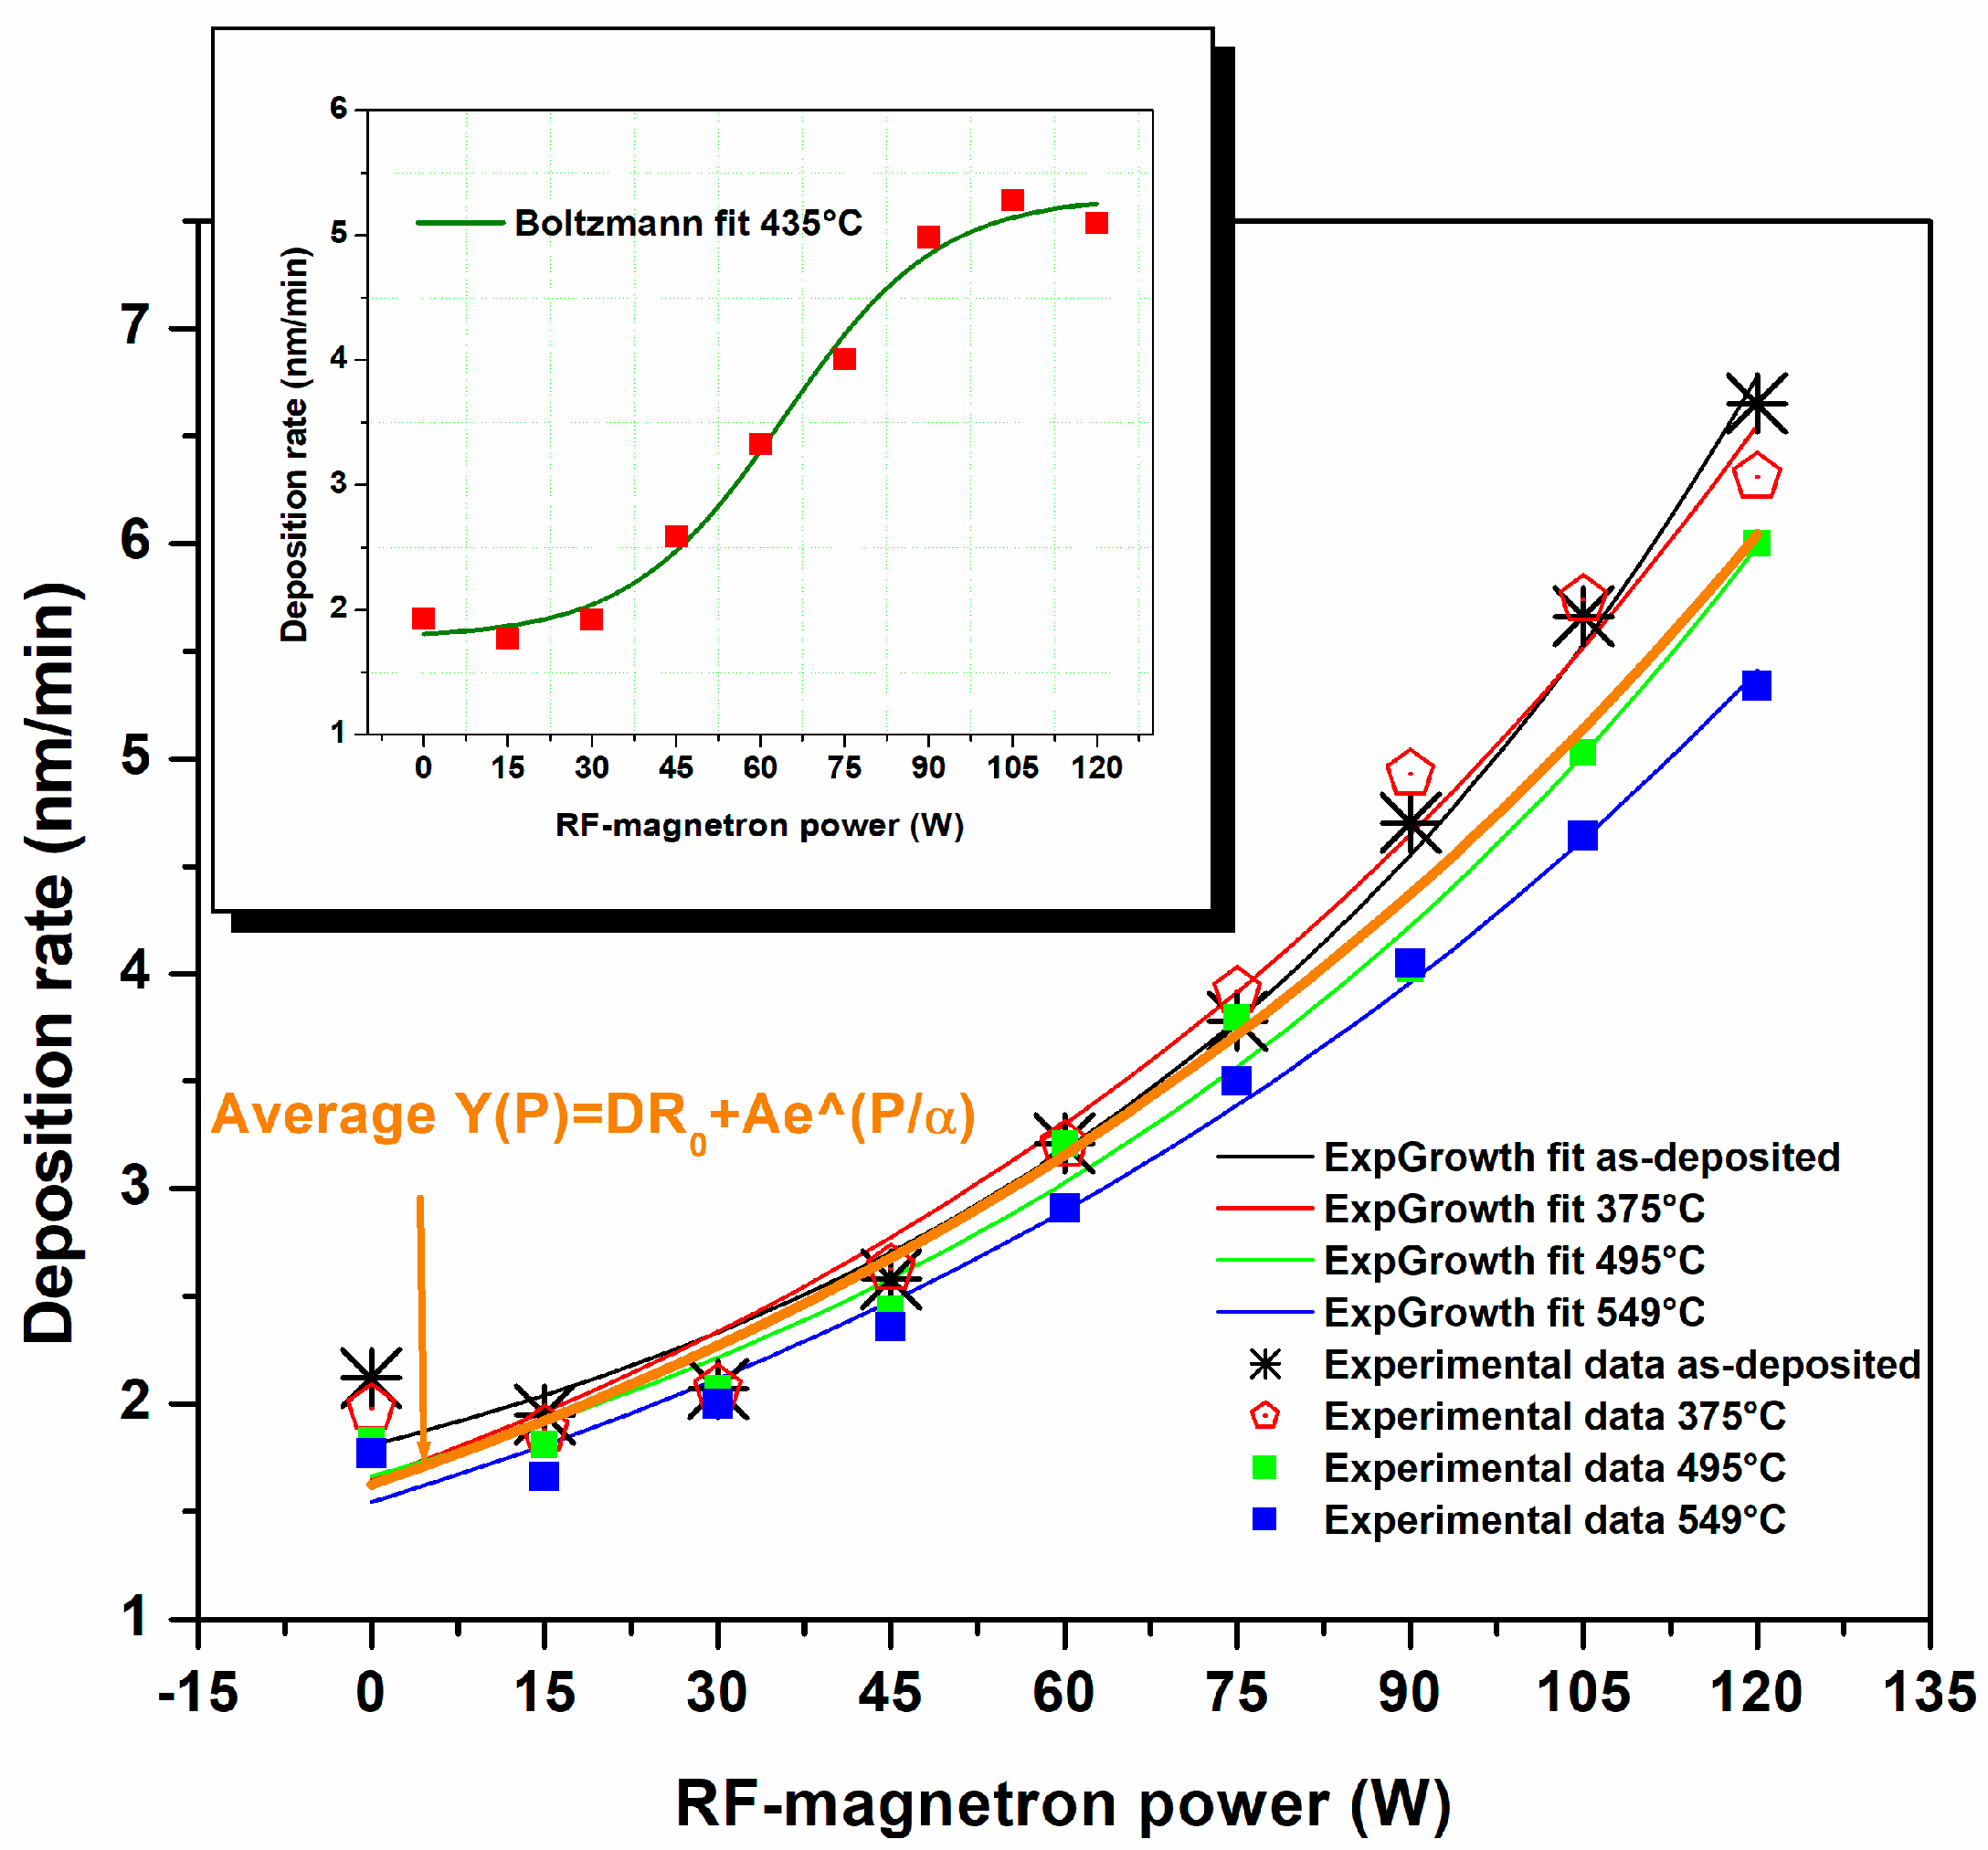
  • DR values decrease when temperatures increase and when Sr and Ba content also decreases;
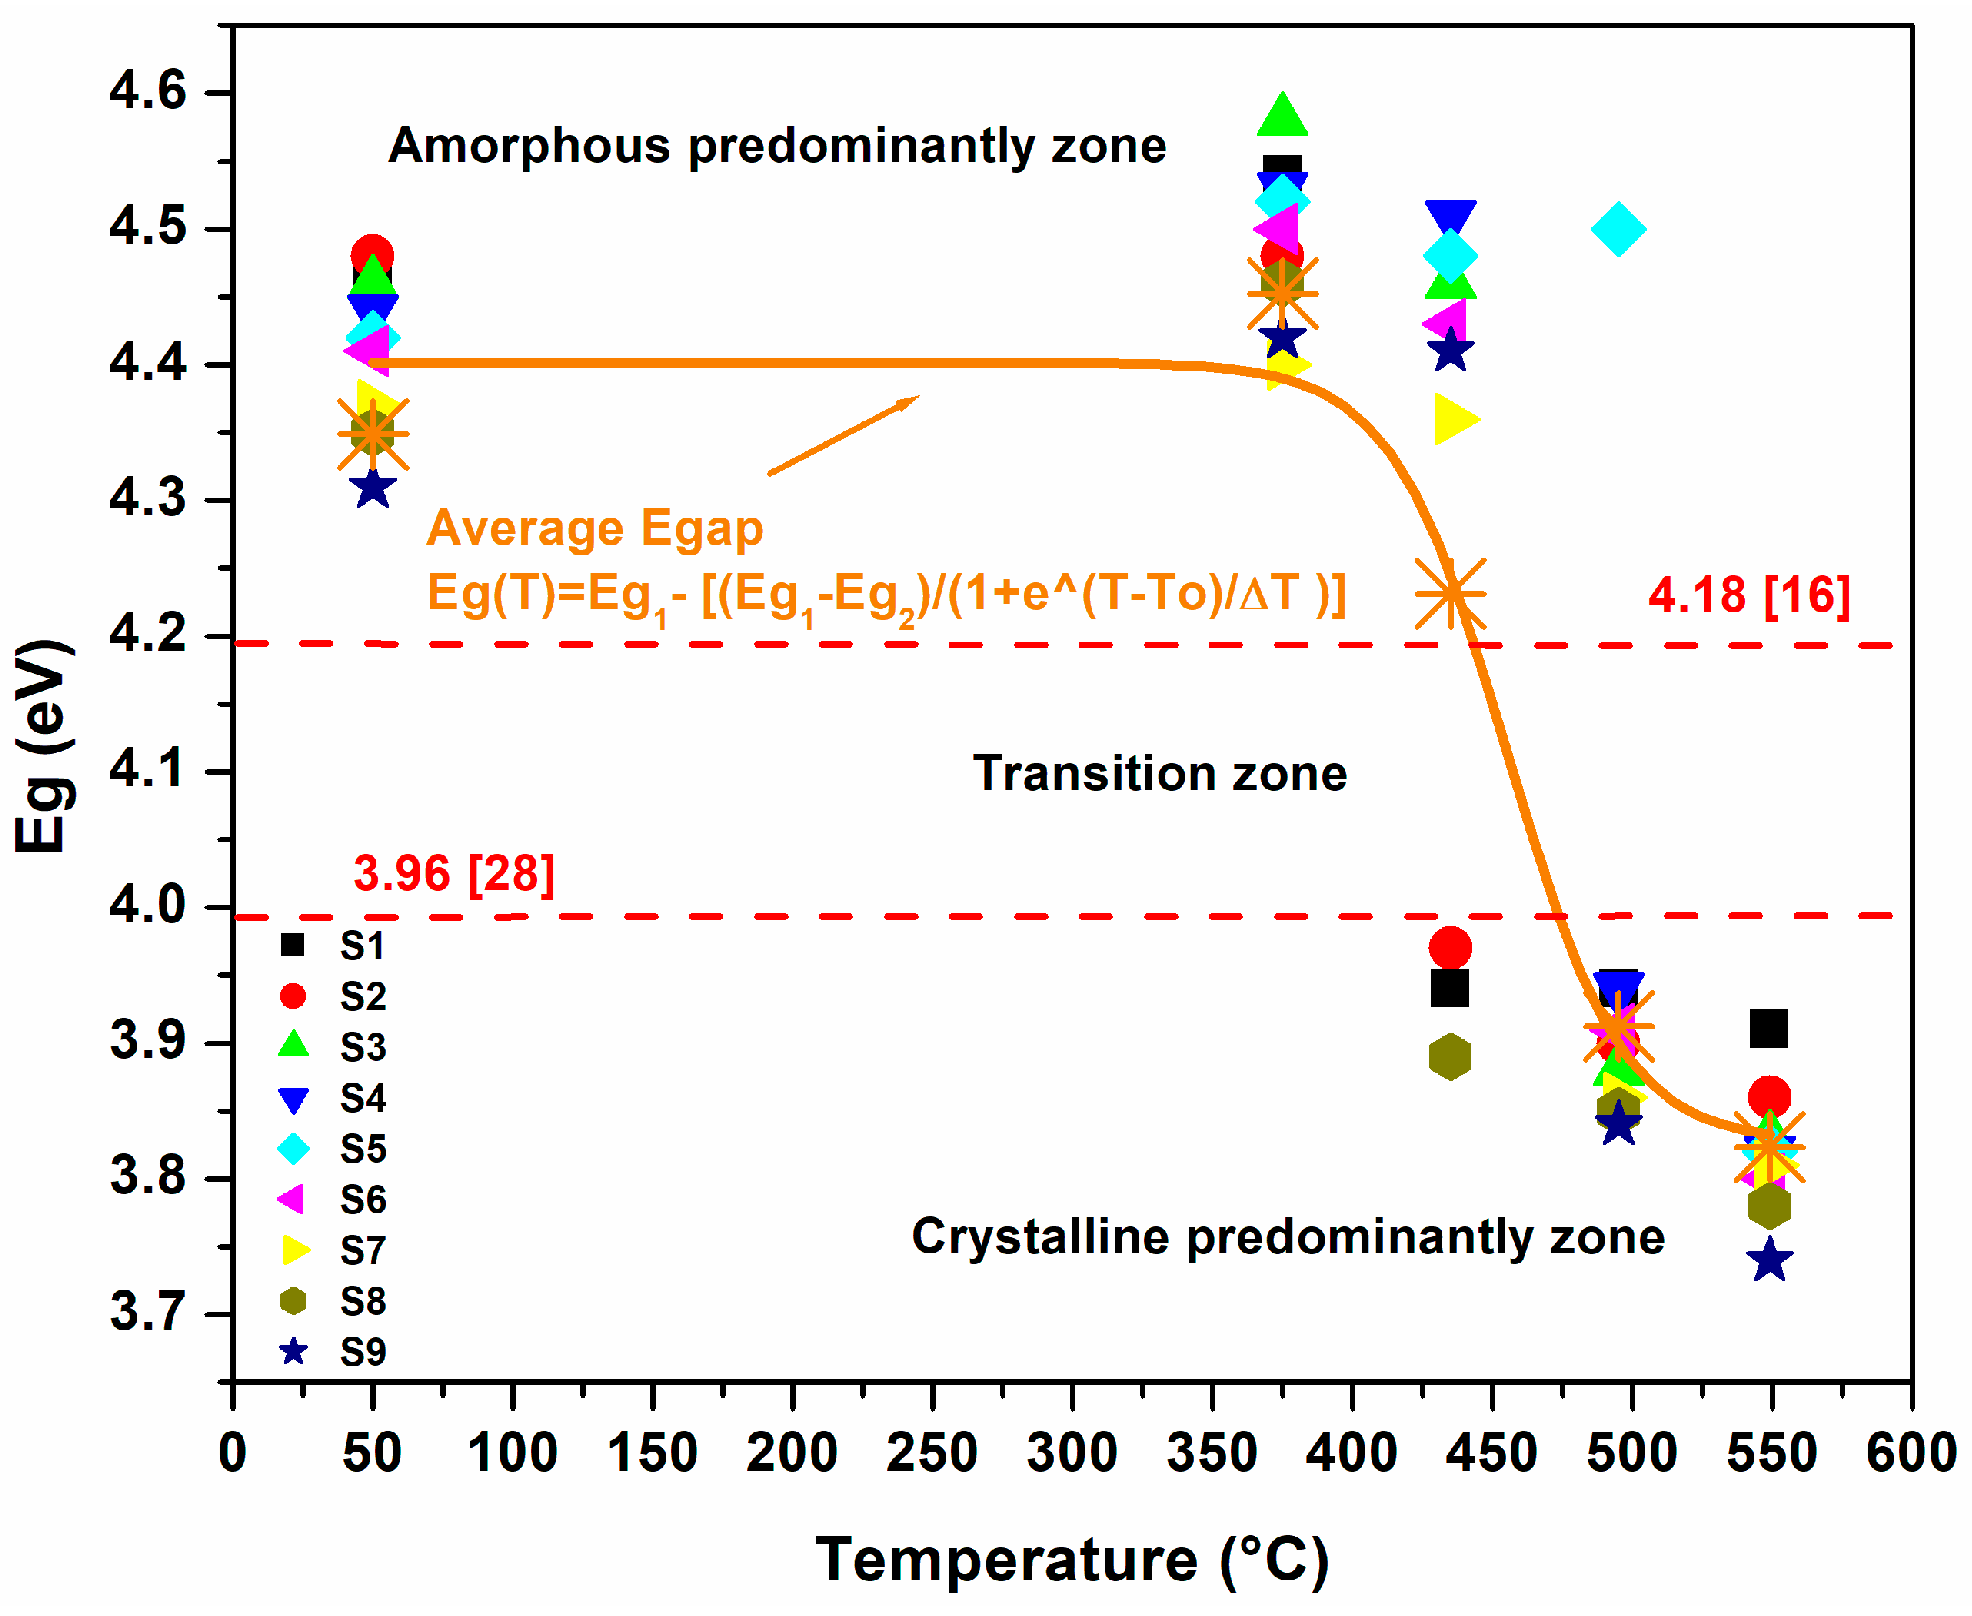
  • Eg values increase when Sr content also increases;
  • Eg values decrease when temperatures increase due to crystallinity improvement;
  • ρ values increase when Sr content also increases;
  • ρ values increase when temperatures increase due to crystallinity improvement.
Thus, these results show that this method satisfactorily predicts the trends of those values in literature related with the “x” parameter and deposition temperature.

5. Conclusions

The analysis of the combined effect of applied power and temperature shows that the tendencies in the Eg(x,T) and the ρ(x,T) values in our BST thin films have concordance with previous literature. It also establishes the effect of the “x” parameter (0 ≤ x ≤1) in temperature ranges that start from the amorphous to the crystalline phase. The analysis of the trend of DR(x,T) values under the same combined effect is entirely new and shows that the system tends to lower DR values when the deposition temperature increases.
The methodology of experimentation and analysis allows a correct interpretation of the RF–magnetron cosputtering system and can generate a greater experimental efficiency to obtain a stable crystalline phase in BST films with in situ deposit temperature. Furthermore, it probably can be used on quaternary materials deposition.
This methodology can be applied to control material properties through parameters such as gas pressure and the Ar/O2 ratio variables.
The BP is present in the system as follows: “x” parameter vs. applied power for amorphous and crystalline phases, Eg vs. T (°C) for the transition between amorphous and crystalline phases, Eg vs. “x” parameter for the crystalline phase. The “S” shape of ρ vs. T (°C) contains the BP for the transition from amorphous to the crystalline phase.

Author Contributions

Conceptualization, J.R.-M. and J.L.F.-M.; Methodology, J.R.-M.; Software, J.L.F.-M.; Validation, O.Z.-Á. and J.d.J.-M.-J.; Formal Analysis, M.Á.M.-L.; Investigation, J.R.-M.; Resources, J.E.-M. and F.C.-B.; Data Curation, J.d.J.-M.-J. and F.C.-B.; Writing–Original Draft Preparation, J.R.-M.; Writing–Review & Editing, M.Á.M.-L.; Visualization, J.E.-M.; Supervision, O.Z.-Á.; Project Administration, J.L.F.-M.; Funding Acquisition, J.L.F.-M., F.C.-B. and M.Á.M.-L.

Funding

The research was funded by SIP–IPN Multidisciplinary (20170215, 20181187, 20181196 and 20180397), EDI, SIBE–IPN and SIBE–IPN grants Instituto Politécnico Nacional.

Acknowledgments

Juan Reséndiz-Muñoz acknowledge to Marcela Guerrero at CINVESTAV-IPN, and Erwin Gómez at CICATA-Legaria for their technical assistance.

Conflicts of Interest

The authors declare that there is no conflict of interests regarding the publication of this paper.

References

  1. Bussmann-Holder, A. The polarizability model for ferroelectricity in perovskite oxides. J. Phys. Condens. Matter 2012, 24, 273202. [Google Scholar] [CrossRef] [PubMed] [Green Version]
  2. Dubourdieu, C.; Bruley, J.; Arruda, T.M.; Posadas, A.; Jordan-Sweet, J.; Frank, M.M.; Cartier, E.; Frank, D.J.; Kalinin, S.V.; Demkov, A.A.; et al. Switching of ferroelectric polarization in epitaxial BaTiO3 films on silicon without a conducting bottom electrode. Nat. Nanotechnol. 2013, 8, 748–754. [Google Scholar] [CrossRef] [PubMed]
  3. Agar, J.C.; Pandya, S.; Xu, R.; Yadav, A.K.; Liu, Z.; Angsten, T.; Saremi, S.; Asta, M.; Ramesh, R.; Martin, L.W. Frontiers in strain-engineered multifunctional ferroic materials. MRS Commun. 2016, 6, 151–166. [Google Scholar] [CrossRef] [Green Version]
  4. Liu, S.; Xu, C.; Zeng, X.; Shi, J.; Zhao, B. Preparation of (Ba0.67Sr0.33)TiO3 thin films for the dielectric bolometer mode of uncooled infrared focal plane arrays. Phys. Status Solidi A 2002, 194, 64–70. [Google Scholar] [CrossRef]
  5. Zapata-Navarro, A.; Márquez-Herrera, A.; Cruz-Jáuregui, M.P.; Calzada, M.L. Ferroelectric properties of barium strontium titanate thin films grown by RF co-sputtering. Phys. Status Solidi C 2005, 2, 3673–3676. [Google Scholar] [CrossRef]
  6. Márquez-Herrera, A.; Hernández-Rodríguez, E.; Cruz, M.P.; Calzadilla-Amaya, O.; Meléndez-Lira, M.; Guillén-Rodríguez, J.; Zapata-Torres, M. Electrical properties of resistive switches based on Ba1−xSrxTiO3 thin films prepared by RF co-sputtering. Rev. Mex. Física 2010, 56, 401–405. [Google Scholar]
  7. Moure, J.C. El titanato de bario como material semiconductor. Bol. Soc. Esp. Ceram. Vidr. 1994, 18, 389–395. [Google Scholar]
  8. Panda, B.; Roy, A.; Dhar, A.; Ray, S.K. Thickness and temperature dependent electrical characteristics of crystalline BaxSr1−xTiO3 thin films. J. Appl. Phys. 2007, 101, 064116. [Google Scholar] [CrossRef]
  9. Patil, D.R.; Lokare, S.A.; Devan, R.S.; Chougule, S.S.; Kanamadi, C.M.; Kolekar, Y.D.; Chougule, B.K. Studies on electrical and dielectric properties of Ba1−xSrxTiO3. Mater. Chem. Phys. 2007, 104, 254–257. [Google Scholar] [CrossRef]
  10. Reséndiz-Muñoz, J.; Corona-Rivera, M.A.; Fernández-Muñoz, J.L.; Zapata-Torres, M.; Márquez-Herrera, A.; Ovando-Medina, V.M. Mathematical model of Boltzmann’s sigmoidal equation applicable to the set-up of the RF-magnetron co-sputtering in thin films deposition of. BaxSr1−xTiO3. Bull. Mater. Sci. 2017, 40, 1043–1047. [Google Scholar] [CrossRef]
  11. Wang, G.; Zhang, Y.; Mao, C.; Dong, X.; Chu, J. Composition dependence of structural and optical properties for sol-gel derived (100)-oriented Ba1−x SrxTiO3 thin films. Appl. Phys. Lett. 2007, 91, 061104. [Google Scholar] [CrossRef]
  12. Leng, W.; Yang, C.; Zhang, J.; Chen, H.; Ji, H.; Fu, C.; Liao, J. Structural and optical properties of BaxSr1−xTiO3 thin films on indium tin oxide/quartz substrates prepared by radio-frequency magnetron sputtering. J. Appl. Phys. 2006, 99, 114904. [Google Scholar] [CrossRef]
  13. Reséndiz-Muñoz, J.; Fernández-Muñoz, J.L.; Corona-Rivera, M.A.; Zapata-Torres, M.; Márquez-Herrera, A.; Meléndez-Lira, M.; Caballero-Briones, F.; Chale-Lara, F.; Zelaya-Ángel, O. Stoichiometry calculation in BaxSr1−xTiO3 solid solution thin films, prepared by RF cosputtering, using X-Ray diffraction peak positions and Boltzmann sigmoidal modelling. J. Nanomater. 2017, 2017, 4308294. [Google Scholar] [CrossRef]
  14. Roy, S.C.; Sharma, G.L.; Bhatnagar, M.C. Large blue shift in the optical band-gap of sol-gel derived Ba0.5Sr0.5TiO3 thin films. Solid State Commun. 2007, 141, 243–247. [Google Scholar] [CrossRef]
  15. Železný, V.; Chvostová, D.; Pajasová, L.; Jelínek, M.; Kocourek, T.; Daniš, S.; Valvoda, V. Temperature dependence of the optical properties of Ba0.75Sr0.25TiO3 thin films. Thin Solid Films 2014, 571, 416–419. [Google Scholar] [CrossRef]
  16. Wang, J.; Huang, L.; Xie, Y.; Hua, Q.; Bai, L. Effect of sputtering pressure on the optical properties of BST thin films. J. Northeast. Univ. 2010, 31, 68–70. [Google Scholar]
  17. Singh, S.B.; Sharma, H.B.; Sarma, H.N.K.; Phanjoubam, S. Influence of crystallisation on the spectral features of nano-sized ferroelectric barium strontium titanate (Ba0.7Sr0.3TiO3) thin films. Phys. B Condens. Matter 2008, 403, 2678–2683. [Google Scholar] [CrossRef]
  18. Saravanan, K.V.; Sudheendran, K.; Krishna, M.G.; Raju, K.J.; Bhatnagar, A.K. Effect of process parameters and post-deposition annealing on the optical, structural and microwave dielectric properties of RF magnetron sputtered (Ba0.5,Sr0.5)TiO3 thin films. Vacuum 2006, 81, 307–316. [Google Scholar] [CrossRef]
  19. Wang, S.-F.; Yang, H.-C.; Liu, C.-F.; Bor, H.-Y.Y. Characteristics of bilayer molybdenum films deposited using RF sputtering for back contact of thin film solar cells. Adv. Mater. Sci. Eng. 2014, 2014, 531401. [Google Scholar] [CrossRef]
  20. Berg, S.; Nyberg, T. Fundamental understanding and modeling of reactive sputtering processes. Thin Solid Films 2005, 476, 215–230. [Google Scholar] [CrossRef]
  21. Li, S.; Yao, Y.; Jia, Y.; Cui, Z. Phase formation and microstructure of BaxSr1−xTiO3 ceramics prepared by direct current arc discharge by a plasma process. Mater. Lett. 2014, 123, 235–237. [Google Scholar] [CrossRef]
  22. Tian, H.Y.; Chan, H.L.W.; Choy, C.L.; No, K. The effects of composition gradients of BaxSr1−xTiO3 thin films on their microstructures, dielectric and optical properties. Mater. Sci. Eng. B 2003, 103, 246–252. [Google Scholar] [CrossRef]
  23. Panda, B.; Dhar, A.; Nigam, G.D.; Bhattacharya, D.; Ray, S.K. Optical properties of RF sputtered strontium substituted barium titanate thin films. Thin Solid Films 1998, 332, 46–49. [Google Scholar] [CrossRef]
  24. Pontes, F.M.; Leite, E.R.; Pontes, D.S.L.; Longo, E.; Santos, E.M.S.; Mergulhao, S.; Pizani, P.S.; Lanciotti, F., Jr.; Boschi, T.M.; Varela, J.A. Ferroelectric and optical properties of Ba0.8Sr0.2TiO3 thin film. J. Appl. Phys. 2002, 91, 5972–5978. [Google Scholar] [CrossRef]
  25. Xu, Z.; Tanushi, Y.; Suzuki, M.; Wakushima, K.; Yokoyama, S. Optical properties of amorphous Ba0.7Sr0.3TiO3 thin films obtained by metal organic decomposition technique. Thin Solid Films 2006, 515, 2326–2331. [Google Scholar] [CrossRef]
  26. Bao, D.; Yang, H.; Zhang, L.; Yao, X. Structure and optical properties of SrTiO3 thin films prepared by a sol-gel technique. Phys. Status Solidi A 1998, 169, 227–233. [Google Scholar] [CrossRef]
  27. Lu, H.; Pan, J.S.; Chen, X.F.; Zhu, W.G.; Tan, O.K. Influence of annealing temperature on the band structure of sol-gel Ba0.65Sr0.35TiO3 thin films on n-type Si (100). Appl. Phys. Lett. 2006, 88, 132907. [Google Scholar] [CrossRef]
  28. Tcheliebou, F.; Ryu, H.S.; Hong, C.K.; Park, W.S.; Baik, S. On the microstructure and optical properties of Ba0.5Sr0.5TiO3 films. Thin Solid Films 1997, 305, 30–34. [Google Scholar] [CrossRef]
Figure 1. The Boltzmann’s profile fits of “x” parameter obtained from energy dispersive X-ray spectroscopy (EDS) measurements, as a function applied power ratio with different in situ deposition temperatures.
Coatings 08 00362 g001
Figure 2. (a) BPXRD, BPEDS, BPAvT; (b) First derivative of (a); (c) Second derivative of (a).
Coatings 08 00362 g002
Figure 3. Deposition rate (DR) fits with exponential growth for as-deposited temperature, 375, 495, and 549 °C, and average temperature fit. The inset shows the DR with Boltzmann’s profile fit (BP) only BaxSr1−xTiO3 (BST) at 435 °C.
Coatings 08 00362 g003
Figure 4. The ISO–DR was developed considering the applied power and in situ temperature ranges, 0–120 W and as-deposited temperature ~549 °C, respectively. The plot only shows the temperature effect since 375 °C. The right column colors are dimensioned. The purple and green arrows indicate the direction where Sr and Ba increase, respectively.
Coatings 08 00362 g004
Figure 5. XRD of Samples (a) S5 and (b) S7 at the five temperatures studied. As-deposited temperature has been plotted at 50 °C as a reference.
Coatings 08 00362 g005
Figure 6. (a) Transmittance spectrum of Samples S1–S9 and (b) Tauc’s plot Samples S1−S9; both for as-deposited.
Coatings 08 00362 g006
Figure 7. Transmittance spectrum zones Z1–Z5 of the thin film: (a) Sample S5 as-deposited in situ temperature; (b) Sample S7 495°C.
Coatings 08 00362 g007
Figure 8. Eg values for S1–S9 Samples as a function of temperature, as-deposited temperature samples plotted at 50 °C as the reference temperature.
Coatings 08 00362 g008
Figure 9. The ISO color lines for Eg (ISO–Eg) were developed considering the applied power and temperature ranges of 0–120 W and as-deposited temperature ~549 °C, respectively. The plot only shows the temperature effect since 370 °C. In the right column, colors are dimensioned. The purple and green arrows indicate the direction where Sr and Ba increase, respectively.
Coatings 08 00362 g009
Figure 10. Resistivity (ρ) values, samples of S1–S9 as a temperature function, as deposited samples have been plotted at 50 °C as the reference temperature.
Coatings 08 00362 g010
Figure 11. The ISO–ρ was developed considering the applied power and temperature ranges of 0–120 W and as-deposited temperature ~549 °C, respectively. The plot only shows the temperature effect since 375 °C. In the right column, colors are dimensioned. The purple and green arrows indicate the direction where Sr and Ba increase, respectively.
Coatings 08 00362 g011
Table 1. RF-applied power to BaTiO3 and SrTiO3 targets with in situ deposition temperatures on a quartz substrate.
Sample (Temperatures As-Deposited, 375 °C, 435 °C, 495 °C, 549 °C)RF–Magnetron Applied Power (W)Total Applied Power (W)
BaTiO3SrTiO3
S10120120
S215105120
S33090120
S44575120
S56060120
S67555120
S79030120
S810515120
S91200120
Table 2. Preparation conditions and x-measurements of the sample’s series.
Samples SeriesSubstrateT (°C)x-Measurements
BPEDSBST/Nichrome495EDS
BPXRDBST/Quartz549XRD
BPAvTBST/Quartzx-average (as-deposited, 375, 435, 495, 549)EDS
Table 3. Applied power ratio and temperature values obtained using ISO–Eg, where % x and Eg values can be found by consulting the literature reference number written in the column Ref.
Amorphous PhaseT (°C)Applied Power Ratio (W)Ref.Crystalline PhaseT (°C)Applied Power Ratio (W)Ref.
% xEg (eV)% xEg (eV)
804.1849565/55[16]803.8>53565/55[16]
704.2749555/65[25]753.83–3.88>53560/60[15]
704.58<37555/65[17]703.94>53555/65[17]
654.3947552/68[27]503.9649545/75[28]
504.246545/75[18]603.8154950/70[11]
504.75<37545/75[14]1003.75>549120/0[11]
03.884950/120[11]
Table 4. DR, Eg, and ρ maximum and minimum values analysis obtained with ISO–DR, ISO–Eg, and ISO–ρ (Figure 3, Figure 8, and Figure 11 respectively). These intersection values were obtained from the simultaneous applied power ranges (0–120 W on BaTiO3 and 120–0 W SrTiO3 targets) and temperature intervals (375–549 °C).
Temperature Ranges (°C)Highest Content Ranges: >%Sr2+ (0–45 W); >%Ba2+ (45–120 W)Deposition Rate (nm/min)Eg (eV)ρ (1 × 10⁷ Ω cm)
Max.Min.Max.Min.Max.Min.
375–435(Sr)2.531.844.523.940.030.03
(Ba)6.452.824.523.890.570.03
435–495(Sr)2.631.844.513.820.840.03
(Ba)6.252.634.493.820.840.03
495–549(Sr)2.431.743.913.8010.09
(Ba)5.572.434.393.790.840.06

