Article

Structural and Optical Properties of Luminescent Copper(I) Chloride Thin Films Deposited by Sequentially Pulsed Chemical Vapour Deposition

1
R & D Center for Low-Cost Plasma and Nanotechnology Surface Modifications (CEPLANT), Department of Physical Electronics, Faculty of Science, Masaryk University, Kotlářská 267/2, 611 37 Brno, Czech Republic
2
Department of Condensed Matter Physics, Masaryk University, Kotlářská 267/2, 611 37 Brno, Czech Republic
3
Institute of Physics of the Czech Academy of Sciences, v.v.i., Cukrovarnická 10, 162 00 Prague 6, Czech Republic
4
Centre of Materials and Nanotechnologies, Faculty of Chemical Technology, University of Pardubice, Nám. Čs. Legií 565, 530 02 Pardubice, Czech Republic
5
Central European Institute of Technology, Brno University of Technology, Purkyňova 123, 612 00 Brno, Czech Republic
*
Author to whom correspondence should be addressed.
Coatings 2018, 8(10), 369; https://doi.org/10.3390/coatings8100369
Submission received: 31 August 2018 / Revised: 12 October 2018 / Accepted: 15 October 2018 / Published: 18 October 2018
(This article belongs to the Special Issue Atomic Layer Deposition)

Abstract

:
Sequentially pulsed chemical vapour deposition was used to successfully deposit thin nanocrystalline films of copper(I) chloride using an atomic layer deposition system in order to investigate their application to UV optoelectronics. The films were deposited at 125 °C using [Bis(trimethylsilyl)acetylene](hexafluoroacetylacetonato)copper(I) as a Cu precursor and pyridine hydrochloride as a new Cl precursor. The films were analysed by XRD, X-ray photoelectron spectroscopy (XPS), SEM, photoluminescence, and spectroscopic reflectance. Capping layers of aluminium oxide were deposited in situ by ALD (atomic layer deposition) to avoid environmental degradation. The film adopted a polycrystalline zinc blende-structure. The main contaminants were found to be organic materials from the precursor. Photoluminescence showed the characteristic free and bound exciton emissions from CuCl and the characteristic exciton absorption peaks could also be detected by reflectance measurements.

1. Introduction

Copper(I) chloride (CuCl) is a wide-bandgap, I–VII ionic semiconductor. γ-CuCl with zinc blende structure, which is stable below 407 °C, has a direct bandgap with Eg = 3.395 eV at 4 K [1]. It has a high exciton binding energy of ~190 meV [2], which is higher than both GaN (25 meV) [3] or ZnO (60 meV) [4]. CuCl has been investigated for some time for its application to optoelectronic devices [5,6,7,8]. The high binding energy gives the possibility of stable, room temperature, UV emission which, together with high biexciton binding energies, enables optoelectronic effects such as bistability and four-wave mixing with the potential for new short wavelength devices [9,10].
In order to use CuCl in optoelectronic devices it has to be deposited in thin films or in arrays of nanoparticles. Thin films of CuCl have been deposited by thermal evaporation, molecular beam epitaxy, and magnetron sputtering [11,12,13]. Arrays of nanoparticles of Cu halides have been produced in a matrix of glass, silicon, or organic compounds by gas or liquid phase methods, typically in a three dimensional form [6,14,15,16,17] but the size of the crystallites has been difficult to control. Atomic layer deposition (ALD) has recently been shown to be able to produce two-dimensional nanocrystalline arrays of CuCl on substrates and the size and distribution of the crystallites could be controlled by the parameters of the deposition process [18,19]. These films have shown the crystal structure of γ-CuCl and demonstrated the luminescent and optical characteristics typical of CuCl. One important feature of CuCl is that it is sensitive to moisture in its environment. Films of CuCl will hydrolyse to oxy- or hydroxy-halides after a short time and they need hermetic protection for long-term stability. Successful encapsulation by spun-on organic materials such as polysilsesquioxanes and cycloolefin copolymers has proved successful while plasma-enhanced chemical vapour deposition of SiO2 has not provided adequate encapsulation [20]. These spun-on techniques required short-term exposure of the CuCl to the atmosphere so there is still the possibility of some degradation before encapsulation. In addition, the relative thickness and probable lack of uniformity of spun-on films will be a drawback in device construction.
ALD is a chemical vapour deposition technique characterised by its ability to controllably deposit ultrathin layers with extreme uniformity. In ALD, the substrate is exposed sequentially to pulses of reactant gases or vapours and each pulse forms an additional chemisorbed molecular layer on it. Between the reactant pulses, an inert gas is used as a purge gas for removing all the excess precursor molecules that have not chemisorbed or undergone exchange reactions with the surface groups, and removing the reaction byproducts [21]. A single sequence of precursor and purge pulses is known as an ALD cycle. Initially, the film formation may proceed by the nucleation and growth of individual nanocrystallites, whose size and density varies according to the number of ALD cycles used in the process [22]. The details of this nucleation process are dependent on the chemical interaction between the precursors and the initial surface chemical state of the substrate, which is affected by its pretreatment. This process of controlled nucleation provides a possible method of producing plasmonic structures in copper halides in a much more repeatable way. In the previous ALD work [18,19], the Cl precursor used, i.e., a solution of HCl in butanol, had limitations with respect to questionable stability of the vapour pressure and possible bi-reactions with butanol itself.
In this publication, we report on the sequentially pulsed chemical vapour deposition of CuCl using an alternative Cl precursor which circumvents the problems of the one used in previous ALD of CuCl. We study the change in the distribution of nanocrystallites as deposition progresses. We characterise the structural, optoelectronic and chemical properties of the film and explore the use of ultrathin diffusion barrier layers deposited in situ to provide environmental protection.

2. Materials and Methods

The films were deposited simultaneously on quartz glass, Si, and soda-lime glass substrates by thermal pulsed chemical vapour deposition using a TFS 200 ALD system (Beneq Oy, Espoo, Finland). The deposition temperature and chamber pressure were 125 °C and 2 mbar, respectively, with 100, 200, 500, or 1000 deposition cycles. The precursor for copper was [Bis(trimethylsilyl)acetylene]-(hexafluoroacetylacetonato)copper(I) (Sigma-Aldrich, St. Louis, MO, USA), abbreviated to CuBTMSA for convenience heated to 80 °C, and the precursor for chlorine was pyridine hydrochloride (Sigma-Aldrich, ≥98%) heated to 50 °C. One CuCl deposition cycle was defined by the following sequence. Cu pulse (2 s) → N2 purge (4 s) → Cl pulse (3 s) → N2 purge (6 s). Nitrogen was also used as a carrier gas. Some samples were protected against oxidation and atmospheric moisture by an Al2O3 capping layer. This capping layer was deposited in situ by ALD from trimethylaluminium (TMA, Strem Chemicals, Newburyport, MA, USA; electronic grade) and ozone (ozone generator, BMT Messtechnik, Stahnsdorf, Germany; 8 g/h output) at 150 °C. One Al2O3 ALD deposition cycle was defined by the following sequence. TMA pulse (0.1 s) → N2 purge (3s) → O3 pulse (0.3 s) → N2 purge (3 s). Ozone was used as the oxidiser here because of the fear that using water might hydrolyse the CuCl. The capping layer consisted of 47 ALD cycles giving an Al2O3 thickness of approximately 5 nm. The deposition chamber was connected to a nitrogen glove box with moisture and oxygen content values < 0.1 ppm. The samples were stored in the glove box and only removed for the time necessary for analyses except for those capped samples deliberately exposed to the atmosphere.
ALD is characterised by growth saturation with increasing precursor dose and the presence of an ALD temperature window. In the process described here, the full range of deposition parameters has not yet been explored with these precursors to definitively prove that the CuCl deposition was purely an ALD process. Therefore, the process can only strictly be called sequentially pulsed chemical vapour deposition. We consider, however, that in comparing the growth of different samples it is in order to refer to the number of “ALD cycles” as a shorthand descriptor rather than saying “sequentially pulsed precursor-purge cycles”.
The CuCl was deposited on various types of substrate: (i) silicon wafers (100) (P/Boron doped, thickness = 525 ± 25 μm, Ω = 10–30 Ω·cm); (ii) soda-lime glass; and (iii) quartz glass Herasil 102 (Heraeus, Hanau, Germany). Before the deposition the samples of size approximately 1 × 1 cm2 were cleaned in an ultrasonic bath: 5 min in acetone, 5 min in isopropanol, and dried with nitrogen. Hydrofluoric acid was used to etch native oxide from the Si wafer surfaces. Transparent samples (soda-lime glass and quartz glass) were coated with Kapton tape on the back side to allow deposition only on one side. The Kapton tape was removed prior to optical measurements.
X-ray photoelectron spectroscopy (XPS) was carried out using an ESCALAB 250Xi apparatus (ThermoFisher Scientific, Waltham, MA, USA) with monochromated Al Kα radiation (1486.6 eV) to determine the chemical composition of CuCl thin films. All samples were measured at two spots at a takeoff angle of 90° in 10−8 mbar vacuum at 20 °C. An electron flood gun was used to compensate for charges on sample surfaces. The spectra were referenced to C–C at 284.8 eV. The spot size was 650 × 650 µm2 and the pass energy was 50 eV for the survey and 20 eV for the high resolution scan. The elemental composition was estimated from the survey spectra using Avantage ver. 5.938 software. The measurements on sample Q8 after atmospheric exposure were carried out using an Axis Supra instrument (Kratos Analytical, Manchester, UK) under slightly different conditions; spot size 700 × 300 μm2 and the pass energy was 120 eV for the survey and 20 eV for the high resolution scan. The analysis was done by CasaXPS software ver. 2.3.19PR1.0. The high-resolution spectra were fitted using XPSPEAK software (ver. 4.1) with Shirley and/or linear background.
Grazing incidence X-ray diffractometry (GIXRD) was used to measure the crystalline properties of the CuCl. The measurements were taken with a SmartLab diffractometer (Rigaku, Tokyo, Japan) at grazing incidence angle α = 0.2° using a copper X-ray tube (1.542 Å).
Normal-incidence reflectance was measured in the Vis–UV range using an Avantes 2048 pixel spectrometer (Avantes BV, Apeldoorn, The Netherlands; spectral range from 1.9 to 5.1 eV), equipped with a fibre reflectance probe [23]. The angles of incidence covered the range of 0.2°–1.7° and the nearly circular spot had a measured diameter of 0.8 mm for the 400 μm detection fibre. The small measurement spot allowed us to test the in-plane homogeneity of the samples. Bare substrates were used to collect reference signals.
The photoluminescence (PL) data were obtained with using a LabRam HR Evolution (HORIBA Scientific, Kyoto, Japan) 0.8 m focal length single-stage spectrometer with CW HeCd laser excitation at 325 nm (3.8 eV). The mirror lens collected signals from approximately a 1 μm circular spot; the excitation power was kept low enough to prevent heating of the layers (~200 W cm−2). The PL spectra were recorded with a Peltier-cooled back-illuminated UV-sensitive CCD detector Synapse 2048 × 512. The instrument spectral range sensitivity has been corrected by the Intensity Correction System (HORIBA Scientific, Kyoto, Japan) delivered with the system. All reflectance and PL measurements were performed at room temperature (300 K).

3. Results and Discussion

3.1. Deposition

Table 1 shows the deposition conditions for quartz glass samples.
The growth habit of the films on all substrates showed individual nuclei growing in number and size as the number of cycles increased. Figure 1 shows SEM images of the uncapped films on glass for 100, 200, 500, and 1000 ALD cycles (abbreviated to c. hereafter) deposited on soda-lime glass. The films on Si substrates were similar.
As the number of cycles increased, the diameter of the crystallites also increased. There was an initial nucleation phase and then the surface was covered in an array of crystallites. The areal density of the crystallites showed a decrease with the number of cycles; some form of agglomeration or ripening was evident. Dimensional change of the crystallites can take place by two processes: (i) Coalescence, where there is poor adhesion between the nanocrystallites and the substrate and they are mobile enough to move across it and to coalesce and (ii) Ostwald ripening, in which there is strong adhesion of the nanocrystallites to the surface and material transfer takes place by the diffusion of atoms across the surface. In this case, there is no significant coalescence of nanocrystallites therefore there is an Ostwald ripening process taking place. Initially, the crystallites had somewhat “liquid-like” shapes whereas the crystallites in the 1000 c. films had a more facetted appearance. This change in habit was accompanied by differences in the chemical composition of the films as discussed later. It is possible that this was caused by the longer deposition time required for the thicker film giving more time for reconfiguration of the crystallites. The size of the crystallites in the CuCl films increases with the number of cycles as shown in Figure 2a, while Figure 2b shows this behaviour in comparison with that reported previously using different precursors [19].
Figure 2 demonstrates that the rate of increase of crystallite diameter is similar with both the current and the previous precursors, once the initial nucleation has taken place, and that the growth on crystalline and noncrystalline substrates is similar. This similarity is not unexpected since the reactant is HCl in both cases; here it is derived by decomposition of pyridine hydrochloride, previously the HCl vapour came from an HCl/butanol solution. The nucleation behaviour is somewhat different: with PyrHCl there is slower nucleation. However, with the HCl/butanol precursor the nucleation behaviour depended on the growth cycle parameters so further exploration of the deposition parameters with PyrHCl may also show differences in nucleation behaviour.

3.2. Crystal Structure

Films for XRD analysis were deposited on quartz glass both without a capping layer and with a capping layer of ~5 nm of aluminium oxide deposited in situ in order to prevent the films undergoing hydrolysis in atmospheric moisture. The crystal structure was determined by X-ray diffraction (XRD) using GIXRD. The results are shown in Figure 3a,b. The films show the zinc blende crystal structure of γ-CuCl with no evidence of any other crystalline phases. The films with an Al2O3 capping layer also showed the same structure with small additional broad peaks at ~36° and 45° (marked with asterisks). These do not fit CuCl2 (PDF 9001506), CuO (PDF 1011148), Cu2O (PDF 1010926), or other likely compounds. It is not clear what material they represent. The crystallites showed largely random orientation although with some preferential (220) orientation for thinner films. For randomly oriented films the intensity ratio I220/I111 ≈ 0.60 and the ratio here is much higher. However, it must be borne in mind that because of the glancing angle X-ray incidence, any preferential orientation is not parallel to the substrate. From these results we can conclude that the bulk of the film is γ-CuCl.

3.3. Chemical Composition

The chemical composition was investigated by XPS. The scans were taken before and after Ar sputter-cleaning of the substrate to investigate the extent of surface contamination. Table 2 shows the analysis of survey scans of the deposited material for the unsputtered samples while Table 3 shows the relative concentrations of Cu and Cl after Ar sputter cleaning for 150 s. The XPS analysis was not performed in situ so there will be significant amounts of adventitious carbon from environmental contamination between deposition and analysis for the unsputtered films. The sputtered samples show significantly reduced C 1s signal. There is evidence, however, of the presence of carbon as a residue from the organic precursors (see below). There is also some fluorine content in all films which must come from the CuBTMSA precursor. There is significant uncertainty in the Cu/Cl ration due to the dispersed crystallites which allow a large signal from the substrate material to be detected and because the relative sensitivity factor for the XPS quantification for the Cl 2p peak is much lower than for the Cu 2p peaks by a factor of ~11. Nevertheless, for the unsputtered samples the Cu/Cl ratio is lower than the expected 1/1 ratio for CuCl; however, the sputter-cleaned samples show close to the stoichiometric ratio. The low CuCl ratio for the unsputtered samples arises from the different composition of the surface layer.
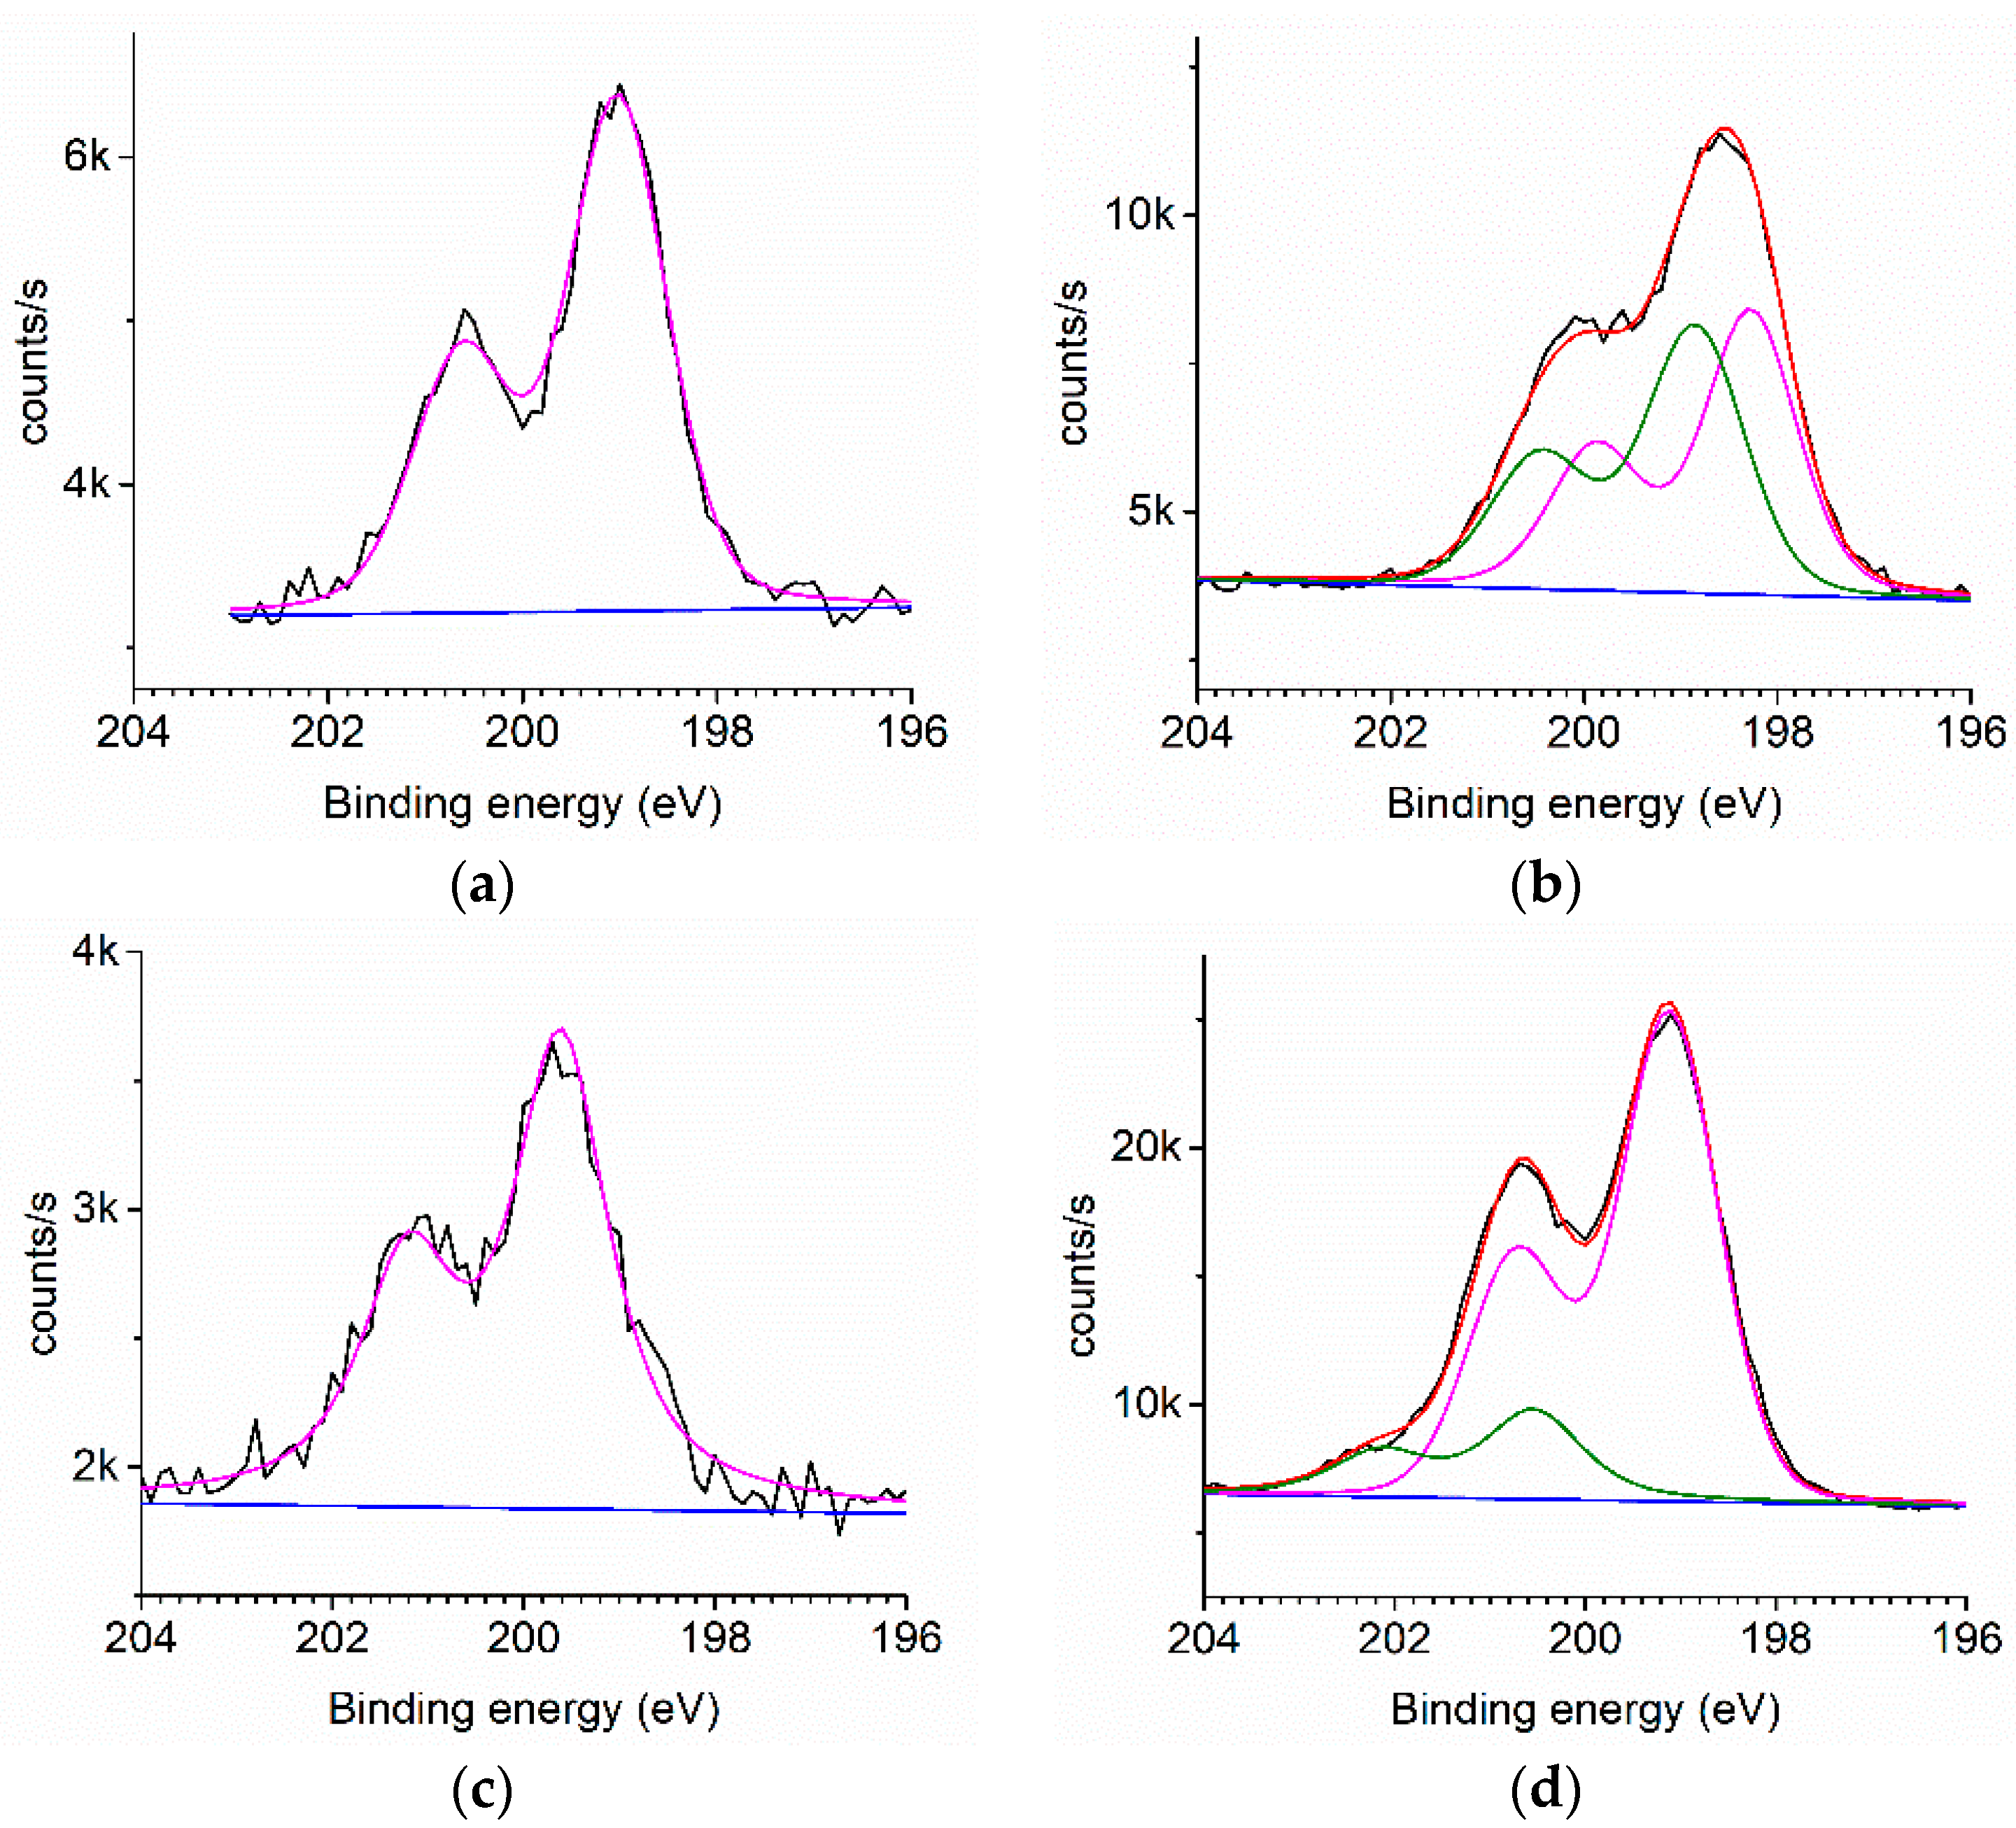
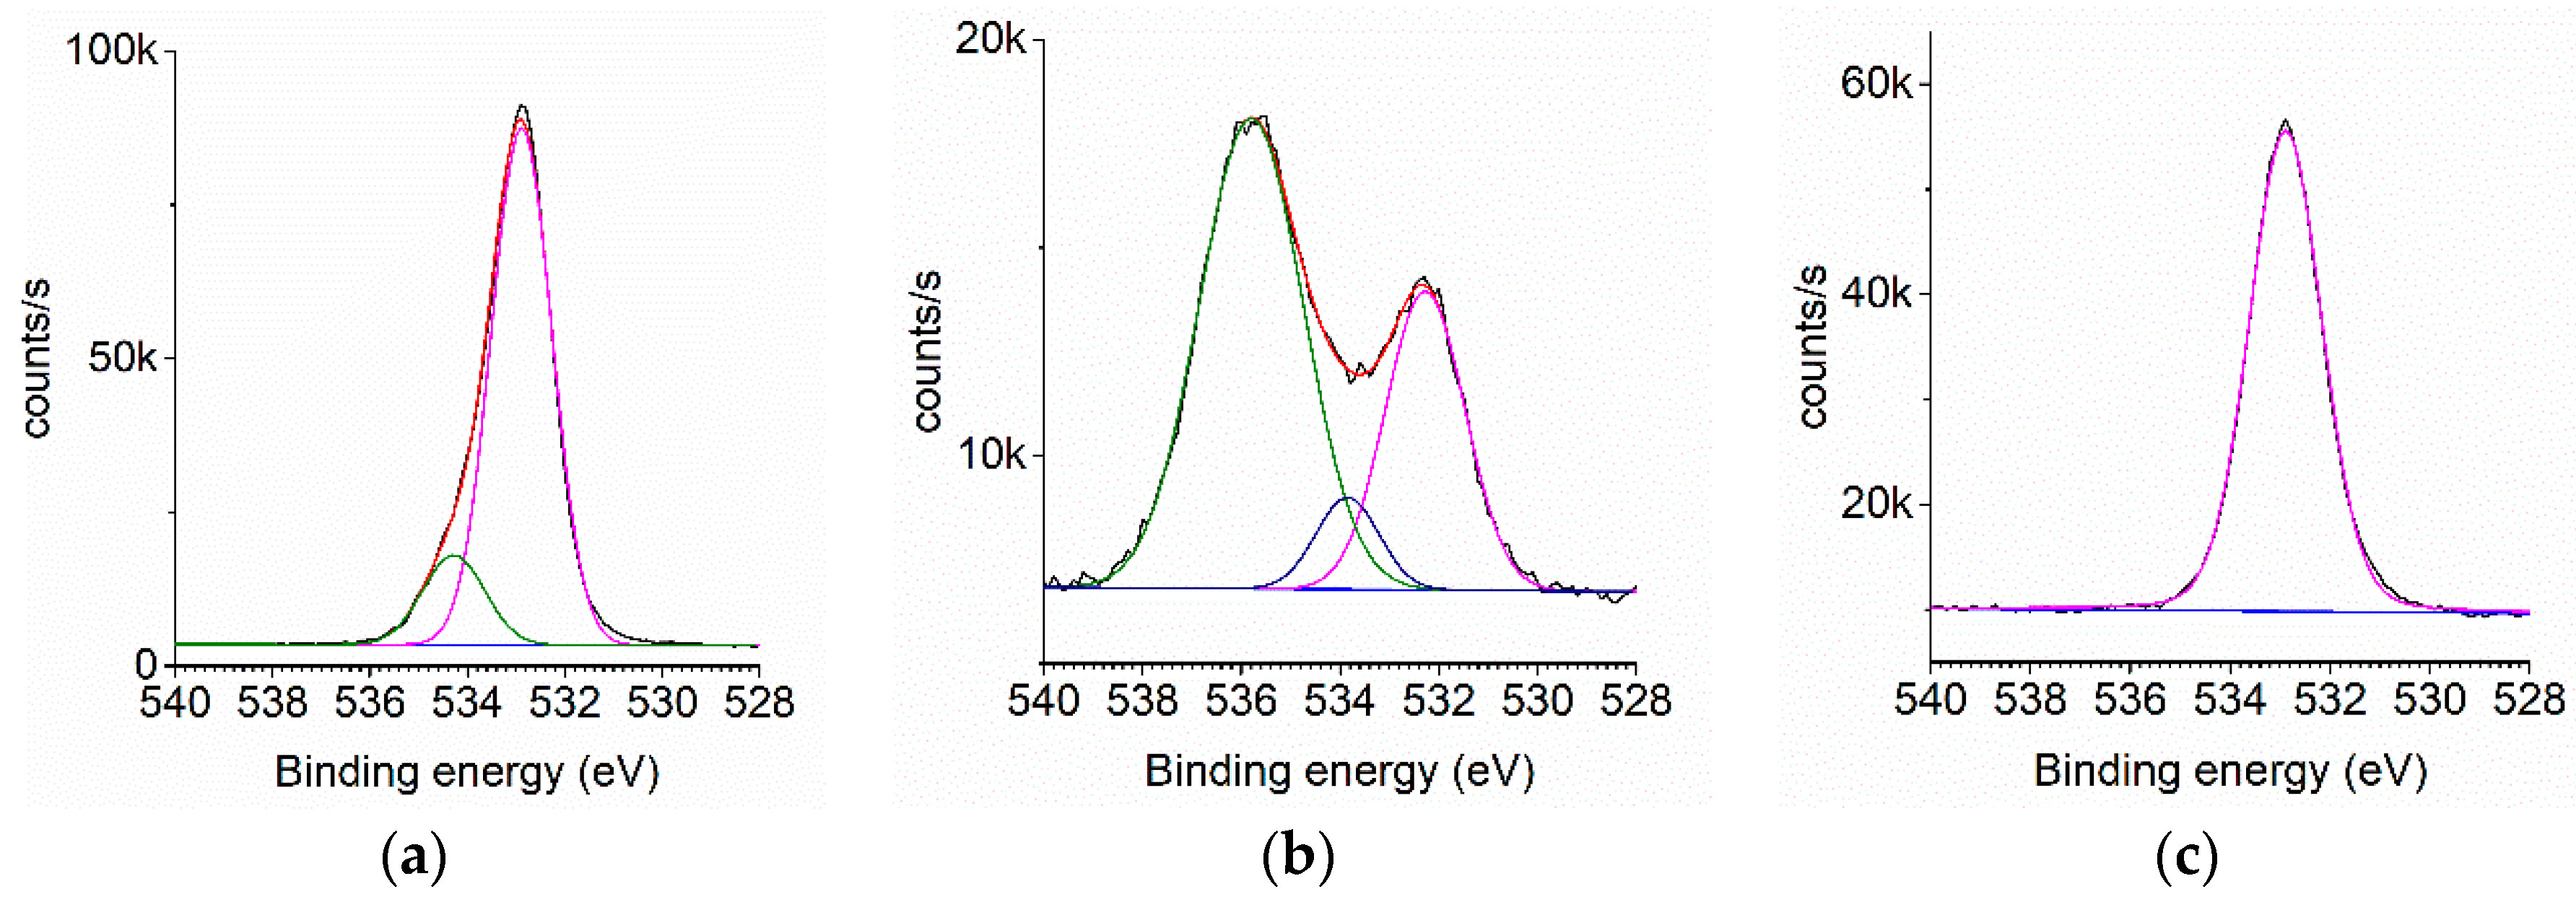
High-resolution scans of the Cl 2p peak from the uncapped samples with peak fittings are shown in Figure 4 for the unsputtered and sputter-cleaned samples. For Q1, Q5, and Q7 the Cl 2p peak is well fitted by one 2p doublet consisting of 2p3/2 and 2p1/2 components separated by 1.6 eV. Figure 4a is representative of these. The binding energy values are consistent with those given for copper chlorides although they cannot easily distinguish between Cu(I) and Cu(II) chloride. In general, the CuCl2 should appear at a higher binding energy [24,25,26]. Taking into account the XRD results which show only CuCl we conclude that peak at ~199.0 eV is CuCl. There is no significant ClOx formation: this would give rise to 2p3/2 peaks at energies approximately 206–208 eV [27], and there is no evidence of these in the Cl 2p spectra. The peak details are given in Table 4. For sample Q10, if a single peak fitting is used, the fitting error is significantly higher. However, the measured Q10 signal can be well fitted with two 2p components separated by 0.6 eV (Figure 4b). This is consistent with the emergence of two different bonding environments for Cl. The lower energy peak is characteristic of HCl·nH2O (198.4 eV) [28] and is also consistent with CuCl bound to an organic ligand [29]. The peak area ratio between this component and the one at slightly lower energy is 1.4 indicating significant surface contamination. Figure 4c shows the Cl 2p peak for Q7 after Ar sputter-cleaning. For the Ar-sputtered Q10 sample, again the best fit is with two doublets. In this case, the additional peak appears at higher energy, consistent with the existence of an organic chloride [28,30].
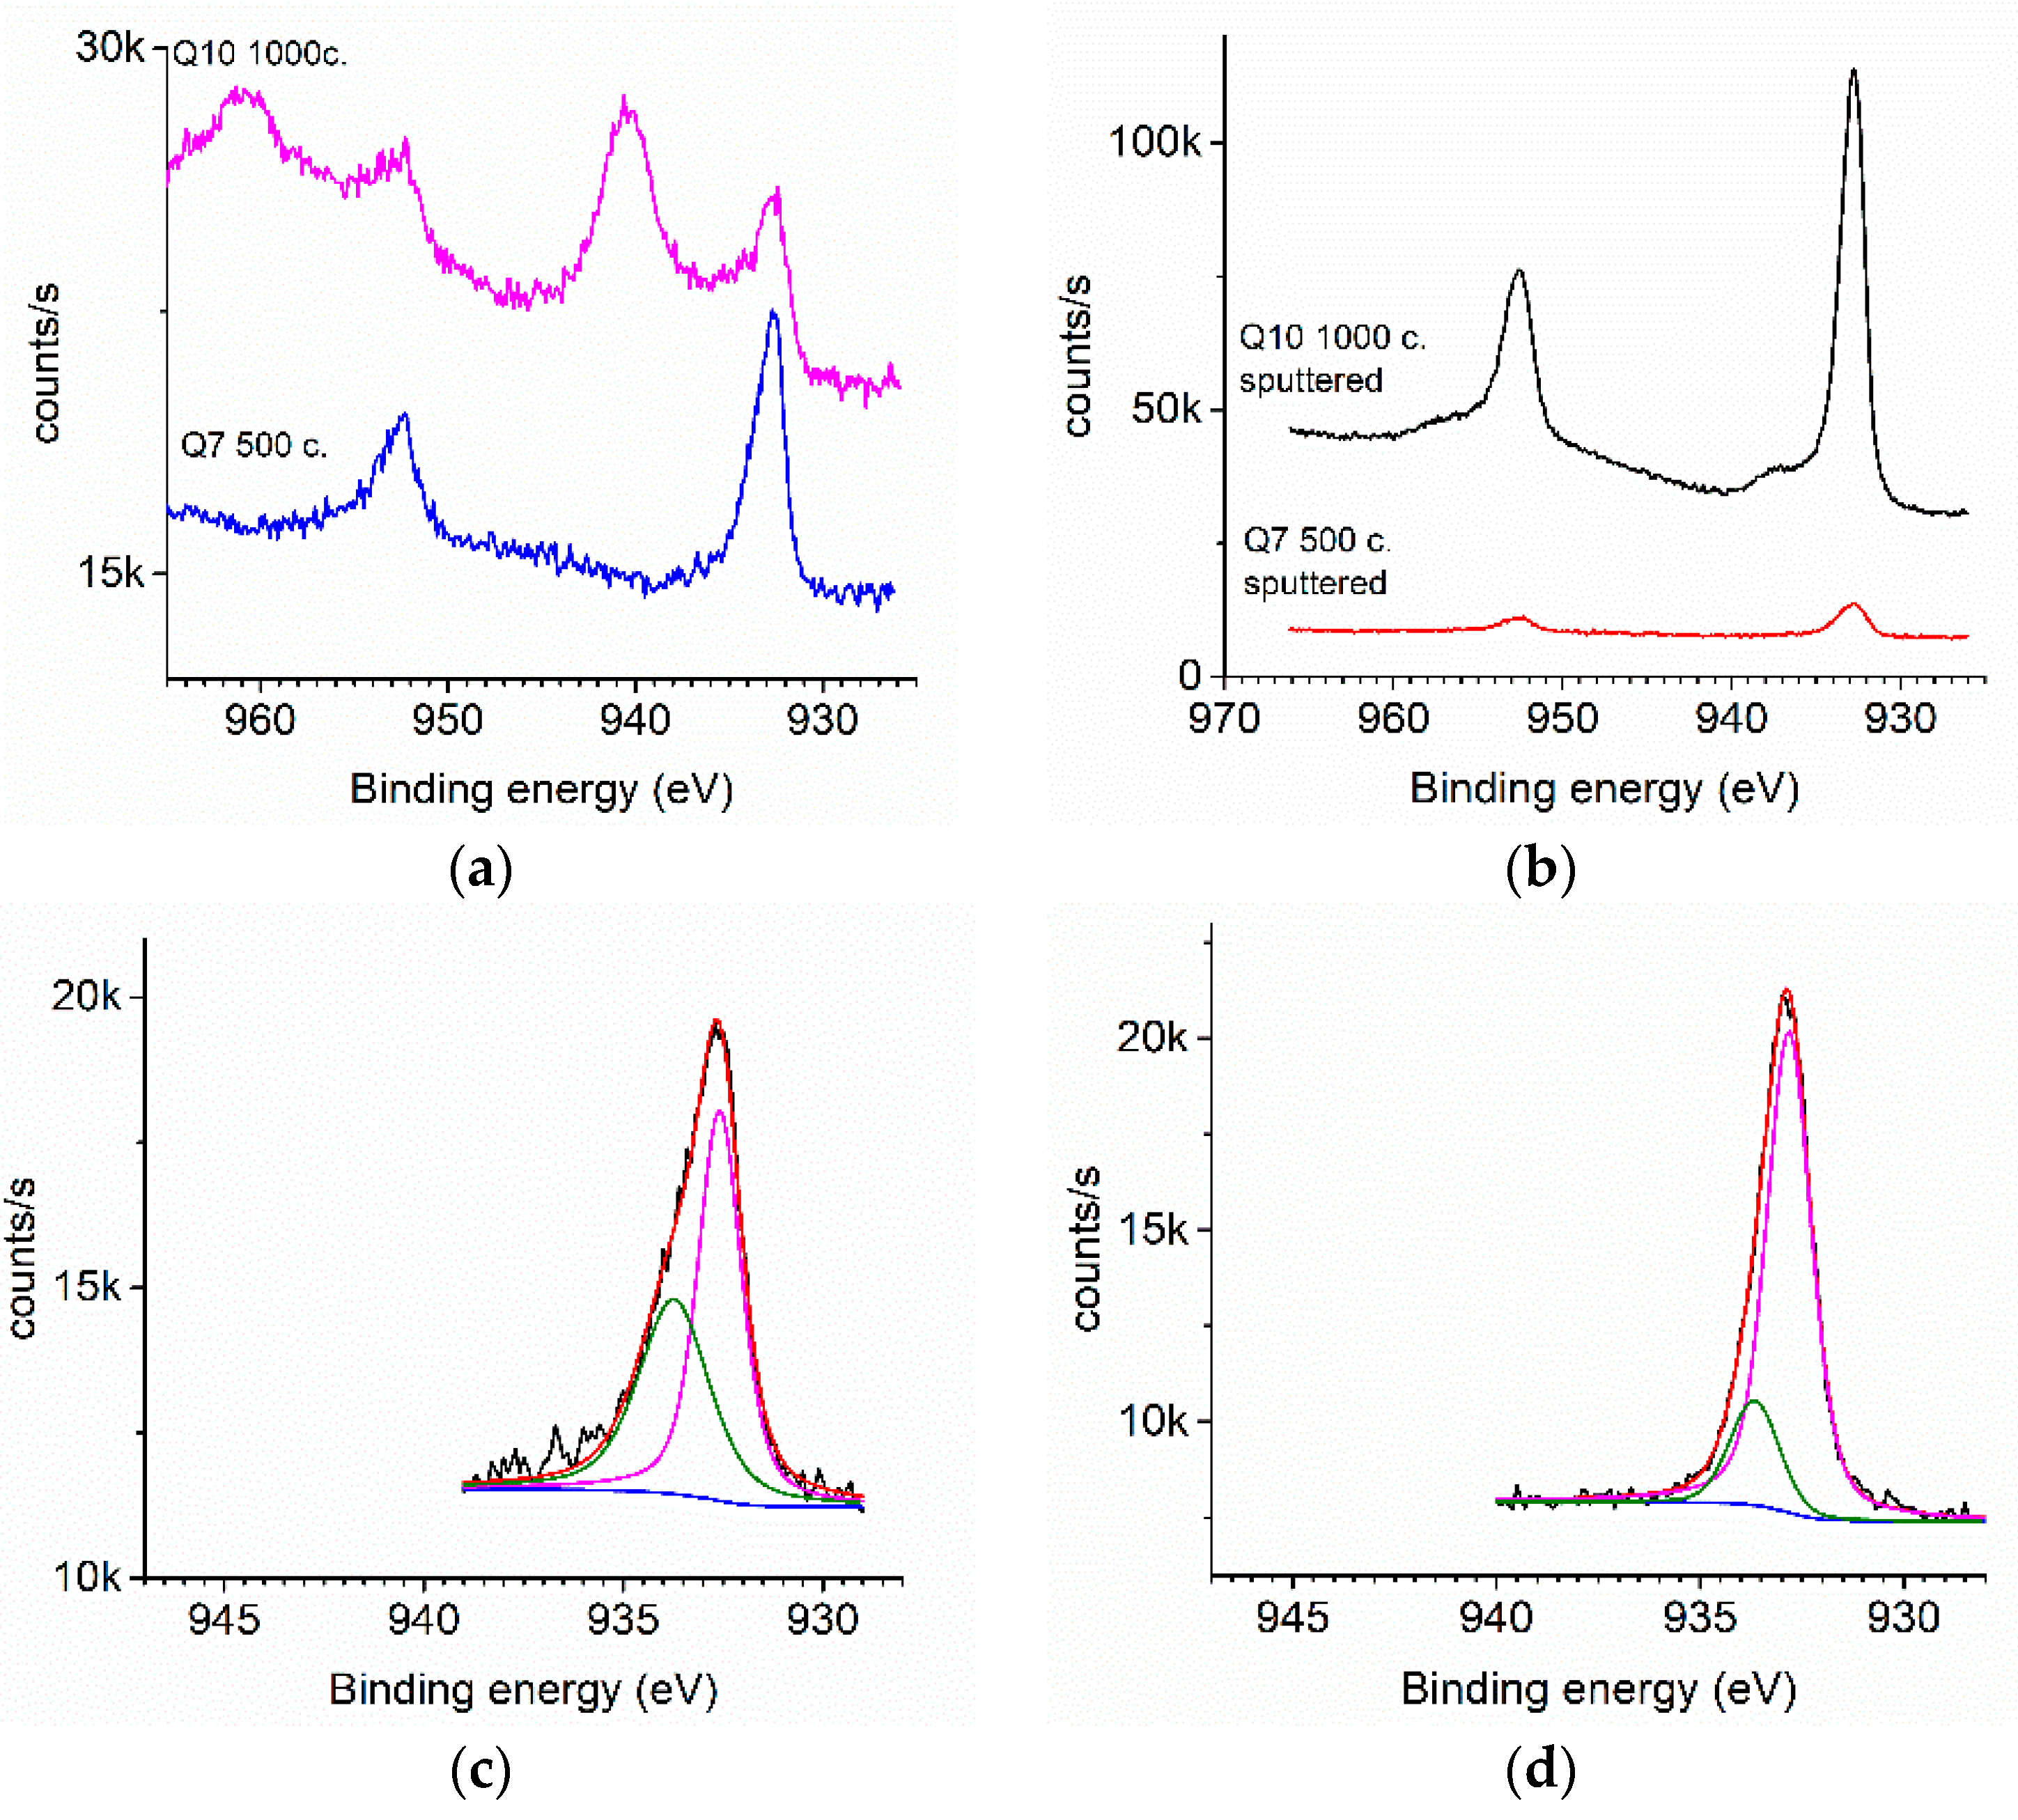
Figure 5 shows the high resolution 2p3/2 and 2p1/2 raw data scans scan of Cu and the decomposition of the 2p3/2 peaks into individual components. Q7 is representative of the other samples with less than 1000 c. deposition. Table 5 shows the peak positions and full width half maxima (FWHM).
It is difficult to separate the Cu0, Cu+, and Cu2+ peaks solely by their binding energies but taking into account the XRD spectra, peak P1 is assigned to CuCl which has been previously seen at 932.4–932.6 eV [31,32]. Peak P2 (~934 eV) could be indicative of CuO, CuCl2, or Cu with an organic or organo-chlorate ligand [33,34,35,36]. However, the presence of Cu2+ species should be indicated by an obvious shake-up satellite peak at ~940 eV [37] and there is no evidence of this in Q7 both with and without sputtering (Figure 5a,b). Neither is there evidence for chlorate bonding in the Cl 2p spectra. Therefore, Q7 contains only Cu+ bonds and P2 is ascribed to Cu(I) organic bonding. The amount of the Cu organic contamination in both Q7 and Q10 is clearly less after Ar sputtering (Figure 5d,f). Figure 5a,e, Q10 (1000 c., unsputtered), shows a large satellite peak at the expected energy for Cu2+ at ~940 eV together with a peak at 936.7 eV, P3, which may be evidence for some fluoride bound to organic material [38]. However, the Q10 Ar-sputtered sample, Figure 5f, shows the same three peaks as for the Q10 unsputtered sample with no evidence of a satellite peak. Therefore, it is not clear which of the peaks is related to the Cu2+ satellite peak. It may be that the relatively lower intensity of P3 after Ar sputtering gives rise to a much smaller satellite peak which is not visible in Figure 5f.
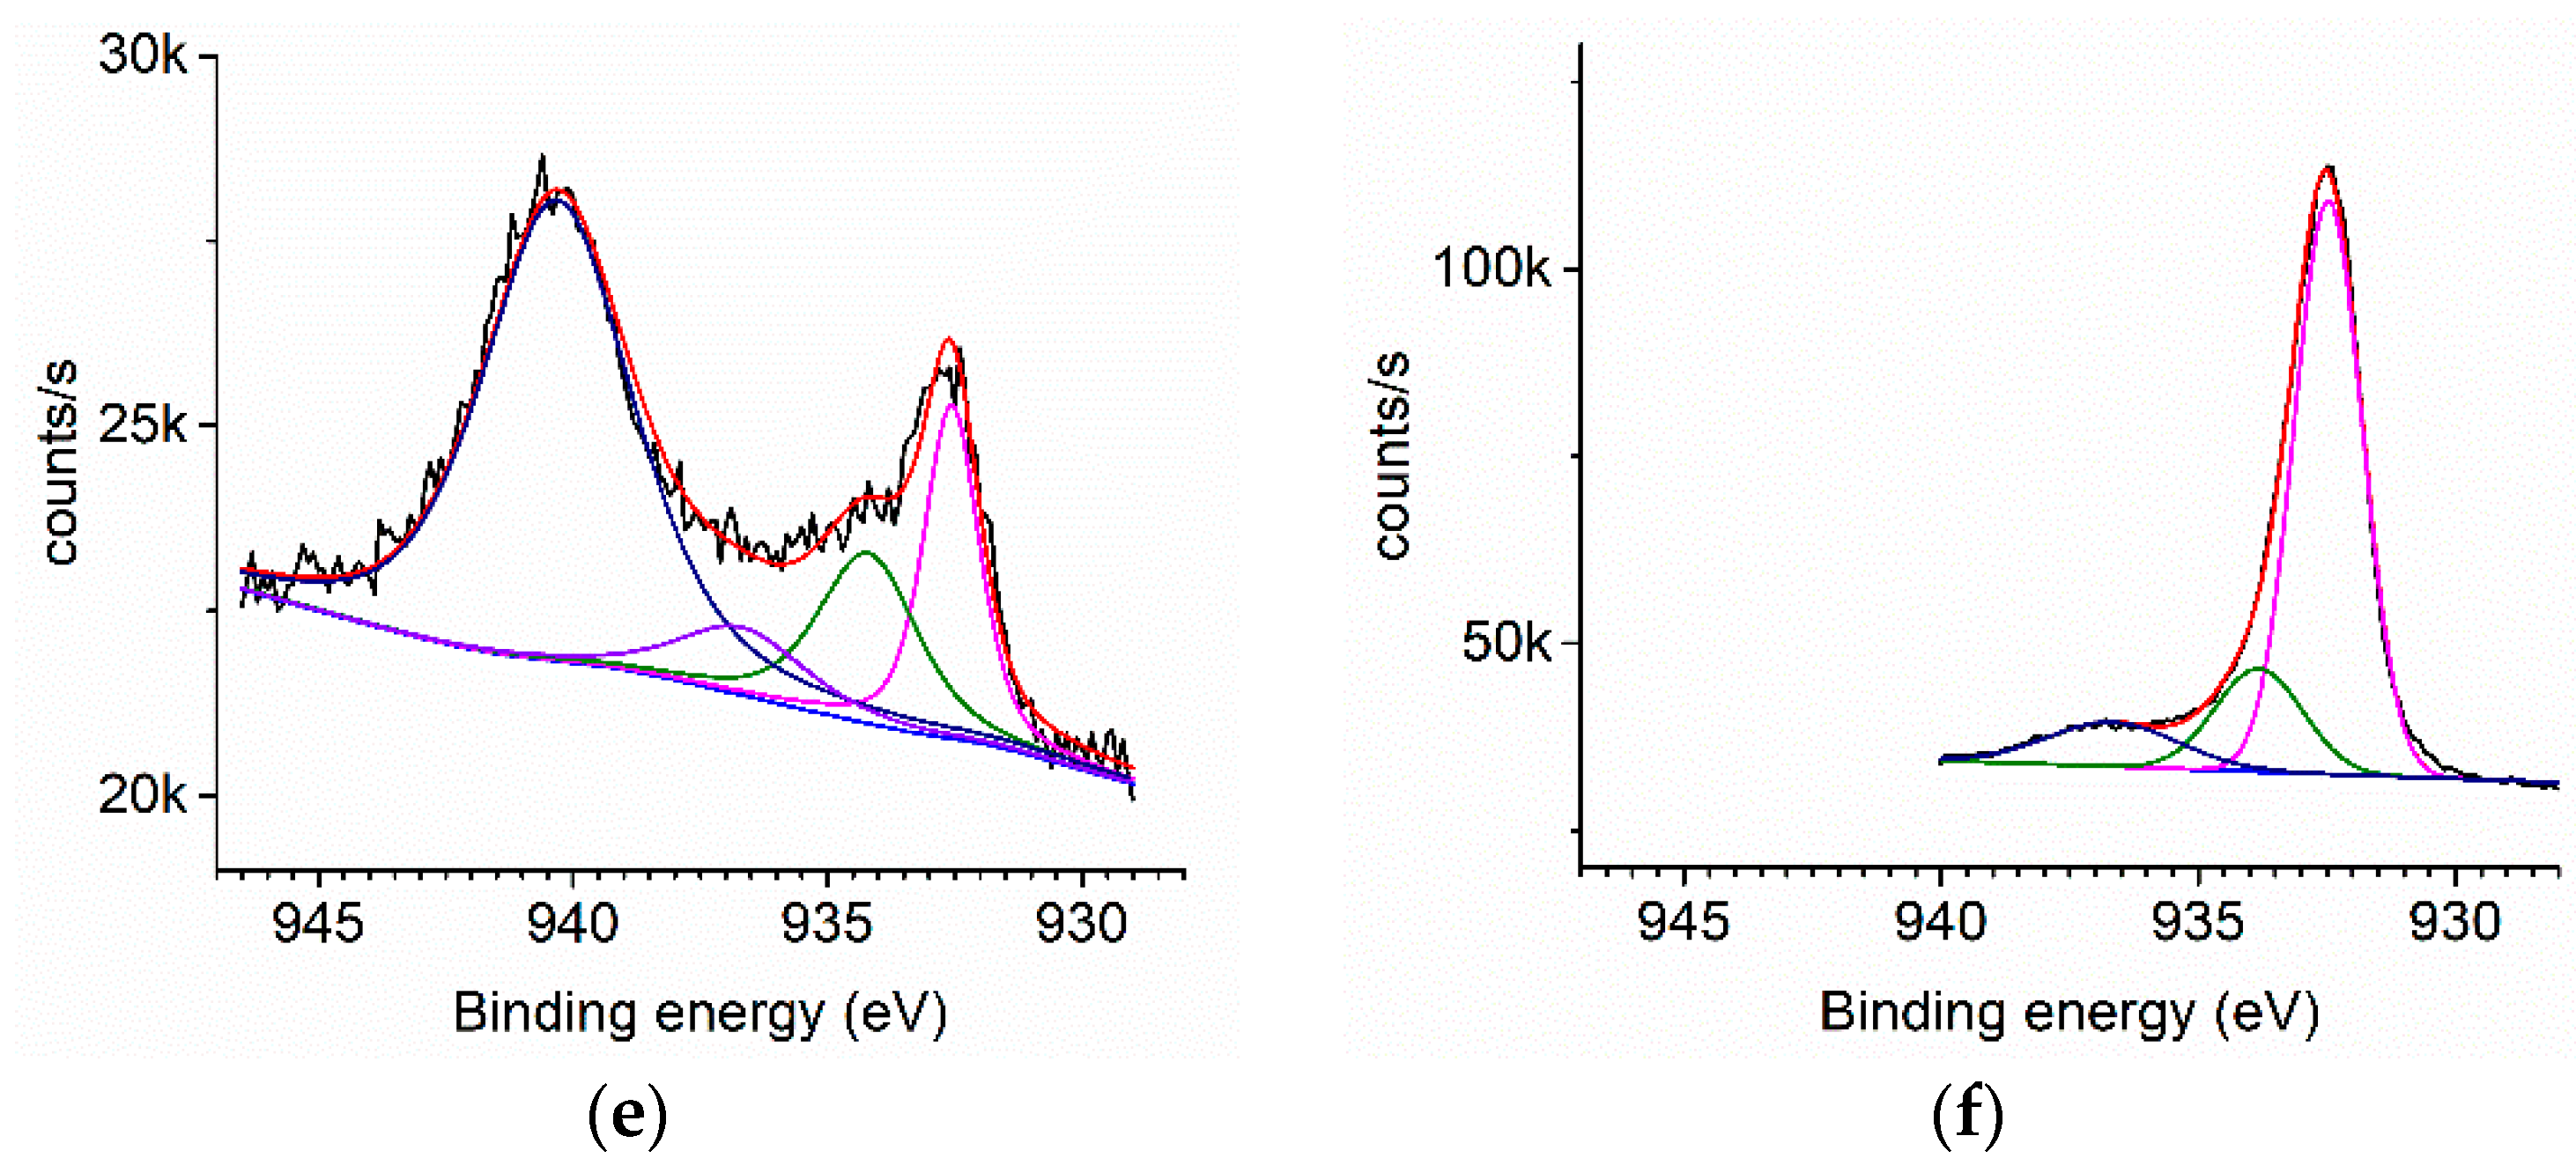
Observation of the O 1s spectra yields further information. The spectra for Q7 and Q10 before and for Q10 after Ar sputtering are shown in Figure 6. The samples are dominated by the peak at 533.3 eV due to SiO2 [39] from the quartz since the substrate coverage is not complete. Both unsputtered samples, Figure 6a,b, also show a peak at ~534 eV which is probably O in an organic ligand indicating some residual CuBTMSA precursor material in the film. In addition, Figure 6b shows a large additional peak at 535.8 eV, which is at an energy which has been ascribed to an O atom linked to a CF containing ligand [30]. This again is likely due to some partially decomposed CuBTMSA precursor. Figure 6c is representative of all the sputtered samples and shows only the SiO2 peak indicating that the oxygen bonded to organic material is only on the surface.
When the Cl 2p, Cu 2p, and O 1s results are taken together with the XRD results, it is clear that the bulk of the films consists of γ-CuCl with a certain amount of organic contamination from the precursor molecules. This is confirmed by the presence of significant carbon content even in the Ar-sputtered samples. The unsputtered samples show, as is to be expected, greater organic contamination, including from F-containing organic fragments and HCl from the CuBTMSA and PyrHCl precursors, respectively. The exact nature of the bonding is the subject of further investigation.
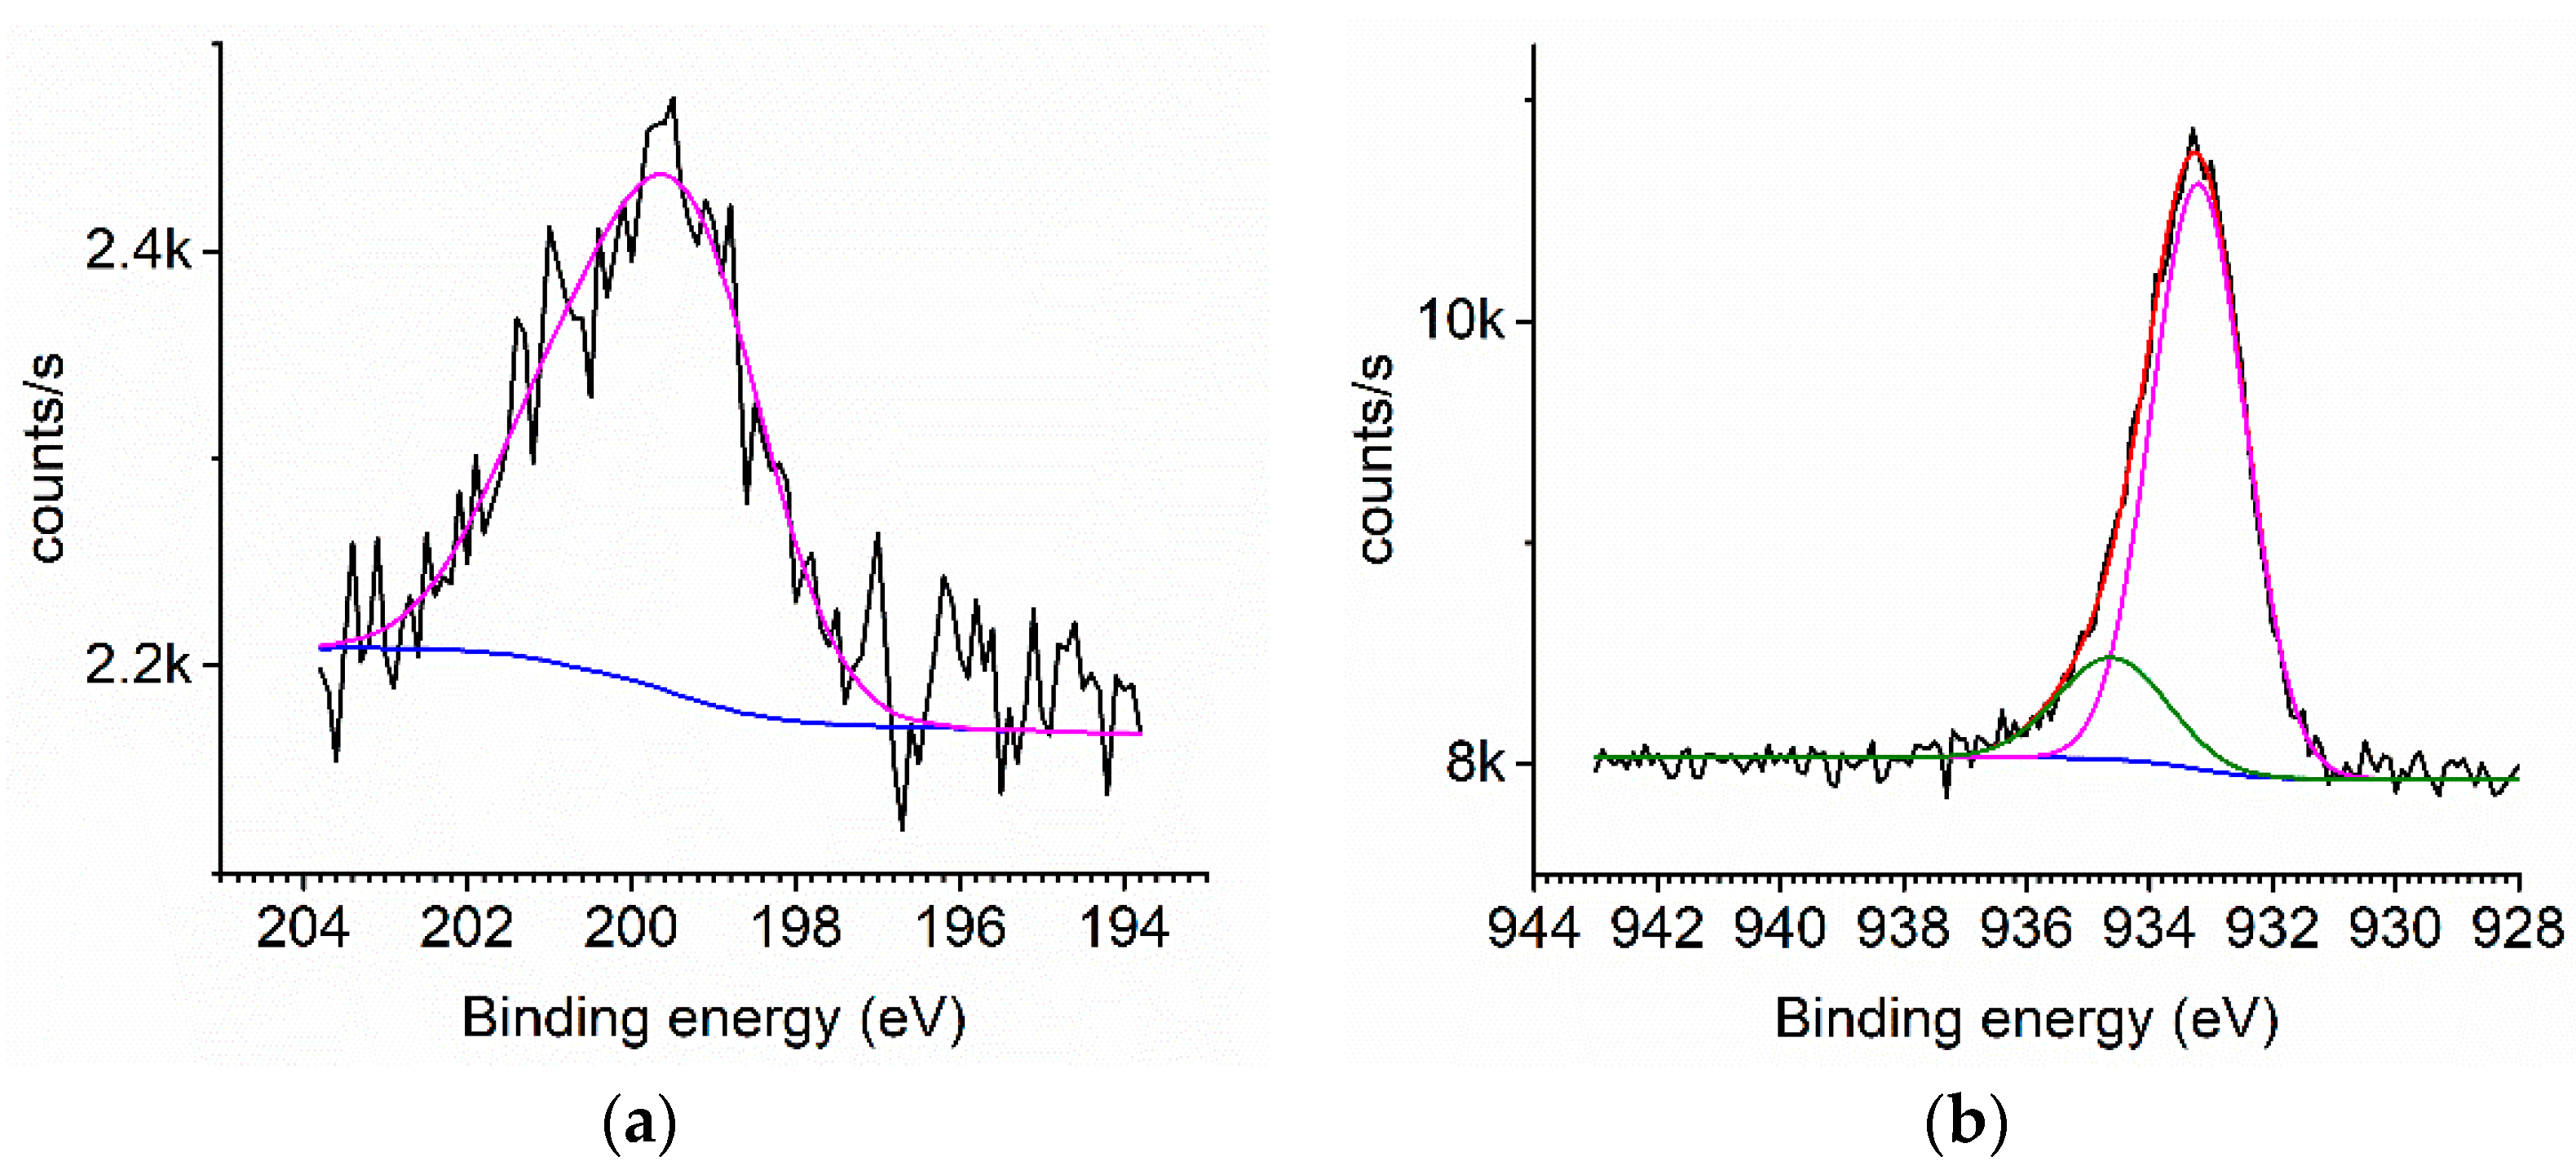
Thin uncapped CuCl films will hydrolyse after approximately one day. Figure 7 and Table 3, Table 4 and Table 5 show measurements on the sputter cleaned sample Q8 (500 c., Al2O3 capped) after exposure to normal atmosphere for approximately 3 weeks. The curves and tabulated data are very similar to those of the uncapped samples with the same number of growth cycles kept in an inert atmosphere (Figure 4c and Figure 5e). They show no evidence of degradation, indicating that 5 nm of oxide capping layer provides an effective barrier to hydrolysis of the films.

3.4. Photoluminescence

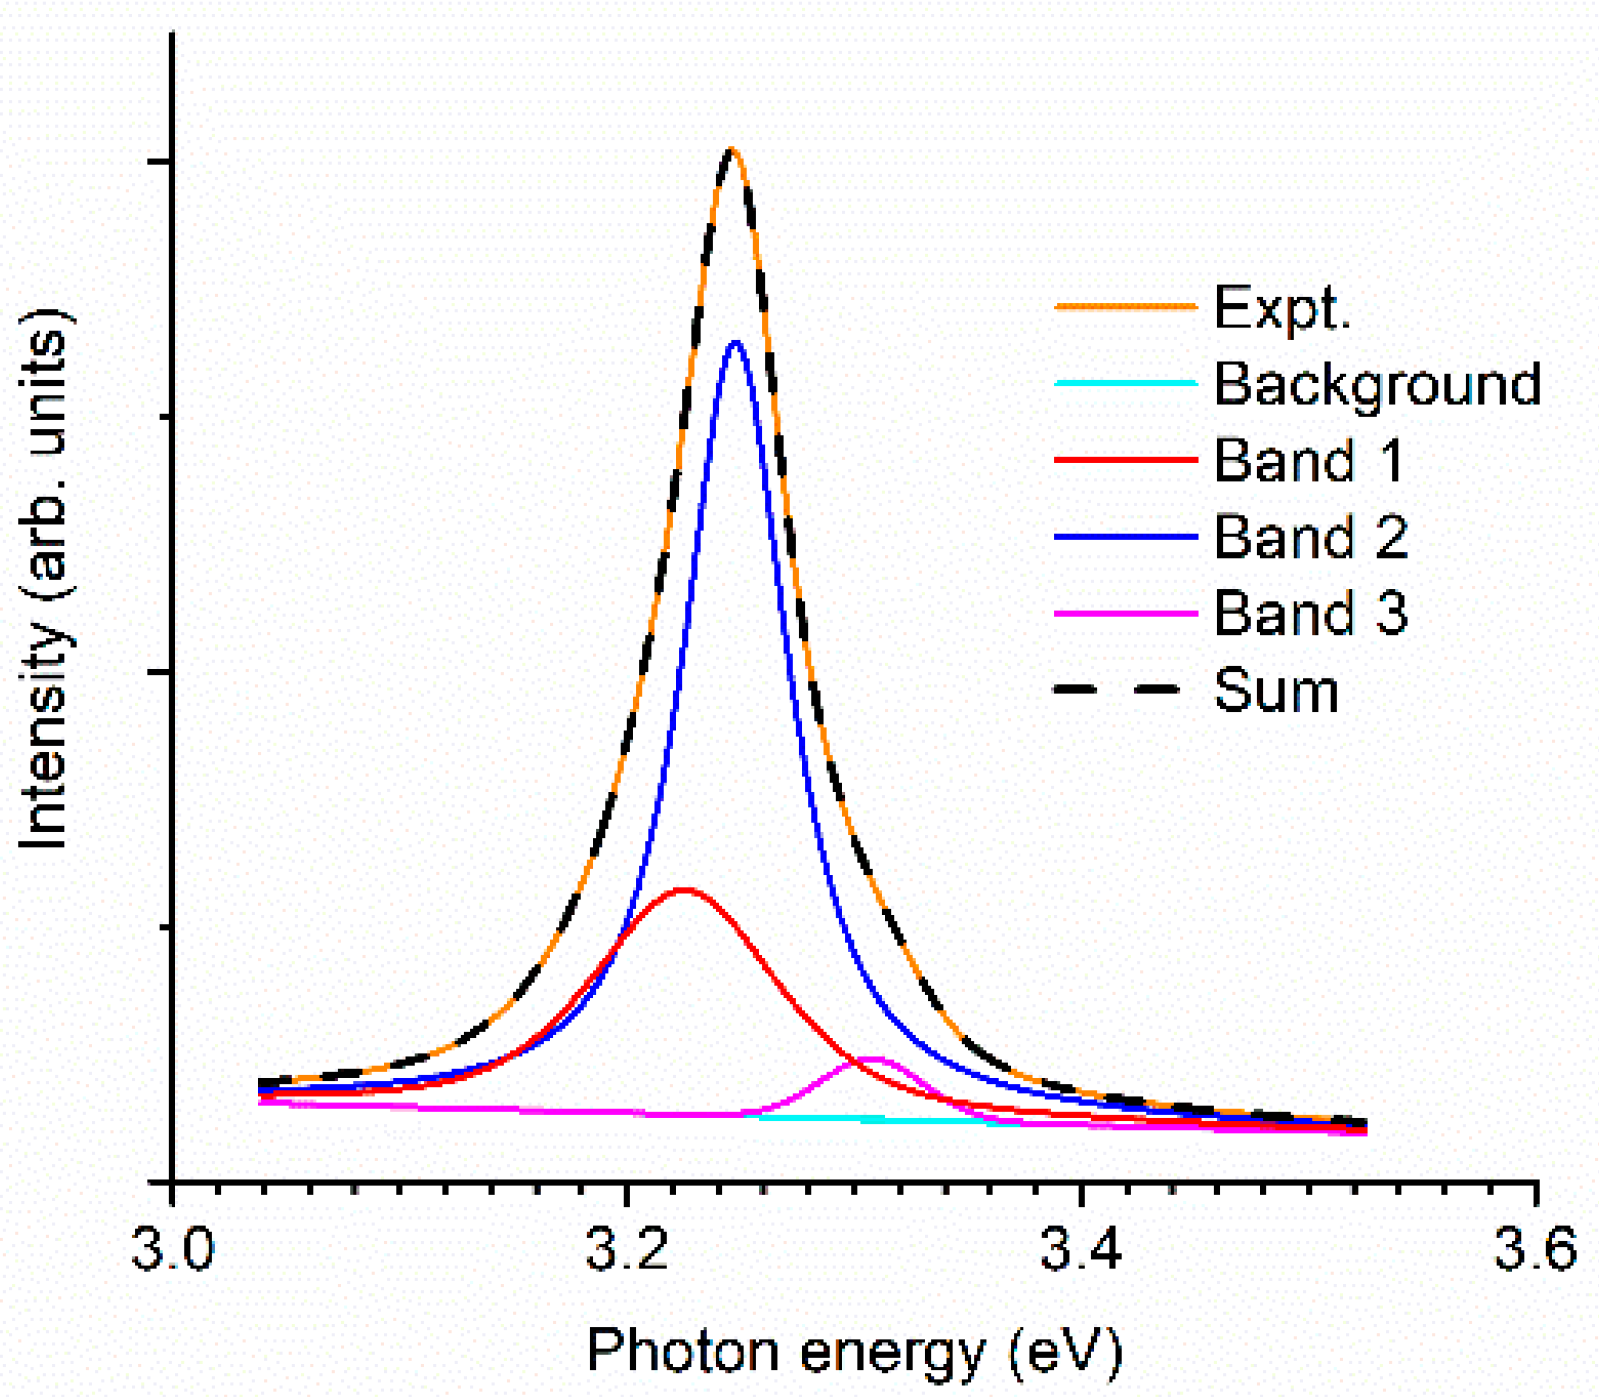
The photoluminescence signals obtained from sample Q10 (1000 c., uncapped) were easily measurable at room temperature. Shown in Figure 8 is the experimental spectrum, decomposed into three Gaussian bands located on a linear background. The sum fits the measured data within background noise. The band parameters are listed in Table 6. We use band area as the measure of its strength. The location of the PL maximum is very close to the position of the strongest PL2 band, coinciding with the position of the absorption peak PL2 (3.248 eV) of Table 6 within experimental uncertainty. The weaker but discernible high-energy PL3 band at 3.308 eV lies 0.06 eV above PL2. The lower energy band PL1 is situated at 3.225 eV, approximately 0.10 eV lower than PL2. These results are similar to those observed on CuCl films obtained by thermal evaporation [40] and magnetron sputtering [41]. Those showed that at low temperature the emission peak could be resolved into three components which broadened into one composite peak at room temperature. The main peak was identified as the Z3 free exciton peak observed at energy 3.227 eV at 15 K. This peak shifted to higher energy of 3.243 eV at room temperature, a shift of approximately 0.016 eV [42]. This peak is almost at the same energy as the main peak reported here (3.248 eV). The peak shown here can also be decomposed into three components. By comparison with these results and allowing for the shift with temperature, the main peak indicating the most probable radiative channel is ascribed to the Z3 exciton. The lower energy peak we see at 3.225 eV (385.4 nm) can be ascribed to the I1 peak due to an exciton bound to an impurity, probably a Cu vacancy [43]. The higher energy peak at 3.308 eV (375.8 nm) can be ascribed to the Z1,2 exciton. PL mapping across the sample shown in 
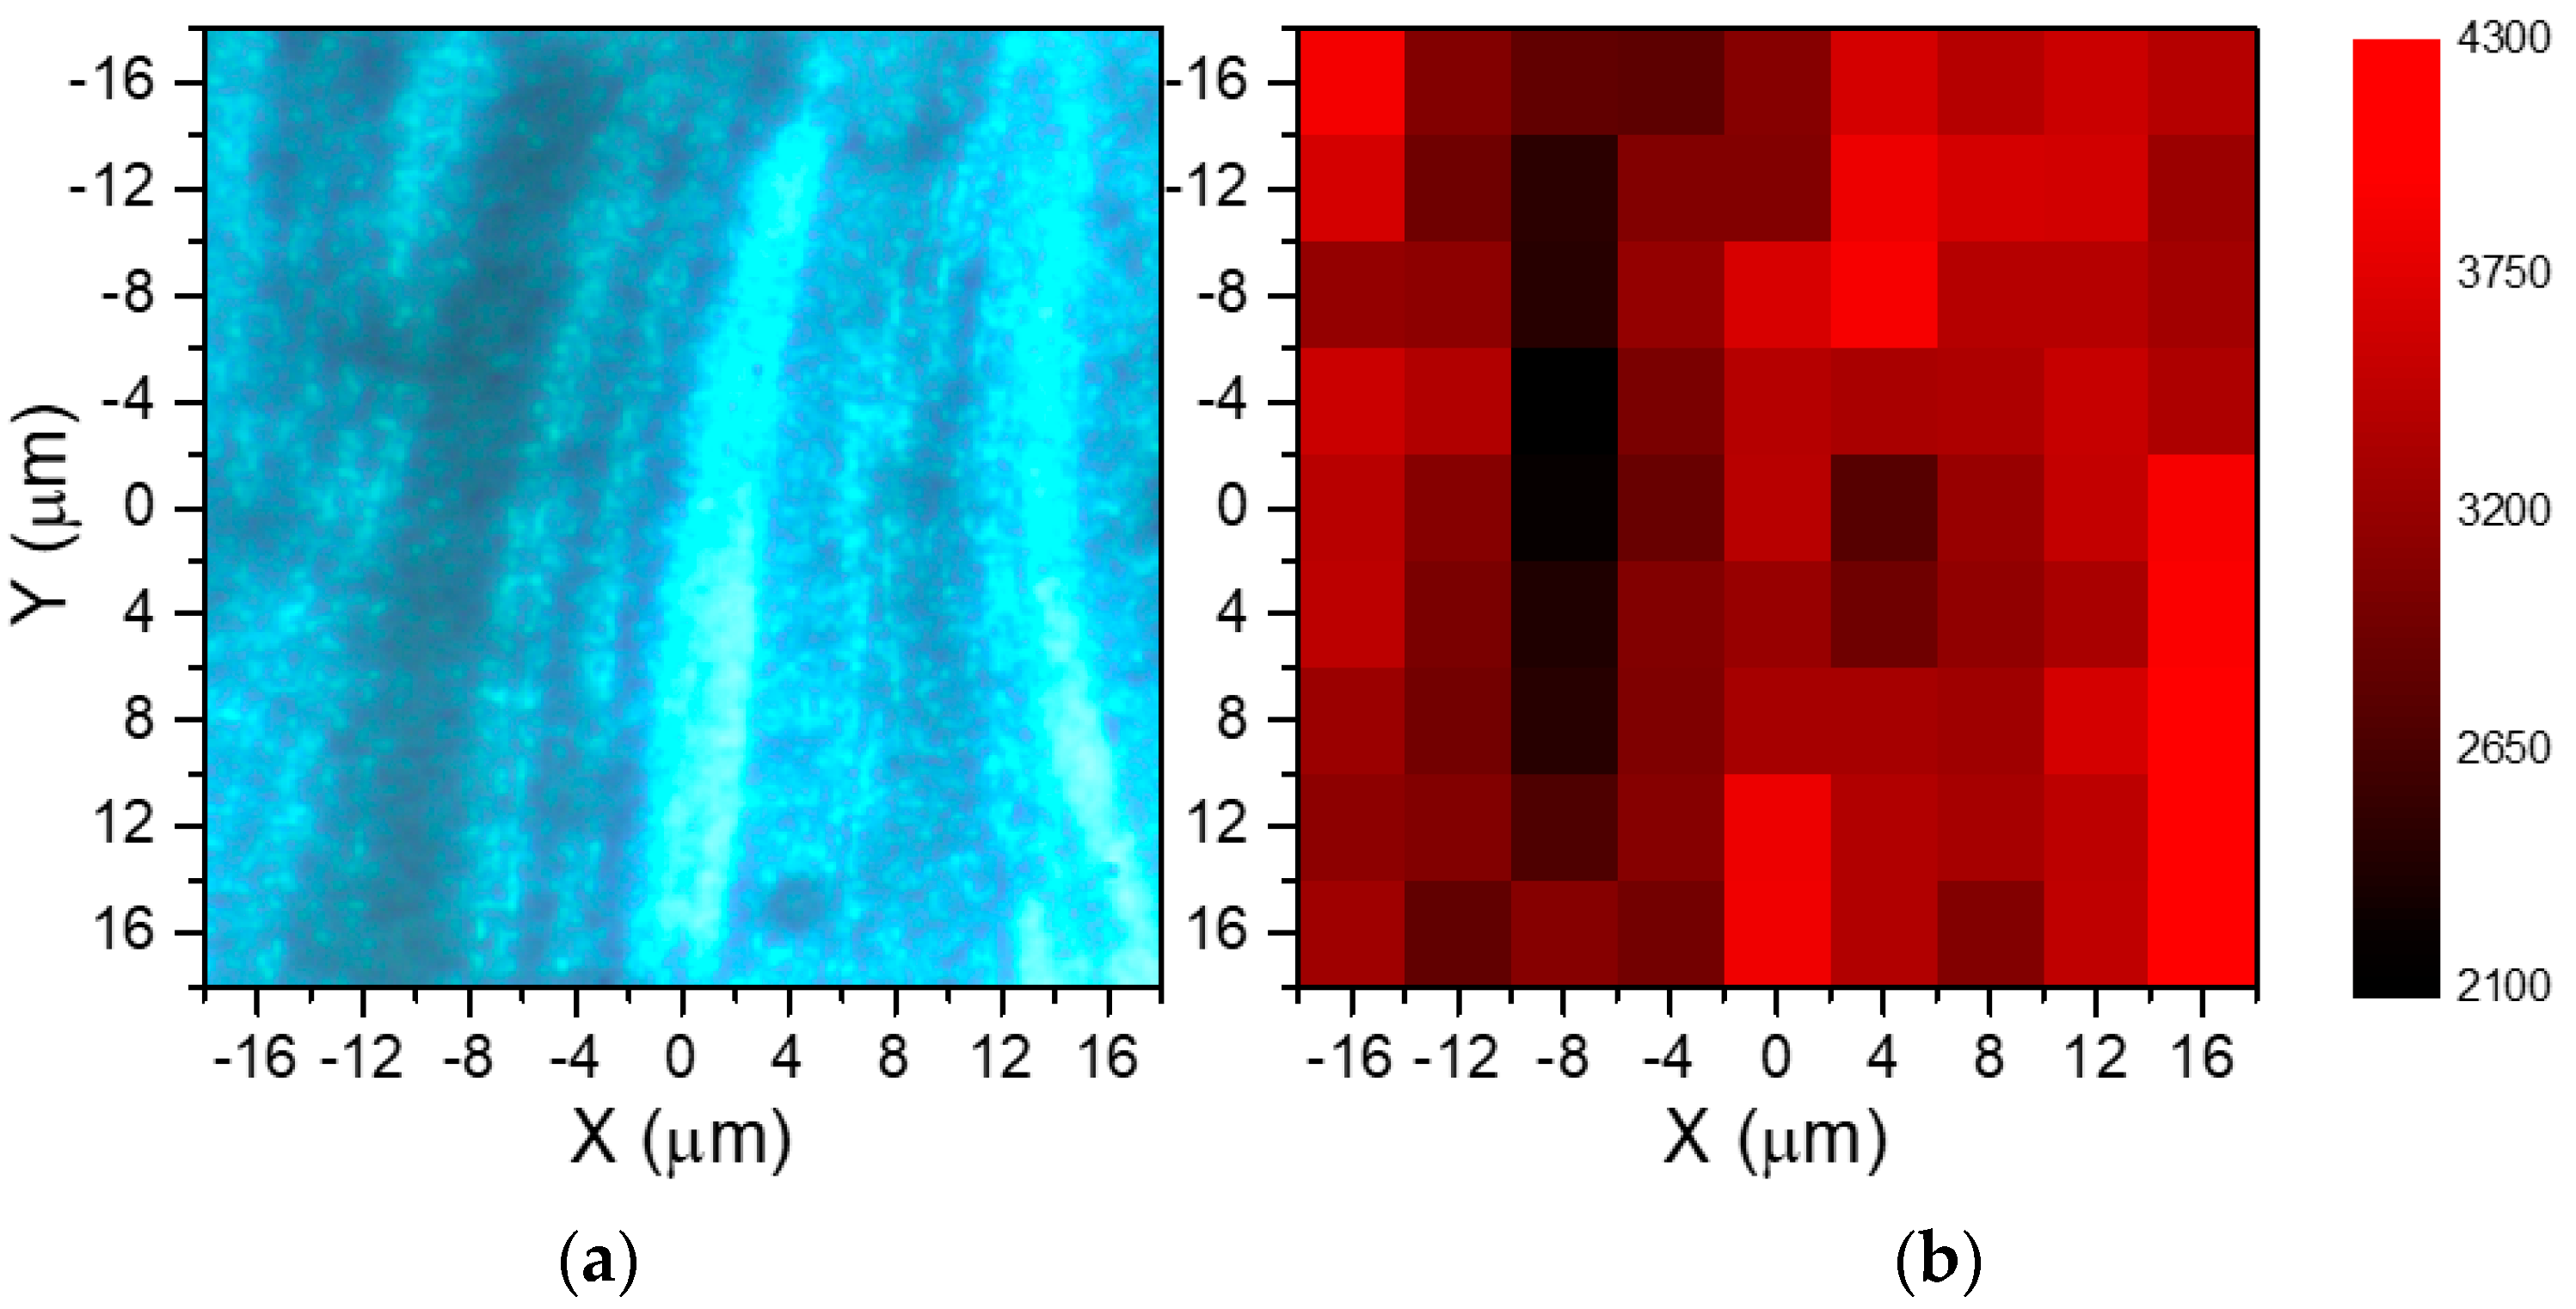
Figure 9 (32 × 32 μm2, step 4 μm) shows intensity varying by a factor of approximately 2, due to local variations of the effective film thickness. No changes in peak position, width or shape were observed.

3.5. Reflectance

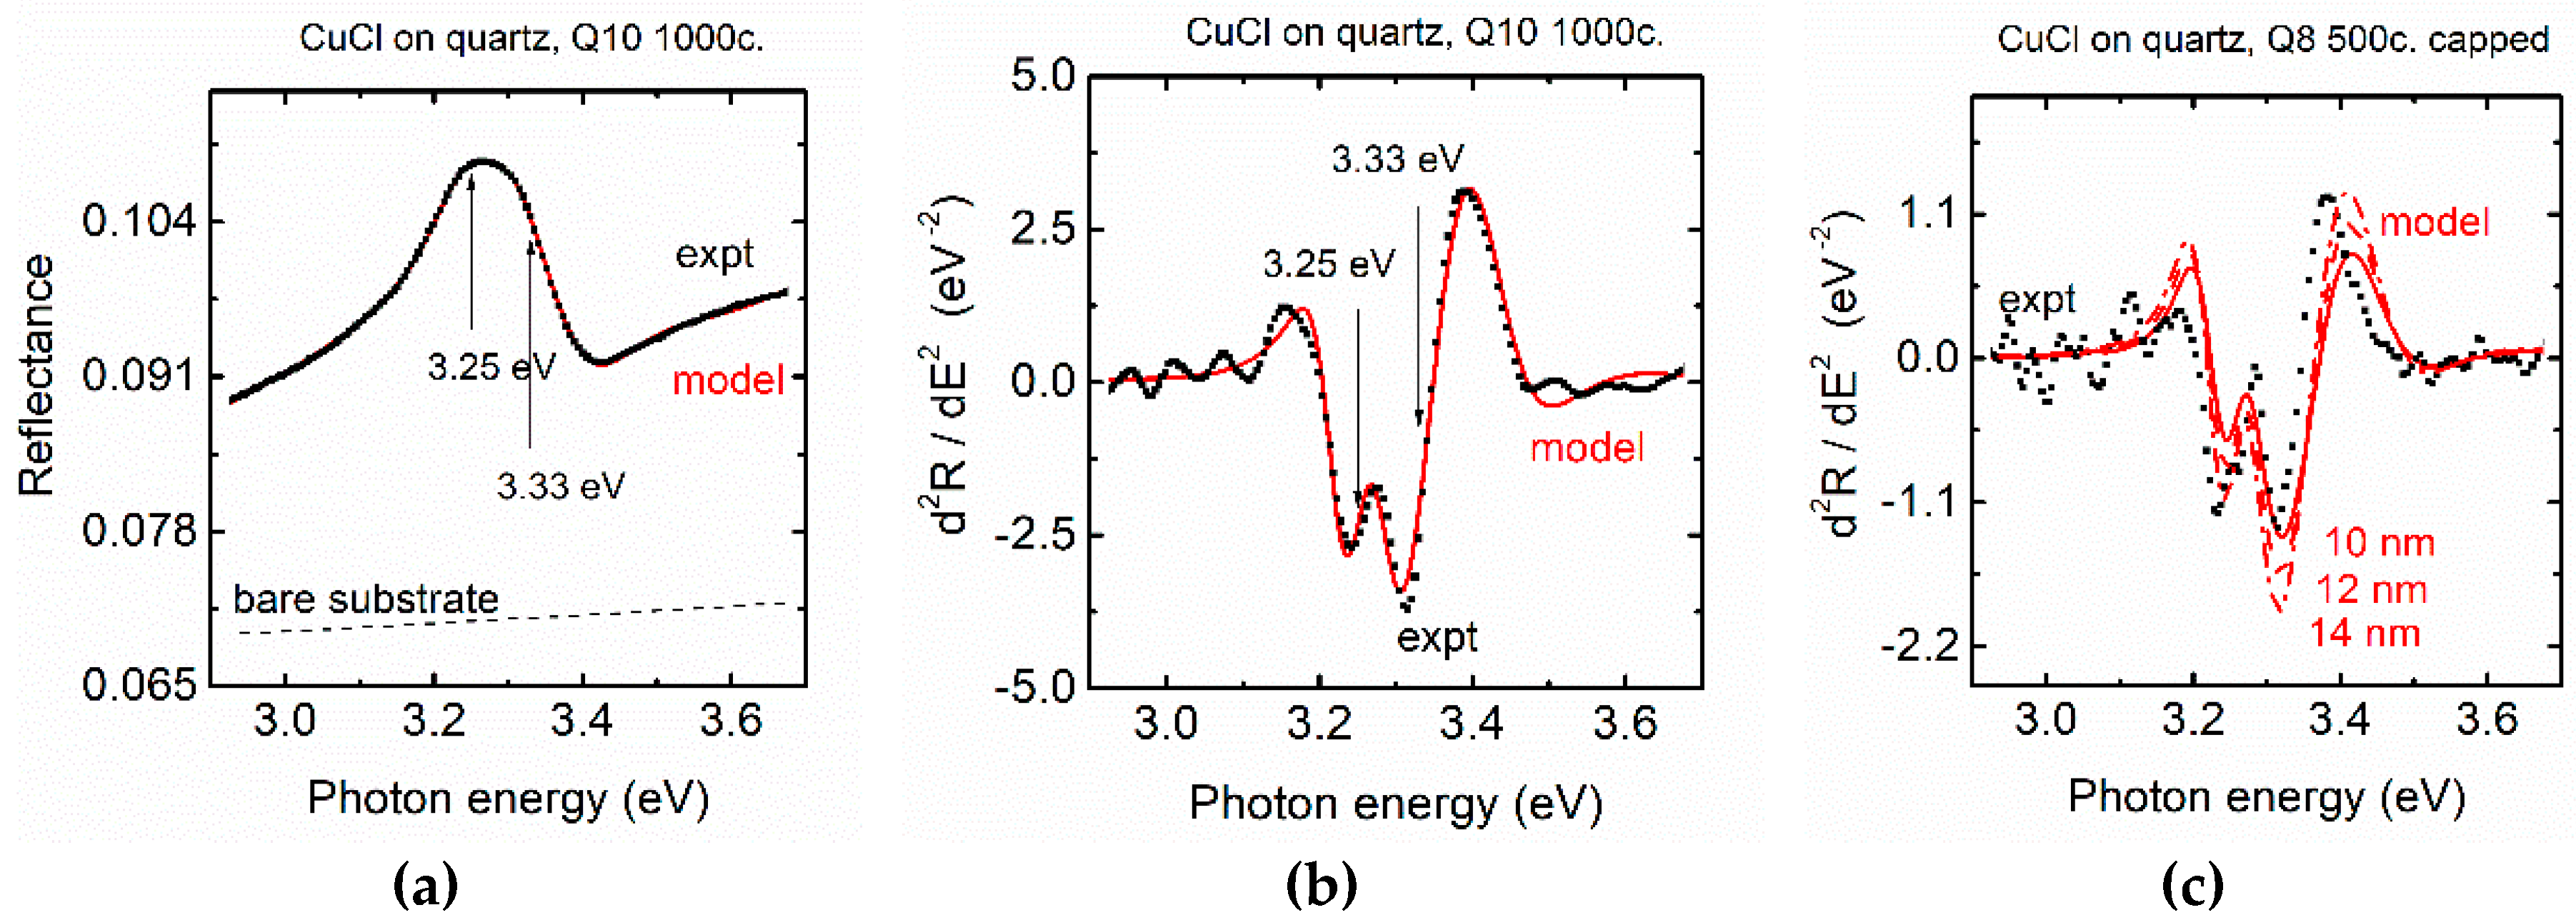
The measured reflectance spectrum of the thickest uncapped CuCl film (Q10 1000 c.) is shown in Figure 10a. It shows a significant increase of the reflected intensity compared to the bare substrate, which is indicative of a larger optical density of the film. In addition, a fairly strong spectral structure with maximum intensity at about 3.3 eV has apparently at least two narrow components. The latter are better seen in the twice differentiated spectra plotted in Figure 10b. The differentiation enhances the sharper structures and suppresses the flat background. Based on the narrow structures in the derivative spectra, we have fitted the measured reflectance with a model consisting of a flat background dielectric function, with two superposed Gaussian absorption bands. The model lineshape of Figure 10a,b represents the best-fit results with the (fitted) value of the film thickness of 29 nm, and the background value of the real part of its dielectric function of 3.2. The resulting parameters of the bands are listed in Table 7. The strength parameter is proportional to the area below the absorptive (imaginary) part of the dielectric function, having the units of eV; however, we are interested in relative values and use arbitrary units here.
The two Gaussian bands are 0.08 eV apart, which is in a good agreement with the distance of 0.06 eV seen in the absorption spectra of Z3 (3.23 eV) and Z1,2 (3.308 eV) excitons at in the PL results and those seen at 4 K [44]. In addition, the significantly larger strength of the upper (3.30 eV) band is clearly seen in the reflectance results, in contrast to the PL intensities. This is similar to the relative intensities seen in direct optical absorption measurements [18,45]. We have also observed a weak and broad luminescence band centred at about 2.7 eV, with the maximum signal below 4% of the main PL band; its high energy tail forms the smooth background seen in Figure 7. This may be due to radiative recombination of defect states in the CuCl crystallites, as well as other species present in the deposited layer.
A film of the sample Q8 (500 c. with an Al2O3 capping layer) displays a reduced intensity excitonic structure in the differentiated reflectance, see Figure 10c. The results are compatible with reduced effective film thickness of approximately 12 nm. In addition, the upper lineshape seems to be narrower than that of the thicker sample Q10, probably due to the smaller dispersion of the crystallite sizes. It can be seen that reflectance measurements are a useful way to identify the presence of CuCl in thin films. This method would be particularly useful where the film is deposited on a non-UV transparent substrate.
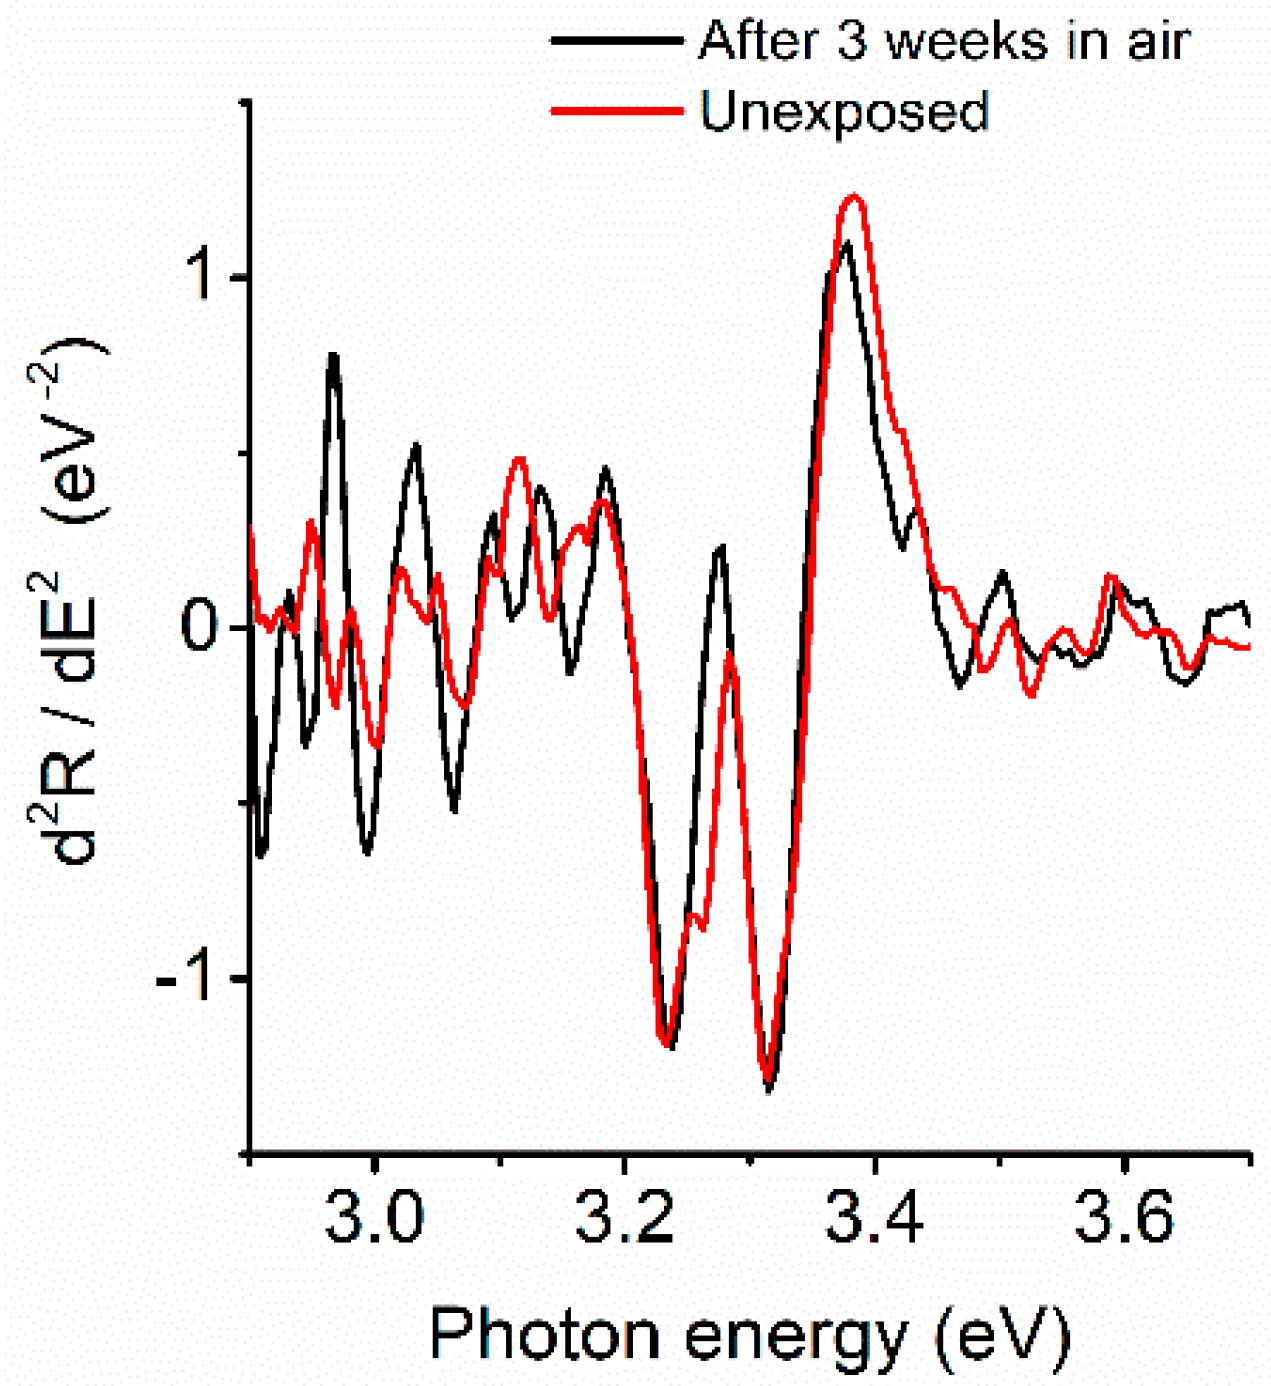
The reflectance of sample Q8 was remeasured after approximately three weeks in normal atmosphere. A comparison between the two measurements is shown in Figure 11. There is no significant change to the excitonic absorption confirming the XPS results that 5 nm of ALD Al2O3 provides an effective protection layer for the CuCl. This is consistent with published work showing that ALD Al2O3 constitutes a good moisture diffusion barrier when applied to other materials [46].

4. Conclusions

It has been demonstrated that CuCl can be deposited by sequentially pulsed vapour deposition process using the precursors [Bis(trimethylsilyl)acetylene](hexafluoroacetylacetonato)copper(I) and pyridine hydrochloride and that an in situ ALD capping layer of aluminium oxide is an effective barrier for preventing atmospheric degradation. The crystal structure has been shown to be the zinc blende-structure γ-CuCl by XRD. The crystallites become more facetted as the film thickness increases. The bulk of films shows only some organic contamination from incomplete precursor reaction, however, there is heavier organic contamination on the surface, again from unreacted precursor molecules. The characteristic photoluminescence behaviour of CuCl has been shown with emissions from the Z1,2, Z3 and bound excitons. The chemical composition was investigated by XPS: the 200 c. and 500 c. films show surface layers with predominantly Cu+ bonding from CuCl with some organic contamination. The thicker films with 1000 deposition cycles have significant Cu2+ content from CuF2 or F containing organic fragments. Optical reflectance measurements have shown that the characteristic exciton absorptions can be detected, at similar energies to optical absorption features measured by transmission. This enables exciton absorption measurements to be carried out on nontransparent samples.
The overall results show that this is a method for deposition of nanocrystalline arrays suitable for further investigation for the development of new optoelectronic structures and devices. Further studies are also required to clarify the difference in chemical composition between the surface layers and the bulk of the film.

Author Contributions

Conceptualization, D.C.C; Methodology, D.C.C.; Formal Analysis, T.H., R.K., and D.C.C.; Investigation, R.K., T.H., O.C., K.K., R.Z., J.P., and J.M.M.; Resources, R.Z., J.P., and J.M.M.; Writing–Original Draft Preparation, T.H. and J.H.; Writing–Review & Editing, D.C.C., J.H., R.Z., J.M.M., R.K., T.H., K.K., and O.C.; Visualization, D.C.C. and J.H.; Supervision, D.C.C., J.H., and J.M.M.; Project Administration, D.C.C. and R.K.; Funding Acquisition, D.C.C. and J.M.M.

Funding

This work was financially supported by the Czech Science Foundation (No. 17-02328S), the Ministry of Youth, Education and Sports of the Czech Republic (Nos. LM2015082, LQ1601, LO1411 (NPU I), and CZ.02.1.01/0.0/0.0/16_013/0001829), and the European Regional Development Fund (project CZ.1.05/2.1.00/03.0086).

Acknowledgement

The authors acknowledge the support of COST action MP1402 HERALD in the course of this work.

Conflicts of Interest

The authors declare no conflicts of interest.

References

  1. Soga, M.; Imaizumi, R.; Kondo, Y.; Okabe, T. A method of growing CuCl single crystals with flux. J. Electrochem. Soc. 1967, 114, 388–390. [Google Scholar] [CrossRef]
  2. Nakayama, M.; Ichida, H.; Nishimura, H. Bound-biexciton photoluminescence in CuCl thin films grown by vacuum deposition. J. Phys. Cond. Matter 1999, 11, 7653–7662. [Google Scholar] [CrossRef]
  3. Monemar, B. Fundamental energy gap of GaN from photoluminescence excitation spectra. Phys. Rev. B 1974, 10, 676. [Google Scholar] [CrossRef]
  4. Ryu, Y.R.; Lee, T.S.; White, H.W. Properties of arsenic-doped-type ZnO grown by hybrid beam deposition. Appl. Phys. Lett. 2003, 83, 87–89. [Google Scholar] [CrossRef]
  5. Alam, M.M.; Lucas, F.O.; Danieluk, D.; Bradley, A.L.; Daniels, S.; McNally, P.J. Temperature dependent photoluminescence of nanocrystalline γ-CuCl hybrid films. Thin Solid Films 2014, 564, 104–109. [Google Scholar] [CrossRef]
  6. Alam, M.M.; Lucas, F.O.; Danieluk, D.; Bradley, A.L.; Rajani, K.V.; Daniels, S.; McNally, P.J. Hybrid organic–inorganic spin-on-glass CuCl films for optoelectronic applications. J. Phys. D Appl. Phys. 2009, 42, 225307. [Google Scholar] [CrossRef]
  7. Göbel, A.; Ruf, T.; Cardona, M.; Lin, C.T.; Wrzesinski, J.; Steube, M.; Reimann, K.; Merle, J.C.; Joucla, M. Effects of the isotopic composition on the fundamental gap of CuCl. Phys. Rev. B 1998, 57, 15183. [Google Scholar] [CrossRef]
  8. Mitra, A.; O’Reilly, L.; Lucas, O.F.; Natarajan, G.; Danieluk, D.; Bradley, A.L.; McNally, P.J.; Daniels, S.; Cameron, D.C.; Reader, A.; Martinez-Rosas, M. Optical properties of CuCl films on silicon substrates. Phys. Status Solidi B 2008, 245, 2808–2814. [Google Scholar] [CrossRef]
  9. Grun, J.B.; Hönerlage, B.; Levy, R. Dynamics of optical nonlinearities and bistability in 3-level systems (CuCl). Phys. Scr. 1986, T13, 184–188. [Google Scholar] [CrossRef]
  10. Gomes, M.; Kippelen, B.; Hönerlage, B. Time, intensity and energy dependence of four-wave mixing processes in CuCl. Phys. Stat. Solidi B 1990, 159, 101–106. [Google Scholar] [CrossRef]
  11. Natarajan, G.; Daniels, S.; Cameron, D.C.; O’Reilly, L.; Mitra, A.; McNally, P.J.; Lucas, O.; Rajendra Kumar, R.T.; Reid, I.; Bradley, A.L. Stoichiometry control of sputtered CuCl thin films: Influence on ultraviolet emission properties. J. Appl. Phys. 2006, 100, 033520. [Google Scholar] [CrossRef] [Green Version]
  12. Kawamori, A.; Edamatsu, K.; Itoh, T. Growth of CuCl nanostructures on CaF2(111) substrates by MBE—Their morphology and optical spectra. J. Cryst. Growth 2002, 237–239, 1615–1619. [Google Scholar] [CrossRef]
  13. O’Reilly, L.; Lucas, O.F.; McNally, P.J.; Reader, A.; Natarajan, G.; Daniels, S.; Cameron, D.C.; Mitra, A.; Martinez-Rosas, M.; Bradley, A.L. Room-temperature ultraviolet luminescence from γ-CuCl grown on near lattice-matched silicon. J. Appl. Phys. 2005, 98, 113512. [Google Scholar] [CrossRef] [Green Version]
  14. Zhou, Y.Y.; Lu, M.K.; Zhou, G.J.; Wang, S.F. Preparation and photoluminescence of gamma-CuI nanoparticles. Mater. Lett. 2006, 60, 2184–2186. [Google Scholar] [CrossRef]
  15. Kurisu, H.; Nagoya, K.; Nakayama, N.; Yamamoto, S.; Matsura, M. Exciton and biexciton properties of CuCl microcrystals in an SiO2 matrix prepared by sputtering method. J. Lumin. 2000, 87–89, 390–392. [Google Scholar] [CrossRef]
  16. Fukumi, K.; Chayahara, A.; Kageyama, H.; Kadono, K.; Akai, T.; Mizoguchi, H.; Horino, Y.; Makihara, M.; Fujii, K.; Hayakawa, J. Formation process of CuCl nano-particles in silica glass by ion implantation. J. Non-Cryst. Sol. 1999, 259, 93–99. [Google Scholar] [CrossRef]
  17. Yingjie, Z.; Yitai, Q.; Youfou, C. γ-Radiation synthesis of nanocrystalline powders of copper (I) halides. Mater. Sci. Eng. B 1999, 57, 247–250. [Google Scholar] [CrossRef]
  18. Natarajan, G.; Maydannik, P.S.; Cameron, D.C.; Akopyan, I.; Novikov, B.V. Atomic layer deposition of CuCl nanoparticles. Appl. Phys. Lett. 2010, 97, 241905. [Google Scholar] [CrossRef]
  19. Maydannik, P.S.; Natarajan, G.; Cameron, D.C. Atomic layer deposition of nanocrystallite arrays of copper(I) chloride for optoelectronic structures. J. Mater. Sci.-Mater. Electron. 2017, 28, 11695–11701. [Google Scholar] [CrossRef]
  20. Lucas, O.; O’Reilly, L.; Natarajan, G.; McNally, P.J.; Daniels, S.; Taylor, D.M.; William, S.; Cameron, D.C.; Bradley, A.L.; Mitra, A. Encapsulation of the heteroepitaxial growth of wide bandgap-CuCl on silicon substrates. J. Cryst. Growth 2006, 287, 112–117. [Google Scholar] [CrossRef]
  21. George, S.M.; Ott, A.W.; Klaus, J.W. Surface chemistry for atomic layer growth. J. Phys. Chem. 1996, 100, 13121–13131. [Google Scholar] [CrossRef]
  22. Cameron, D.C.; Krumpolec, R.; Ivanova, T.V.; Homola, T.; Černák, M. Nucleation and initial growth of atomic layer deposited titanium oxide determined by spectroscopic ellipsometry and the effect of pretreatment by surface barrier discharge. Appl. Surf. Sci. 2015, 345, 216–222. [Google Scholar] [CrossRef]
  23. Humlíček, J.; Šik, J. Optical functions of silicon from reflectance and ellipsometry on silicon-on-insulator and homoepitaxial samples. J. Appl. Phys. 2015, 118, 195706. [Google Scholar] [CrossRef] [Green Version]
  24. Sesselmann, W.; Chuang, T.J. The interaction of chlorine with copper: I. Adsorption and surface reaction. Surf. Sci. 1993, 176, 32–66. [Google Scholar] [CrossRef]
  25. Vasquez, R.P. CuCl by XPS. Surf. Sci. Spect. 1993, 2, 138–143. [Google Scholar] [CrossRef]
  26. Vasquez, R.P. CuCl2 by XPS. Surf. Sci. Spect. 1993, 2, 160–164. [Google Scholar] [CrossRef]
  27. Martin-Vosshage, D.; Chowdari, B.V.R. XPS Studies on (PEO)nLiCIO4 and (PEO)nCu(CIO4)2 polymer electrolytes. J. Electrochem. Soc. 1995, 142, 1442–1446. [Google Scholar] [CrossRef]
  28. Wren, A.G.; Phillips, R.W.; Tolentino, C.U. Surface-reactions of chlorine molecules and atoms with water and sulfuric-acid at low-temperatures. J. Colloid Interface Sci. 1979, 70, 544–557. [Google Scholar] [CrossRef]
  29. Yamamoto, Y.; Konno, H. Ylide-metal complexes. X. An X-ray photoelectron spectroscopic study of triphenylmethylenephosphorane and gold- and copper-phosphorane complexes. Bull. Chem. Soc. Jpn. 1986, 59, 1327–1330. [Google Scholar] [CrossRef]
  30. Beamson, G.; Briggs, D. High Resolution XPS of Organic Polymers: The Scienta ESCA300 Database; Wiley: New York, NY, USA, 1992. [Google Scholar]
  31. Klein, J.C.; Proctor, A.; Hercules, D.M.; Black, J.F. X-ray excited Auger intensity ratios for differentiating copper-compounds. Anal. Chem. 1983, 55, 2055–2059. [Google Scholar] [CrossRef]
  32. Wagner, C.D. Chemical-shifts of auger lines, and Auger parameter. Faraday Discuss. Chem. Soc. 1975, 60, 291–300. [Google Scholar] [CrossRef]
  33. Ressan, M.; Furlani, C.; Polzonetti, G. XPS of coordination-compounds—Additive ligand effect in some copper(I) and copper(II) chelates with 1,2 phosphino (or phosphine oxide)-sulfido ethane ligands. Polyhedron 1983, 2, 523–528. [Google Scholar] [CrossRef]
  34. Parmigiani, F.; Depero, L.E.; Minerva, T.; Torrance, J.B. The fine-structure of the Cu 2p3/2 X-ray photoelectron-spectra of copper-oxide based compounds. J. Electron. Spectrosc. Relat. Phenom. 1992, 58, 315–323. [Google Scholar] [CrossRef]
  35. Kishi, K.; Ikeda, S. X-ray photoelectron spectroscopic study of the reaction of evaporated metal films with chlorine gas. J. Phys. Chem. 1974, 78, 107–112. [Google Scholar] [CrossRef]
  36. Li, X.; Liu, Z.; Kim, J.; Lee, J-Y. Heteogeneous catalytic reaction of elemental mercury vapor over cupric chloride for mercury emissions control. Appl. Catal. B Environ. 2013, 132–133, 401–407. [Google Scholar] [CrossRef]
  37. Biesinger, M.C.; Lau, L.W.M.; Gerson, A.R.; Smart, R.S.C. Resolving surface chemical states in XPS analysis of first row transition metals, oxides and hydroxides: Sc, Ti, V, Cu and Zn. Appl. Surf. Sci. 2010, 257, 887–898. [Google Scholar] [CrossRef]
  38. Van der Laan, G.; Westra, C.; Haas, C.; Sawatzky, G.A. Satellite structure in photoelectron and auger-spectra of copper dihalides. Phys. Rev. B 1981, 23, 4369. [Google Scholar] [CrossRef]
  39. Finster, J.; Klinkenberg, E.-D.; Heeg, J.; Braun, W. ESCA and SEXAFS investigations of insulating materials for ULSI microelectronics. Vacuum 1990, 41, 1586–1589. [Google Scholar] [CrossRef]
  40. O’Reilly, L.; Natarajan, G.; McNally, P.J.; Cameron, D.; Lucas, O.F.; Martinez-Rosas, M.; Bradley, L.; Reader, A.; Daniels, S. Growth and characterisation of wide-bandgap, I–VII optoelectronic materials on silicon. J. Mater. Sci. Mater. Electron. 2005, 16, 415–419. [Google Scholar] [CrossRef]
  41. Natarajan, G.; Mitra, A.; O’Reilly, L.; Daniels, S.; Cameron, D.C.; McNally, P.J.; Lucas, O.F.; Bradley, L. Optical investigations on sputtered CuCl thin films. In Progress in Semiconductor Materials V: Novel Materials and Electronic and Optoelectronic Applications, Proceedings of the MRS Symposium, Boston, MA, USA, 28 November–1 December 2005; Olafsen, L.J., Biefeld, R.M., Wanke, M.C., Saxler, A.M., Eds.; Cambridge University Press: New York, NY, USA, 2006; pp. 151–156. [Google Scholar]
  42. Natarajan, G.; Mitra, A.; Daniels, S.; Cameron, D.C.; McNally, P.J. Temperature dependent optical properties of UV emitting γ-CuCl thin films. Thin Solid Films 2008, 516, 1439–1442. [Google Scholar] [CrossRef]
  43. Certier, M.; Wecker, C.; Nikitine, S. Zeeman effect of free and bound excitons in CuCl. J. Phys. Chem. Sol. 1969, 30, 2135–2142. [Google Scholar] [CrossRef]
  44. Cardona, M. Optical properties of the silver and cuprous halides. Phys. Rev. 1963, 129, 69–78. [Google Scholar] [CrossRef]
  45. Akopyan, I.K.; Golubkov, V.V.; Dyatovla, O.A.; Novikov, B.V.; Tsagan-Mandzhiev, A.N. Structure of copper halide nanocrystals in photochromic glasses. Phys. Solid State 2008, 50, 1352–1356. [Google Scholar] [CrossRef]
  46. Carcia, P.F.; McLean, R.S.; Walls, D.J.; Reilly, M.H.; Wyre, J.P. Effect of early stage growth on moisture permeation of thin-film Al2O3 grown by atomic layer deposition on polymers. J. Vac. Sci. Technol. A 2013, 31, 061507. [Google Scholar] [CrossRef]
Figure 1. SEM images of CuCl deposited on soda-lime glass: (a) 100 c.; (b) 200 c.; (c) 500 c.; and (d) 1000 c. Scale bars represent 1 μm.
Coatings 08 00369 g001
Figure 2. (a) Crystallite diameter vs. number of atomic layer deposition (ALD) cycles using pyridine hydrochloride (PyrHCl) precursor and (b) comparison with previous results using HCl/butanol as precursor (HCl). PyrHCl–Si, + PyrHCl–glass, HCl (short purge), HCl (long purge). In (b) error bars have been omitted for clarity.
Coatings 08 00369 g002
Figure 3. XRD spectra of (a) uncapped and (b) capped CuCl films on quartz substrates. Unidentified peaks marked with asterisks. Note: The “missing” CuCl peaks ((200), (222), (400), and (420)) have low intensities compared to the (111) peak for randomly oriented material (PDF 1010991).
Coatings 08 00369 g003
Figure 4. XPS Cl 2p spectra for uncapped quartz samples showing fitted peaks: (a) Unsputtered Q7 500 c.; (b) unsputtered Q10 1000 c.; (c) Ar-sputtered Q7 500 c.; and (d) Ar-sputtered Q10 1000 c.
Coatings 08 00369 g004
Figure 5. XPS Cu 2p peaks, uncapped quartz samples: (a) Q7 500 c. and Q10 1000 c., unsputtered; (b) Q7 500 c. and Q10 1000 c., Ar-sputtered; (c) decomposed 2p3/2 peak, Q7, unsputtered; (d) decomposed 2p3/2 peak, Q7, Ar-sputtered; (e) decomposed 2p3/2 peak, Q10, unsputtered; and (f) decomposed 2p3/2 peak, Q10, Ar-sputtered.
Coatings 08 00369 g005aCoatings 08 00369 g005b
Figure 6. Decomposition of O 1s peaks for uncapped quartz samples: (a) Q7 500 c., unsputtered; (b) Q10 1000 c., unsputtered; and (c) Q10 1000 c., Ar-sputtered.
Coatings 08 00369 g006
Figure 7. Decomposition of (a) Cl 2p and (b) Cu 2p3/2 peaks of Q8 (500 c. capped, Ar-sputtered) after approximately 3 weeks in normal air.
Coatings 08 00369 g007
Figure 8. Photoluminescence emission intensity vs. photon energy showing resolved peaks for Q10 (1000 c. uncapped sample). The dashed line is the fitted peak.
Coatings 08 00369 g008
Figure 9. Uncapped quartz sample Q10, 1000 c. (a) White light photography and (b) integral PL intensity (arb. units) over the same area of the substrate with 4 × 4 μm2 resolution.
Coatings 08 00369 g009
Figure 10. (a) Normal incidence reflectance spectra of the uncapped, 1000 c. sample; the positions of two prominent Gaussian bands are indicated by arrows, bare substrate (dashed line); (b) second derivative; and (c) second derivative of the reflectance spectrum from the capped, 500 c. sample. Measured data (symbols), model lineshapes (red solid and dashed lines).
Coatings 08 00369 g010
Figure 11. Comparison of reflectance curves (2nd derivative) for aluminium oxide-capped sample Q8 before and after approximately 3-week exposure to ambient air.
Coatings 08 00369 g011
Table 1. Deposition parameters for films on quartz substrates.
Sample No.No. of ALD CyclesCapping Layer
Q1100no
Q5200no
Q7500no
Q101000no
Q2100yes
Q6200yes
Q8500yes
Table 2. Element concentration obtained from X-ray photoelectron spectroscopy (XPS) survey scan (not Ar-sputtered).
SampleCyclesConcentration of Elements (at.%)
Cu 2pCl 2pC 1sSi 2pAl 2pO 1sF 1sCu/Cl
No cap Q11000.53.119.629.90.046.60.40.1
Q52001.92.712.931.30.050.50.70.7
Q75001.42.715.731.10.048.60.50.5
Q1010003.810.250.712.80.021.00.60.4
CappedQ21000.30.822.18.421.946.30.30.3
Q62000.20.523.96.023.245.70.40.4
Q85000.20.725.95.524.043.50.30.3
Table 3. Relative concentrations of Cu and Cl obtained from XPS (after Ar sputtering).
SampleCyclesRelative Concentration of Cu and Cl
Cu 2pCl 2pCu/Cl
Q750055451.2
Q10100049511.0
Q8 (capped)50047530.9
Table 4. Components of Cl 2p XPS peaks.
SampleCyclesPeak2p3/2 Binding Energy (eV)Area P2/P1Peak FWHM (eV)
Q7, unsputtered500P1199.01.2
Q7, Ar-sputtered500P1199.61.2
Q10, unsputtered1000P1198.91.01.2
P2198.31.1
Q10, Ar-sputtered1000P1199.10.21.2
P2200.51.4
Q8 (capped), Ar-sputtered500P1199.32.2
Table 5. Peak parameters for Cu 2p XPS.
SampleCyclesPeak Cu 2p3/2Binding Energy (eV)FWHMAssignment
Q7, unsputtered500P1932.61.3CuCl
P2933.72.1Cu(I) org.
Q7, Ar-sputtered500P1932.81.3CuCl
P2933.72.1Cu(I) org.
Q10, unsputtered1000P1932.61.3CuCl
P2934.22.3Cu(I) org.
P3936.73.0organofluoride
S940.33.5Cu2+
Q10, Ar-sputtered1000P1932.51.5CuCl
P2933.82.0Cu(I) org.
P3936.73organofluoride
Q8, Ar-sputtered500P1933.21.8CuCl
P2934.72.1Cu(I) org.
Table 6. Best-fit parameters of the Gaussian bands used in modelling the PL spectrum of Figure 8.
BandStrength (a.u.)Position (eV)Width (eV)
PL15.8 ± 0.33.225 ± 0.0100.097 ± 0.010
PL213.1 ± 0.33.248 ± 0.0100.056 ± 0.010
PL30.7 ± 0.33.308 ± 0.0100.054 ± 0.02
Table 7. Best-fit parameters of the Gaussian bands used in modelling the reflectance spectra of Figure 10.
BandStrength (a.u.)Position (eV)Width (eV)
R10.03 ± 0.013.25 ± 0.010.06 ± 0.02
R20.23 ± 0.013.33 ± 0.010.14 ± 0.02

