Abstract
Road markings play an important role in road safety because they provide significant information to drivers about the road. For that reason, they must be replaced when they are not correctly perceived by road users. To analyse which are the main factors that affect road marking perception over time, a test section was designed in a two-lane rural highway, running actual traffic over 18 different types of markings fabricated with different combinations of drop-on materials. Chromatic coordinates, luminance, and retroreflectivity of each sample were measured during 18 months in order to study their evolution over time. The results obtained show different behaviours depending on the aggregates and application method used. An increment of the durability has been observed with the use of different layers and mixtures of glass microbeads with different sizes.
1. Introduction
Until now, four main engineering treatments have generally been carried out in order to improve road safety: (i) highway updating; (ii) road signing refurbishment; (iii) repainting of road markings; and (iv) pavement resurfacing. Updating the horizontal or vertical signage is the most affordable option and, in addition to this, road safety increases up to 35% [1].
Road markings provide continuous information to road users about roadway alignment and vehicle positioning [2]. Whether lines or pictograms are used, both should transmit an understandable message for any user. In rural highways, where the traffic average speed is high, it is especially important that this kind of signs is clear and understandable [3].
Road marking should meet certain standards of durability, resistance, and visibility [4]. The service threshold is established according to drivers’ safety needs and traffic requirements, and for that reason it is requested [5]:
- Defining road marking’s essential features for that they achieve their function, from the users’ point of view.
- Setting the minimum acceptable value for these features, according to traffic circumstances and the intended objectives.
To ensure a good road marking quality, it is very important to make a proper selection of the materials to be used, for which we should consider economic, environmental, application, and use or location criteria. Amongst all them, their specific characteristics and suitability for use must be principally considered; road marking must fulfil some requirements of durability, skid resistance, and visibility [6].
Daytime visibility is achieved through visual contrast between road marking and pavement [3,4]. Nighttime visibility is reached by using glass microbeads embedded in the paint surface, so the drivers can receive a proper amount of reflected light, providing them an adequate road visibility at night and increasing their safety [7]. The correct retroreflection value is attained through the combination of good quality microbeads and base material (white painting) in a correct dosage. Microbeads efficiency must be assessed for their different compositions and densities in the painting embedment [8]. Previous studies show that microbeads must be embedded from 1/3 to 2/3 of their diameter to optimise light retroreflection [7].
Furthermore, road markings must ensure safety for any road user that drives on them. For this reason, it is also necessary to provide them with antiskid properties (skid resistance) [9].
Road marking should be replaced when their colour, retroreflectivity, or skid resistance measurements drop below a certain value established by regulations [10]. The evolution of these properties (daytime and nighttime visibility, skid resistance, and durability) depends on the quality of the products used, their resistance against traffic conditions, application system, connection between the paint coating and the pavement, base material, traffic volume, etc. [9].
Another aspect that has a vital importance for the behaviour of drivers is how they perceive road safety because of the road markings. On one hand, depending on the situation, this perception makes the users feel more comfortable and protected, but on the other hand it is more likely that if they do not feel like this, they will react impulsively increasing the risk of having an accident on road. It is a delicate issue that must be studied and considered thoroughly by the responsible of every road marking project [11].
This paper is focused on obtaining the best composition for road markings by using different combinations of drop-on materials and postmix application systems: glass microbeads, transparent and non-transparent antiskid aggregates, mixed in different proportions with the same base material, and applied in one or two layers, in order to determine which key aspects should be considered in order to improve visibility distance and skid resistance of road markings, both crucial factors for road safety.
2. Experimental program
2.1. Test Section
For this piece of research, an in situ test section was set on the CV-904 rural two-lane highway from Crevillente to Catral, located at the existing intersection on 4 + 400 kilometric point (KP), in the municipality of Catral, province of Alicante, Spain (see Figure 1). There is virtually no traffic diversion in this junction because this section is only connected with minor rural paths, so it guarantees a continuous traffic flow along the testing samples (transversal stripes). In addition, speed reduction of passing vehicles is negligible, preventing skid marks that could pollute the samples, altering the wearing process. Furthermore, placing the test section in a crossing makes easier to create a third virtual traffic lane to divert the traffic while making or measuring the samples. The tests were performed under actual traffic and weather conditions, which provide more accurate results than those obtained in laboratory simulations.
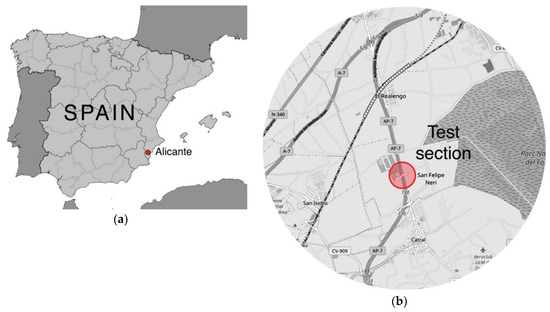
Figure 1.
Test section location: (a) in Spain; (b) at CV-904 two-lane highway (Crevillente-Almoradí).
In the technical datasheet of the traffic count station ID 904020, located at the CV-904 highway, covering traffic flow from 1 + 300 KP to 7 + 000 KP [12], we can observe that traffic volume is balanced between the two lanes, approximately 50% in direction to Catral (ascending) and 50% in direction to Crevillente (descending).
Table 1 shows that that traffic flow is regular over time, with Annual Average Daily Traffic (AADT) values around 4000 vehicles/day, and a decreasing percentage of trucks (PT).

Table 1.
Annual Average Daily Traffic (AADT) and PT (2009–2013), traffic count station ID 904020.
We also notice (see Table 2) that the average traffic flow rates during working days are greater than on weekends, which means that it is a rural road with a predominant mobility function. Annual Average Daily Truck Traffic (AADTT) remains stable throughout the year, being less intense on weekends as well.
Table 2.
Traffic flow rates in 2013, traffic count station ID 904020.
2.2. Materials and Application Systems
We have analysed different compositions of road marking materials and application systems in order to study their damage over time.
2.2.1. Base Material
Base material used in all testing samples is white styrene acrylic painting. Technical specifications are described in Table 3.
Table 3.
White styrene acrylic painting specifications.
2.2.2. Glass Microbeads
We used four different types of glass microbeads, with different grading and surface treatment: (i) Echostar 5 (125–710 µm); (ii) Echostar 20 (1180–125 µm); (iii) Duolux 125 H1 (425–850 µm); and (iv) Ultralux (600–850 µm). Technical information provided by their manufacturers is shown from Table 4, Table 5, Table 6, Table 7 and Table 8, according to EN 1423 [21] and EN 1424/A1 [22] European Standards.
Table 4.
Echostar 5 glass microbeads specifications.
Table 5.
Echostar 20 glass microbeads specifications.
Table 6.
Duolux 125 H1 glass microbeads specifications.
Table 7.
Duolux 121 H1 glass microbeads specifications.
Table 8.
Ultralux glass microbeads specifications.
2.2.3. Antiskid Aggregates
We have used white marble sand (Macael 400) as non-transparent antiskid aggregate and sodium-calcium glass particles (Glass 600) as transparent antiskid aggregate. Macael 400 aggregate properties are described in Table 9.
Table 9.
Macael 400 white marble sand specifications.
Transparent antiskid Glass 600 calcium and sodium granules have irregular shapes and sharp edges to be mixed with glass microbeads, in order to generate roughness. Technical specifications are shown in Table 10.
Table 10.
Glass 600 granules specifications.
2.2.4. Application Systems
Two different types of application systems were used in this study:
- “Monolayer” or single layer system (AS1): it is the traditional system of application. First, the base material is sprayed and immediately after, mixture of drop-on material is projected (it can be just glass microbeads or a mixture of microbeads with transparent or non-transparent antiskid aggregates).
- “Bilayer” or double layer system (AS2): the first step is to create a complete AS1 layer, as explained before; once it is dry, another identical layer is applied over the previous one.
2.3. Test Section Design and Sample Fabrication
Following the indications of the Spanish regulations on road surface marking design, included in the Ministerial Order FOM/3053/2008 [26], we sketched the placement of the testing samples on the pavement with chalk and adhesive tape. As shown in Figure 2, stripes were painted in pairs (except the first one, that is just one stripe), spaced 15 m between groups, except for the single stripe, that is 20 m apart. The last stripe is 50 m away from the intersection, considered as a conflict point.
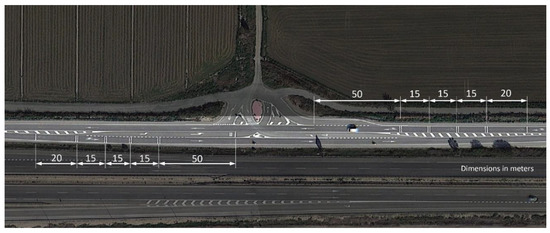
Figure 2.
Test section general layout.
There are nine stripes per traffic direction. In addition, every stripe is divided into two testing samples covering half of the lane, so that both are treaded by a tyre at the same time, totalling 18 testing samples with different combinations of road marking materials (see Table 11). The scheme was repeated in the opposite direction, obtaining a total of 36 testing samples, labelled as shown in Figure 3. As AADT is similar in both directions, it is possible to compare and contrast the results obtained from each testing sample.
Table 11.
Test samples composition and application system.
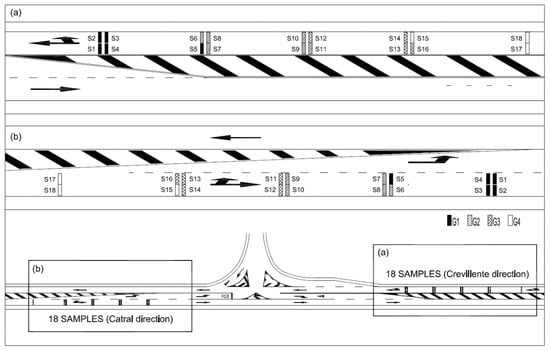
Figure 3.
Testing samples labelling: (a) Crevillente direction; (b) Catral direction.
While fabricating each of in situ testing samples, we obtained specimens in a 15 cm × 30 cm metal plate placed on the pavement while painting to examine them under a laboratory microscope. Figure 4 shows the sample fabrication process.
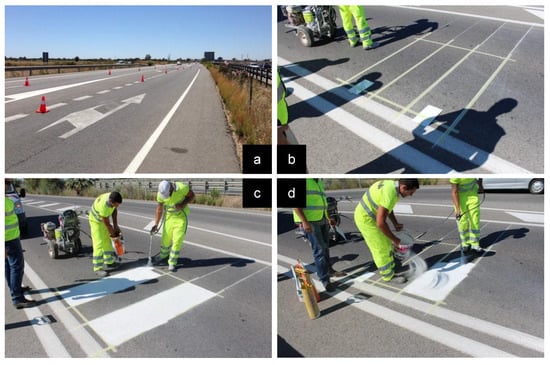
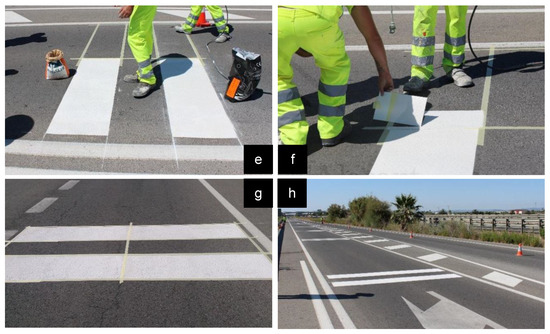
Figure 4.
Sample fabrication process: (a) traffic diversion; (b) sample sketching with chalk and adhesive tape; (c) spraying of base material; (d) application of drop-on material; (e) in situ test sample finished; (f) laboratory specimen fabrication; (g) transversal stripe completed; (h) finished test section, ready to be opened to traffic.
2.4. Tests Performed
We have tested the fundamental parameters of the in situ testing samples: (i) luminance factor β and colour (chromatic coordinates X,Y) for daytime visibility, using a Spectro-Guide 45/0 gloss spectrophotometer (BYK GmbH, Wesel, Germany); (ii) retroreflective luminance coefficient (retroreflectivity) in dry (RL) and wet conditions (RW) for nighttime visibility, using a ZRM 6013 retroreflectometer (Zehntner GmbH, Sissach, Switzerland); and (iii) skid resistance coefficient (SRT) using the TRRL pendulum (Controls SpA, Milan, Italy). All the tests were performed inside the wheel path area. As standards require, each factor was measured a minimum of three times in every testing sample per driving direction, and subsequently the average value is calculated. Therefore, for each kind of mixture tested (S1–S18), at least six values for each parameter and period of time assessed were determined.
For the durability study, we have measured those parameters at different times: just produced, after 1, 6, 12, and 18 months, for a quantitative and qualitative analysis supported by data charts, pictures of in situ testing samples and laboratory specimens using a Leica EZ4D microscope (Leica Microsystems GmbH, Wetzlar, Germany). The weather conditions during data collection are shown in Figure 5.
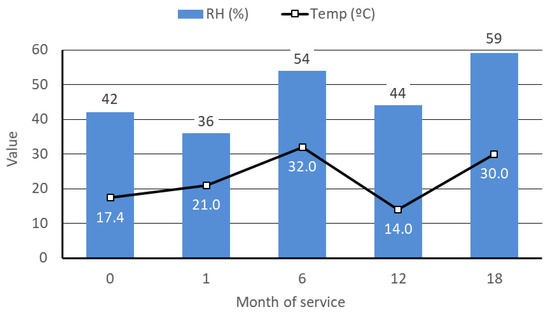
Figure 5.
Surface temperature and relative humidity (RH) measured in the test section during data collection.
3. Results and Discussion
3.1. Daytime Visibility
Figure 6 shows the average results of the chromatic coordinates (X,Y) measured on the 18 in situ testing samples over time. The results obtained are all inside the colour polygon defined by its vertices for the white permanent colour, hence this parameter is not a limiting condition according to the aspects studied in this paper.
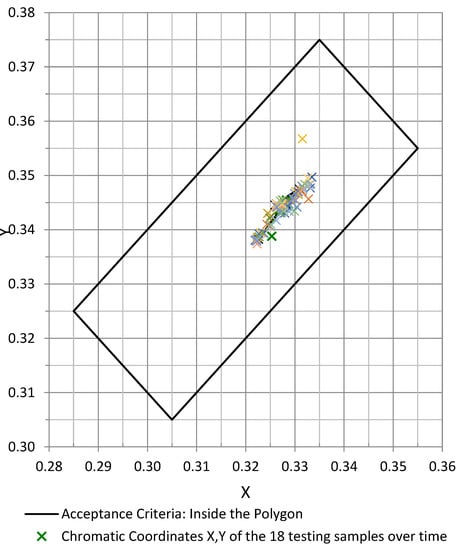
Figure 6.
Chromatic coordinates (X,Y) of the 18 testing samples during the 18-month testing period.
The luminance factor evolution over time is shown in the Figure 7. An analysis of the collected data shows that between the sample groups with AS1 application system (monolayer), the best performance is obtained by the group G1 samples, that only use glass microbeads as drop-on material, followed by group G3, whose samples contain glass microbeads (80%) and glass 600 (20%), and the last one is G2, that has a mixture of glass beads and non-transparent antiskid aggregates as drop-on materials. We should underline that group G4 (bilayer) results follow a similar trend, but getting better outcomes than the equivalent AS1 group with the same kind of drop-on aggregates.
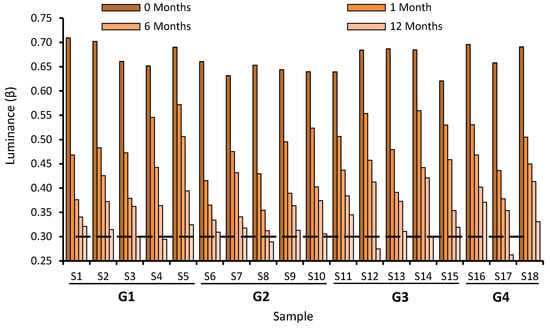
Figure 7.
Evolution of the average luminance factor β in the 18 testing samples.
From the qualitative analysis of the in situ pictures taken from every testing sample over time, we notice that larger glass microbeads become detached first, leaving craters which are filled by dust, dirt, and rubber from tyres, making the road markings darker and losing its luminance factor, as observed in Figure 8a. However, we realize that glass microbeads with an adhesive coating (as in sample S4) are detached with more difficulty, even if they are in bigger sizes. Therefore, a lesser number of craters are created, and the luminance stays better over time, as seen in Figure 8b.
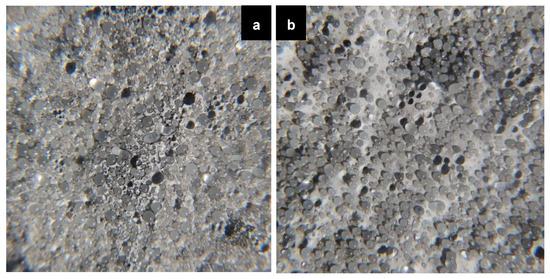
Figure 8.
In situ surface detail after 1 month of service: (a) S2 sample; (b) S4 sample.
Regarding G2 and G3, apart from the craters caused by the detached microbeads, the antiskid aggregates retain dust and rubber particles, which also contributes to reduce luminance (Figure 9).
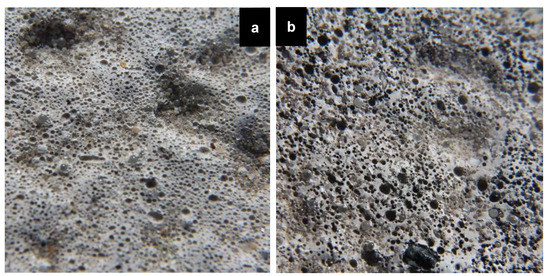
Figure 9.
In situ surface detail after 12 months of service: (a) S8 sample; (b) S13 sample.
From the global analysis of the luminance factor in all the 18 testing samples, we notice that they fulfil the minimum acceptance standard of β = 0.30 established by the Spanish regulations [27,28], being that some testing samples slightly under this value in at 18 months age, as in S12 and S17, but could be still acceptable. That is why we consider that the luminance factor β is not the main limiting factor for durability.
3.2. Nighttime Visibility
Figure 10 shows the evolution of the retroreflectivity in dry conditions, RL. Samples from groups G2 and G3 reached lower RL values than those from G1, which only has glass microbeads as drop-on material.
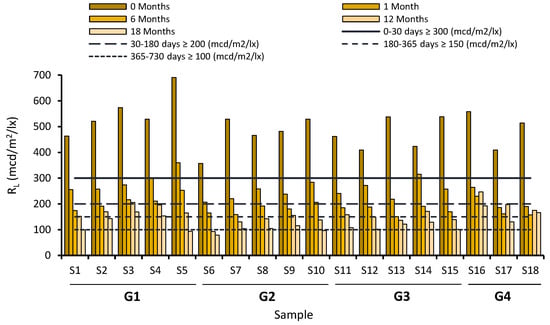
Figure 10.
Evolution of RL on test samples during the first 18 months of service.
From the qualitative analysis of the pictures taken in laboratory, we realized that in G2 the non-transparent antiskid particles were taking up spaces that could be covered with glass microbeads. Consequently, these opaque particles do not let the light go through them. Moreover, they cast shadows to the glass microbeads placed just behind them (Figure 11). That is the reason why this sample group has a considerable loss of retroreflectivity compared to G1.
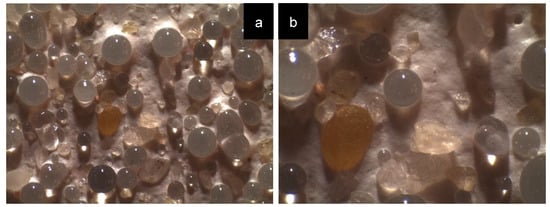
Figure 11.
Microscope detail of S9 sample: (a) ×16 magnifications; (b) ×35 magnifications.
Something similar happens with G3 samples. As they have mixed glass beads plus transparent antiskid aggregates, the last ones let part of the light go through them and be retroreflected (Figure 12). That is why G3 samples obtain better results than in G2, but not as good as in G1.
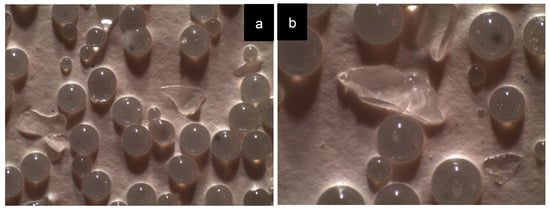
Figure 12.
Microscope detail of S15 sample: (a) ×16 magnifications; (b) ×35 magnifications.
Following the acceptance criteria [27,28], we find that from the eighteenth month, some G2 testing samples have a RL value below Spanish standard requirements (100 mcd/m2/lx). For G3, testing samples S13 and S14 are those whose perform best along the different tests, achieving the best results during service life.
From both qualitative and quantitative analysis, we can conclude that initial retroreflectivity results improve when microbeads used have a greater size. On the other hand, the smaller the glass beads are, the more they embed in the base material, getting less retroreflectivity at first. However, as they detach with more difficulty, retroreflectivity is preserved better along time, extending road marking service life. The samples fabricated with medium-sized glass microbeads (425–850 µm) obtained good results initially and over time. Another important aspect to consider is that glass microbeads with an adhesive coating are detached from the paint with more difficulty, extending road marking performance.
In the G4 testing samples group, a retroreflection increase is observed after twelve months of service. This behaviour could be explained because the upper paint layer is progressively worn out by traffic, revealing the microbeads embedded in the lower layer (Figure 13), improving retroreflectivity. This process starts from the sixth month of service and extends the service life of bilayer road markings, reducing retroreflectivity decay over time.
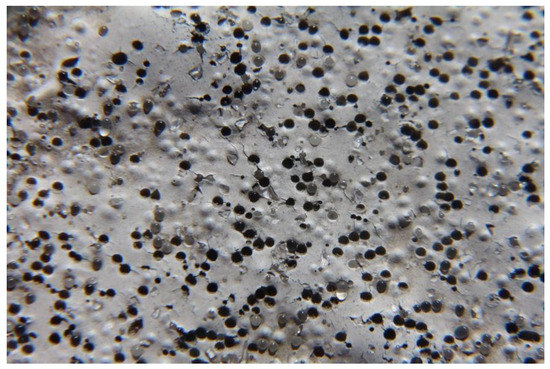
Figure 13.
S18 sample in situ detail after 12 months of service. Emergence of glass microbeads from the bottom layer is observed.
Figure 14 shows retroreflectivity evolution over time in wet conditions. From this figure, it can be confirmed that from six months old, none of the G1, G2, and G3 testing samples reach the minimum value required by Spanish regulations [27,28]. We also notice that samples with bigger microbeads get better RW results than those with smaller ones, because they protrude over the water surface. Furthermore, as bigger microbeads are detached easier, RW drops quickly over time, as seen on Figure 14.
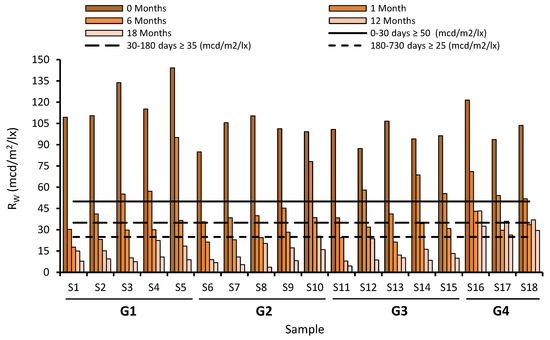
Figure 14.
Evolution of RW on test samples during the first 18 months of service.
As happened with RL values, RW increase from the sixth to the twelfth month is observed in G4 samples, due to the same reason explained before. This effect makes that these three samples achieve the minimum RW values established by the Spanish regulations [27,28].
3.3. Skid Resistance
Figure 15 shows skid resistance results of the 18 testing samples over time. Results were the opposite of those obtained for β, RL, and RW. So, the best group for SRT value is G2, followed by G3 and finally G1. Therefore, non-transparent aggregates have better roughness results than transparent ones.
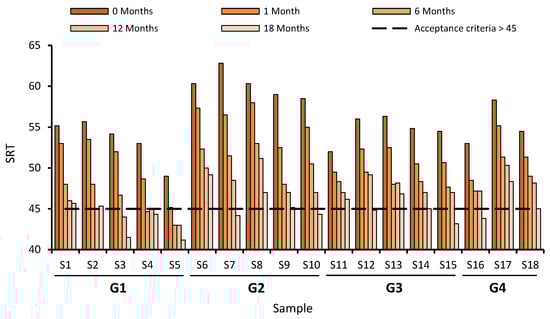
Figure 15.
Skid resistance coefficient (SRT) evolution on test samples during the first 18 months of service.
For G4, testing samples follow same the trend that those testing samples that have the same drop-on materials but are applied using AS1 system. Sample S17 shows the best results in this group, followed by S18 and S16.
4. Conclusions
All sample groups reach the luminance factor acceptance requirements over time. Thus, luminance is not the most determining factor in order to choose the optimum combination of materials for road marking selection amongst all the samples studied. The craters left on the base material by the detached drop-on aggregates are filled with dust and rubber particles, darkening the road markings and making them lose luminance and therefore daytime visibility over time.
Regarding the chromatic coordinates, all the testing samples analysed are inside the polygon that defines permanent white colour during the 18-month testing period. As happens with the luminance factor, colour is not determinant to find the optimum drop-on mixture.
Retroreflectivity of road marking samples made of just microglass beads as drop-on material is greater than those which have a mixture of microbeads and transparent antiskid aggregates, and these ones obtain better results than those made with opaque antiskid aggregates.
Macael 400 particles take the space that could have been covered by glass microbeads and block the incident light, which reduces RL values in G2 samples. Glass 600 particles also fill that space, reducing RL value; however, as they are transparent, they let part of the light go through them, obtaining slightly better RL values in the G3 sample group.
As the size and quality (less impurities and defective beads) of microbeads increase, better initial RL values are obtained. On the other hand, largest microbeads are detached from the painting easier and faster than the smaller ones, because the first ones are poorly embedded in the base material, losing retroreflection capacity over time. Moreover, microcraters left by missing beads are posteriorly filled by dirt, dust, and rubber from tyres, causing also extra luminance loss. Microbeads’ surface coating gives them extra adhesion to remain embedded in the base material, getting really good results, even in the largest diameters. The best RW values are obtained with the largest microbead sizes, because their upper part remains above the water and continues providing some retroreflection capacity.
Bilayer road markings (G4 samples) results follow the trend of their equivalent monolayer sample. It should be pointed out that what we achieve with this application system is to decrease the wearing of road markings from the first month and to keep constant retroreflectivity values from the sixth month to the end of the testing period, even recovering this feature from the sixth to the twelfth month of service because of the emergence of the bottom layer after the wearing of the upper layer.
The relation between skid resistance is opposite to daytime and nighttime visibility: road markings having better SRT results (G2 sample group) obtain lower values of luminance and retroreflectivity. That is because rougher mixtures capture a greater amount of dirt and rubber particles, darkening the markings surface.
Author Contributions
Conceptualization, A.C.-C., J.A.C.-G. and S.I.; Methodology, A.C.-C and S.I.; Validation, L.B. and S.I.; Formal Analysis, A.C.-C. and L.B.; Investigation, A.C.-C. and J.A.C.-G.; Resources, J.A.C.-G.; Writing-Original Draft Preparation, A.C.-C. and L.B.; Writing-Review & Editing, L.B. and S.I.; Visualization, L.B.; Supervision, S.I. and L.B.; Project Administration, S.I.
Funding
This research received no external funding.
Acknowledgments
The authors gratefully acknowledge the Conselleria de Vivienda, Obras Públicas y Vertebración del Territorio from the Valencian Government for their collaboration to develop this study. They also want to acknowledge the Ministerio de Economía y Competitividad from the Spanish Government for funding the PhD grant for Andrés Coves-Campos.
Conflicts of Interest
The authors declare no conflict of interest.
References
- Pérez, I. Safety impact of engineering treatments on undivided rural roads. Accid. Anal. Prev. 2006, 38, 192–200. [Google Scholar] [CrossRef] [PubMed]
- Carlson, P.J.; Park, E.S.; Andersen, C.K. Benefits of pavement markings: A renewed perspective based on recent and ongoing research. Transp. Res. Rec. 2009, 59–69. [Google Scholar] [CrossRef]
- Mammeri, A.; Boukerche, A.; Tang, Z. A real-time lane marking localization, tracking and communication system. Comput. Commun. 2016, 73, 132–143. [Google Scholar] [CrossRef]
- Mirabedini, S.M.; Jamali, S.S.; Haghayegh, M.; Sharifi, M.; Mirabedini, A.S.; Hashemi-Nasab, R. Application of mixture experimental design to optimize formulation and performance of thermoplastic road markings. Prog. Org. Coat. 2012, 75, 549–559. [Google Scholar] [CrossRef]
- Masliah, M.; Bahar, G.; Hauer, E. Application of innovative time series methodology to relationship between retroreflectivity of pavement markings and crashes. Transp. Res. Rec. J. Transp. Res. Board 2007, 119–126. [Google Scholar] [CrossRef]
- Cao, Y. A Design of Experimental Approach to Study the Road Marking Luminance Contrast and Variable Message Signs. Ph.D. Thesis, University of Rhode Island, Kingston, RI, USA, 2004. [Google Scholar]
- Hummer, J.E.; Rasdorf, W.; Zhang, G. Linear mixed-effects models for paint pavement-marking retroreflectivity data. J. Transp. Eng. 2011, 137, 705–716. [Google Scholar] [CrossRef]
- Grosges, T. Retro-reflection of glass beads for traffic road stripe paints. Opt. Mater. 2008, 30, 1549–1554. [Google Scholar] [CrossRef]
- Pasetto, M.; Barbati, S.D. Experimental investigation on road marking distress evolution: beyond testing, quality assurance and maintenance improvement. Adv. Mat. Res. 2013, 723, 846–853. [Google Scholar] [CrossRef]
- Ozelim, L.; Turochy, R.E. Modeling retroreflectivity performance of thermoplastic pavement markings in Alabama. J. Transp. Eng. 2014, 140, 05014001. [Google Scholar] [CrossRef]
- Havard, C.; Willis, A. Effects of installing a marked crosswalk on road crossing behaviour and perceptions of the environment. Transp. Res. Part F Traffic Psychol. Behav. 2012, 15, 249–260. [Google Scholar] [CrossRef]
- Generalitat Valenciana. Memòria Anual D’aforaments [Traffic Counts Annual Report]. Available online: http://www.habitatge.gva.es/web/carreteras/aforos-car/informes-anuales-car (accessed on 15 October 2018). (In Catalan).
- UNE 48076:1992 Paints and Varnishes. Determination of Apparent Viscosity or Consistency. Krebs-Stormer Method; Asociación Española de Normalización y Certificación (AENOR): Madrid, Spain, 1992.
- ISO 2811-1:2016 Paints and Varnishes—Determination of Density—Part 1: Pyknometer Method; International Organization for Standardization: Geneva, Switzerland, 2016.
- UNE 135202:2010 Road Signage Equipment. Horizontal Signage. Paints and Cold Plastics. “No Pick-Up” Drying Time; Asociación Española de Normalización y Certificación (AENOR): Madrid, Spain, 2010.
- ISO 11664-1: 2007 Colorimetry—Part 1: CIE Standard Colorimetric Observers; International Organization for Standardization: Geneva, Switzerland, 2007.
- EN 12802:2012 Road Marking Materials-Laboratory Methods for Identification; European Committee for Standarization: Brussels, Belgium, 2012.
- UNE 135213:2018 Road Signalization Equipment. Horizontal Signalization. Paints. Contrast Ratio of Dried Films; Asociación Española de Normalización y Certificación (AENOR): Madrid, Spain, 2018.
- EN 1871:2000 Road Marking Materials. Physical Properties; European Committee for Standarization: Brussels, Belgium, 2012.
- UNE 48083:1992 Paints and Varnishes. Stability and Conservation in the Container; Asociación Española de Normalización y Certificación (AENOR): Madrid, Spain, 1992.
- EN 1423:2012 Road Marking Materials. Drop on Materials. Glass Beads, Antiskid Aggregates and Mixtures of the Two; European Committee for Standarization: Brussels, Belgium, 2012.
- EN 1424/A1:2003 Road Marking Materials—Premix Glass Beads; European Committee for Standarization: Brussels, Belgium, 2003.
- ISO 2591-1:1998 Test Sieving—Part 1: Methods Using Test Sieves of Woven Wire Cloth and Perforated Metal Plate; International Organization for Standardization: Geneva, Switzerland, 1998.
- ISO 565:1990 Test Sieves—Metal Wire Cloth, Perforated Metal Plate and Electroformed Sheet—Nominal Sizes of Openings; International Organization for Standardization: Geneva, Switzerland, 1990.
- ISO 3310.1:2016 Test Sieves—Technical Requirements and Testing—Part 1: Test Sieves of Metal Wire Cloth; International Organization for Standardization: Geneva, Switzerland, 2016.
- Instrucción Técnica para la Instalación de Reductores de Velocidad y Bandas Transversales de Alerta en Carreteras de la Red de Carreteras del Estado. Orden FOM/3053/2008 [Technical Instruction for the Installation of Speed Bumps and Rumble Strips in State Highways. Ministerial Order FOM/3053/2008], 1st ed.; Centro de Publicaciones de la Secretaría General Técnica del Ministerio de Fomento: Madrid, Spain, 2008. (In Spanish)
- Guía Para el Proyecto y Ejecución de Obras de Señalización Horizontal [Guidelines for Design and Implementation of Road Marking Works], 1st ed.; Centro de Publicaciones de la Secretaría General Técnica del Ministerio de Fomento: Madrid, Spain, 2008. (In Spanish)
- Pliego de Prescripciones Técnicas Generales para Obras de Carreteras y Puentes (PG-3). Orden FOM/2523/2014 [General Technical Specifications for Highway and Bridge Works. Ministerial Order FOM/2523/2014], 1st ed.; Centro de Publicaciones de la Secretaría General Técnica del Ministerio de Fomento: Madrid, Spain, 2008. (In Spanish)
© 2018 by the authors. Licensee MDPI, Basel, Switzerland. This article is an open access article distributed under the terms and conditions of the Creative Commons Attribution (CC BY) license (http://creativecommons.org/licenses/by/4.0/).