Tribo-Mechanical Properties and Corrosion Behavior Investigation of Anodized Ti–V Alloy


1
Department of Mechanical Engineering, Hanyang University, Seoul 04763, Korea
2
Department of Mechanical Engineering, Biomechacin LLC., San Antonio, TX 78251, USA
3
Department of Mechanical and Industrial Engineering, College of Engineering, Qatar University, P.O. Box 2713, Doha 2713, Qatar
4
Department of Biomedical Engineering, Ajman University, Ajman 2758, UAE
5
Department of Architectural Engineering, Hanyang University, Seoul 04763, Korea
*
Authors to whom correspondence should be addressed.
Coatings 2018, 8(12), 459; https://doi.org/10.3390/coatings8120459
Submission received: 19 September 2018
/
Revised: 17 November 2018
/
Accepted: 26 November 2018
/
Published: 12 December 2018
Abstract
:In the work presented in this manuscript, a self-organized TiO2 nanotube array film was produced by electrochemical anodization of a Ti–V alloy in an electrolyte containing NH4F/H3PO4 and then annealed at different temperatures under different atmospheres. The effect of annealing temperature in different atmospheres on the morphology of the film was analyzed, and the tribo-mechanical property and corrosion behavior of TiO2 were investigated. The morphological features and phase compositions were characterized using scanning electron microscopy (SEM) and X-ray diffraction (XRD) respectively. The results indicated that the TiO2 characteristic peaks did not appear after anodization because of the intrinsic amorphous feature. However, highly crystalline TiO2 (anatase and rutile) was produced after annealing from 200 to 600 °C. In addition, there was an improvement in the wear resistance of the Ti–V alloy due to the high hardness and low coefficient of friction of the TiO2 nanotubes’ coating. Moreover, the corrosion behaviors of TiO2 coated and uncoated substrates were evaluated in the synthetic medium, and it was confirmed that the corrosion resistance of the TiO2-coated Ti–V alloy, annealed at 200 °C in the atmosphere, was significantly higher when compared to the uncoated sample.
Keywords:
Ti–V alloy; TiO2 nanotube; tribology; corrosion; anodization; nanoindentation; modulus of elasticity1. Introduction
Titanium and titanium alloys are very popular in biomedical applications, especially as substitutes for hard-tissue and as bone-implant materials due to properties such as low elastic modulus and good fatigue strength, corrosion resistance, biocompatibility, formability, and machinability [1]. Nevertheless, they do not meet all the desired clinical requirements (such as biocompatibility, bounding, etc.) and thus, surface modification is often performed in order to enhance their biological, chemical, and mechanical functionality [2]. For example, sand blasting [3], calcium phosphate coating [4], and acid etching and alkali treatment [5] have been used to modify the surface layer of these materials and improve implant bioactivity and bone growth. Another suitable surface modification technique is that of self-organized TiO2 nanotube layers. These are realizable using different methods such as the sol-gel technique [6], electrophoretic deposition [7], and anodization [8]. Comparison of the three aforementioned methods has shown that anodization has superior layer adhesion strength and is, therefore, more suitable for biological applications [9]. Using anodic oxidation, the chemical bond that is formed between the oxide and Ti substrate likely results in enhanced adhesion strength [10].
The first generation of TiO2 nanotube arrays was grown in HF electrolytes [11] or acidic HF mixtures [12], however, it has been shown that self-organized nanotube TiO2 layers with thicknesses higher than 2 μm could be grown when using buffered neutral electrolytes containing NaF [13] or NH4F [14] instead of HF and taking into consideration the importance of the pH gradient within the tube [15].
Materials implanted in vivo come into contact with extracellular body fluids such as blood and interstitial fluids. In terms of corrosion resistance, TiO2 nanotube layers on titanium have demonstrated higher resistance to corrosion compared to smooth Ti when placed in simulated bio-fluid [16]. In fact, the functional specifications of nanotubular arrays may be manipulated by varying the process parameters [17]. For example, a TiO2 nanotube array with a vertical alignment can be produced on the surface of a titanium substrate by anodization in an electrolyte that contains slightly dissolving fluoride [18]. Electrolytes without fluoride, like sulfuric acid [19], are used to create a compact non-porous TiO2 layer at a low potential and porous oxides at high potential due to the oxide’s electrical breakdown [20].
Investigating the wear on mechanical parts is important for assessing the reliability of materials used in medical implants. This is so since an implant, apart from onetime peak stresses, must also withstand the several million load cycles that it typically experiences throughout its lifetime [21].
In this work, the emphasis was given on the relationship between microstructure characterization and the mechanical properties of TiO2 nanotubes on a Ti alloy substrate fabricated under different conditions: Sintering in the air atmosphere and in vacuum chambers in the presence of Ar gas at different annealing temperatures. Nanoindentation was performed to probe the mechanical properties of the different samples such as Young’s modulus and nanohardness. The wear resistance and corrosion behavior of anodized samples annealed at different temperatures in versatile environments were investigated. The structure and morphology of the coated samples were evaluated using scanning electron microscopy (SEM), atomic force microscopy (AFM), energy-dispersive X-ray spectroscopy (EDS), and X-ray diffraction (XRD) analysis.
2. Materials and Methods
2.1. Materials
Ti–V tablets (20 mm × 5 mm, Special Material and Equipment Produce Co., Ltd., Baoji, China) were used in this study with the chemical composition (wt %) tabulated in Table 1. Phosphoric acid (H3PO4, ≥85.0%, DaeJung Chemicals & Metals, Shiheung, Korea), ammonium fluoride (NH4F, ≥99.99%), calcium chloride dehydrate (CaCl2·2H2O, ≥99%), sodium phosphate monobasic monohydrate (NaH2PO4·H2O, ≥98%), and sodium phosphate dibasic (Na2HPO4) were acquired from Sigma-Aldrich (St. Louis, MO, USA). Distilled water was used in all aqueous solutions.
2.2. Preparation
2.2.1. Preparation of the Substrates
Before anodization, substrates were polished using SiC emery paper (600, 800, 1000, 1500, and 2000 grit), and then wet polished in a diamond slurry. The polished samples were then sonicated in acetone for 30 min at 28 °C, washed three times using distilled water, and dried at 60 °C for 1 h.
2.2.2. Fabrication of Self-Organized TiO2 Nanotubular Arrays
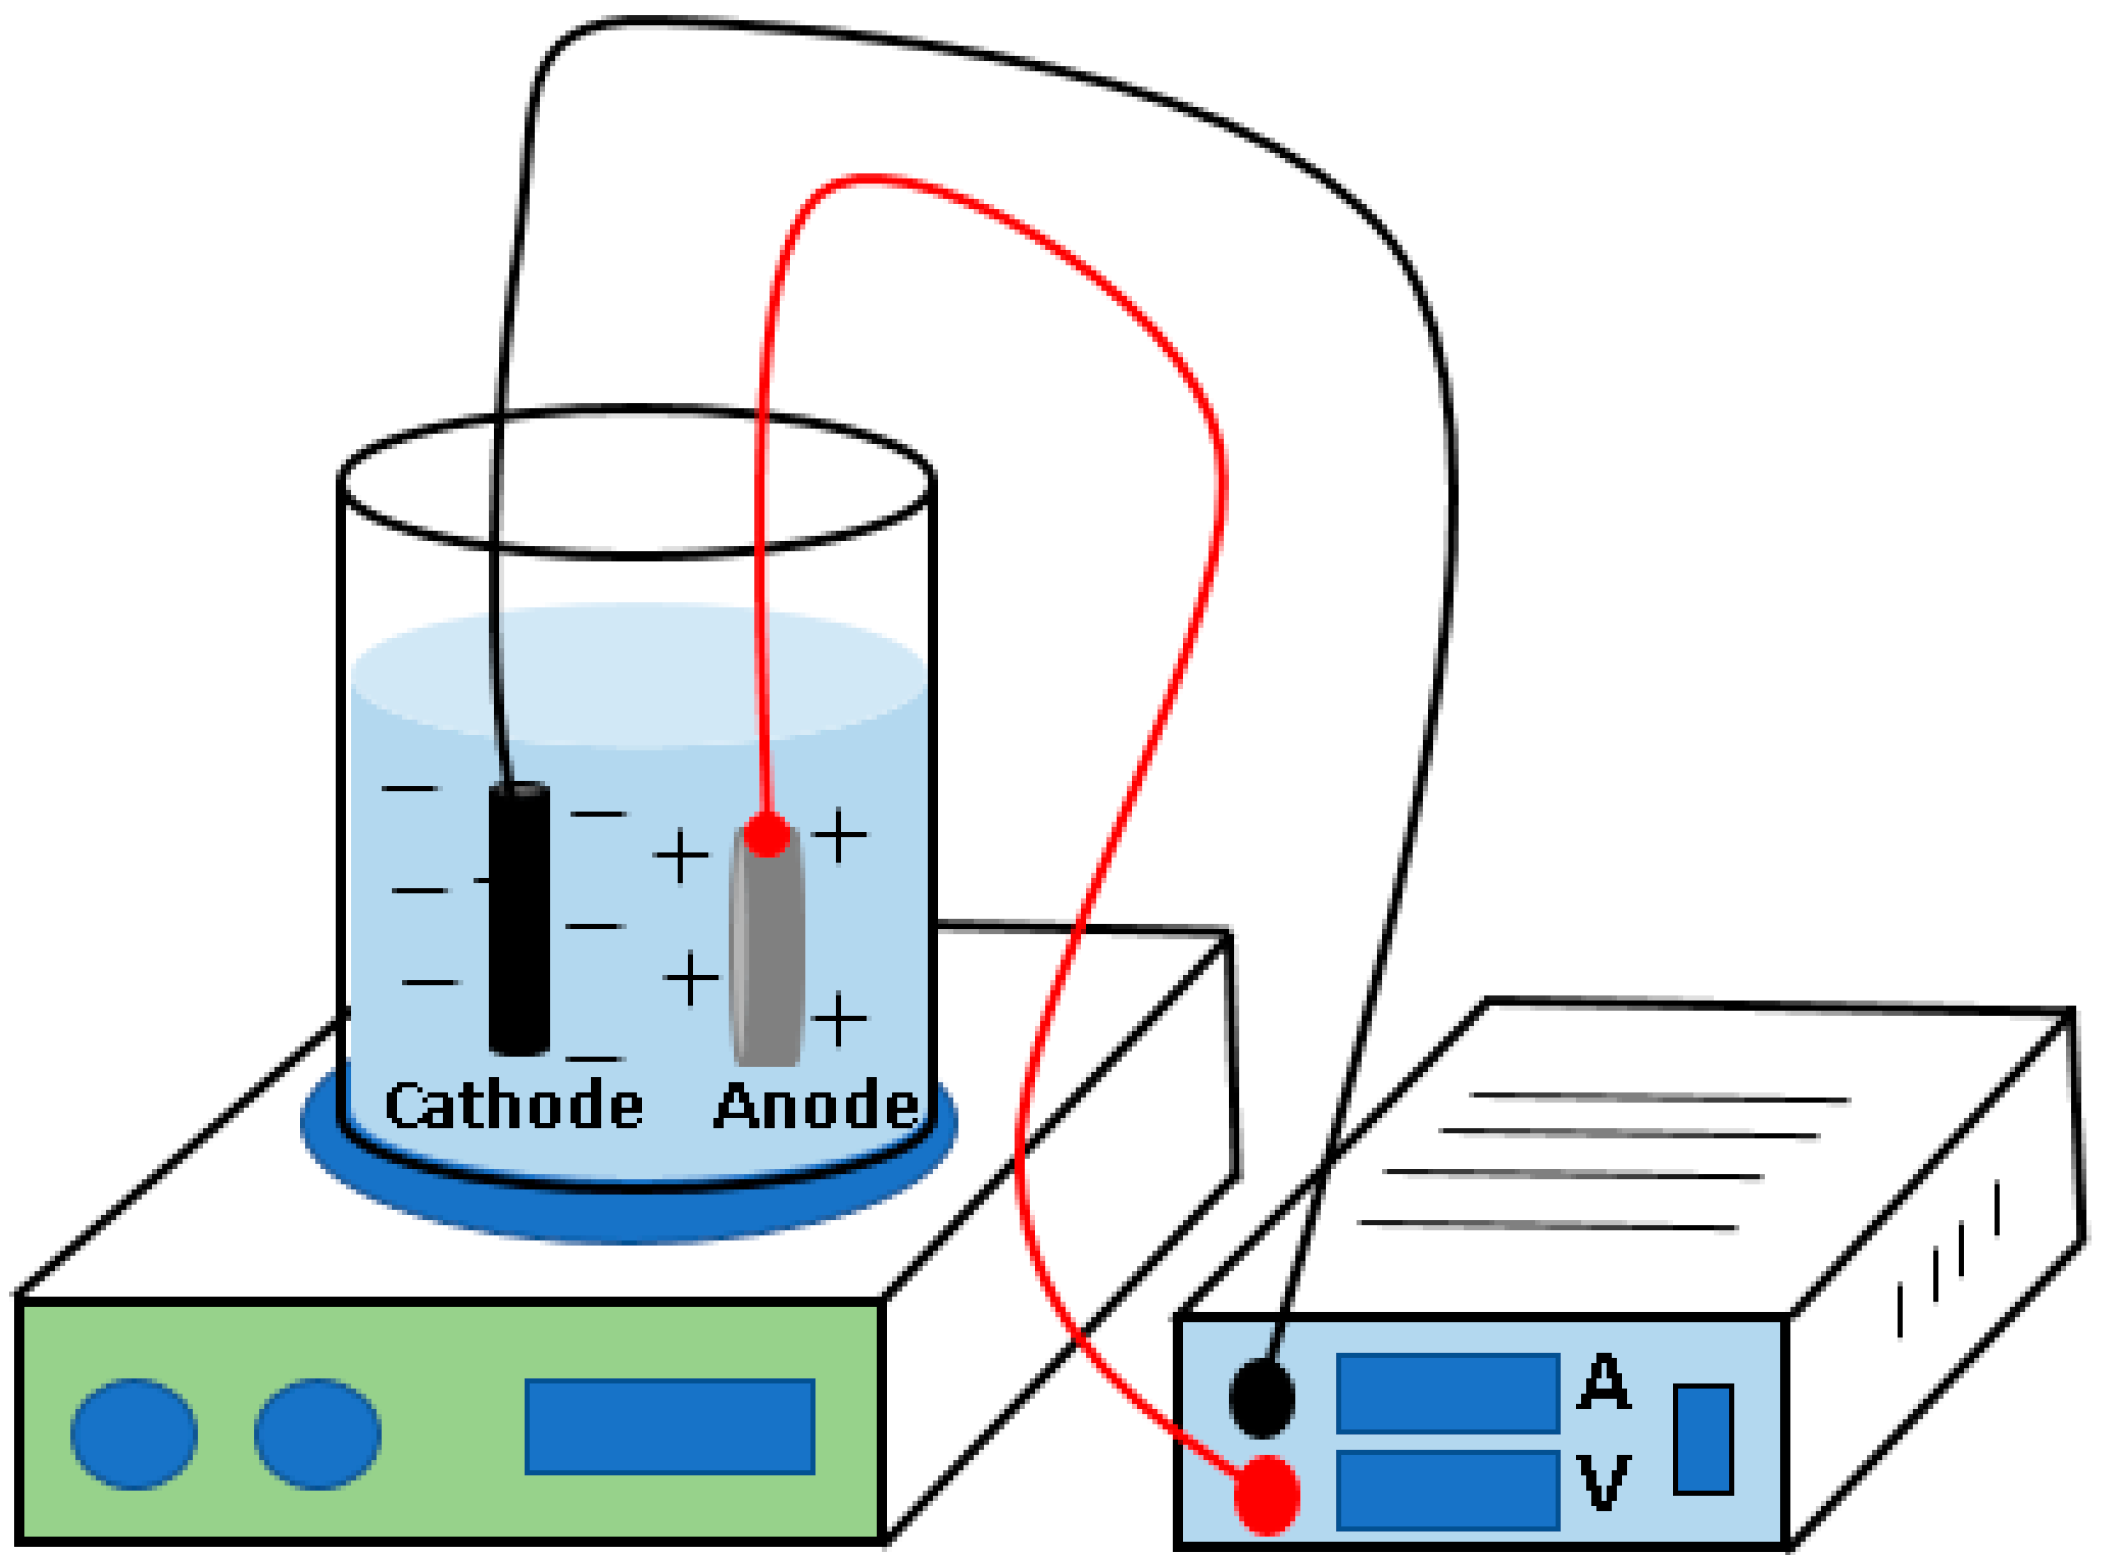
To conduct electrochemical anodization, a two-electrode electrochemical cell was used. A graphite rod (D = 7 mm) was connected to the cathode and the substrate was attached to the anode electrode (see Figure 1). The distance between the electrodes was fixed at 2 cm. A direct current (DC) power source (Toyotech TDP-2001B 1CH 200V/1A, Toyotech, Santa Clara, CA, USA) was used to supply a constant anodization voltage of 10 V for 2 h under magnetic stirring (Daihan MSH-20D, Daihan Scientific Co., Ltd., Gyeongju, Korea) at 150 rpm.
The electrolyte used for anodization was a mixture of deionized water, 0.2 M H3PO4, and 0.4 M NH4F. Following anodization, all specimens were rinsed with deionized water to remove residual materials.
2.2.3. TiO2 Nanotube Crystallization
Generally, the as-anodized nanotubes are amorphous. A tube furnace (GTF-1230, KRE SEONG, Seoul, Korea) was used for heat-treatment and a normal furnace (air atmosphere) was utilized to achieve the crystalline phases of TiO2. To form the crystalline phase, annealing of the anodized samples was performed at 200, 400, and 600 °C for 1 h. To avoid thermal cracking, heating and cooling to the set temperatures were performed at a ramping rate of 10 °C/min.
2.3. TiO2 Nanotube Array Characterization
2.3.1. Phase Analysis and Microstructural Characterization
The size and morphology of the coated surfaces and cross sections were characterized using a field emission scanning electron microscope (FESEM, Nova Nano SEM 450, Thermo Fisher Scientific, Tokyo, Japan). The coating thickness and inner diameter were measured directly from the SEM micrographs. Measuring was carried out in several different areas in order to make sure that the measurement results corresponded to the actual coating thickness, wall thickness, and inner diameter. The phase composition and purity of the samples were studied by XRD analysis using an X-ray diffraction system (9 kW, Rigaku, Tokyo, Japan) over a 2θ range from 10° to 80°.
2.3.2. Surface Roughness (AFM)
To assess the roughness of the anodized samples, atomic force microscopy (AFM) images were taken in tapping mode using a Nanoscope IIIA scanning probe (Park System, Suwon, Korea).
2.3.3. Wear Test
In order to measure the friction and wear properties of the anodized specimen, a ball-on-disc reciprocating wear tester apparatus (dry) was employed. Stainless steel balls with diameters of 5 mm were utilized. The surface of all samples was cleaned with acetone and deionized water (DI) several times prior to wear tests. During the test, a normal load of 3.76 N was applied to the disc, with a 5 mm displacement amplitude, a speed of 60 rpm, and a test period of 300 s. The wear tests were evaluated through qualitative analysis supported by optical microscope observation (U-LBD-2 Olympus, Tokyo, Japan).
To evaluate the wear loss, a high-precision (0.0001 mg) weight balance (METTER TOLEDO, Greifensee, Switzerland) was utilized.
2.3.4. Evaluation of Nanohardness
Nanoindentation experiments (MTS XP, MTS Systems Corporation, Eden Prairie, MN, USA) were performed and the continuous loading and unloading displacement curve recorded to get the material hardness and modulus of elasticity [22]. When the penetration depth reached 1000 nm, the loading was stopped and was held constant for 10 s. To ensure the reliability of the data, several indentations were performed for each specimen to obtain an average.
2.3.5. Corrosion Test
The set-up for the electrochemical workstation comprised a standard three-electrode microcell and a computer-controlled potentiostat (PARSTAT 3000A, PalmSens, Berwyn, PA, USA) with research corrosion software (Versa Studio 2). The reference electrode used was a saturated calomel electrode (SCE), the counter-electrode was a platinum wire, and the specimen acted as the working electrode. Measurements of the open-circuit potential (OCP) were obtained following the immersion of the specimen in a CaCl2 solution. Prior to testing, the potentiodynamic polarization behavior of the specimen was recorded following immersion in a solution for 30 min in order to achieve stability. Electrochemical impedance spectroscopy (EIS) was conducted at the OCP with an alternative current (AC) amplitude of 10 mV over the frequency range 105–10−2 Hz. The range of the scan was started from −250 mV with respect to the OCP with a sweep rate of 0.5 mV−1·s−1 to a final current density of 0.1 mA·cm−2. All electrochemical tests were conducted in synthetic serum with the chemical composition shown in Table 2.
3. Results and Discussion
3.1. TiO2 Nanotube Array Formation Mechanism
The formation of TiO2 nanotubes is a chemical, physical, and electrochemical process. Generally, it is believed that in electrolytes containing fluoride ions, the formation of TiO2 nanotubes occurs because of competing for electric field-assisted processes [23]:
2H2O → O2 + 4e− + 4H+
Ti + O2 → TiO2
TiO2 + 6F−+ 4H+ → (TiF6)2− + 2H2O
The anodic oxidation process is divided into three stages:
- For titanium metal oxide under the action of an electric field, the anode current density decreases exponentially until it reaches a steady state. Due to the creation of a compact oxide film, the current drops rapidly [24];
- Due to the creation of the oxide film, the electric field strength at both ends of the film increases gradually. Due to the corrosion reaction of F− with the oxide film under the influence of an electric field, the oxide film forms dissolved pits, resulting in an increase in current. The rate of decreasing current slows but continues;
- As the corrosion rate and oxidation rate reach equilibrium, ion mobility becomes a major factor in current formation. The hole bottom electric field is much larger than that of the hole wall, and fluoride ions are more concentrated in the bottom of the hole, further deepening the hole. With the current reduction, oxidation rate, and nozzle dissolution rate, the tube bottom corrosion rate reaches dynamic equilibrium. The length of the nanotube array no longer increases.
3.2. Phase Evolution and Structural Features (XRD Analysis)
Different phases have an influence on the performance of titanium dioxide. Nowadays, the rutile and anatase phases have attracted great attention, particularly in electronics and medical applications. The anatase phase is more suitable for the osteal cells nucleation and growth because of higher bioactive properties. The hydroxyapatite phase is well complemented by the crystal lattice of the anatase phase, however, the rutile phase is more efficient to enhance mechanical properties. Scientific research has shown that TiO2 with rutile phase increases the hardness of the TiO2 bulks. Hence, the anodized specimens were annealed at versatile temperatures to attain rutile phase titanium dioxide [24].
Figure 2a–c shows the XRD patterns of the uncoated sample and anodized sample for 2 h at 10 V in an electrolyte containing 0.2 M H3PO4 and 0.4 M NH4F before and samples anodized and annealed for 1 h at 400 and 600 °C. From Figure 2a, the anodized samples without heat treatment did not show TiO2 peaks; the XRD pattern mainly shows the base of the titanium peak, indicating that the non-annealed TiO2-coated samples were air amorphous. At the annealing temperature of 600 °C in the air atmosphere, the TiO2 nanotubes showed anatase and rutile peaks. The XRD characteristic peaks of the TiO2 anatase and rutile configurations appear in the (101) plane at 2θ = 25.334° and in the (110) plane at 2θ = 27.507°, respectively.
Analysis of the XRD pattern showed that the samples annealed at 600 °C in an air atmosphere comprised a tetragonal anatase phase, and so the annealing in air atmosphere influenced the crystalline phase of TiO2. However, it was found that the sample annealed in the air atmosphere had stronger diffraction peak of anatase phase; the corresponding diffraction peaks of samples annealed in Ar showed anatase phase and no rutile phase was detected at 600 °C. This shows that different atmospheres had an impact on the sample crystallization. This phenomenon occurs due to introducing oxygen into the lattice of TiO2 nanotube arrays when annealed in air atmosphere [25,26]. With annealing at 600 °C, a small amount of rutile-phase diffraction peaks appeared, indicating that with increasing temperature, some of the anatase structure was transformed into a rutile-phase structure. However, there was still a small residual Ti peak at the conversion amount, and thus the annealing temperature of 600 °C was still not enough to transform a large amount of TiO2 nanotubes into the rutile phase. In addition, there is a disparity in phase structure between the samples annealed under air and those annealed under Ar gas.
3.3. Microstructural Characterization
Figure 3a depicts the top-view FESEM micrograph of the samples anodized for 2 h at 10 V in an electrolyte containing 0.4 M NH4F and 0.2 M H3PO4 without annealing. Figure 3b shows a higher-magnification FESEM top-view image. An SEM micrograph of the top-view with higher magnification is shown in the inset in Figure 3b. It can be observed that the average inner diameter of the nanotubes was 36.4 nm and the tube wall thickness was 7.8 nm. Figure 3c,d displays cross-sectional views of the sample after anodization under different magnifications. A nanotubular structure was formed after anodization. This feature is a particularly critical parameter contributing to good mechanical properties [27]. From the FESEM images shown in Figure 3a,d, the surface was rough and mainly comprised of lamellar solid matter. Localized dissolution of the oxide layer resulted in the creation of irregular pits that subsequently transformed into pores. With increasing anodization time, the compact TiO2 layer collapsed, after which a porous titanium dioxide layer gradually formed to achieve TiO2 nanotube arrays [28].
Figure 4 and Figure 5 display FESEM images of the samples anodized for 2 h at 10 V in the 0.4 M NH4F and 0.2 M H3PO4 electrolyte after annealing at 200, 400, and 600 °C for 1 h in normal atmosphere and Ar atmosphere, respectively. Annealing in different atmospheres did not result in any significant change in nanotube size. The average tubes’ size is around 35 nm and evenly distributed on the surface of the substrate. As shown in Figure 4c,d and Figure 5c,d, when the calcination temperature was 400 °C, the apparent morphology of the sample was approximately the same as that of the anodized sample. This is due to the small anatase crystallites grains growing along the curvature of the nanotube length rather than through the wall thickness. Thus, the nanotube structure was stable at 400 °C, and anatase formation had no significant influence on the morphology. In an air atmosphere, there were still nanotubes even when the annealing temperature was increased to 600 °C. However, in the anodized sample annealed at 600 °C in the Ar tube furnace, some of the surfaces were covered by isolated island aggregates (Figure 5e,f), indicating that the ordered nanotubes were destroyed to some extent. This may have been responsible for the anatase to rutile and titanium to rutile phase transitions [29]. This indicates that the changes in microstructural characteristics with annealing temperature in Ar atmosphere were probably associated with the excessive diffusion of Ti ions along the nanotube walls, which resulted in oxidation and thus oxide wall thickening [30]. From the SEM pictures, there were no morphological differences in the porous structure after thermal treatment for 1 h at 600 °C in the air atmosphere. However, when the annealing treatment was carried at 600 °C in Ar and the sample was held at this temperature for an extended period of time, clear and significant morphological changes were observed. The nanotubes under a 600 °C Ar atmosphere showed a spheroidization phenomenon (Figure 5e). The findings suggest that the annealing temperature had no significant effect on the surface morphology of the TiO2 nanotube array film (air atmosphere), whereas annealing in the Ar tube furnace changed the morphology of the nanotubes at 600 °C.
For further investigation, EDS analysis was conducted in order to characterize the chemical composition of the samples. Figure 6a,b is the SEM top-view, EDS spectra, and elemental composition of the substrate. The oxygen atom content of the anodized samples increased as compared to the pure substrate (see Figure 6c,d). Figure 6e–h shows SEM images, EDS spectra, and elemental compositions of anodized samples annealed at 600 °C in different atmospheres. The samples annealed in different atmospheres contained Ti and O elements, without other impurity elements, indicating that annealing in different atmospheres did not introduce other impurity elements into the samples. The atomic ratios of Ti and O for anodized sample and annealed at 600 °C in normal atmosphere and Ar atmosphere were 7.65, 1.68, and 3.0, respectively. In addition, oxygen vacancies are easily generated in TiO2, and thus oxygen vacancies are ubiquitous in various TiO2 systems. These defects also existed in the TiO2 nanotube array annealed in a normal atmosphere, affecting the atomic ratio of Ti and O. The atomic ratio of the anodized sample annealed in Ar is lower than the atomic ratio of the one annealed in air atmosphere due to absence oxygen during annealing in Ar gas.
In this study, contact mode AFM was employed to observe the microscopic topography by using the interaction forces between atoms and molecules, as shown in Figure 7. AFM images of samples were collected over an area of 20 μm × 20 μm. As shown in Figure 7a, the anodized sample displayed a rough surface with roughness (RMS) of 156.53 nm. According to Figure 7b, the anodized sample annealed at 600 °C in atmosphere showed a roughness (RMS) of 125.99 nm. The surface of the anodized sample annealed at 600 °C in Ar gas resulted in the highest surface roughness (RMS) of 239.43 nm. It should be noted that the RMS values provided here are a relative comparison between the analyzed samples and are not absolute values.
3.4. Friction and Wear Behaviors
Implants in service are affected by humoral erosion, external forces, fretting wear, and other effects. The mechanical properties of thin film-coated substrates, such as hardness, elastic modulus, the adhesion strength between the thin film and the implant materials, the frictional properties of the film surface, etc., relate to the service life and service quality of the implant. Therefore, it is of great significance to study the nanohardness, elastic modulus, wear resistance, and friction coefficient of samples prior to the application of the titanium alloy material in the human body.
The reciprocating wear test (ball-on-disc) was conducted to evaluate the tribological properties of the TiO2-coated substrates. Figure 8 shows the friction coefficient of uncoated and TiO2-coated samples prior to and following heat treatment at different temperatures and different atmospheres under a normal load of 3.76 N. It can be seen that heat treatment had an important influence on the friction coefficient of the TiO2 nanotube coating. The average coefficients of friction for the bare substrate, the anodized sample, and the samples annealed at 200, 400, and 600 °C in air and Ar atmosphere are around 0.76, 0.72, 0.44, 0.42, 0.31, 0.29, 0.30, and 0.27, respectively.
The average coefficients of friction of the annealed coatings in Ar are lower than those of the samples annealed in the air atmosphere. The average coefficients of friction of the samples annealed at 600 °C were significantly lower than those of other samples. This behavior can be associated with the formation and crystallization of TiO2 and the changes in the phase structure from anatase to rutile. These differences in the behavior are due to the reductive nature of the Ar environment, which leads to a partial reduction and vacancy formation.
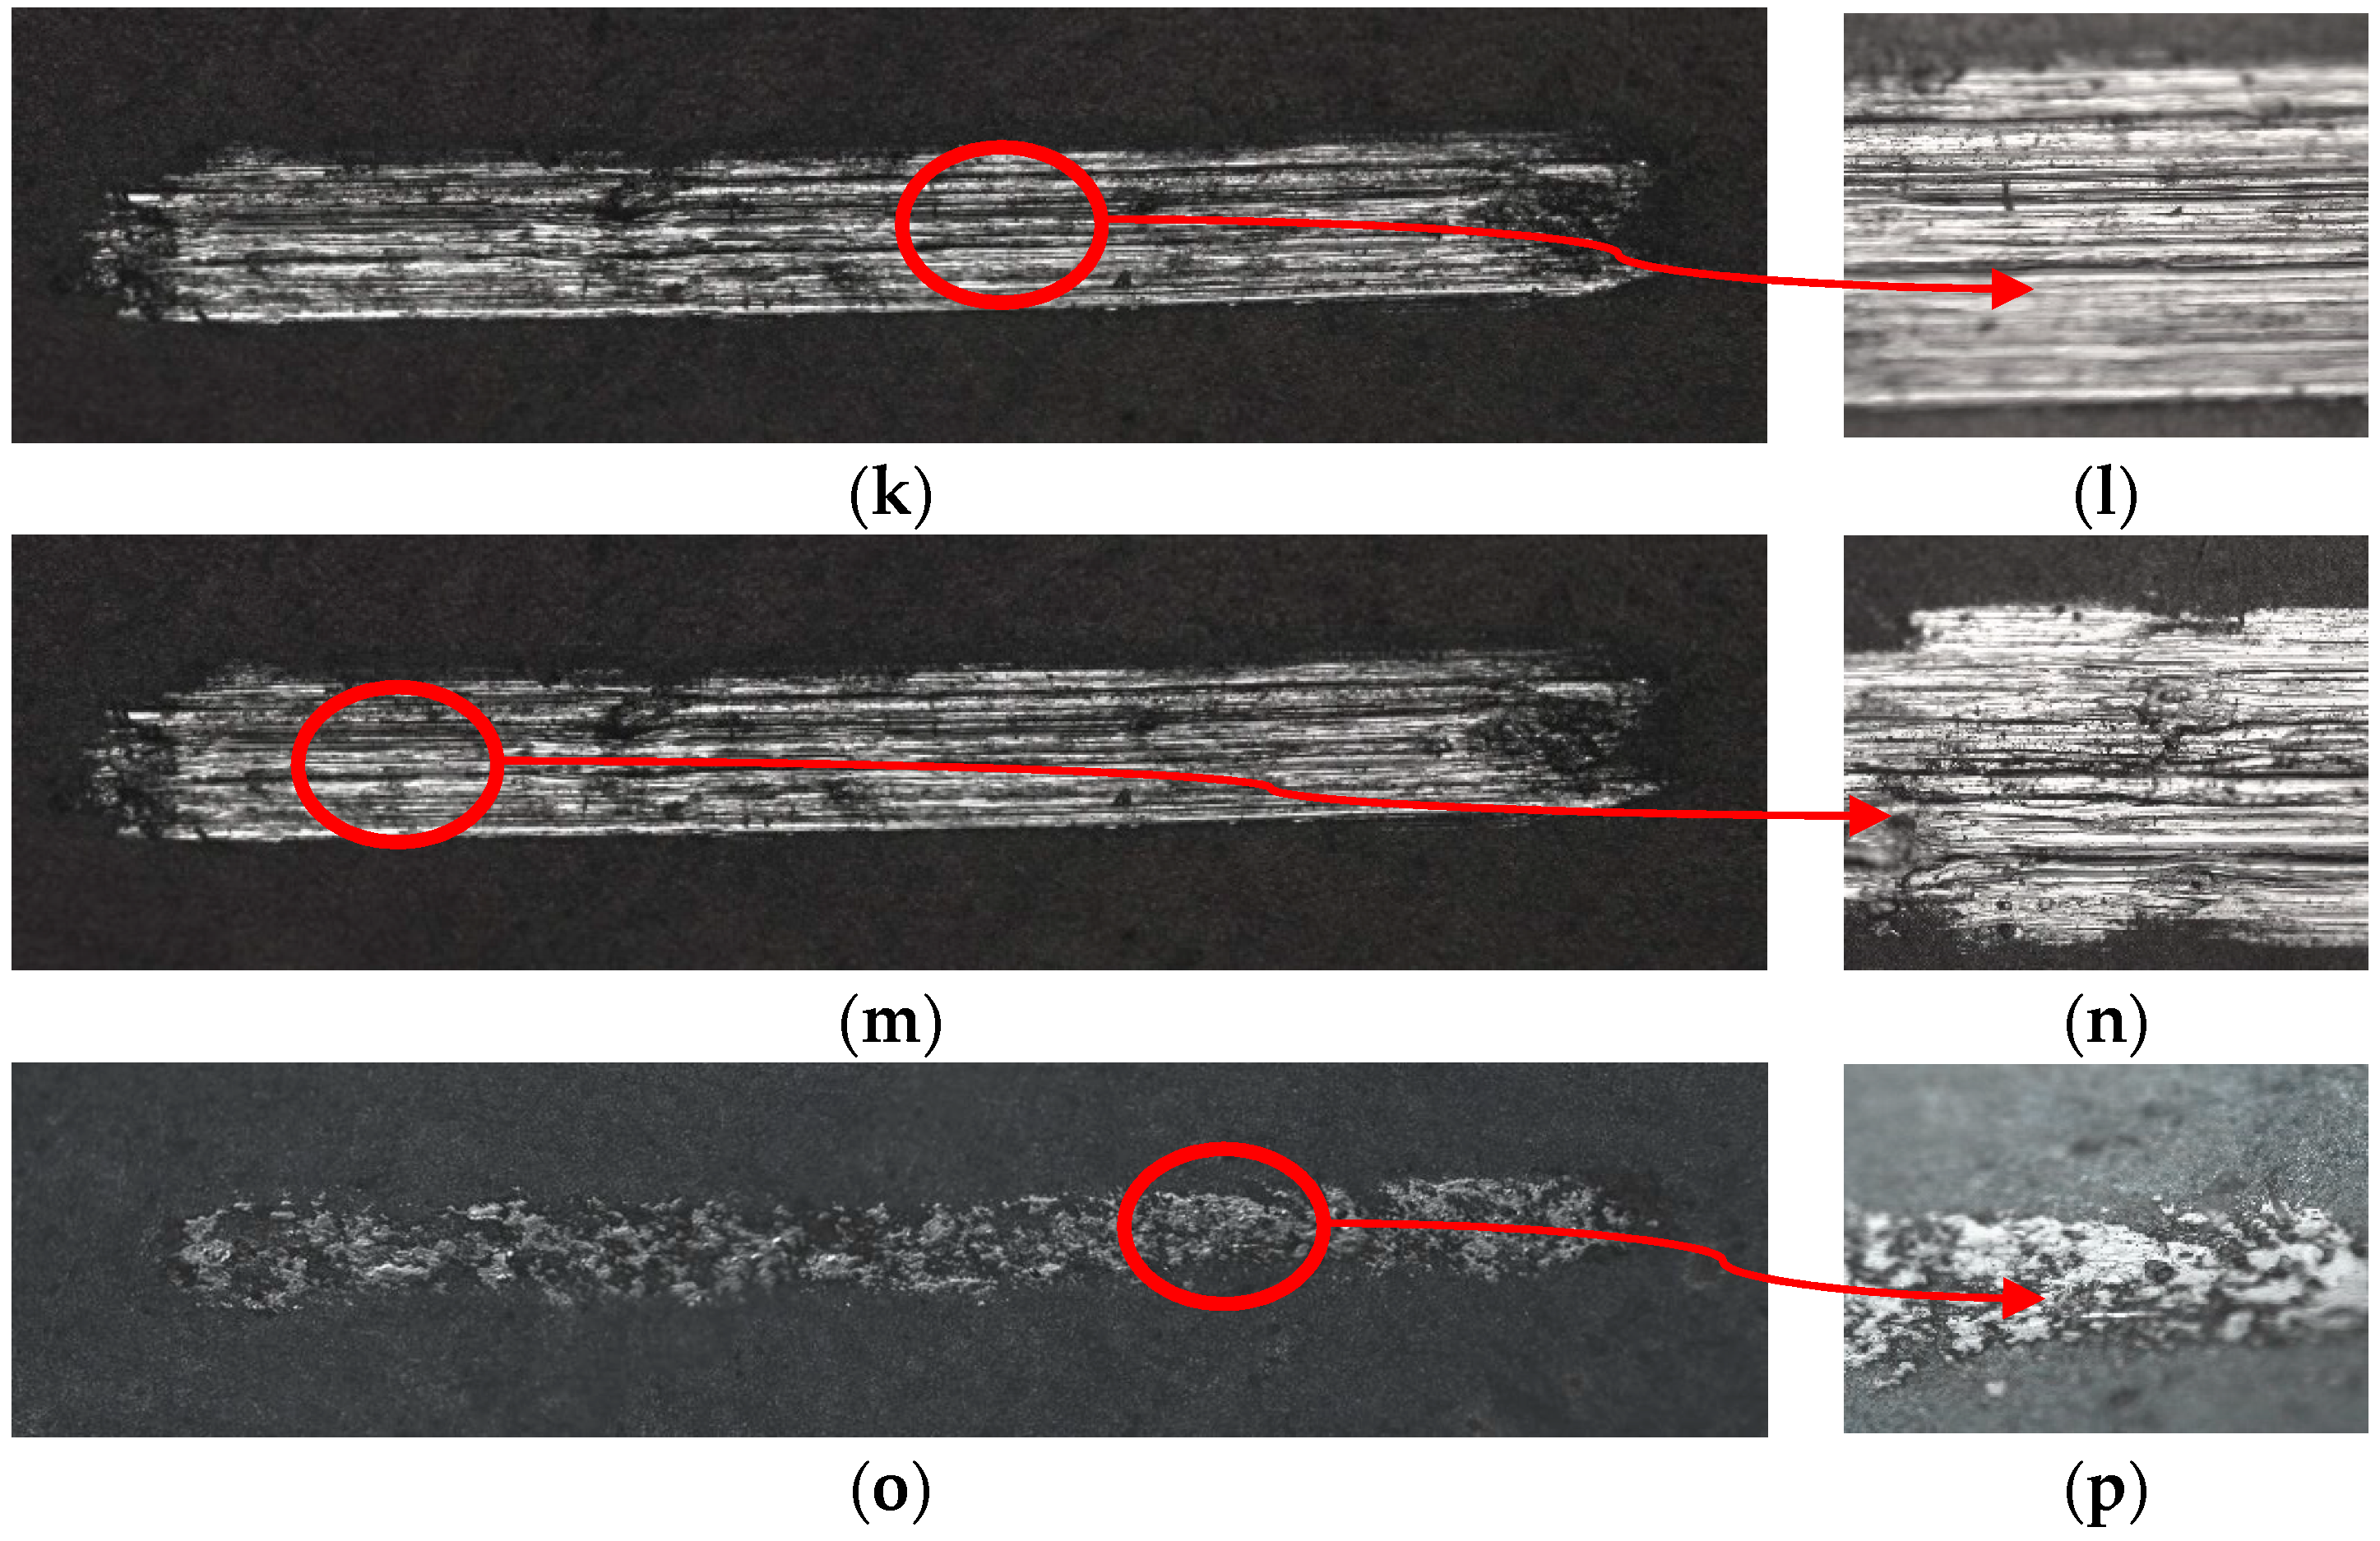
Figure 9 shows optical micrographs of the bare substrate, the anodized substrate, and the TiO2 nanotube-coated substrates annealed under different conditions (top-view) after the wear test.
Figure 9a,b shows the low- and high-magnification optical micrographs of wear track on the substrates tested against a steel ball, with a corresponding coefficient of friction of approximately 0.7641. Figure 9c–o shows low- and high-magnification optical micrographs of anodized samples annealed under different conditions after wear. Most of the debris produced by the coating exhibited largely aggregated particles or chipping flakes. Additionally, the wear spot shows scratches as a result of debris abrasion. During the friction cycle, the film continues to undergo plastic deformation and breaks. The thin film comes off the surface and debris act as an abrasive. As the temperature increased from 200 to 600 °C, because of the increased adhesive strength of the film to the substrate and stronger structure, the films appeared to have better wear resistance. The weight of the coated samples was measured before and after the wear test, and a slight decrease in the weight of all the samples was found. Experiments showed that the existence of a TiO2 thin film layer can significantly reduce the friction coefficient. Additionally, it can be established that the wear resistance of the Ti–V alloy improved noticeably due to the high hardness and low coefficient of friction of the highly crystalline structure of the TiO2 nanotubes, which provides a good protective effect for the substrate. The wear loss result of different samples is tabulated in Table 3. As can be seen, the anodized sample annealed at 600 °C in the air, and the bare sample has the lowest and the highest values in this investigation.
3.5. Nanoindentation
Nanoindentation experiments were carried out by recording the continuous loading and unloading displacement curves (Figure 10, Figure 11 and Figure 12), thus describing the interaction between the tip and sample during the indentation process to get the material hardness and modulus of elasticity. In the past few years, several studies of the mechanical properties of materials have focused on the measurement of Young’s modulus (E) and indentation hardness (H) using nanoindentation data [31,32,33,34].
The deformation mechanisms are correlated to the measured modulus as a function of depth. The deformation process of the TiO2 nanotube array under Berkovich indenter can be described as follows; at a very low indentation depth, the TiO2 nanotubes bend elastically, to a certain penetration depth which is characterized by a linear increase in modulus with increasing depth. In this region, the increasing modulus is mainly because of amplified densification of the TiO2 nanotubes. Due to the brittle nature of TiO2 nanotubes, they elastically bend to a very small strain of around 5%. As the indentation depth enhances, fracture occurs (“pop-in” in the load-displacement curves). A parabolic increase in the indentation modulus is observed. In this area, the indentation depth is comparable to the thickness of the TiO2 coating. Therefore, surges in elastic moduli are considered as the result of an increasing contribution from the substrate. With increasing indentation depth, a fracture in TiO2 nanotubes interact with adjacent nanotubes, causing them to bend and fracture. The minor fragments from fractured TiO2 nanotubes become compacted slowly, causing densification. When the TiO2 thin film underneath the indentation tip becomes gradually dense, the elastic modulus increases. Lastly, the coating becomes almost fully dense. This area is characterized by a plateau in indentation modulus and named the composite modulus, as it is a combination of the elastic modulus of the Ti substrate and the dense coating [33].
Table 4 shows the elastic modulus and hardness mean values (10 indentations per sample) of different samples at different annealing temperatures and different atmospheres. As can be seen, with increasing the annealing temperature from 200 to 600 °C, the hardness and modulus increase in both air and Ar atmosphere. It seems that annealing at 600 °C in Ar and air result in close elastic modulus for both samples, 156.64 and 160.87 GPa. Nevertheless, there is a significant difference in hardness of anodized samples annealed at 600 °C in air compared to its counterpart annealed in Ar. This major difference could be due to the contribution of O2 for better oxidization of TiO2 coated substrate in an air atmosphere.
Figure 10, Figure 11 and Figure 12 show the typical load-displacement curves, nanohardness, and modulus of elasticity of the substrate, the anodized sample, and the anodized samples annealed under different conditions. The load was applied at various penetration depths between 0 and 1000 nm. Figure 10a,c, Figure 11a,c,e and Figure 12a,c,e show the indentation load versus penetration depth on the surfaces of the substrates. The loads on the surface increased to the maximum at the 1000 nm penetration depth, held for a while, and then unloaded. In general, heat treatment under different annealing conditions (temperature and atmosphere) resulted in changes in material properties such as strength and hardness. Figure 10b,d, Figure 11b,d,f, and Figure 12b,d,f display the hardness and modulus of elasticity achieved by indentation at different depths. According to the results, the hardness and modulus values of the uncoated specimen were 3.38 and 115.514 GPa, respectively. During anodization, an amorphous TiO2 phase was formed, which increased the hardness of the entire sample slightly. It can be seen that the hardness and modulus values of the oxidized sample increased to 3.664 and 135.547 GPa, respectively (Figure 10d), because of the formation of the TiO2 thin film. Variations aside, it is clear from Figure 10, Figure 11 and Figure 12 that the dominant trend in the hardness of these materials is an almost linear steady increase in hardness and modulus with increasing annealing temperature. The results show that hardness and Young’s modulus both initially increased with increasing depth of penetration after annealing. Both these parameters dropped slightly behind the depth of 1000 nm. There are two key processes that were caused by the densification of the nanotube layer and the further densification of the dense surface, including the two main deformation processes occurring at the tip of the indenter during indentation. The area under the indenter is dense, whereas the other side of the indenter is subjected to shear stress, resulting in densification and wear. On the one side, because of the contribution of the substrate to the overall strength of the delaminated material, the modulus of elasticity increases during penetration of the top of the indenter into the coating surface. Densification of the area around the indentation has a slight effect on the strength of the material and results in wear between the indenter surface and the densified coating surface [34]. As the density of TiO2 around the indenter increases, the modulus increases. After thermal annealing at 600 °C in an air atmosphere, crystallization of TiO2 (from amorphous to crystalline) took place, with the result that the surface hardness and modulus increased to 6.15 and 160.87 GPa, respectively, values that were generally higher than those for samples annealed in Ar. This indicates that annealing at 600 °C in a normal atmosphere is the most advantageous condition for the annealing of TiO2 nanotubes coated on a Ti–V alloy.
Therefore, it can be established that the high hardness and low coefficient of friction of the crystalline structure of the TiO2 nanotubes improved the wear resistance of the Ti–V alloy substantially.
3.6. Corrosion Resistance
The corrosion behaviors of the substrate and anodized samples annealed under different conditions were evaluated by potentiodynamic polarization tests (PDS) in CaCl2 solution. The results of corresponding corrosion potential (Ecorr) and corrosion current density (Icorr) are shown in Table 5.
Ecorr represents the corrosion tendency of the substrate and Icorr represents the corrosion rate. According to the data, the Ecorr for the sample was 232 mV, whereas the Ecorr for the anodized sample was 255 mV. In addition, the Icorr of the substrate was 1.04 × 10⁻⁷ A cm−2 and it reached 2.33 × 10⁻⁸ A cm−2 after anodization. Additionally, the reduction of Icorr means that the corrosion rate decreased. This shows that the prepared coating can provide corrosion protection of a Ti alloy substrate in a CaCl2 solution. We reach the same conclusion in Figure 13, which illustrates the polarization curves of the uncoated sample and the anodized sample.
The polarization plot clearly shows that as compared to the uncoated sample, the anodized specimens showed very small Icorr values. This shows that a titanium dioxide layer on the substrate can effectively improve the substrate corrosion resistance. Thus, the specimens with nanotubes showed higher corrosion resistance compared to those with smooth surfaces (Table 3).
Figure 14 and Figure 15 show typical potentiodynamic polarization plots acquired for the anodized sample and samples annealed at different temperatures in the air atmosphere and Ar gas, respectively. After annealing, the corrosion current density (Icorr) of the annealed samples was considerably lower than that of the anodized sample, demonstrating an increase in corrosion resistance. This increase may be related to changes that occur in the interface (substrate/coating) region. For the anodized sample, the nanotubes can act as effective channels for the electrolyte to reach the interface. This behavior can be attributed to the crystallization of the nanotubes. Amorphous-structured nanotubes have higher corrosion resistance than high crystalline nanotubes. From Table 3, it can be observed that TiO2 coated substrate annealed at 200 and 400 °C in the air atmosphere had better corrosion protection than those annealed in Ar gas.
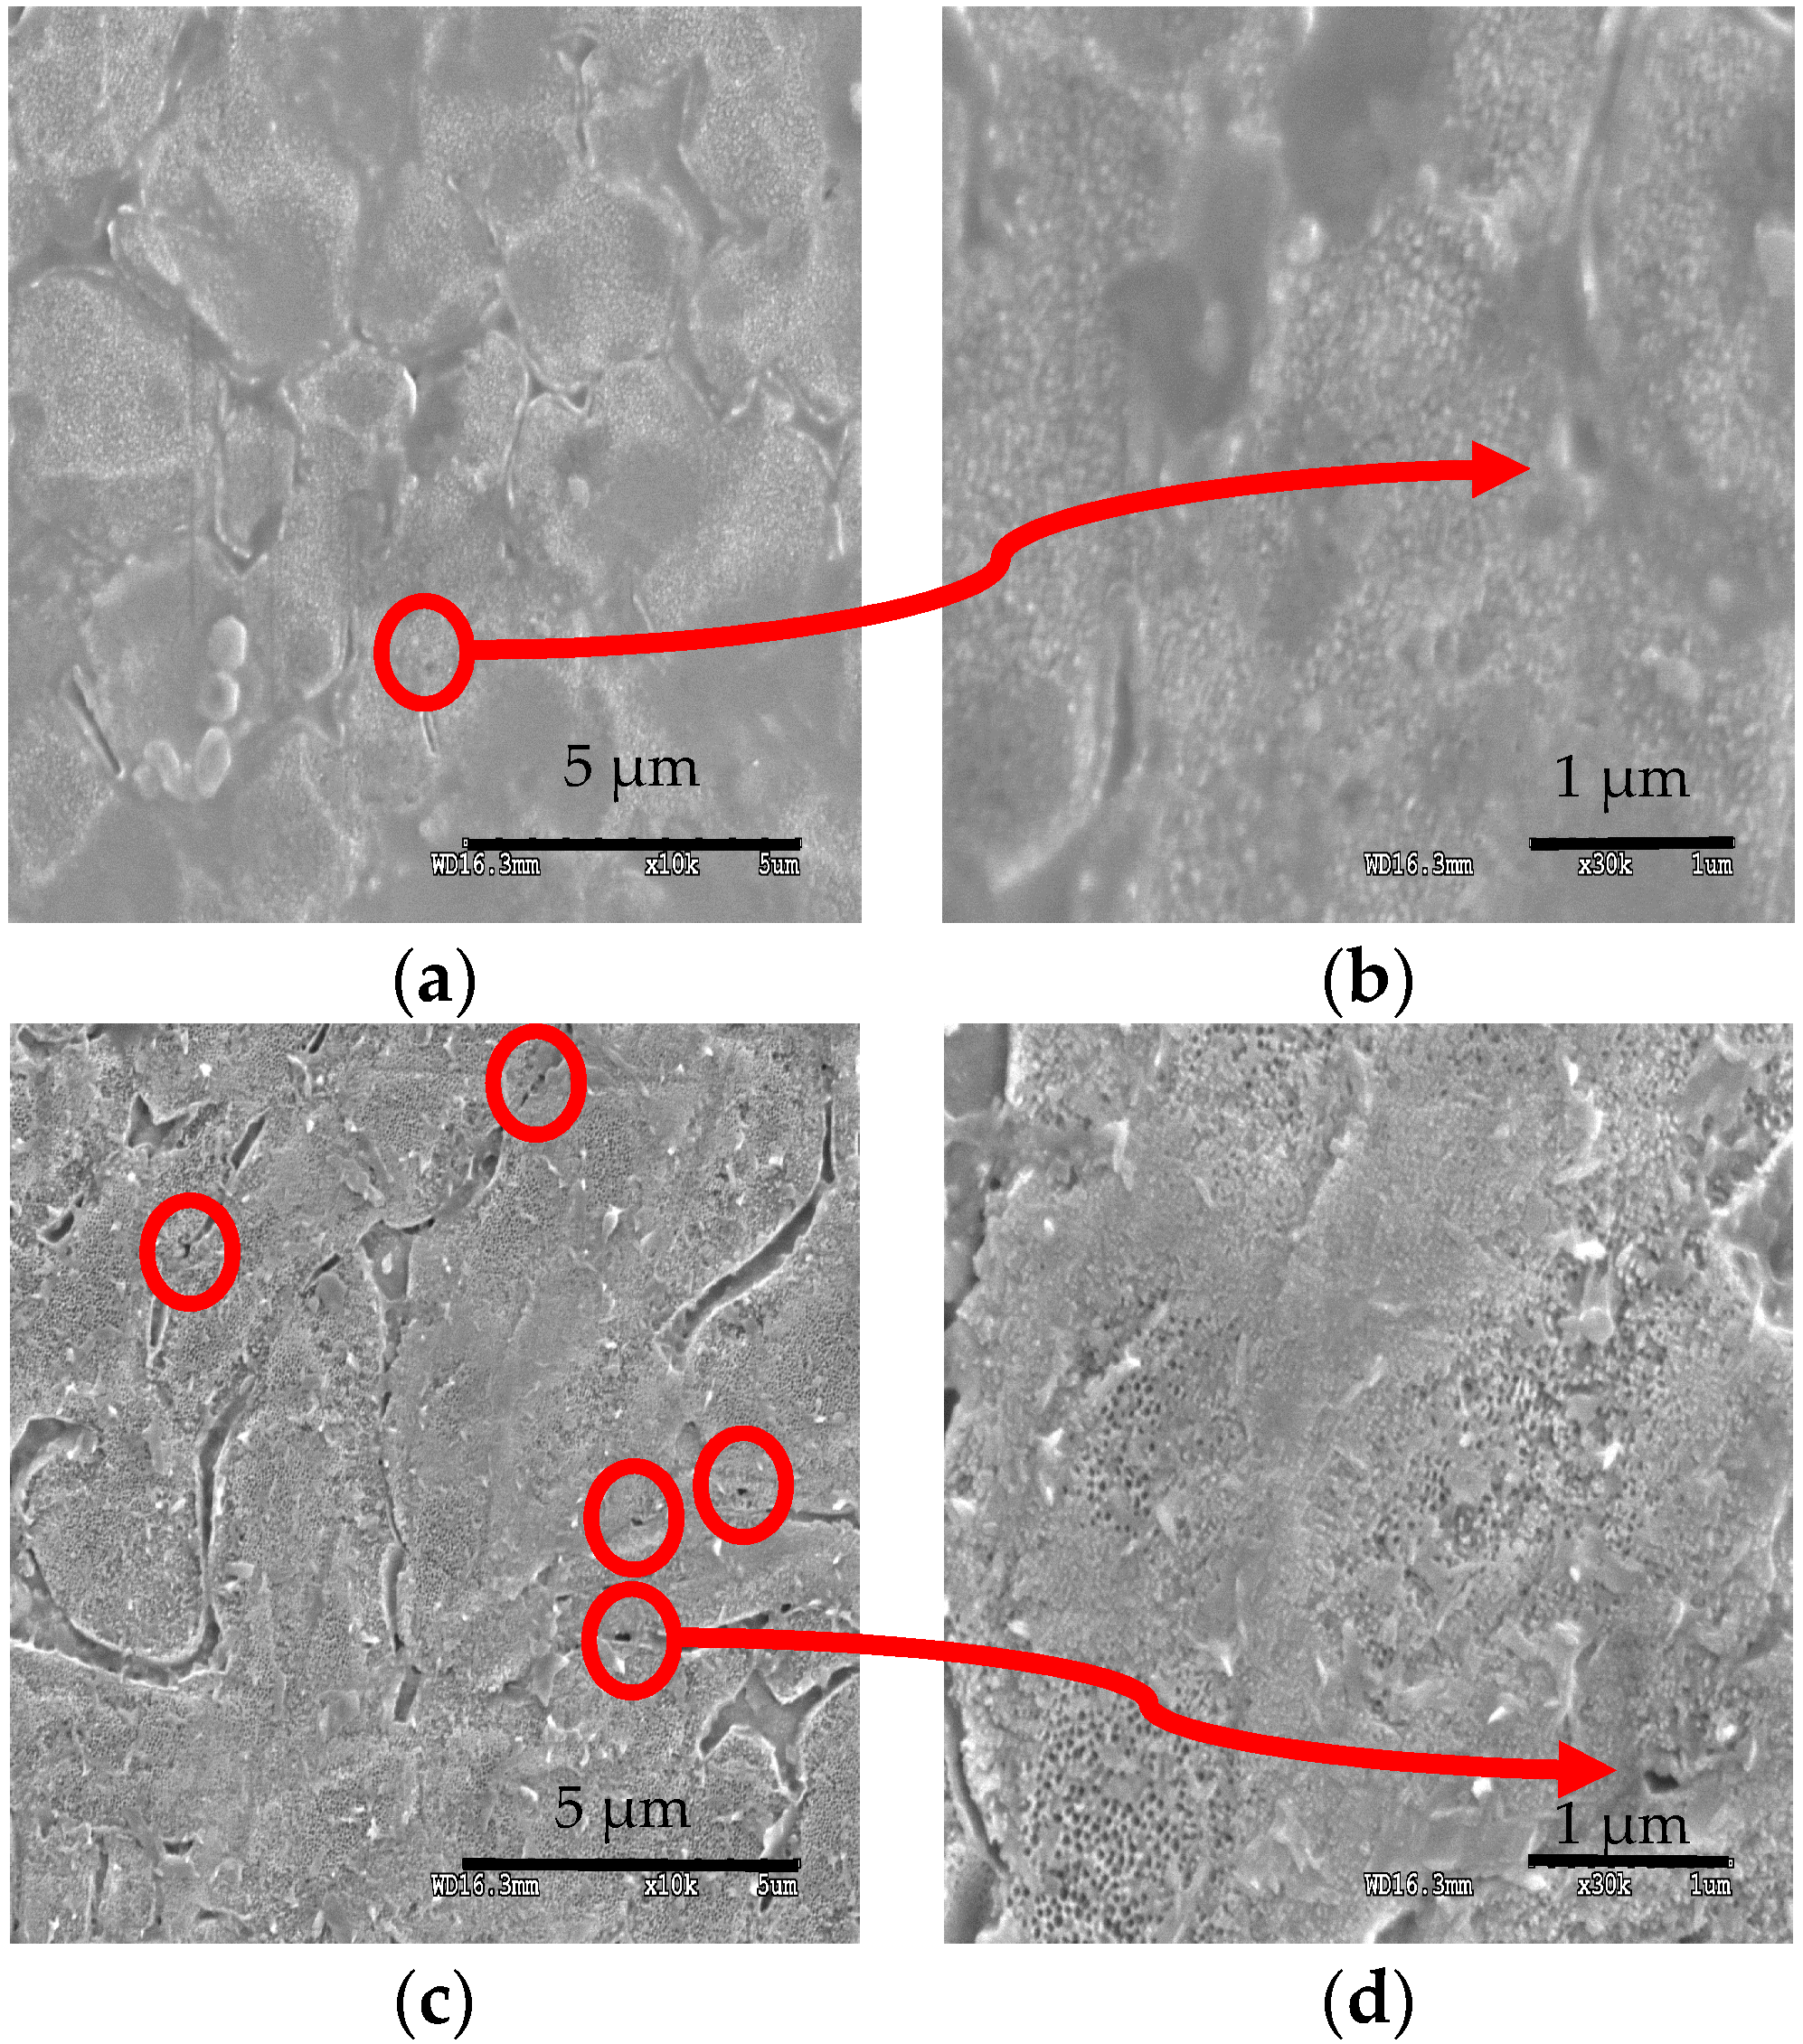
Figure 16 and Figure 17 display FESEM images of the substrate, anodized sample, anodized sample annealed at 200 °C in the air atmosphere and Ar gas after the corrosion test. Corrosion is carried out in the form of pitting corrosion. Figure 16a,b shows pitting corrosion of the substrate with deep holes having a large diameter. Figure 16c,d displays that corrosion of the anodized sample is reduced compared to the substrate’s corrosion. After anodization, the specimens with nanotubes exhibited higher corrosion resistance than the bare substrate. As shown in Figure 17a,b, the pitting corrosion is almost invisible, and the nanotube structure is clearly visible. However, the pitting corrosion of sample annealed in the air seems to be lower compared to sample annealed in Ar. These can be seen (nanotubes distributed over the structure) clearly from Figure 17c,d. Further annealing in Ar gas, results in morphological changes of the nanotube structure. These differences in the behavior (mechanical stability) are due to the reductive nature of the Ar environment. Such changes are not witnessed when the annealing procedure is performed in the air atmosphere. This indicates that the changes in microstructural characteristics with annealing temperature were perhaps related to the excessive diffusion of Ti ions along the nanotube walls, causing oxidation, but in argon gas due to the lack of oxygen, oxidation was suppressed [30].
4. Conclusions
In summary, self-organized TiO2 nanotubes were fabricated by the anodization of a Ti alloy. The effect of different annealing treatments at different atmospheres on the morphological characteristics, tribological behavior, corrosion resistance, and mechanical properties of a TiO2 nanotube-coated Ti alloy were investigated. Annealing in different atmospheres led to great differences in the microstructure, mechanical properties, and corrosion resistance of the nanotubes. From the XRD pattern analysis, oxygen vacancies were introduced into the crystal lattice of the samples when annealed in air. The XRD data demonstrated that no characteristic peaks of TiO2 were detected after anodization. After annealing in air at 600 °C for 1 h, anatase and rutile phases were detected, while only anatase phase was detected when the sample was annealed at 600 °C in Ar gas. From the wear test, it was found that the average coefficient of friction of the samples annealed at 600 °C in Ar gas was lower than that of the other samples, reaching 0.27. The coefficient of friction of anodized sample annealed at 600 °C in the air was 0.31. In addition, after thermal annealing at 600 °C in the air atmosphere, crystallization of TiO2 (from amorphous to highly crystalline) took place, with the result that the surface hardness and modulus increased to 6.15 and 160.87 GPa, respectively, which are higher than those annealed in Ar atmosphere. This suggests that annealing at 600 °C in air atmosphere has a better effect on tribo-mechanical properties of anodized Ti–V alloys compared with the one annealed at 600 °C in Ar. The results of the tribological evaluation showed that the high hardness and low coefficient of friction for the crystalline structure of the TiO2 nanotubes improved the wear resistance of the Ti–V alloy considerably. Moreover, the Icorr of the anodized samples after annealing at 200 °C in air atmosphere provided the lowest value among the tested samples of 3.53 × 10⁻⁹, which was the best compared to the other samples.
Author Contributions
Conceptualization, B.H.; Methodology, B.H.; Software, B.H.; Validation, B.H. and E.Z.N.; Formal Analysis, B.H.; Investigation, B.H., E.Z.N., and F.M.; Resources, E.Z.N., F.J., S.B., and F.M.; Data Curation, B.H.; Writing–Original Draft Preparation, B.H., and E.Z.N.; Writing–Review & Editing, E.Z.N., F.J., S.B., and F.M.; Visualization, E.Z.N.; Supervision, E.Z.N.; Project Administration, E.Z.N. and F.M.; Funding Acquisition, F.J., S.B., and F.M.
Funding
This research was funded by Hanyang University’s financial support through the Young Faculty Forum Fund (201600000001555).
Conflicts of Interest
The authors declare no conflict of interest.
References
- Geetha, M.; Singh, A.K.; Asokamani, R.; Gogia, A.K. Ti-based biomaterials, the ultimate choice for orthopedic implants—A review. Prog. Mater. Sci. 2009, 54, 397–425. [Google Scholar] [CrossRef]
- Narayanan, R.; Seshadri, S.K. Phosphoric acid anodization of Ti–6Al–4V—Structural and corrosion aspects. Corros. Sci. 2007, 49, 542–558. [Google Scholar] [CrossRef]
- Hedzelek, W.; Sikorska, B.; Domka, L. Evaluation of selected mechanical and chemical methods of modifications of titanium. Physicochem. Probl. Miner. Process. 2005, 39, 149–154. [Google Scholar]
- Variola, F.; Yi, J.-H.; Richert, L.; Wuest, J.D.; Rosei, F.; Nanci, A. Tailoring the surface properties of Ti6Al4V by controlled chemical oxidation. Biomaterials 2008, 29, 1285–1298. [Google Scholar] [CrossRef]
- Jonášová, L.; Müller, F.A.; Helebrant, A.; Strnad, J.; Greil, P. Biomimetic apatite formation on chemically treated titanium. Biomaterials 2004, 25, 1187–1194. [Google Scholar] [CrossRef]
- Maiyalagan, T.; Viswanathan, B.; Varadaraju, U.V. Fabrication and characterization of uniform TiO2 nanotube arrays by sol-gel template method. Bull. Mater. Sci. 2006, 29, 705–708. [Google Scholar]
- Raja, K.S.; Misra, M.; Paramguru, K. Deposition of calcium phosphate coating on nanotubular anodized titanium. Mater. Lett. 2005, 59, 2137–2141. [Google Scholar] [CrossRef]
- Yu, X.; Li, Y.; Wlodarski, W.; Kandasamy, S.; Kalantar-zadeh, K. Fabrication of nanostructured TiO2 by anodization: A comparison between electrolytes and substrates. Sensor. Actuator B Chem. 2008, 130, 25–31. [Google Scholar] [CrossRef]
- Macak, J.M.; Tsuchiya, H.; Taveira, L.; Ghicov, A.; Schmuki, P. Self-organized nanotubular oxide layers on Ti–6Al–7Nb and Ti–6Al–4V formed by anodization in NH4F solutions. J. Biomed. Mater. Res. 2005, 75, 928–933. [Google Scholar] [CrossRef]
- Kim, H.M.; Kaneko, H.; Masakazu, K.; Kokubo, T.; Nakamura, T. Mechanism of apatite formation on anodically oxidized titanium metal in simulated body fluid. Key Eng. Mater. 2004, 254–265, 741–744. [Google Scholar] [CrossRef]
- Zwilling, V.; Darque-Ceretti, E.; Boutry-Forveille, A.; David, D.; Perrin, M.Y.; Aucouturier, M. Structure and physicochemistry of anodic oxide films on titanium and TA6V alloy. Surf. Interface Anal. 1999, 27, 629–637. [Google Scholar] [CrossRef]
- Gong, D.; Grimes, C.A.; Varghese, O.K.; Hu, W.; Singh, R.S.; Chen, Z.; Dickey, E.C. Titanium oxide nanotube arrays prepared by anodic oxidation. J. Mater. Res. 2001, 16, 3331–3334. [Google Scholar] [CrossRef]
- Macak, J.M.; Tsuchiya, H.; Taveira, L.; Aldabergerova, S.; Schmuki, P. Smooth anodic TiO2 nanotubes. Angew. Chem. Int. Ed. 2005, 44, 7463–7465. [Google Scholar] [CrossRef]
- Macak, J.M.; Taveira, L.V.; Tsuchiya, H.; Sirotna, K.; Macak, J.; Schmuki, P. Influence of different fluoride containing electrolytes on the formation of self-organized titania nanotubes by Ti anodization. J. Electroceram. 2006, 16, 29–34. [Google Scholar] [CrossRef]
- Ghicov, A.; Macak, J.M.; Tsuchiya, H.; Kunze, J.; Haeublein, V.; Frey, L.; Schmuki, P. Ion implantation and annealing for an efficient N-doping of TiO2 nanotubes. Nano Lett. 2006, 6, 1080–1082. [Google Scholar] [CrossRef]
- Yu, W.; Qiu, J.; Xu, L.; Zhang, F. Corrosion behaviors of TiO2 nanotube layers on titanium in Hank’s solution. Biomed. Mater. 2009, 4, 065012. [Google Scholar] [CrossRef]
- Kunze, J.; Müller, L.; Macak, J.M.; Greil, P.; Schmuki, P.; Müller, F.A. Time-dependent growth of biomimetic apatite on anodic TiO2 nanotubes. Electrochim. Acta 2008, 53, 6995–7003. [Google Scholar] [CrossRef]
- Zhang, W.; Li, G.; Li, Y.; Yu, Z.; Xi, Z. Fabrication of TiO2 nanotube arrays on biologic titanium alloy and properties. Trans. Nonferr. Met. Soc. Chin. 2007, 17, 692–695. [Google Scholar]
- Petukhov, D.I.; Eliseeva, A.A.; Kolesnik, I.V.; Napolskii, K.S.; Lukashin, A.V.; Tretyakov, Y.D.; Grigoriev, S.V.; Grigorieva, N.A.; Eckerlebe, H. Formation mechanism and packing options in tubular anodic titania films. Microporous Microporous Mater. 2008, 114, 440–447. [Google Scholar] [CrossRef]
- Yang, B.; Uchida, M.; Kim, H.-M.; Zhang, X.; Kokubo, T. Preparation of bioactive titanium metal via anodic oxidation treatment. Biomaterials 2004, 25, 1003–1010. [Google Scholar] [CrossRef]
- Boehlert, C.J.; Cowen, C.J.; Quast, J.P.; Akahori, T.; Niinomi, M. Fatigue and wear evaluation of Ti–Al–Nb alloys for biomedical applications. Mater. Sci. Eng. C 2008, 28, 323–330. [Google Scholar] [CrossRef]
- Oliver, W.C.; Pharr, G.M. An improved technique for determining hardness and elastic modulus using load and displacement sensing indentation experiments. J. Mater. Res. 1992, 7, 1564–1583. [Google Scholar] [CrossRef]
- Gupta, S.M.; Tripathi, M. A review of TiO2 nanoparticles. Chin. Sci. Bull. 2011, 56, 1639. [Google Scholar] [CrossRef]
- Chang, W.-Y.; Fang, T.-H.; Chiu, Z.-W.; Hsiao, Y.-J.; Ji, L.-W. Nanomechanical properties of array TiO2 nanotubes. Microporous Microporous Mater. 2011, 145, 87–92. [Google Scholar] [CrossRef]
- Prida, V.M.; Manova, E.; Vega, V.; Hernandez-Velez, M.; Aranda, P.; Pirota, K.R.; Vázquez, M.; Ruiz-Hitzky, E. Temperature influence on the anodic growth of self-aligned Titanium dioxide nanotube arrays. J. Magn. Magn. Mater. 2007, 316, 110–113. [Google Scholar] [CrossRef]
- Naldoni, A.; Allieta, M.; Santangelo, S.; Marelli, M.; Fabbri, F.; Cappelli, S.; Bianchi, C.L.; Psaro, R.; Santo, V.D. Effect of nature and location of defects on bandgap narrowing in black TiO2 nanoparticles. J. Am. Chem. Soc. 2012, 134, 7600–7603. [Google Scholar] [CrossRef]
- Sarraf, M.; Zalnezhad, E.; Bushroa, A.R.; Hamouda, A.M.S.; Baradaran, S.; Nasiri-Tabrizi, B.; Rafieerad, A.R. Structural and mechanical characterization of Al/Al2O3 nanotube thin film on TiV alloy. Appl. Surf. Sci. 2014, 321, 511–519. [Google Scholar] [CrossRef]
- Saharudin, K.A.; Sreekantan, S.; Aziz, S.N.; Hazan, R.; Lai, C.W.; Mydin, R.B.; Mat, I. Surface modification and bioactivity of anodic Ti6Al4V alloy. J. Nanosci. Nanotechnol. 2013, 13, 1696–1705. [Google Scholar] [CrossRef]
- Tian, T.; Xiao, X.; Liu, R.; She, H.; Hu, X. Study on titania nanotube arrays prepared by titanium anodization in NH4F/H2SO4 solution. J. Mater. Sci. 2007, 42, 5539–5543. [Google Scholar] [CrossRef]
- Kummer, K.M.; Taylor, E.; Webster, T.J. Biological applications of anodized TiO2 nanostructures: A review from orthopedic to stent applications. Nanosci. Nanotechnol. Lett. 2012, 4, 483–493. [Google Scholar] [CrossRef]
- Baradaran, S.; Basirun, W.J.; Zalnezhad, E.; Hamdi, M.; Sarhan, A.A.; Alias, Y. Fabrication and deformation behaviour of multilayer Al2O3/Ti/TiO2 nanotube arrays. J. Mech. Behav. Biomed. Mater. 2013, 20, 272–282. [Google Scholar] [CrossRef]
- Zalnezhad, E.; Baradaran, S.; Bushroa, A.R.; Sarhan, A.A.D. Mechanical property enhancement of Ti-6Al-4V by multilayer thin solid film Ti/TiO2 nanotubular array coating for biomedical application. Metall. Mater. Trans. A 2014, 45, 785–797. [Google Scholar] [CrossRef]
- Yaghoubi, H.; Taghavinia, N.; Alamdari, E.K.; Volinsky, A.A. Nanomechanical properties of TiO2 granular thin films. ACS Appl. Mater. Interfaces 2010, 2, 2629–2636. [Google Scholar] [CrossRef]
- Sarraf, M.; Zalnezhad, E.; Bushroa, A.R.; Hamouda, A.M.S.; Rafieerad, A.R.; Nasiri-Tabrizi, B. Effect of microstructural evolution on wettability and tribological behavior of TiO2 nanotubular arrays coated on Ti–6Al–4V. Ceram. Int. 2015, 41, 7952–7962. [Google Scholar] [CrossRef]
Figure 1.
Schematic view of the anodization process.

Figure 2.
(a) X-ray diffraction (XRD) patterns of (1) substrate and (2) anodized sample; XRD patterns of the anodized samples with annealing (b) in air and (c) in Ar gas at (1) 200 °C, (2) 400 °C and (3) 600 °C.
Figure 2.
(a) X-ray diffraction (XRD) patterns of (1) substrate and (2) anodized sample; XRD patterns of the anodized samples with annealing (b) in air and (c) in Ar gas at (1) 200 °C, (2) 400 °C and (3) 600 °C.

Figure 3.
(a,c) Low- and (b,d) high-magnification field emission scanning electron microscope (FESEM) images of the anodized substrate for 2 h obtained from 0.4 M NH4F and 0.2 M H3PO4 electrolyte at 10 V before thermal annealing: (a,b) top-views and (c,d) cross-sectional views.
Figure 3.
(a,c) Low- and (b,d) high-magnification field emission scanning electron microscope (FESEM) images of the anodized substrate for 2 h obtained from 0.4 M NH4F and 0.2 M H3PO4 electrolyte at 10 V before thermal annealing: (a,b) top-views and (c,d) cross-sectional views.
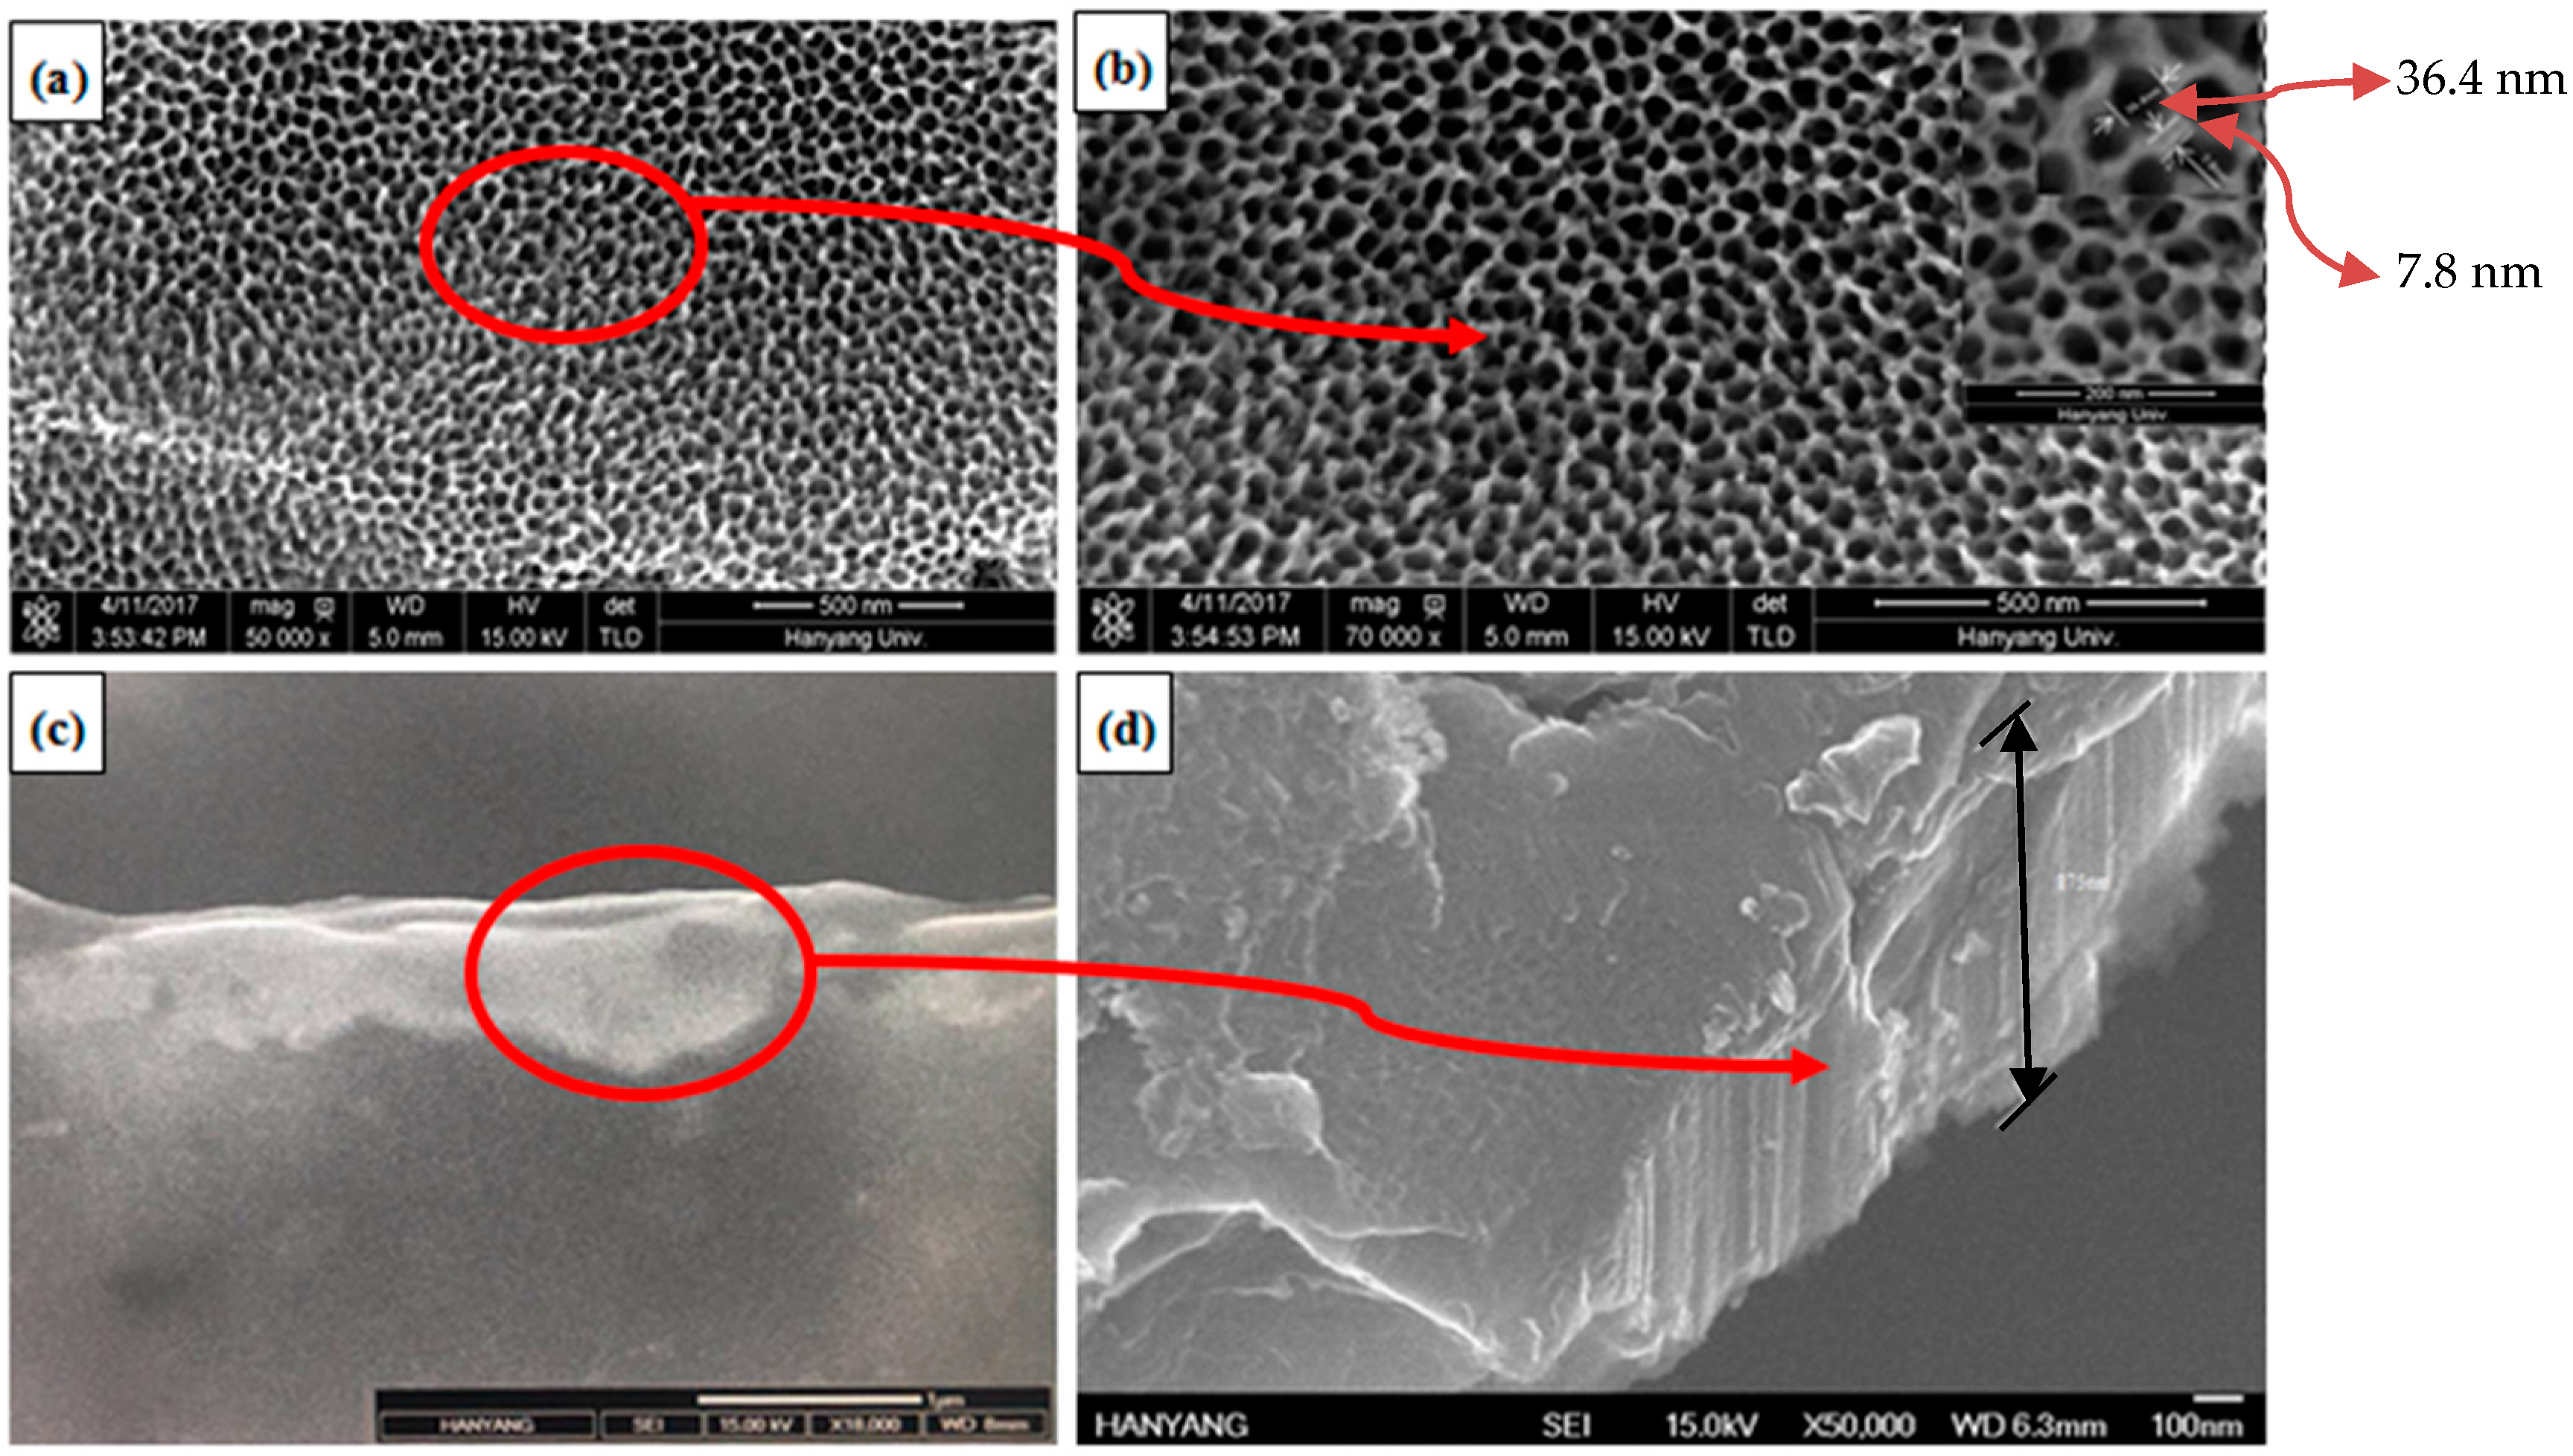
Figure 4.
FESEM images of the samples after annealing for 1 h at (a,b) 200 °C, (c,d) 400 °C, and (e,f) 600 °C in an air atmosphere.
Figure 4.
FESEM images of the samples after annealing for 1 h at (a,b) 200 °C, (c,d) 400 °C, and (e,f) 600 °C in an air atmosphere.

Figure 5.
FESEM images of the samples annealed for 1 h at (a,b) 200 °C, (c,d) 400 °C, and (e,f) 600 °C in Ar gas.
Figure 5.
FESEM images of the samples annealed for 1 h at (a,b) 200 °C, (c,d) 400 °C, and (e,f) 600 °C in Ar gas.

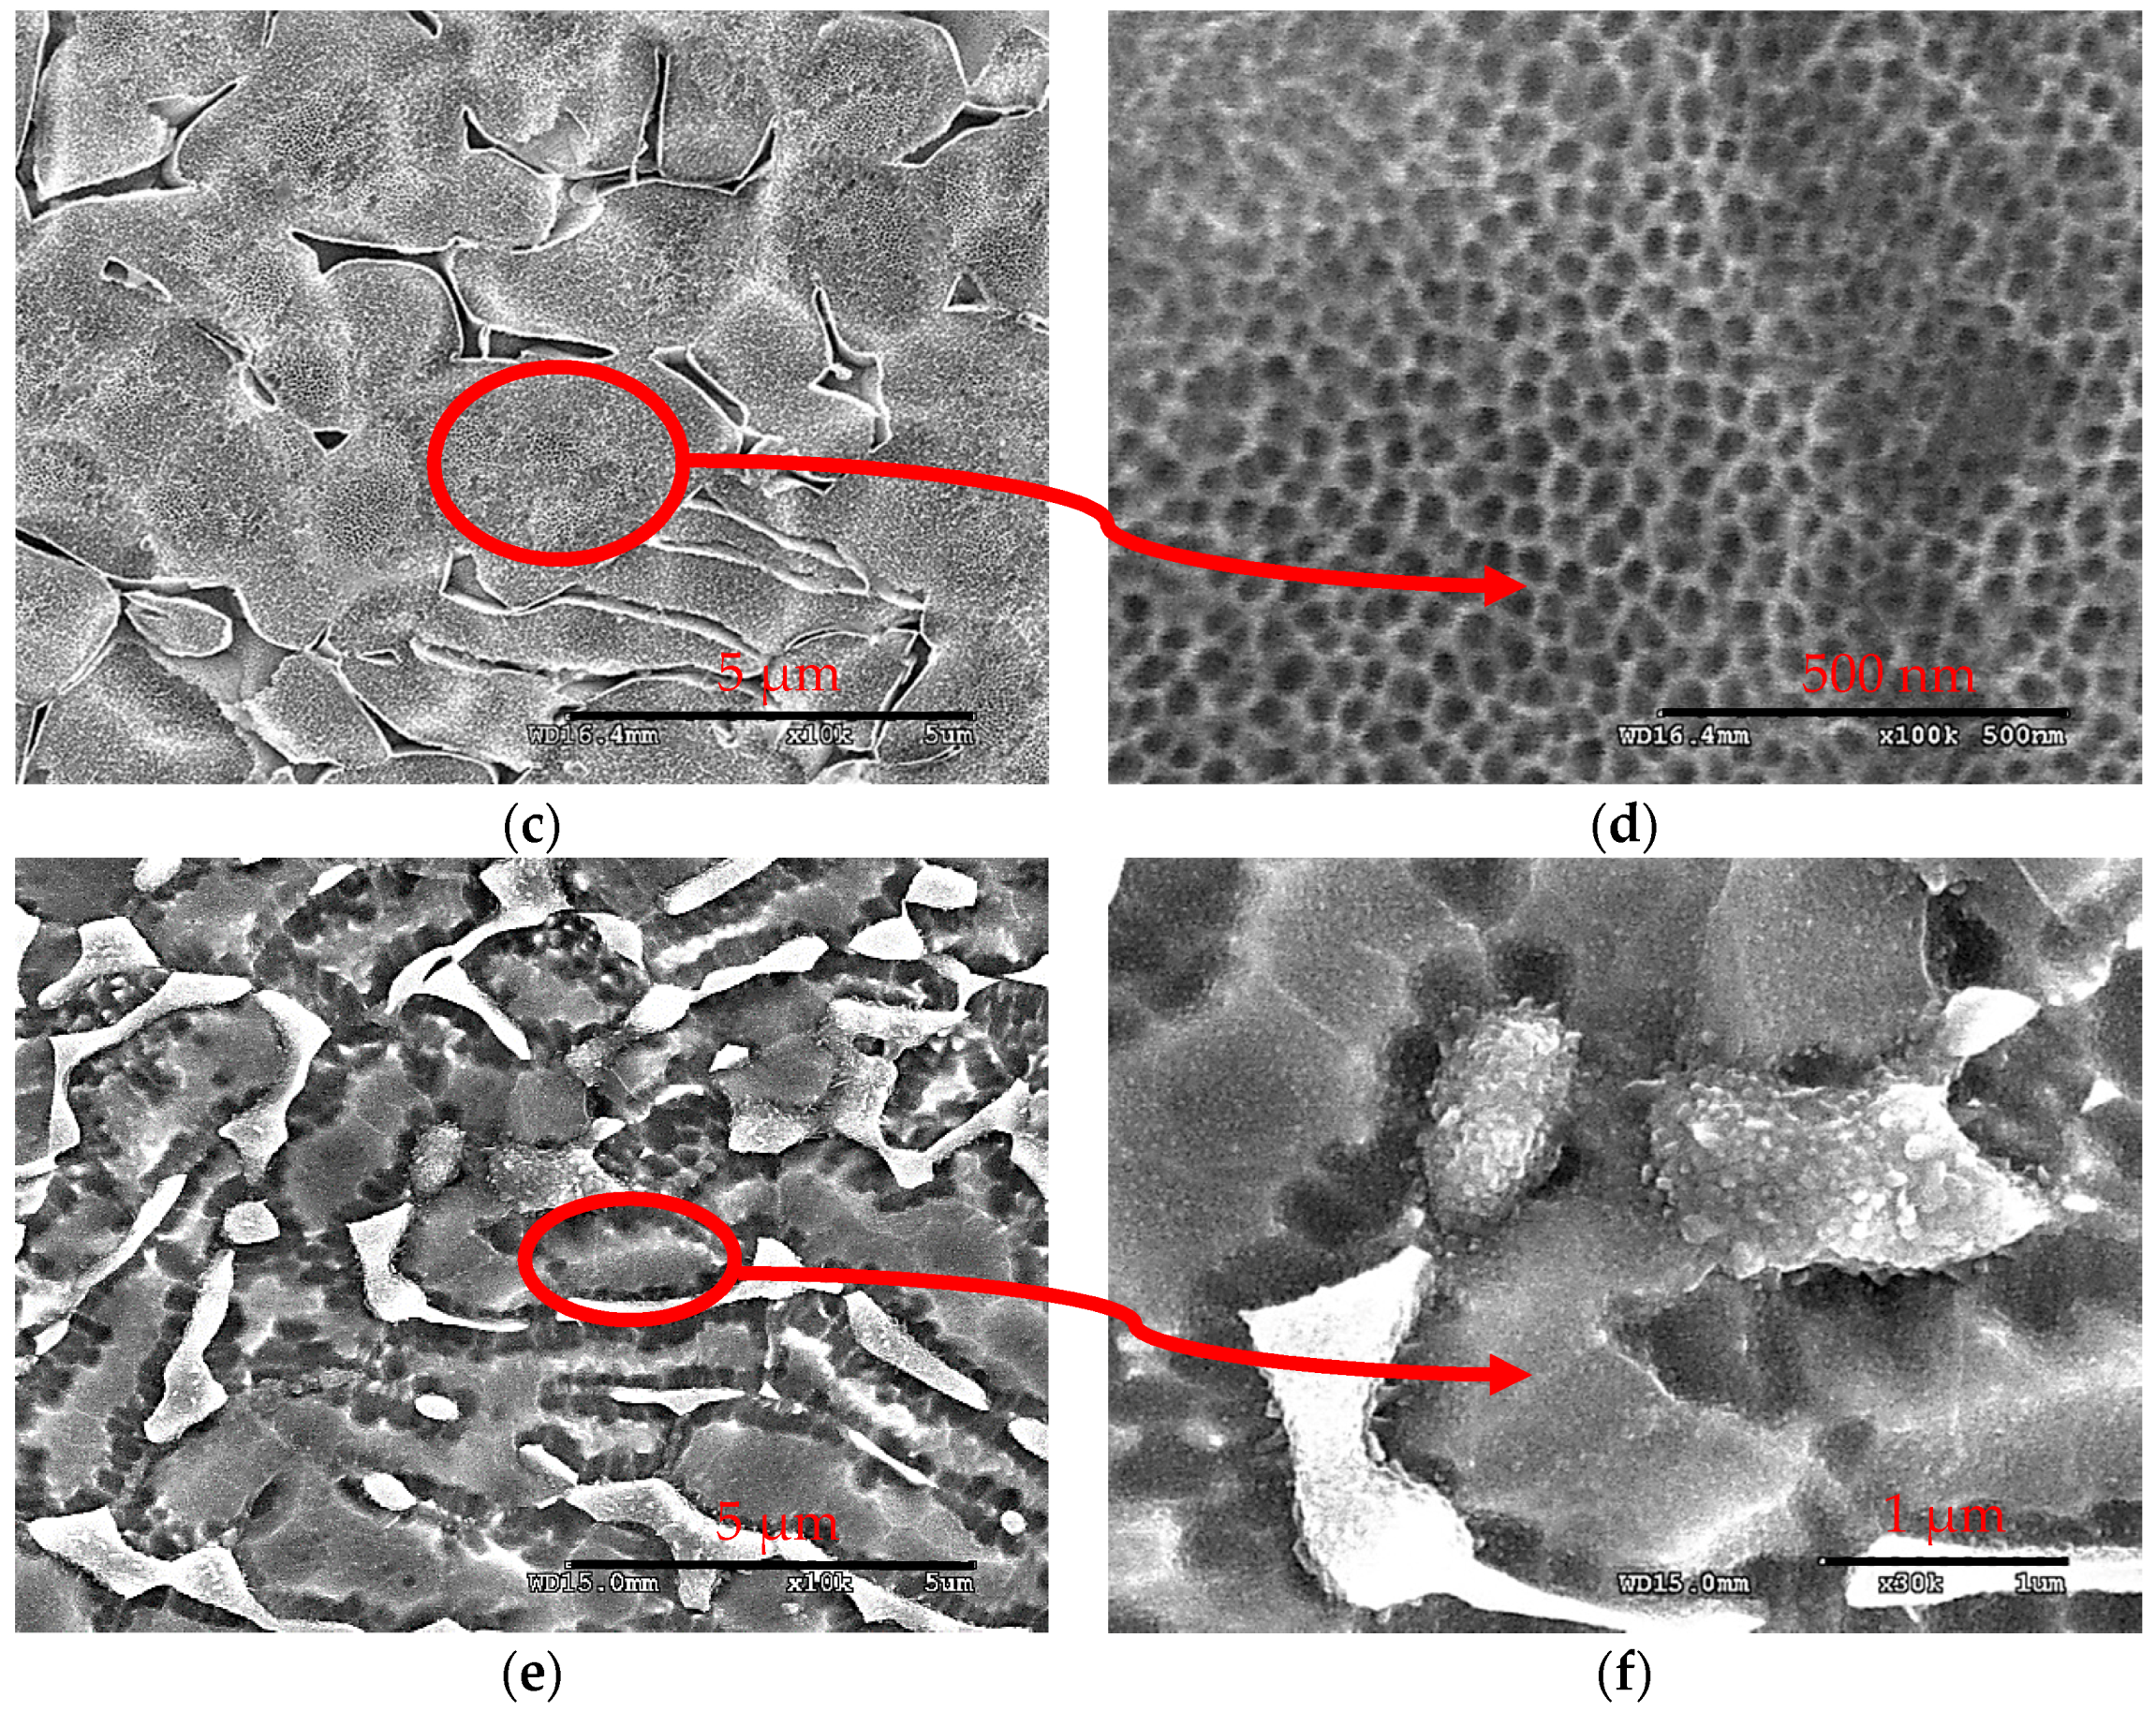
Figure 6.
Energy-dispersive X-ray spectroscopy (EDS) elemental analysis of TiO2 nanotube thin film: (a,b) substrate; (c,d) anodized sample annealed at 600 °C (e,f) in air atmosphere and (g,h) in Ar atmosphere.
Figure 6.
Energy-dispersive X-ray spectroscopy (EDS) elemental analysis of TiO2 nanotube thin film: (a,b) substrate; (c,d) anodized sample annealed at 600 °C (e,f) in air atmosphere and (g,h) in Ar atmosphere.

Figure 7.
Atomic force microscopy (AFM) images of surfaces for (a) as-anodized substrate and TiO2 nanotubular arrays annealed at 600 °C under (b) normal atmosphere and (c) Ar atmosphere.
Figure 7.
Atomic force microscopy (AFM) images of surfaces for (a) as-anodized substrate and TiO2 nanotubular arrays annealed at 600 °C under (b) normal atmosphere and (c) Ar atmosphere.

Figure 8.
The friction coefficients of TiO2 coatings before and after heat treatment at different temperatures and different atmospheres.
Figure 8.
The friction coefficients of TiO2 coatings before and after heat treatment at different temperatures and different atmospheres.
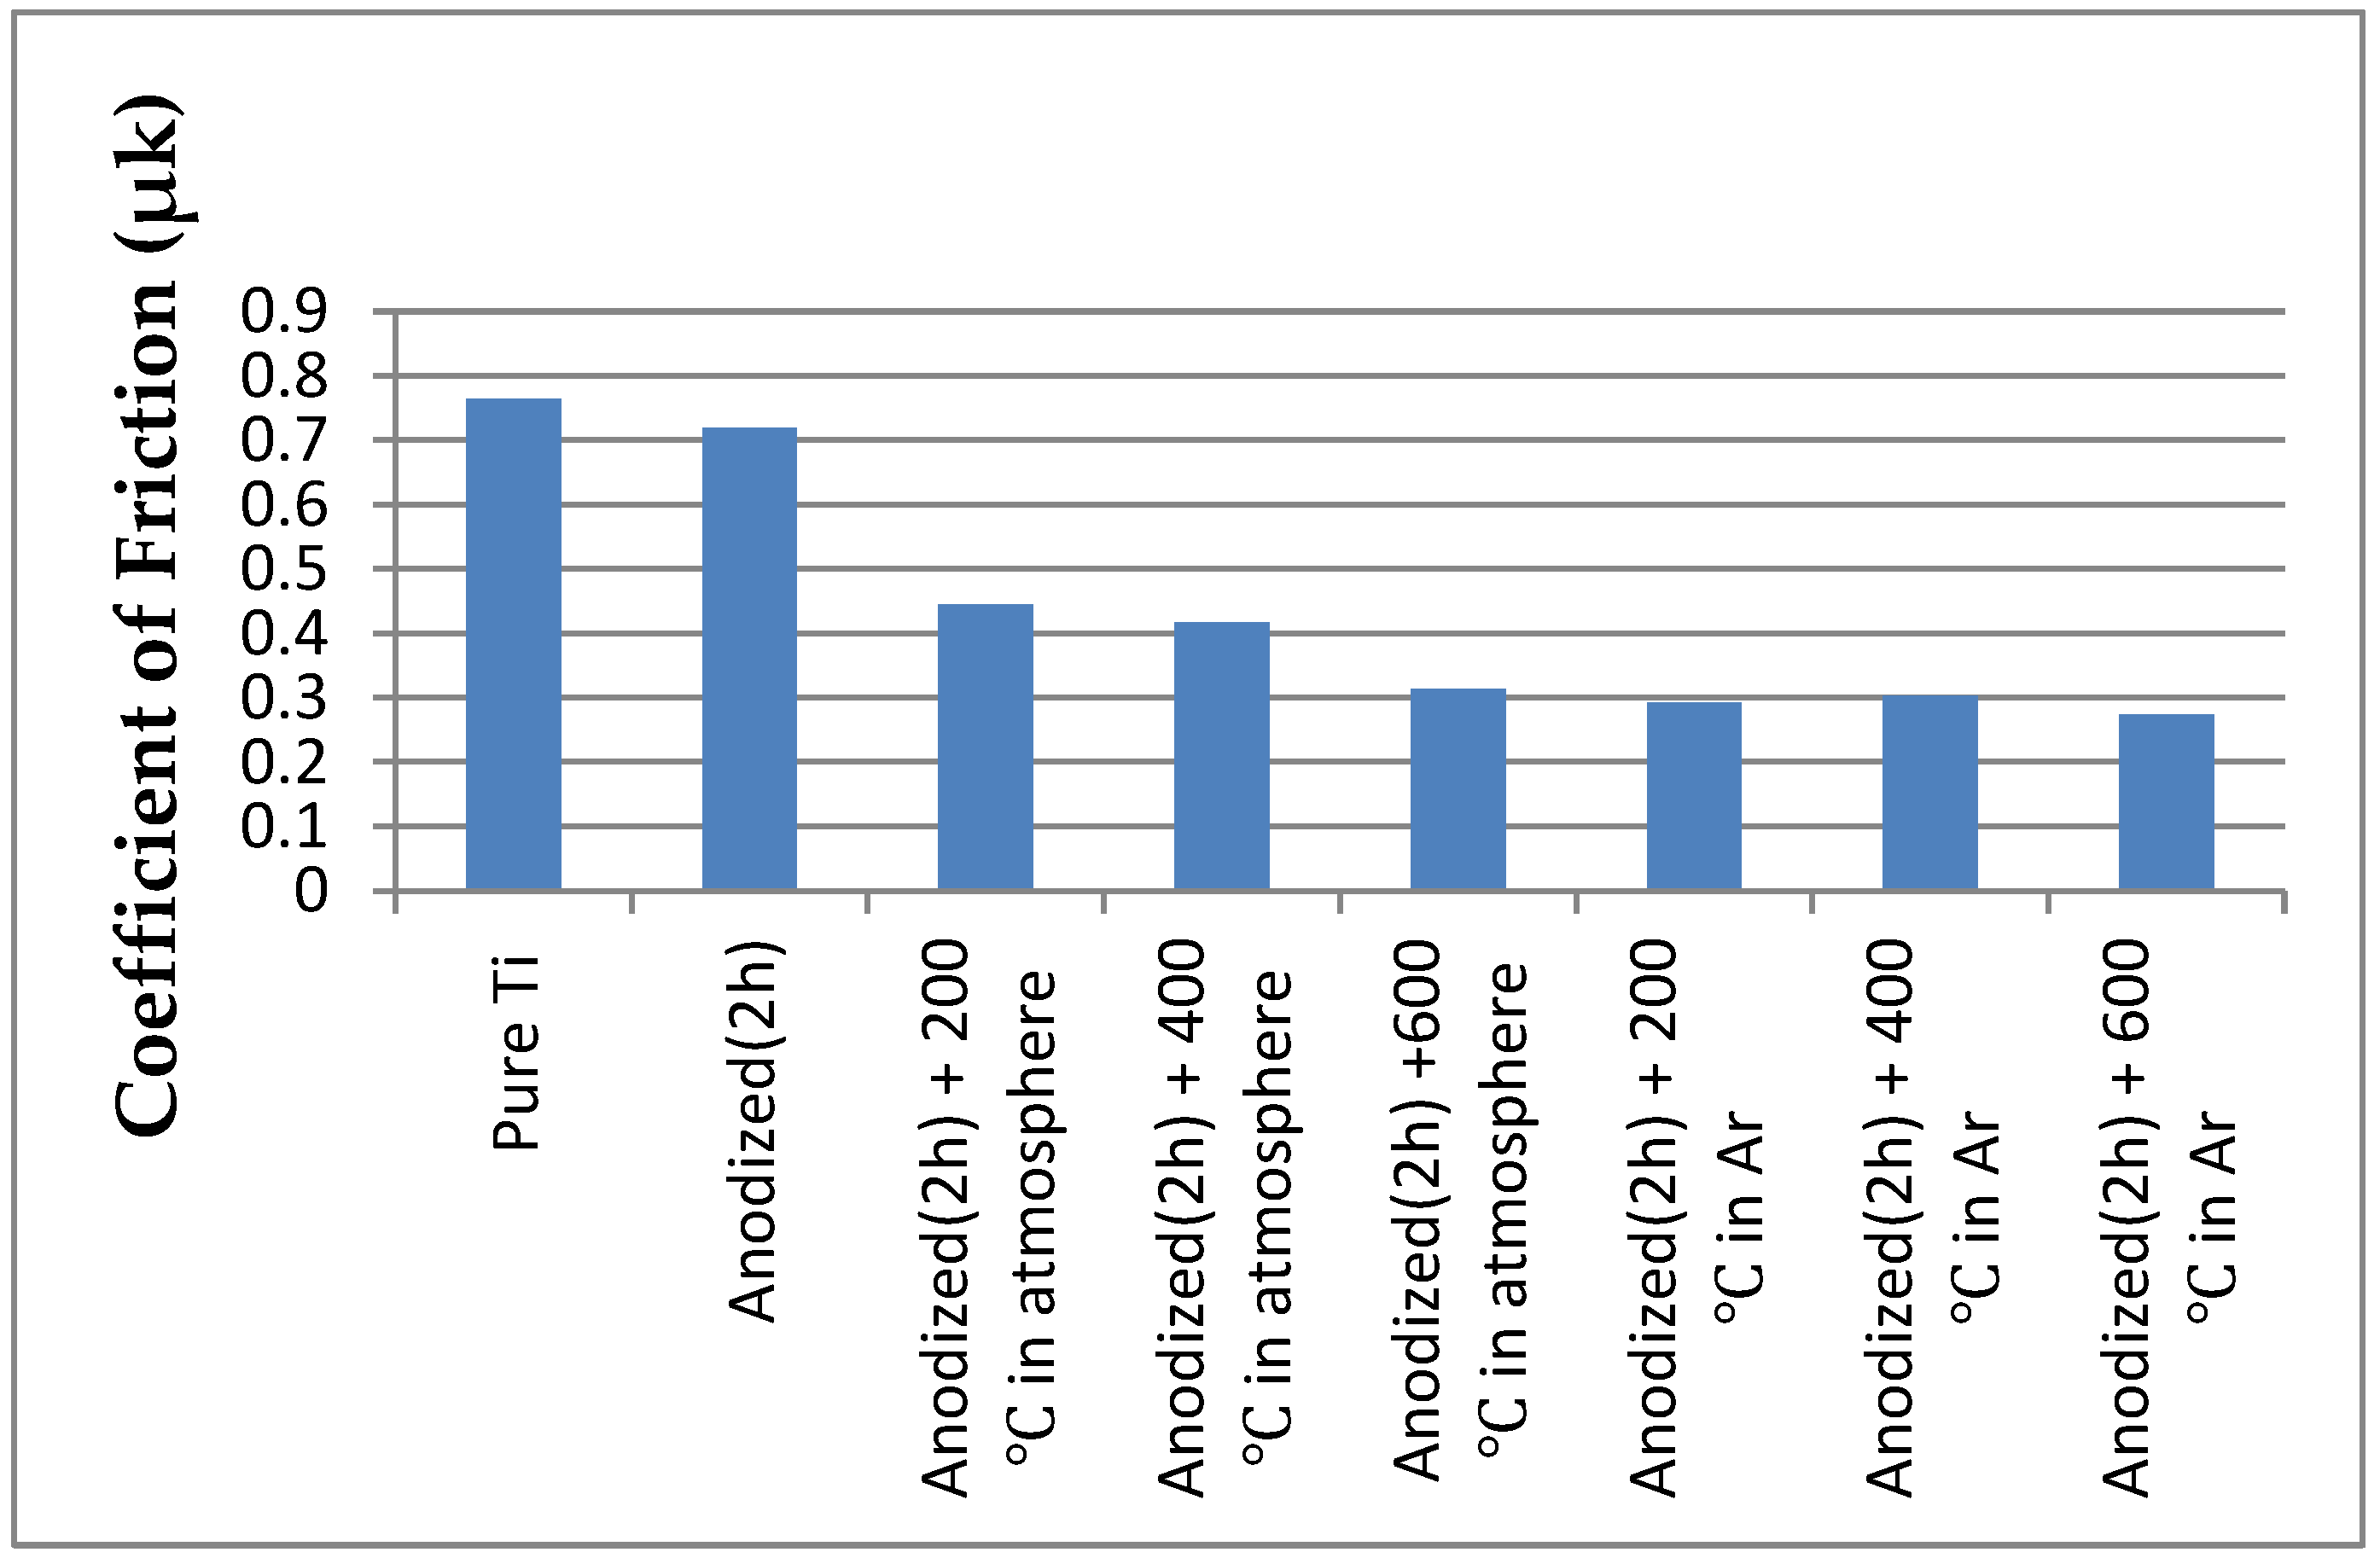
Figure 9.
Low- and high-magnification optical micrographs of worn scar on (a,b) substrate, (c,d) anodized substrate annealed in air atmosphere at (e,f) 200 °C, (g,h) 400 °C, and (i,j) 600 °C and annealed in Ar gas at (k,l) 200 °C, (m,n) 400 °C, and (o,p) 600 °C.
Figure 9.
Low- and high-magnification optical micrographs of worn scar on (a,b) substrate, (c,d) anodized substrate annealed in air atmosphere at (e,f) 200 °C, (g,h) 400 °C, and (i,j) 600 °C and annealed in Ar gas at (k,l) 200 °C, (m,n) 400 °C, and (o,p) 600 °C.


Figure 10.
Characteristic load vs. nanoindentation depth for (a) substrate and (c) anodized sample. Hardness and modulus vs. nanoindentation depth for (b) substrate and (d) anodized sample.
Figure 10.
Characteristic load vs. nanoindentation depth for (a) substrate and (c) anodized sample. Hardness and modulus vs. nanoindentation depth for (b) substrate and (d) anodized sample.
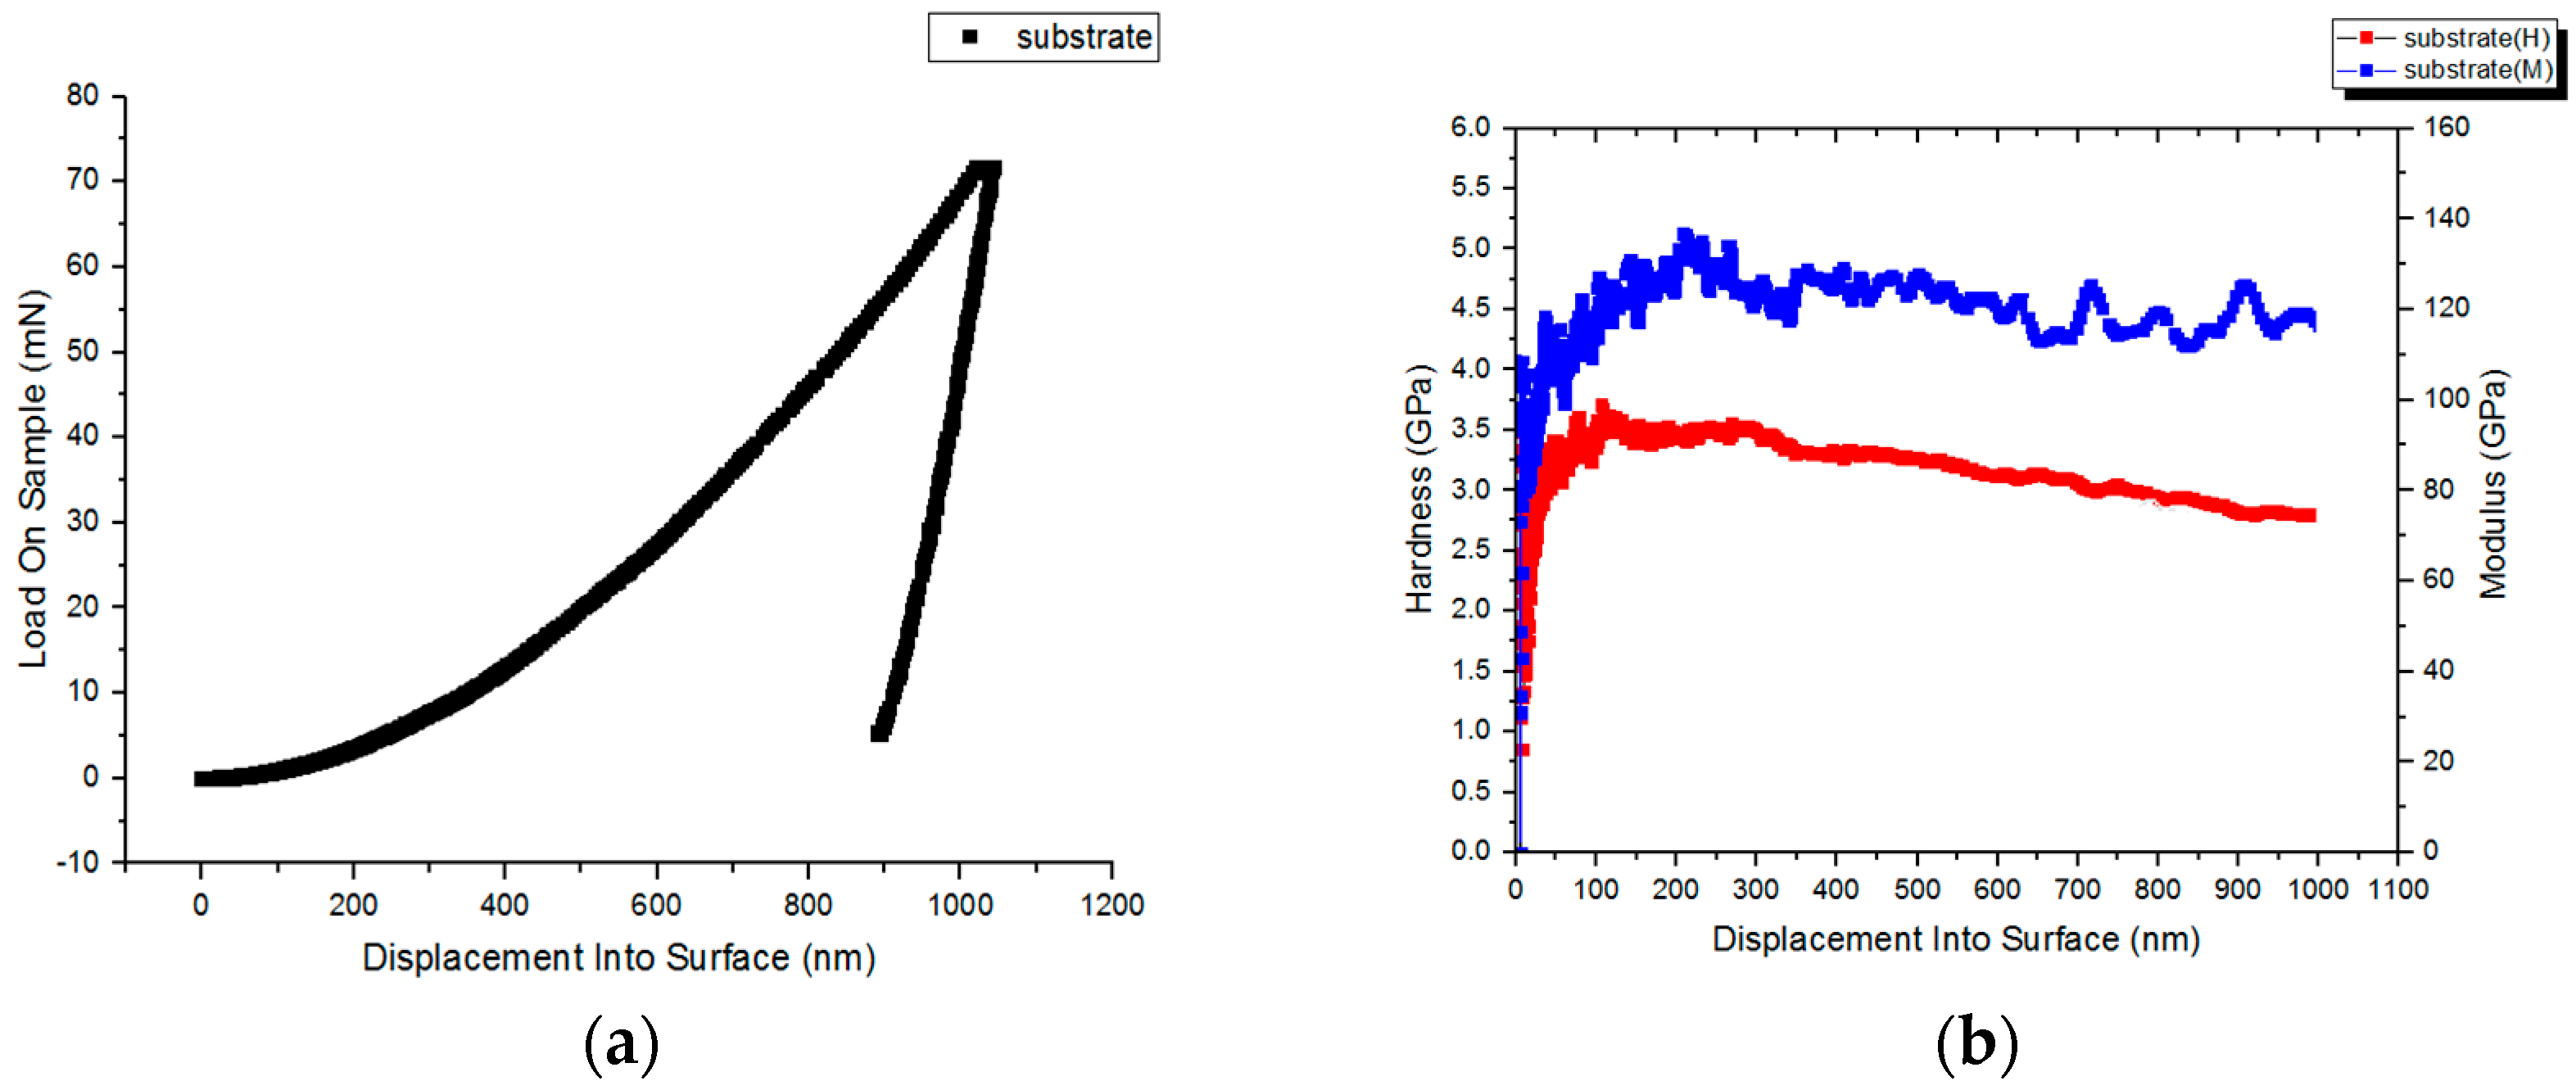

Figure 11.
Characteristic load vs. nanoindentation depth for anodized samples annealed in atmosphere at (a) 200 °C, (c) 400 °C and (e) 600 °C. Hardness and modulus vs. nanoindentation depth for anodized samples annealed in air at (b) 200 °C, (d) 400 °C, and (f) 600 °C.
Figure 11.
Characteristic load vs. nanoindentation depth for anodized samples annealed in atmosphere at (a) 200 °C, (c) 400 °C and (e) 600 °C. Hardness and modulus vs. nanoindentation depth for anodized samples annealed in air at (b) 200 °C, (d) 400 °C, and (f) 600 °C.
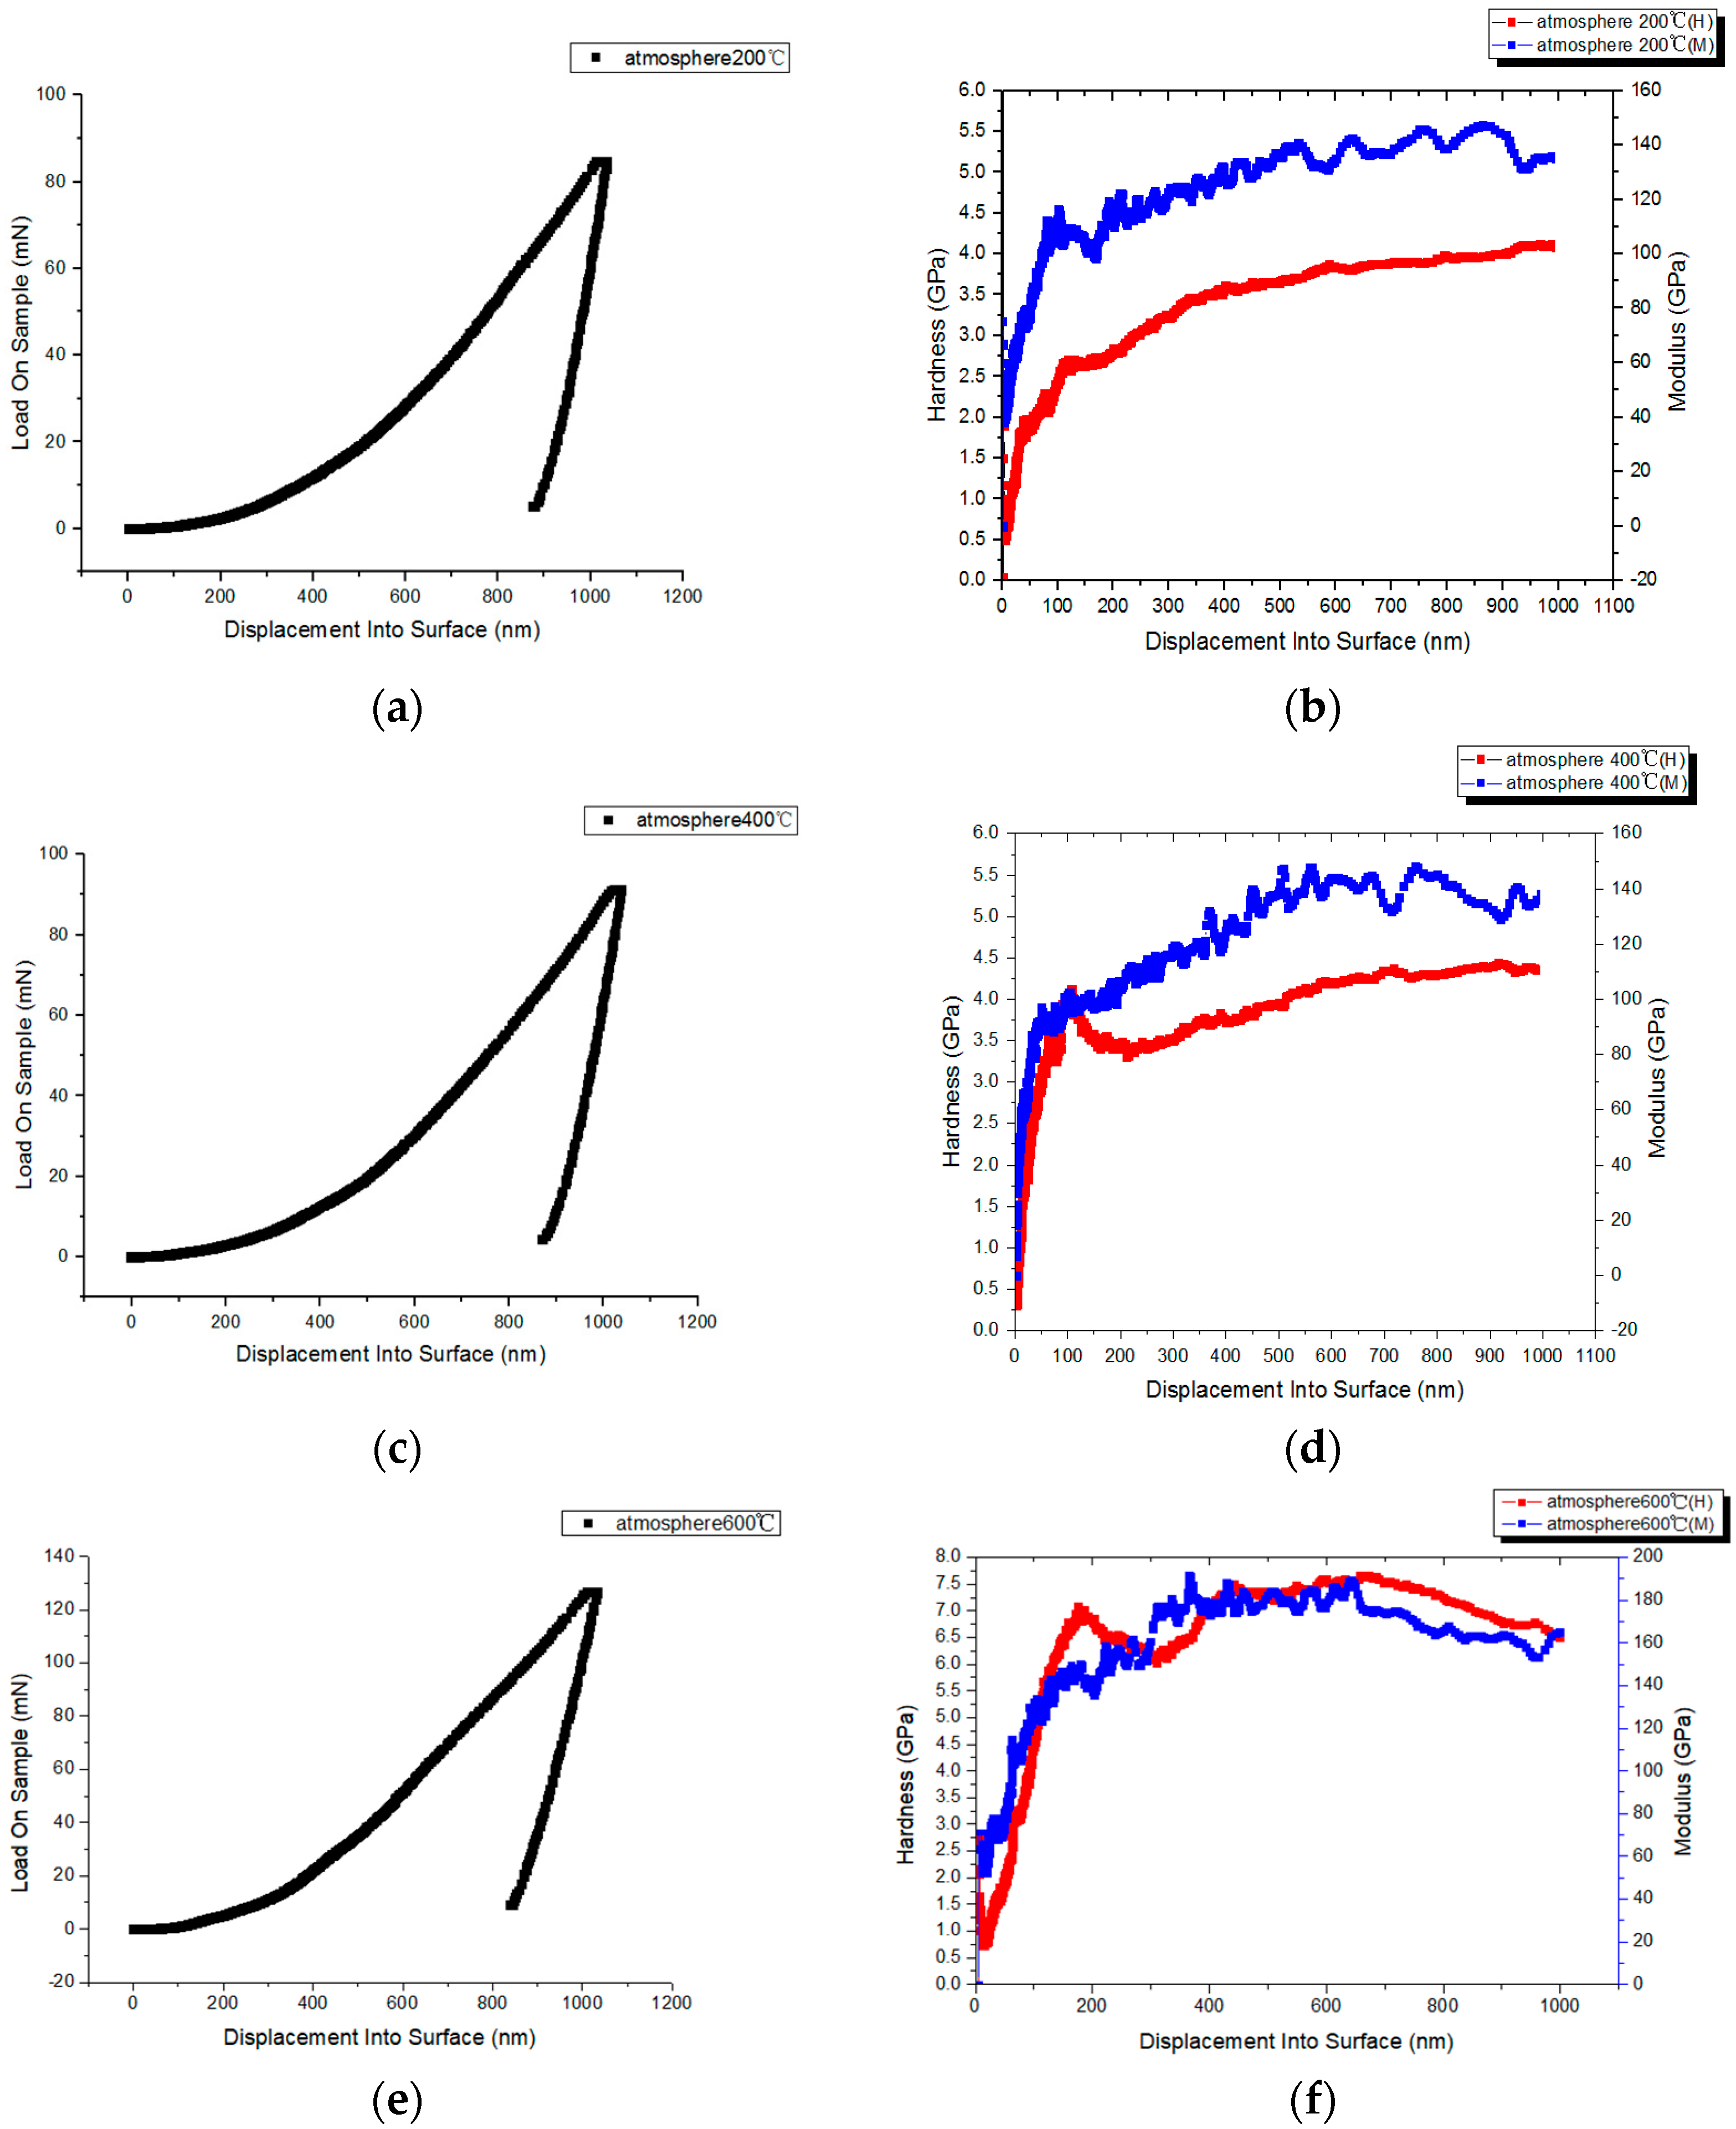
Figure 12.
Characteristic load vs. nanoindentation depth for anodized samples annealed in Ar at (a) 200 °C, (c) 400 °C and (e) 600 °C. Hardness and modulus vs. nanoindentation depth for anodized samples annealed in Ar at (b) 200 °C, (d) 400 °C, and (f) 600 °C.
Figure 12.
Characteristic load vs. nanoindentation depth for anodized samples annealed in Ar at (a) 200 °C, (c) 400 °C and (e) 600 °C. Hardness and modulus vs. nanoindentation depth for anodized samples annealed in Ar at (b) 200 °C, (d) 400 °C, and (f) 600 °C.

Figure 13.
The corrosion behaviors of the uncoated sample and anodized sample.
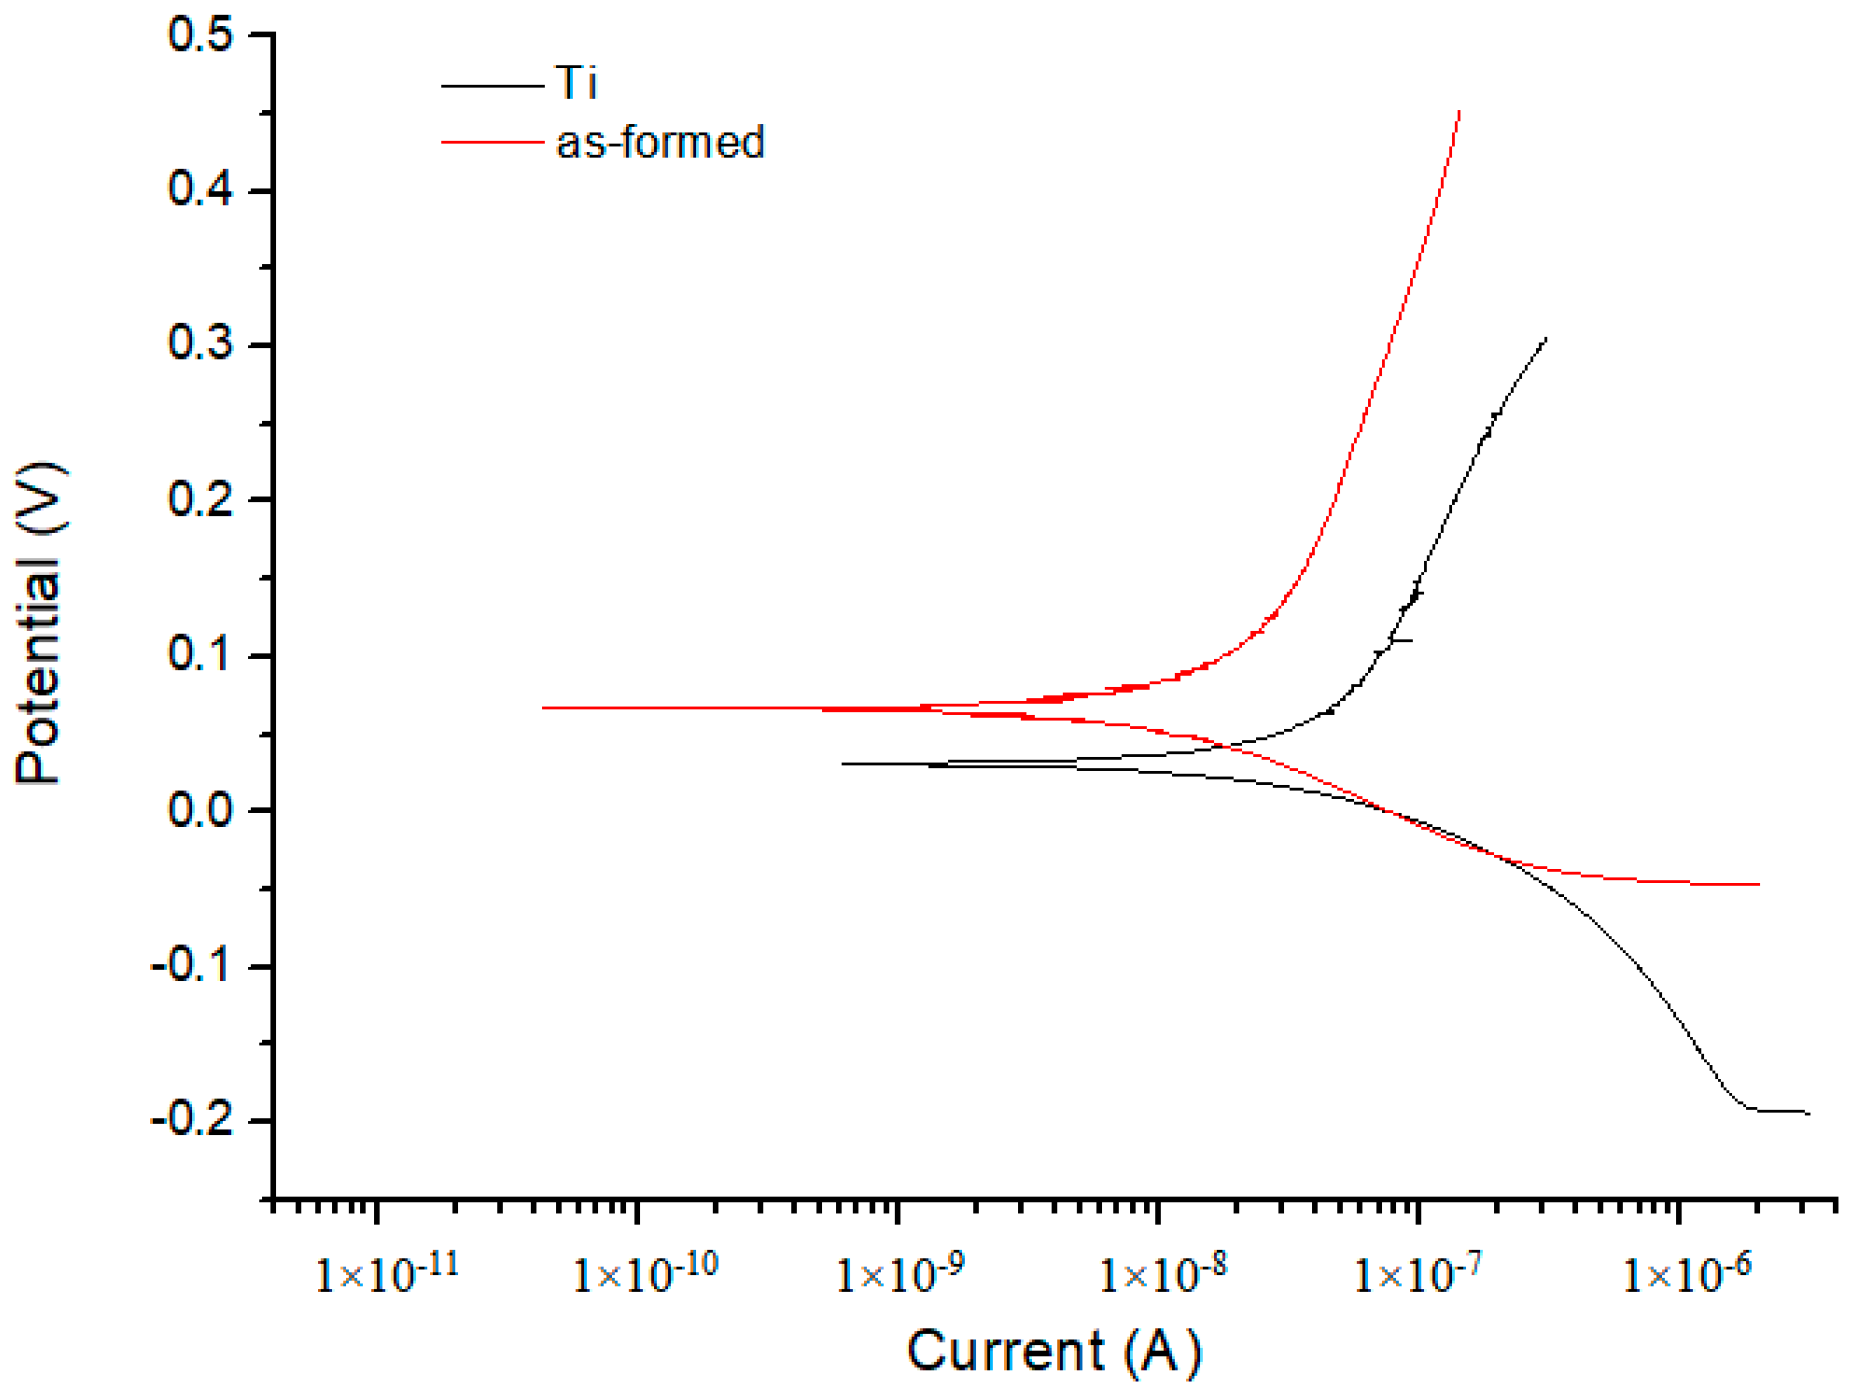
Figure 14.
The corrosion behaviors of the anodized and annealed samples in the atmosphere.

Figure 15.
The corrosion behaviors of the annealed samples in Ar gas.
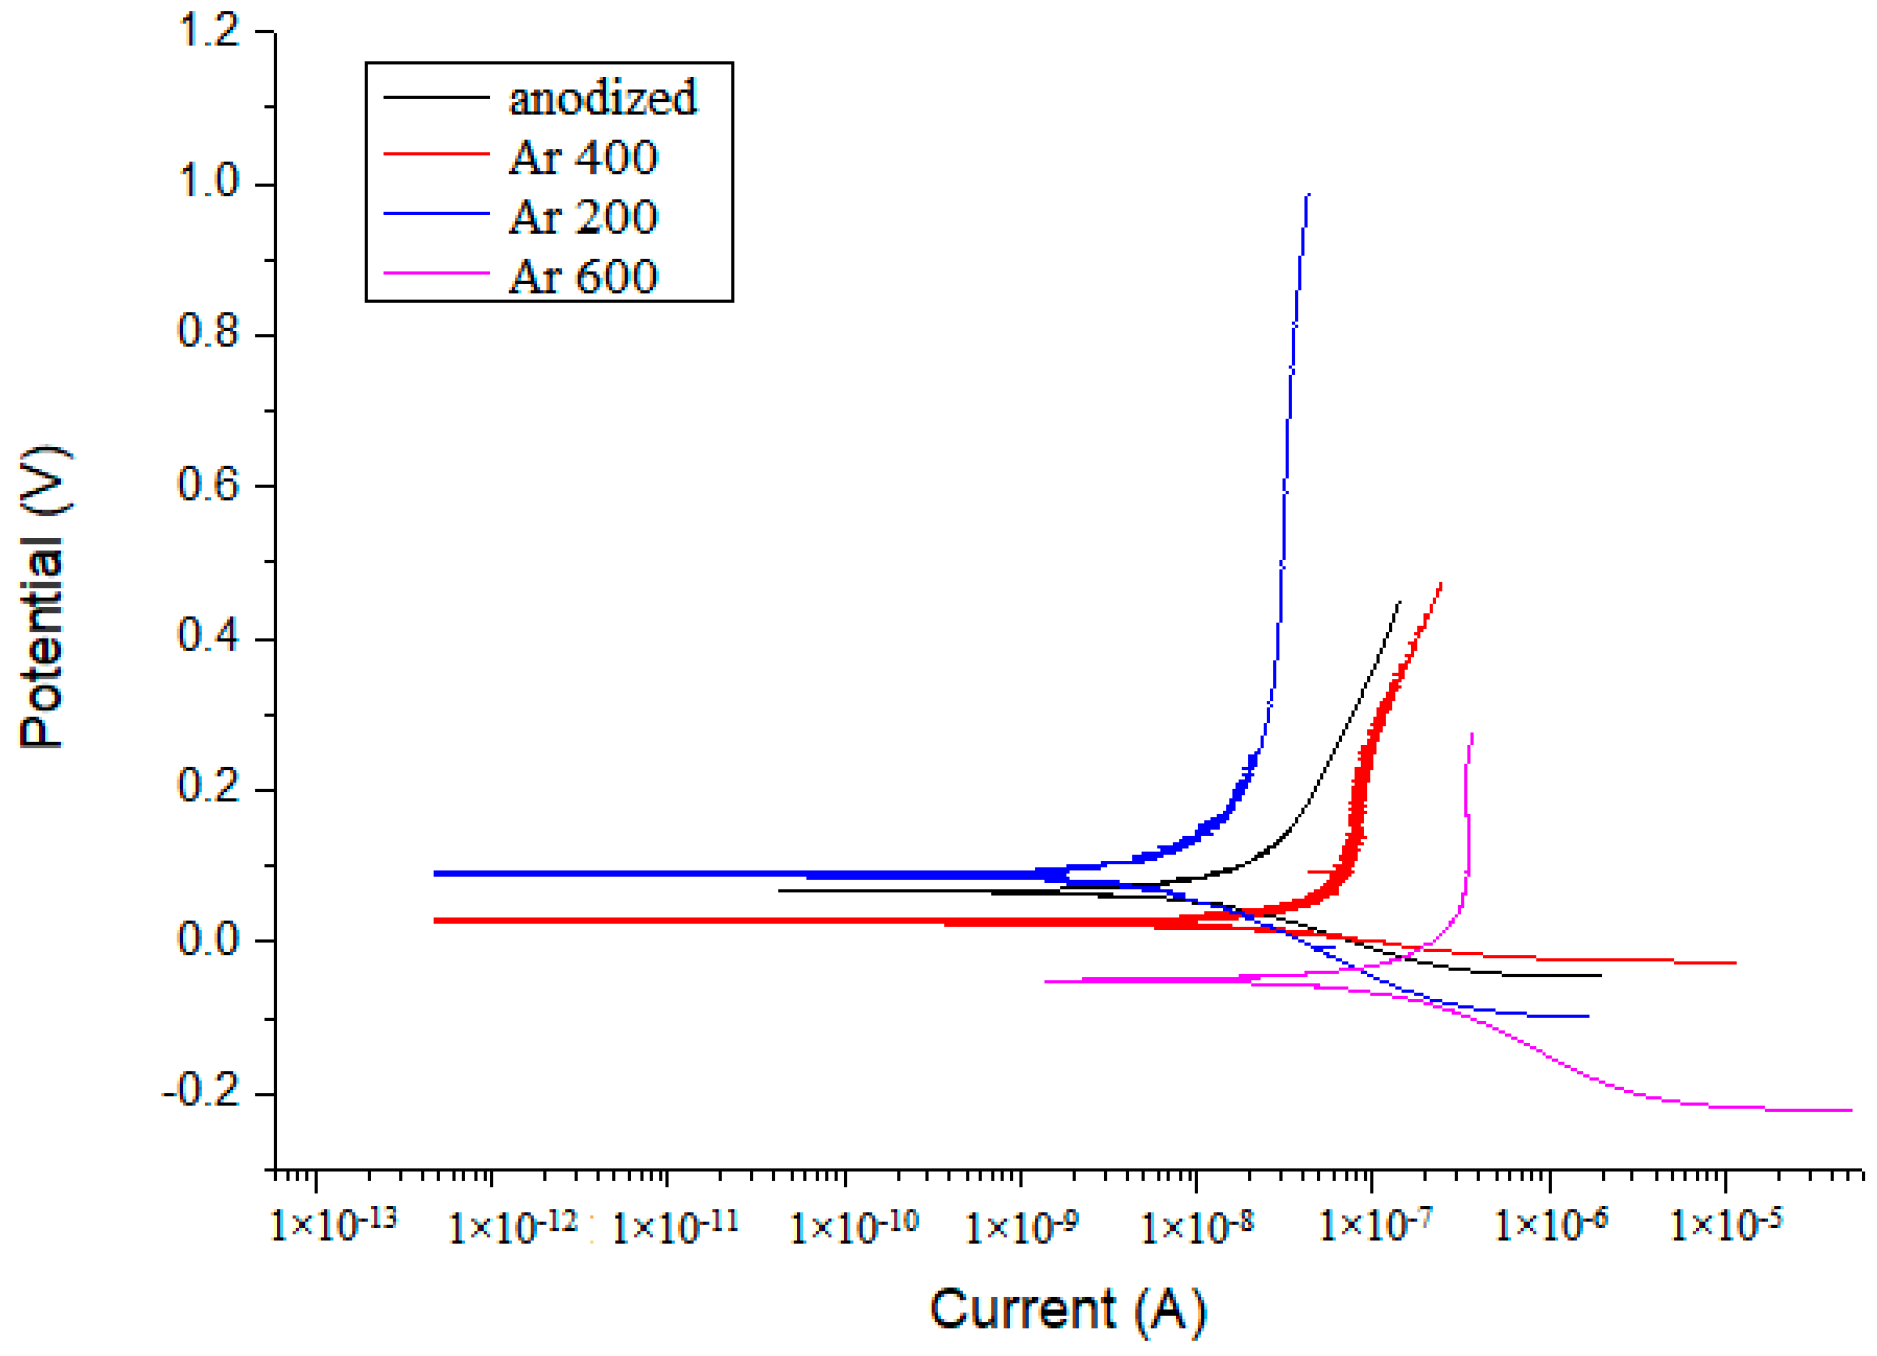
Figure 16.
Low- and high-magnification FESEM images of (a,b) substrate and (c,d) anodized TiO2 nanotube after the corrosion test.
Figure 16.
Low- and high-magnification FESEM images of (a,b) substrate and (c,d) anodized TiO2 nanotube after the corrosion test.

Figure 17.
Low- and high-magnification FESEM images of the annealed samples at 200 °C in (a,b) air atmosphere and (c,d) Ar gas after the corrosion test.
Figure 17.
Low- and high-magnification FESEM images of the annealed samples at 200 °C in (a,b) air atmosphere and (c,d) Ar gas after the corrosion test.

Table 1.
Chemical composition of Ti–V.
| Element | wt % |
|---|---|
| Al | 5.84 |
| V | 4.12 |
| Cr | 0.12 |
| C | 0.35 |
| Fe | 0.13 |
| Si | 0.02 |
| Ti | Balance |
Table 2.
Chemical composition of the synthetic serum.
| Chemical Composition | Concentration (g/dm3) |
|---|---|
| CaCl2 | 1 |
| Na2HPO4 | 22.98 |
| NaH2PO4 | 13.78 |
Table 3.
Wear loss of different samples.
| Sample | Wear Loss (g) |
|---|---|
| Bare sample | 0.0007 |
| Anodized sample | 0.0005 |
| Anodized + 200 °C in Ar | 0.0004 |
| Anodized + 400 °C in Ar | 0.0004 |
| Anodized + 600 °C in Ar | 0.0002 |
| Anodized + 200 °C in air | 0.0004 |
| Anodized + 400 °C in air | 0.0001 |
| Anodized + 600 °C in air | 0.0001 |
Table 4.
Hardness and elastic modulus of different samples—Nanoindentation test.
| Sample | Hardness (GPa) | Elastic Modulus (GPa) |
|---|---|---|
| Bare substrate | 3.38 | 115.51 |
| Anodized sample | 3.66 | 135.55 |
| Anodized + 200 °C in air | 3.71 | 140.34 |
| Anodized + 400 °C in air | 4.11 | 147.46 |
| Anodized + 600 °C in air | 6.15 | 160.87 |
| Anodized + 200 °C in Ar | 3.28 | 140.45 |
| Anodized + 400 °C in Ar | 3.57 | 148.35 |
| Anodized + 600 °C in Ar | 4.36 | 156.64 |
Table 5.
Electrochemical parameters of the potentiodynamic polarization curve.
| Sample | Ecorr (V) | βc (V) | βa (V) | Icorr (A/cm2) |
|---|---|---|---|---|
| Substrate | 2.32 × 10⁻¹ | 1.72 × 10⁻¹ | 8.13 × 10⁻¹ | 1.04 × 10⁻⁷ |
| Anodized | 2.55 × 10⁻¹ | 7.53 × 10⁻² | 7.01 × 10⁻¹ | 2.33 × 10⁻⁸ |
| Anodized + 200 °C in air | 2.82 × 10⁻¹ | 7.4 × 10⁻² | 1.04 | 3.53 × 10⁻⁹ |
| Anodized + 400 °C in air | 2.33 × 10⁻¹ | 8.28 × 10⁻² | 6.91 × 10⁻² | 6.35 × 10⁻⁹ |
| Anodized + 600 °C in air | 2.64 × 10⁻¹ | 1.18 × 10⁻² | 1.09 | 1.87 × 10⁻⁸ |
| Anodized + 200 °C in Ar | 2.18 × 10⁻¹ | 4.58 × 10⁻² | 8.08 × 10⁻¹ | 1.86 × 10⁻⁸ |
| Anodized + 400 °C in Ar | 2.17 × 10⁻¹ | 4.16 × 10⁻² | 6.4 × 10⁻¹ | 4.54 × 10⁻⁸ |
| Anodized + 600 °C in Ar | −5.19 × 10⁻² | 1.76 × 10⁻² | 1.41 × 10⁻¹ | 4.33 × 10⁻⁷ |
© 2018 by the authors. Licensee MDPI, Basel, Switzerland. This article is an open access article distributed under the terms and conditions of the Creative Commons Attribution (CC BY) license (http://creativecommons.org/licenses/by/4.0/).
Share and Cite
MDPI and ACS Style
Han, B.; Zal Nezhad, E.; Musharavati, F.; Jaber, F.; Bae, S. Tribo-Mechanical Properties and Corrosion Behavior Investigation of Anodized Ti–V Alloy. Coatings 2018, 8, 459. https://doi.org/10.3390/coatings8120459
AMA Style
Han B, Zal Nezhad E, Musharavati F, Jaber F, Bae S. Tribo-Mechanical Properties and Corrosion Behavior Investigation of Anodized Ti–V Alloy. Coatings. 2018; 8(12):459. https://doi.org/10.3390/coatings8120459
Chicago/Turabian StyleHan, Bingrong, Erfan Zal Nezhad, Farayi Musharavati, Fadi Jaber, and Sungchul Bae. 2018. "Tribo-Mechanical Properties and Corrosion Behavior Investigation of Anodized Ti–V Alloy" Coatings 8, no. 12: 459. https://doi.org/10.3390/coatings8120459
Note that from the first issue of 2016, this journal uses article numbers instead of page numbers. See further details here.