Microfiber Coating for Drag Reduction by Flocking Technology


Department of Aerospace and Mechanical Engineering, University of Notre Dame, Notre Dame, IN 46556, USA
*
Author to whom correspondence should be addressed.
Coatings 2018, 8(12), 464; https://doi.org/10.3390/coatings8120464
Submission received: 29 October 2018
/
Revised: 1 December 2018
/
Accepted: 11 December 2018
/
Published: 14 December 2018
Abstract
:The biomimicry of using a hair-like structure is introduced as a drag reduction coating. The hair-like structure consists of an array of microfiber that is introduced as a passive drag reduction device. An effective flow control for a transition delay or a flow attachment is expected via an interaction or counteraction of flexible fibers, compared to the existing passive methods that use a solid or rigid surface device. The effect of the microfiber coating on drag reduction over a bluff-body was experimentally investigated using a circular cylinder in a wind tunnel at Reynolds number of 6.1 × 10⁴. A drag reduction of 32% was obtained when the microfiber coating with a length of 0.012D was located at 40° from the stagnation point. Smoke flow visualization showed that flow separation delay was induced by the microfiber coating when the drag reduction occurred.
1. Introduction
A flow control over a bluff-body is essential for drag reduction. A fluid dynamic load has a crucial influence on the flutter suppression of structures, the fatigue of structures and materials, and the fuel efficiency for moving structures. It can be performed by active or passive flow-control methods. Active flow-control methods, such as plasma actuators, have significant effects on flow control and can effectively cause drag reduction [1,2]. However, these methods require an external energy for operation, and a mechanical and electrical installation to a fluid-interaction structure is required. On the other hand, a passive flow-control method does not require external energy. In particular, a passive flow-control device using an engineered surface, materials, or coatings does not require a modification to the outer bodies of existing objects that provide a broad application for a drag reduction [3]. Various types of passive flow-control methods have been developed by means of surface modifications, such as a trip rod [4,5,6,7], dimple [8,9], vortex generator [10,11], permeable surface [12,13,14], and riblets [15,16,17].
A hair-like structure is another candidate for passive flow-control [18,19,20]. A hair-like structure biomimics the hair surface of birds or seals, consisting of a group of flexible elements. It can be formed as a flexible micropillar, fur, or a filament, and produces a passive but adaptive behavior to a flow by a 3D motion of the flexible elements, similar to a compliant surface [19,20].
Flow separation and its associated drag over a bluff body are mitigated by the hair-like structure. Hereby, we hypothesize that two types of flow-control over a bluff body can be performed by the hair-like surface, as shown in Figure 1: (1) Transition delay and resultant separation delay, if a hair-like surface is applied to a location before a flow separation of a baseline (Figure 1a); (2) Flow attachment enhanced by the counteraction of hair elements to the incoming flow, if the hair-like surface is at a location after/near the flow separation (Figure 1b).
In the present study, we used a 3D arrangement of a hair-like coating, which consisted of a cluster of microfibers (microfiber coating) on a circular cylinder in crossflow. Microfiber coatings were applied before and after the point of flow separation over a cylinder surface. A cylinder flow has two distinctive flows: Attached and separated.
2. Materials and Methods
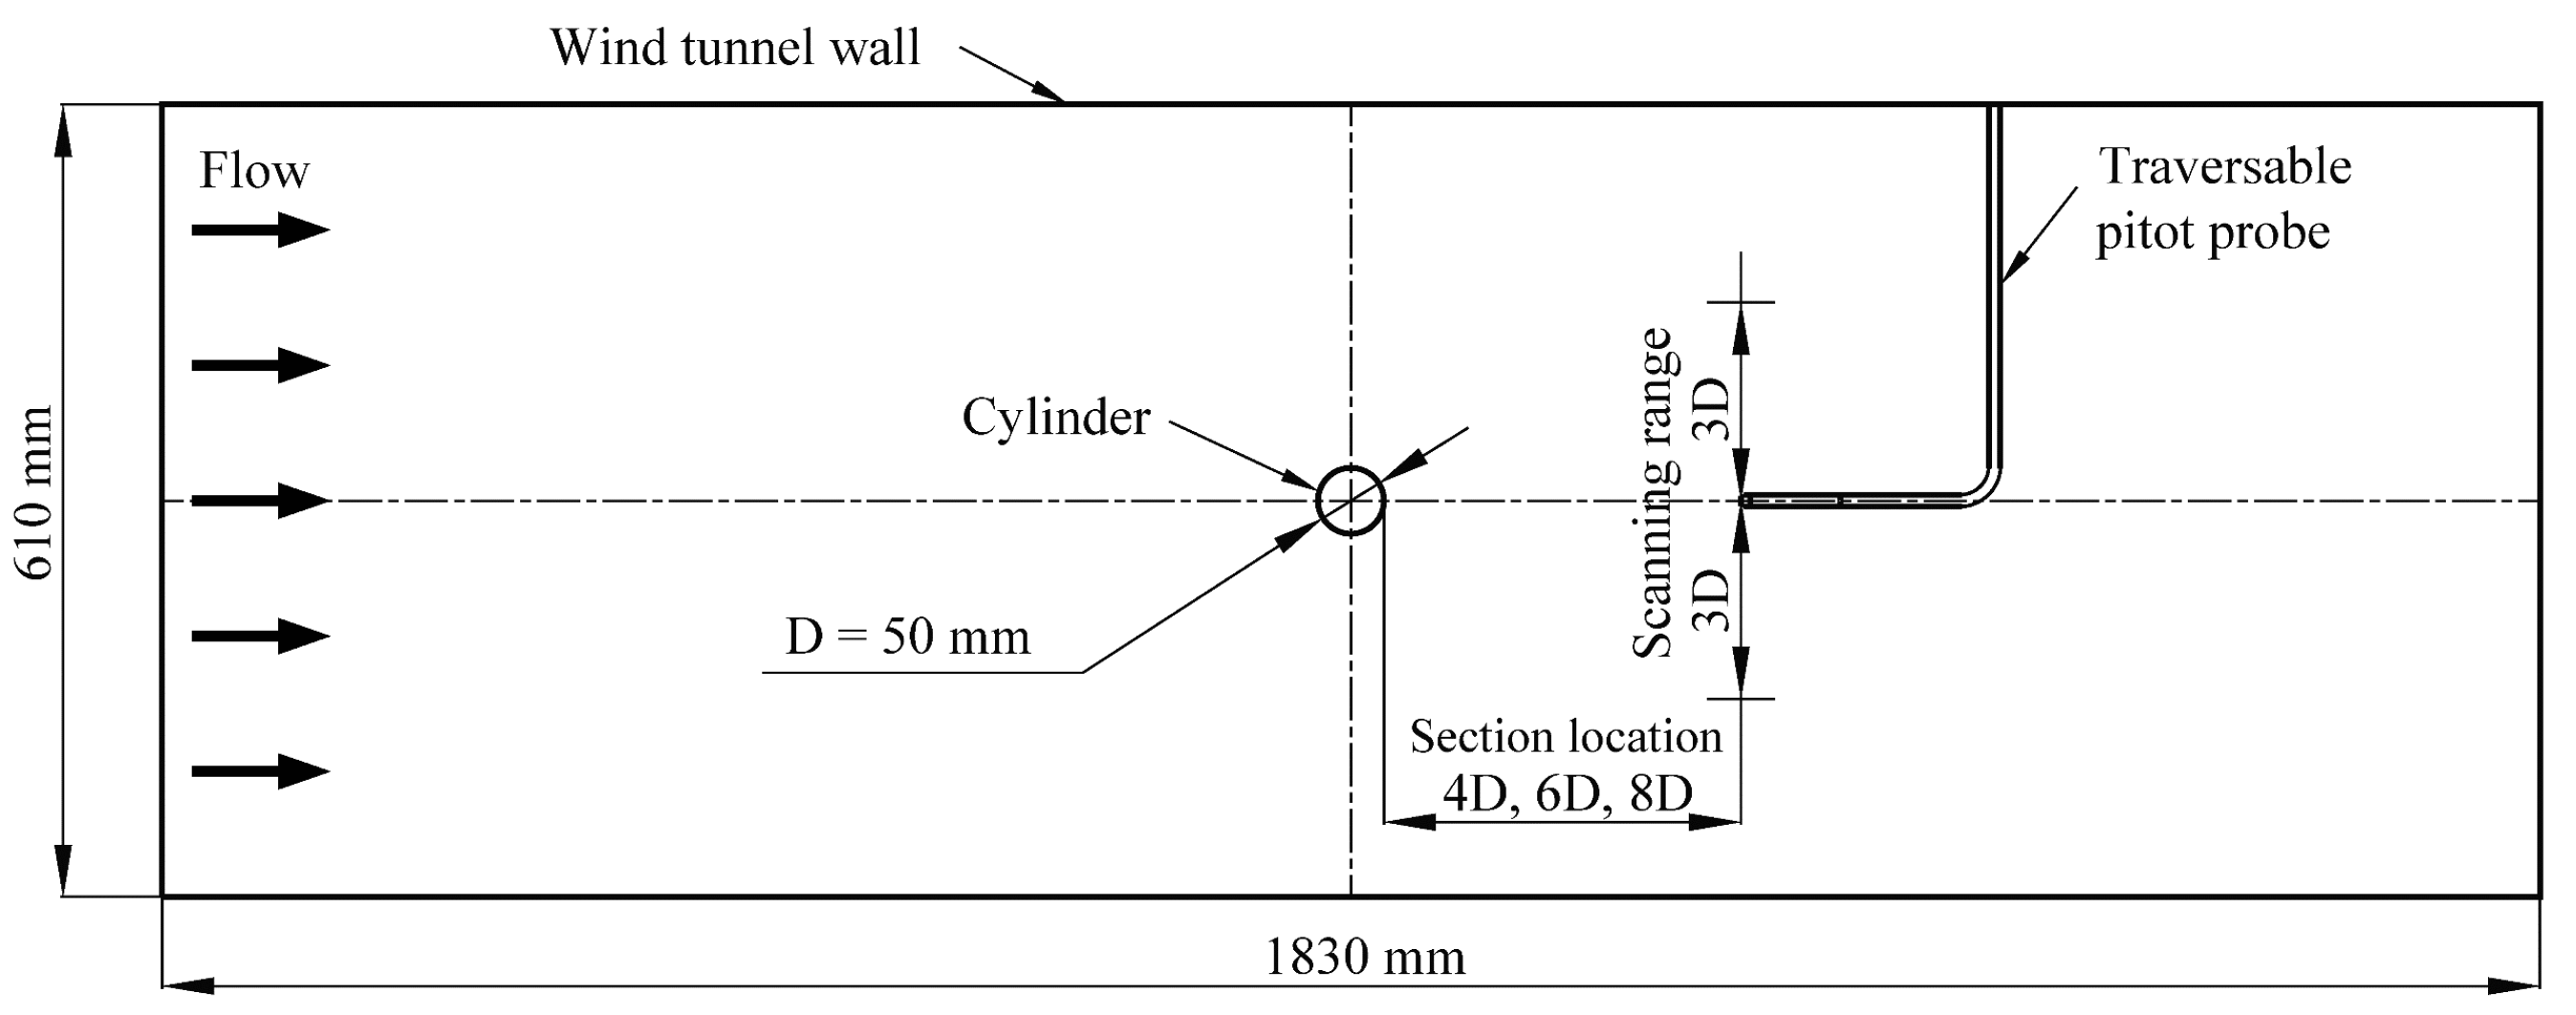
A wake survey and a smoke flow visualization were performed in a subsonic wind tunnel located at the Hessert Laboratory for Aerospace Research at the University of Notre Dame. The test section had a 0.61 m square cross-section and a length of 1.83 m. The wind tunnel had an inlet contraction ratio of 20:1. A series of 12 turbulence management screens installed at the front of the inlet provided tunnel freestream turbulence levels of less than 0.1%.
A cylinder machined from a solid engineering plastic was used in the current study. The cylinder diameter, D, was 50 mm and the span length, L, was 610 mm, which gives an aspect ratio, L/D, of approximately 12. The solid blockage ratio was 8%. It was mounted horizontally in the test section. The mount enabled the cylinder to rotate about its pivot axis by a measured angle and to be fixed at different streamwise positions. In the present study, the freestream velocity, U∞, was 20 m/s for all test cases and the Reynolds number based on the cylinder diameter, D, was 6.1 × 10⁴.
A microfiber coating was partially applied over the cylinder surface. Two different locations were chosen to test the performance of the microfiber coating. One was at the coating angle, θ, of 40°, and the other at 80°. Figure 2a schematically describes the coating angle, θ, which started from the horizontal stagnation line of the cylinder and continued to the front edge of the coating. The width of the microfiber coating is shown as W, which was fixed at 0.3D (15 mm). Under the experiment condition Re = 6.1 × 10⁴, a smooth cylinder experiences two distinctive flow regions, known as a subcritical regime—the laminar boundary layer and its separation regions [21]. According to the literature [4,21,22], the laminar boundary layer is still attached at 40° from the horizontal stagnation line of a cylinder, while a flow separation begins at around 70°–80°. Two distinct locations match the attached flow and separated flow regions over the cylinder.
The microfiber coating was fabricated using an electrostatic flocking method [23,24]. Under an electrostatic field, fibers were aligned mostly perpendicular over an adhesive layer. Figure 2b shows a microscope image of the coating used in the present study. The fabricated microfiber coating showed variation in the azimuthal angle, while the microfiber coating in Figure 2a illustrates an ideal condition with perfect alignment. The mean density of microfiber, which is represented by the number of fibers per unit area, was 23 filaments per mm2. Nylon fiber was chosen, which was 0.00028D (14 μm) in diameter and 0.012D (0.6 mm) in length. Epoxy adhesive was applied on a tape (Aluminum Foil Tape 433L, and 3380; 3M, St. Paul, MN, USA) with a thickness of 90 μm.
2.1. Flow Visualization
A smoke-flow visualization was performed to understand the flow over the cylinder. Seeding particles of less than 1 μm in diameter were continuously injected from the upstream of the wind tunnel, creating fog streak lines along the center plane of the wind tunnel test section. The seeding particles of droplets (DEHS Aerosol Liquid for Atomizer, TOPAS, Dresden, Germany) were generated by a particle seeder (SIX-JET ATOMIZER9306, TSI, Shoreview, MN, USA). The streamed flow was illuminated by a laser sheet provided by a 445-nm blue laser (Blue 445-10W, NECSEL, Milpitas, CA, USA) and a cylindrical lens. The fog streak lines were captured by a high-speed camera (FASTCAM SA1.1, Photron, Tokyo, Japan) with a frame-rate of 1000 frames per second. A flow separation angle, θs, where the flow separation can be seen on the cylinder surface, was determined using the image acquired from flow visualization. It is defined as the angle between the horizontal stagnation line of the cylinder and the front edge of the coating, which can be seen schematically in Figure 2a.
2.2. Wake Survey
A wake survey was conducted using a pitot probe. Figure 3 shows a schematic of the wake survey setup. Dynamic pressure, qwake, of 25 data points were scanned over a range that was ±3D in the vertical axis from the horizontal centerline of the cylinder. The interval of scanning points was 12.7 mm. A step motor traverse system with a step motor driver (PDO 3540, Applied Motion Products, Watsonville, CA, USA) was used to vertically traverse a wake flow using a pitot-static tube. Wake measurements were performed at 4D, 6D, and 8D downstream from the trailing edge of the cylinder. For the freestream measurement, freestream dynamic pressure, q∞, was also measured at 4D upstream from the cylinder. To read dynamic pressures, a pressure transducer (DATUM 2000, Setra Systems, Boxborough, MA, USA) with a full-scale range of 0–127 mm of water column was used. It has an accuracy of ±0.14% of its full-scale reading. The output signal from the transducer was read by a DAQ system (DT9836, Data Translation, Marlborough, MA, USA) with 16-bit A/D channels and a maximum sampling rate of 225 kHz. Each pressure measurement was sampled at 1 kHz for 10 s. Post-processed averaged data was used for the drag estimation.
2.3. Drag Force Estimation
The drag coefficient was estimated using a two-dimensional integral momentum balance method. According to the literature [25], the following expression for a drag coefficient per unit span of a cylinder, cd, is given as
where q∞ and qwake are the dynamic pressures at freestream and downstream of the cylinder, respectively. Then, a normalized drag coefficient, which is normalized by the drag coefficient of the baseline: cd/cd-baseline, was obtained:
where the normalized drag coefficient, cd-norm, below unity shows a drag decrease, while a drag increase is shown above unity.
3. Results
3.1. Flow Visualization
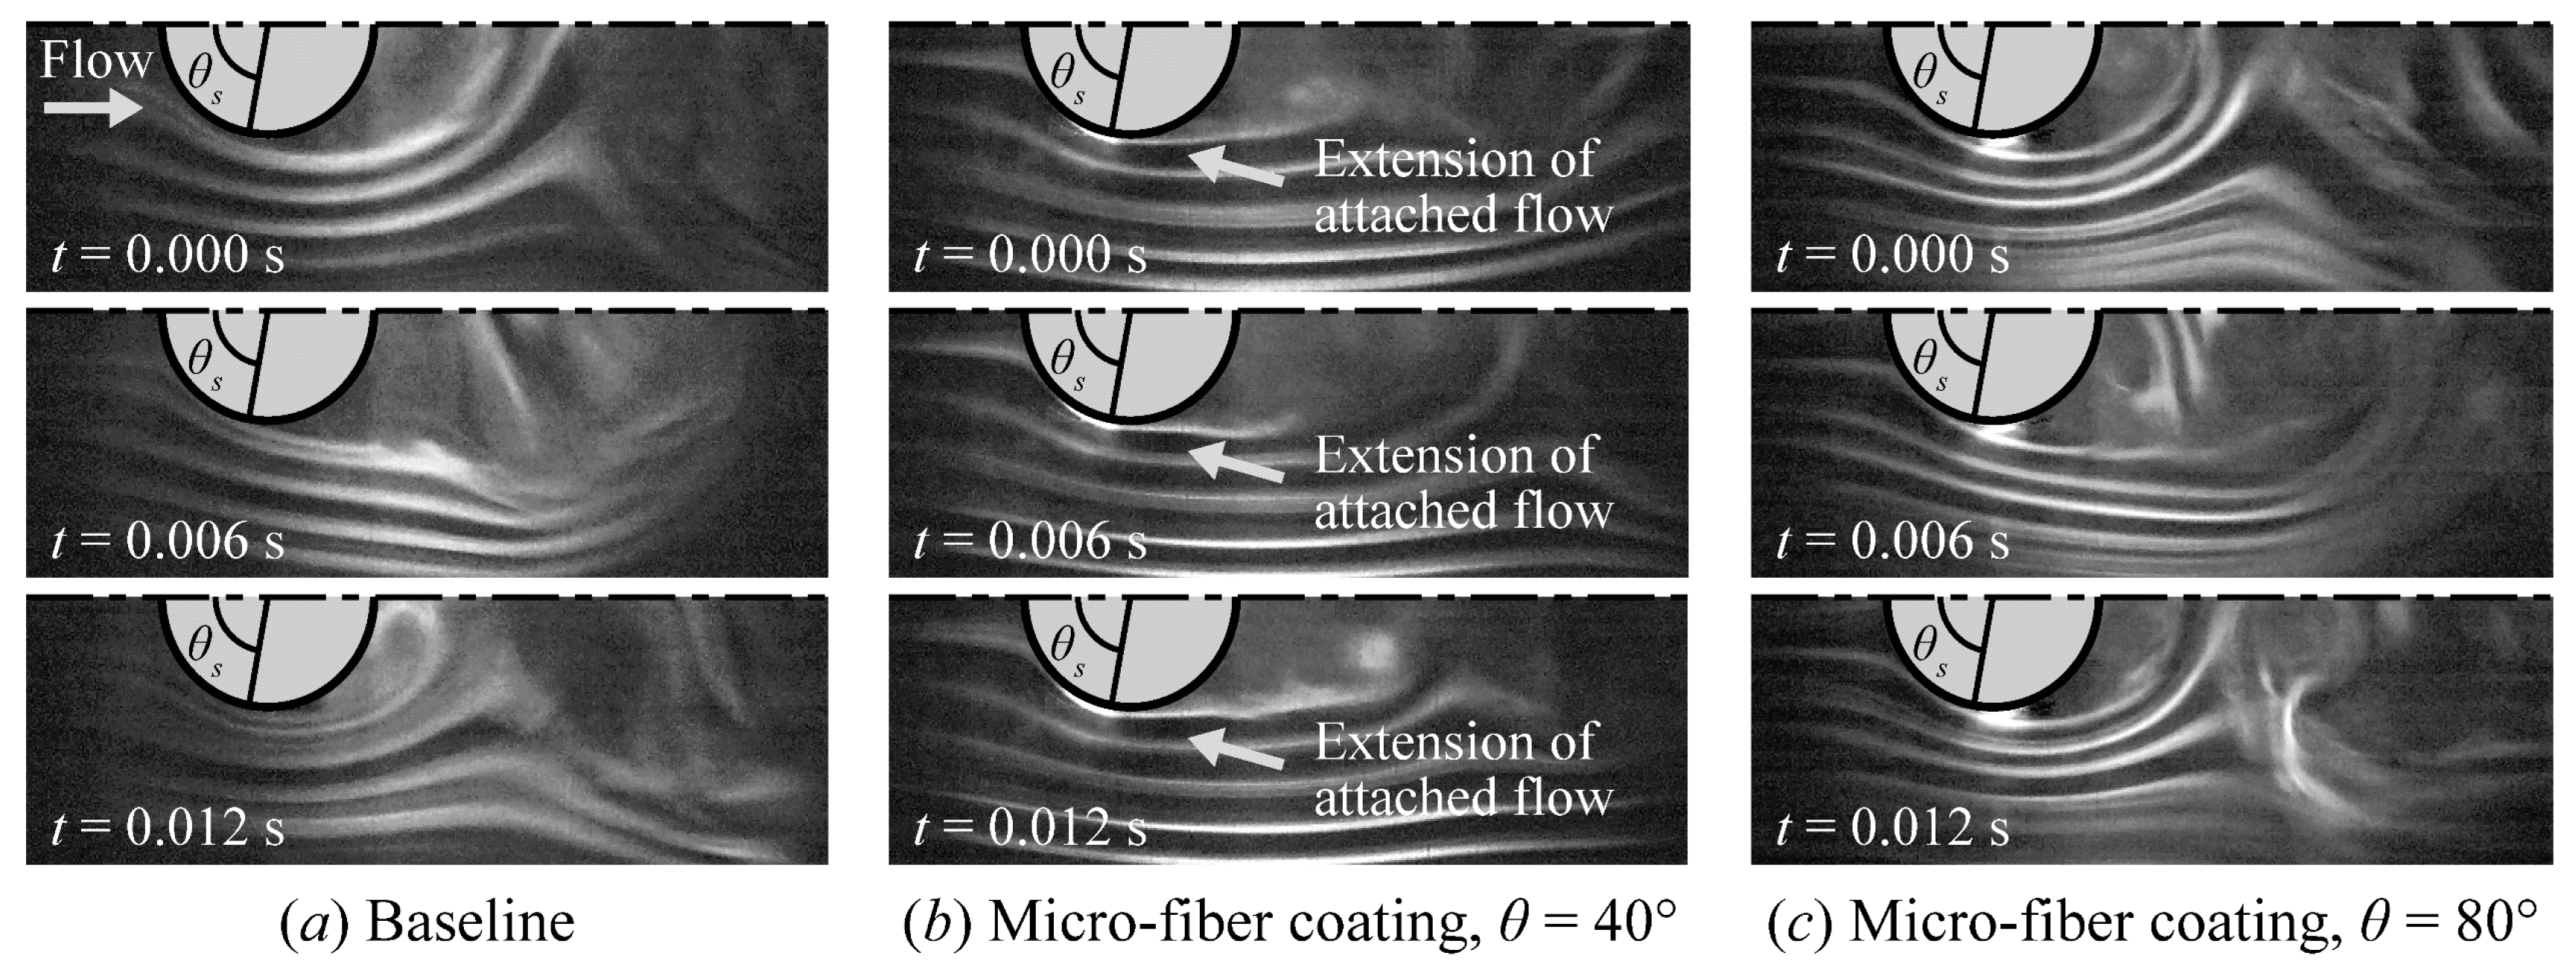
Figure 4 shows the time series of streak lines around the cylinder obtained by the smoke visualization. Figure 4a shows the streak lines over the cylinder without the microfiber coating (baseline). Figure 4b,c shows streak lines over the cylinder with the microfiber coating at θ = 40° and θ = 80°, respectively.
The baseline in Figure 4a shows that a periodical motion of streak lines over the cylinder surface was seen due to the vortex shedding. The flow at θ = 40° was still attached on the cylinder surface, but flow separation occurred at θs ~ 80°. These behaviors agree with the regime of flow around a smooth circular cylinder, which is known as the subcritical flow regime [21]. We could estimate that the baseline had a laminar boundary layer, based on the Reynolds number in the present study.
3.2. Wake Survey
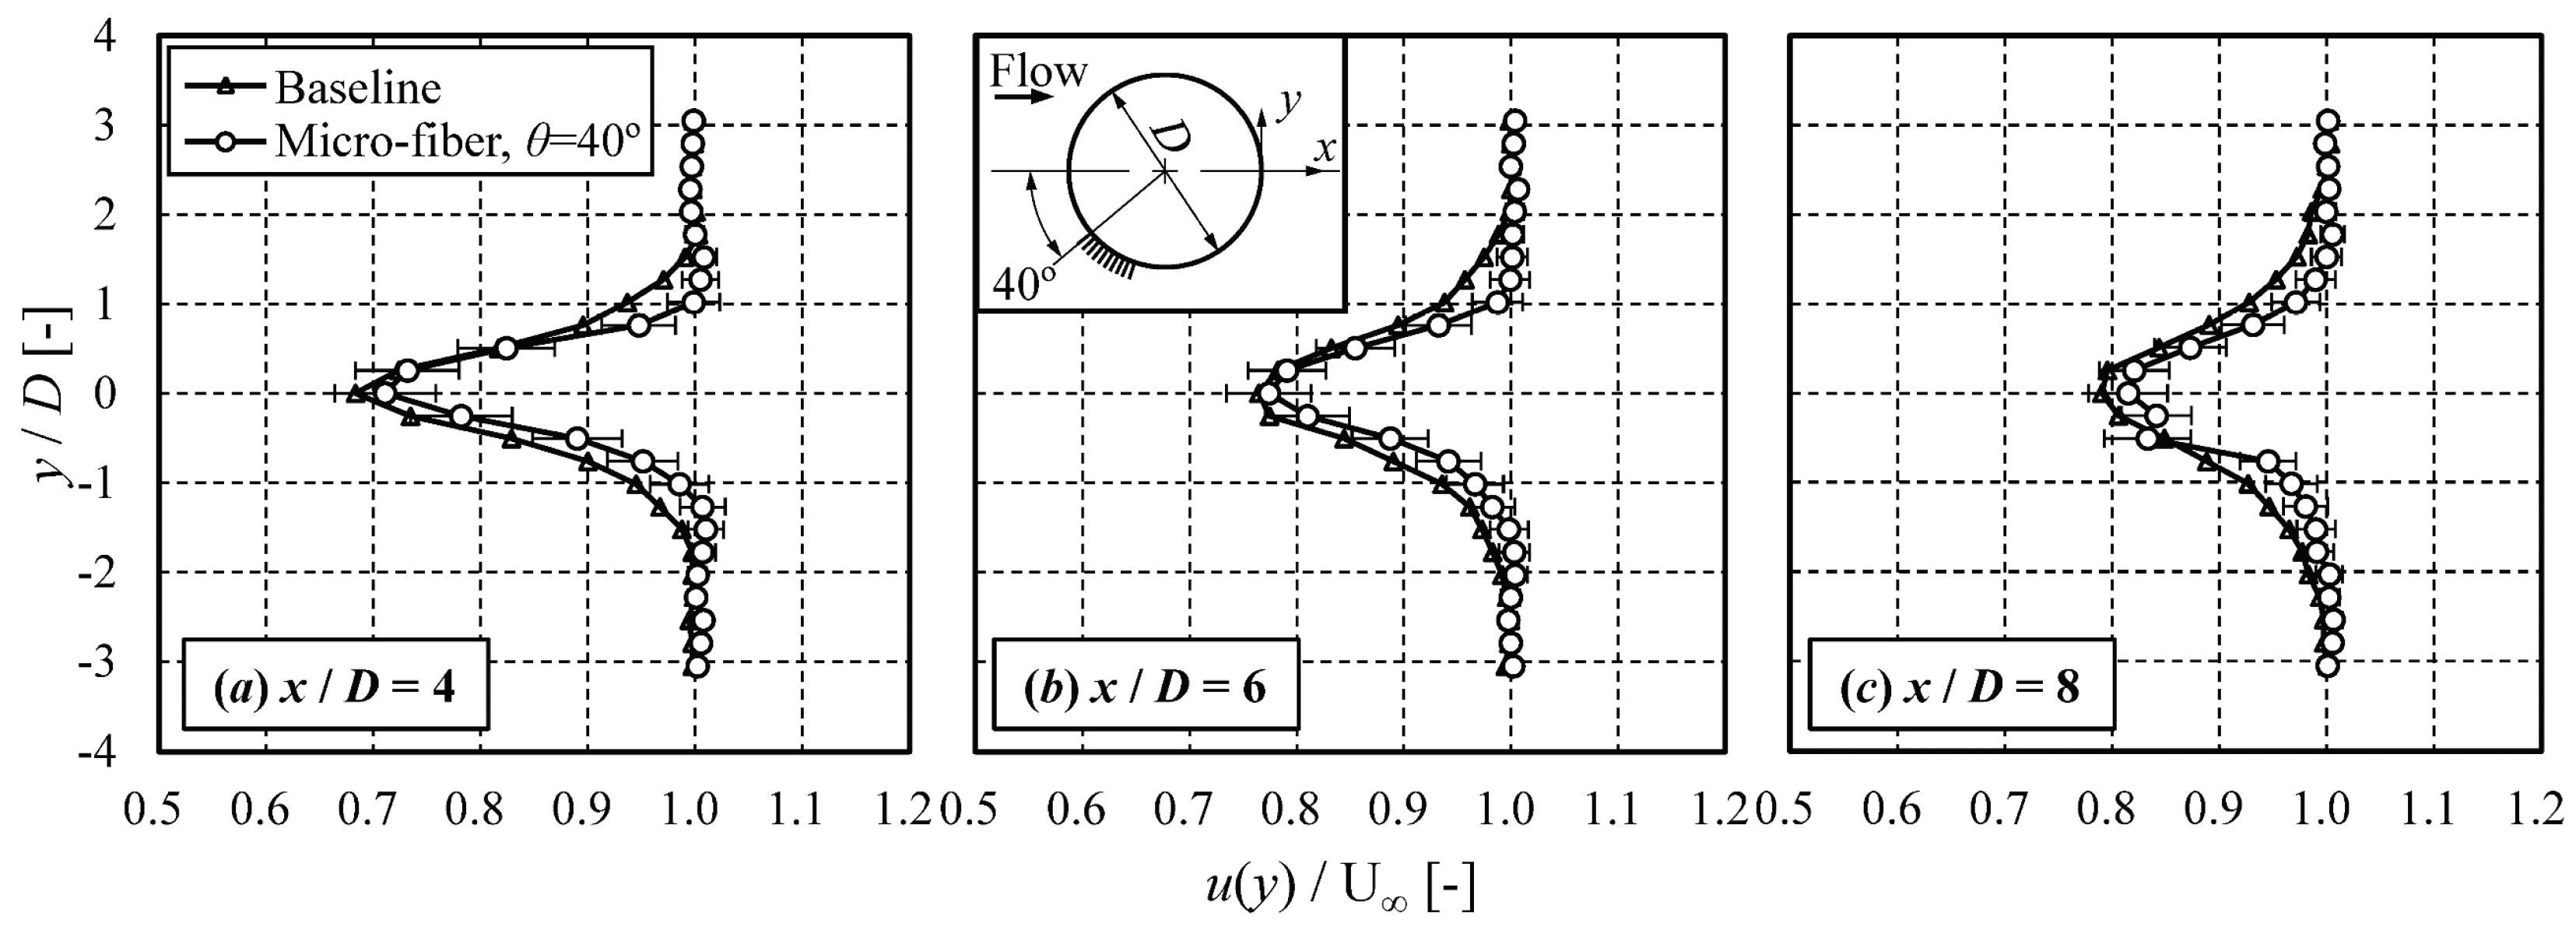
Figure 5 and Figure 6 show a comparison of mean velocity profiles in wake regions from the baseline and from the microfiber coatings at θ = 40° and θ = 80°, respectively. The mean velocity profile, u(y), and vertical position of the wake scan, y, are normalized by the freestream velocity, U∞, and the cylinder diameter, D, respectively. The error bar was estimated based on the standard deviation. The asymmetric velocity profiles came from an asymmetry of the coating location to the horizontal axis. As described in the experimental section, the coating was only applied in the negative y region in the present study.
For the case of the coating at θ = 40°, we can see a major velocity increase where y/D < 0 compared to the baseline. The velocity deficit was less for the coating at θ = 40°, which led to a decreased momentum deficit. We can see that there is a narrowed velocity deficit zone, which corresponds to the narrowed wake zone due to the flow separation delay.
As the location of the pitot probe moved downstream, a symmetricity of the velocity profile to horizontal axis recovered gradually, as shown in Figure 5a–c. It can be considered to result from the effect of mixing in the wake region.
For the microfiber coating at θ = 80°, a velocity decrease was shown in y/D < 0, compared to the baseline in Figure 6a. The change in velocity deficit was shown, but was minor, unlike the results at θ = 40°. This can be considered as a limited interaction between the microfiber coating and the boundary layer around the flow separation region.
As the pitot probe moved downstream, the velocity profile seemed to be symmetrical to the horizontal axis due to the effect of mixing in wake and the development of flow, as shown in Figure 6a–c.
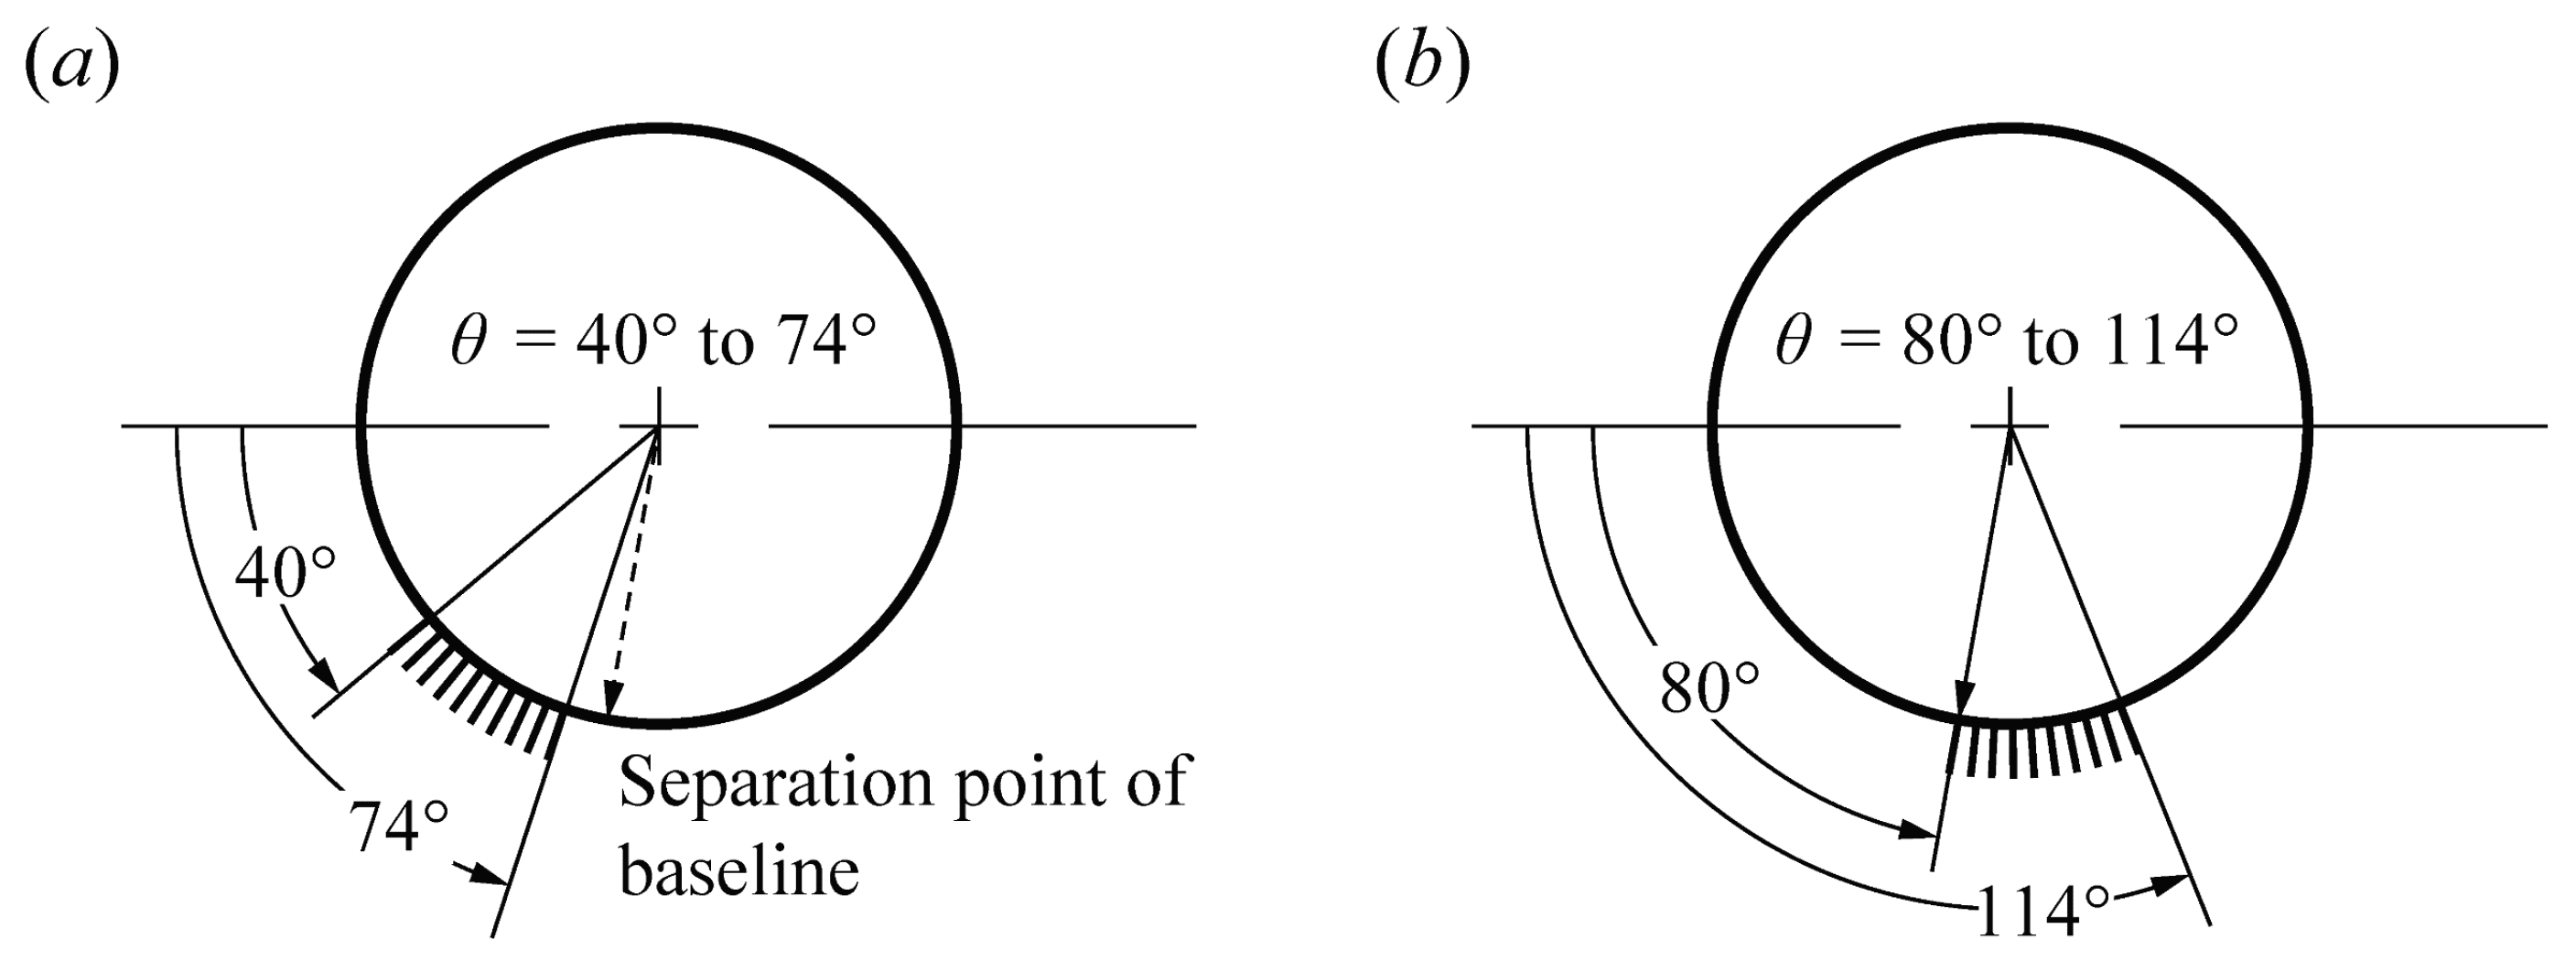
The microfiber coating applied before the flow separation point worked for transition control (Figure 4b), as we expected in our hypothesis. Obviously, the coating location is an important factor for a boundary layer transition. Our microfiber coating at θ = 40° covered the cylinder surface from 40° to 74°, as shown in the Figure 7a. It is possible to cause boundary layer trip by the interaction of coatings with the boundary layer flow before the occurrence of flow separation, but it depends on the coating parameters, such length of the fiber. The presence of microfiber roughness can cause small disturbances in the flow. It may induce the boundary layer transition from a laminar to turbulent flow and can cause corresponding separation delay similar to boundary layer trip devices [6,7].
Microfiber coatings applied after the flow separation did not show a significant enhancement of flow attachment. For the microfiber coating at θ = 80°, coating configuration ranged from 80° to 114°, as shown in Figure 7b. Counteraction of the microfiber coating with the boundary layer flow around the separation region could be limited, since the flow was already separating at θs ~ 80° and the length of the fiber did not provide enough length to adapt the detaching the flow. An increase or decrease in drag can be expected if we apply microfiber coatings with a longer length.
3.3. Drag Estimation
Table 1 shows the normalized drag coefficient, cd-norm, as described in Equation (2). A drag reduction of 32% was obtained when the microfiber coating was located at θ = 40°, while the drag increased when the microfiber coating was located at θ = 80°. We found that the drag reduction by the microfiber coating was dependent on the coating location. Based on the smoke visualization (Section 3.1), the microfiber at θ = 40° caused flow separation delay. It reduced the wake region measured from the wake survey (Section 3.2). The reduction in the wake region reduced the profile drag that leads to the drag reduction. On the other hand, microfiber at θ = 80° increased the wake region and velocity deficit, which increased the profile drag.
The drag results were similar to those of a tripping wire [6]. However, the flow features of the microfiber coating and a tripping wire are different. The former provides a permeable layer inside the microfiber coating and the flow can go inside the layer. On the other hand, the layer is a wire protrusion and the flow is deflected. The drag performance of the tripping wire depends on the height of the wire protrusion. This suggests the drag performance of the microfiber coating could be further expected by changing the microfiber length.
4. Conclusions
A microfiber coating, which provided a hair-like structure, was studied for drag reduction over a bluff body. Microfiber coatings were applied before and after the point of flow separation over a cylinder surface. In the former case, where the microfiber coating was applied at θ = 40°, a drag reduction of 32% was achieved. Smoke visualization showed the extension of the attached flow-zone, and corresponding separation delay was seen by applying the microfiber coating. However, a drag reduction was not shown by the microfiber coating at the flow separation region. Further studies in microfiber length are necessary to reveal the effects on the microfiber coating in the separation region.
Author Contributions
Conceptualization, H.S. and M.H.; Methodology, H.S. and M.H.; Supervision, H.S.; Validation, M.H.; Writing–Original Draft Preparation, M.H.; Writing–Review & Editing, H.S.
Funding
This research was funded by the Operational Energy Capability Improvement Fund (OECIF) from the Office of the Assistant Secretary of Defense for Operational Energy Plans and Programs, ASD (OEPP), and the Air Force Research Laboratory (AFRL) through Ohio Aerospace Institute (OAI) (OAI-ESMCND-1600012).
Conflicts of Interest
The authors declare no conflict of interest.
References
- Thomas, F.O.; Kozlov, A.; Corke, T.C. Plasma actuators for cylinder flow control and noise reduction. AIAA J. 2008, 46, 1921–1931. [Google Scholar] [CrossRef]
- Kozlov, A.V.; Thomas, F.O. Bluff-body flow control via two types of dielectric barrier discharge plasma actuation. AIAA J. 2011, 49, 1919–1931. [Google Scholar] [CrossRef]
- Felder, W.N.; Dale, G.A.; Cash, C.; Chang, M. Prospects for the application of practical drag reduction technologies to legacy transport aircraft. In Proceedings of the 55th AIAA Aerospace Sciences Meeting, Grapevine, TX, USA, 9–13 January 2017. [Google Scholar]
- Achenbach, E. Distribution of local pressure and skin friction around a circular cylinder in cross-flow up to Re = 5 × 10⁶. J. Fluid Mech. 1968, 34, 625–639. [Google Scholar] [CrossRef]
- Fage, A.; Warsap, J.H. The Effects of Turbulence and Surface Roughness on the Drag of a Circular Cylinder; H.M. Stationery Office: Richmond, UK, 1930. [Google Scholar]
- James, D.F.; Truong, Q.-S. Wind load on cylinder with spanwise protrusion. J. Eng. Mech. Div. 1972, 98, 1573–1589. [Google Scholar]
- Nebres, J.; Batill, S. Flow about a circular cylinder with a single large-scale surface perturbation. Exp. Fluids 1993, 15, 369–379. [Google Scholar] [CrossRef]
- Bearman, P.W.; Harvey, J.K. Control of circular cylinder flow by the use of dimples. AIAA J. 1993, 31, 1753–1756. [Google Scholar] [CrossRef]
- Choi, J.; Jeon, W.-P.; Choi, H. Mechanism of drag reduction by dimples on a sphere. Phys. Fluids 2006, 18, 041702. [Google Scholar] [CrossRef]
- Lin, J.C.; Robinson, S.K.; McGhee, R.J.; Valarezo, W.O. Separation control on high-lift airfoils via micro-vortex generators. J. Aircr. 1994, 31, 1317–1323. [Google Scholar] [CrossRef]
- Lin, J.C. Review of research on low-profile vortex generators to control boundary-layer separation. Prog. Aerosp. Sci. 2002, 38, 389–420. [Google Scholar] [CrossRef]
- Bruneau, C.-H.; Mortazavi, I. Control of vortex shedding around a pipe section using a porous sheath. Int. J. Offshore Polar Eng. 2006, 16, 90–96. [Google Scholar]
- Bhattacharyya, S.; Singh, A.K. Reduction in drag and vortex shedding frequency through porous sheath around a circular cylinder. Int. J. Numer. Methods Fluids 2011, 65, 683–698. [Google Scholar] [CrossRef]
- Klausmann, K.; Ruck, B. Drag reduction of circular cylinders by porous coating on the leeward side. J. Fluid Mech. 2017, 813, 382–411. [Google Scholar] [CrossRef]
- Walsh, M.J. Riblets as a viscous drag reduction technique. AIAA J. 1983, 21, 485–486. [Google Scholar] [CrossRef]
- Bechert, D.; Reif, W. On the drag reduction of the shark skin. In Proceedings of the 23rd Aerospace Sciences Meeting, Reno, NV, USA, 14–17 January 1985. [Google Scholar]
- Lee, S.-J.; Lim, H.-C.; Han, M.; Lee, S.S. Flow control of circular cylinder with a V-grooved micro-riblet film. Fluid Dyn. Res. 2005, 37, 246–266. [Google Scholar] [CrossRef]
- Itoh, M.; Tamano, S.; Iguchi, R.; Yokota, K.; Akino, N.; Hino, R.; Kubo, S. Turbulent drag reduction by the seal fur surface. Phys. Fluids 2006, 18, 065102. [Google Scholar] [CrossRef]
- Favier, J.; Dauptain, A.; Basso, D.; Bottaro, A. Passive separation control using a self-adaptive hairy coating. J. Fluid Mech. 2009, 627, 451–483. [Google Scholar] [CrossRef]
- Brücker, C. Interaction of flexible surface hairs with near-wall turbulence. J. Phys. Condens. Matter 2011, 23, 184120. [Google Scholar] [CrossRef] [PubMed]
- Sumer, B.M.; Fredsøe, J. Hydrodynamics around Cylindrical Structures; World Scientific: Singapore, 2006. [Google Scholar]
- Achenbach, E. Influence of surface roughness on the cross-flow around a circular cylinder. J. Fluid Mech. 1971, 46, 321–335. [Google Scholar] [CrossRef]
- Bolgen, S.W. Flocking technology. J. Coat. Fabr. 1991, 21, 123–131. [Google Scholar] [CrossRef]
- Woodruff, F.A. Developments in coating and electrostatic flocking. In Proceedings of the Second International Conference on Textile Coating and Laminating, Zurich, Switzerland, 9–10 November 1992. [Google Scholar]
- Barlow, J.B.; Rae, W.H.; Pope, A.; Pope, A. Low-Speed Wind Tunnel Testing, 3rd ed.; John Wiley & Sons, Inc.: Hoboken, NJ, USA, 1999. [Google Scholar]
Figure 1.
A schematic description of flow control of bluff body by hair-like surface: (a) Transition delay; (b) Flow attachment.
Figure 1.
A schematic description of flow control of bluff body by hair-like surface: (a) Transition delay; (b) Flow attachment.

Figure 2.
A schematic of a microfiber coating over the cylinder model: (a) Coating configuration on the cylinder model; (b) A microscope image of fabricated microfiber coating seen from top.
Figure 2.
A schematic of a microfiber coating over the cylinder model: (a) Coating configuration on the cylinder model; (b) A microscope image of fabricated microfiber coating seen from top.

Figure 3.
A schematic of the wake survey setup in the test section.

Figure 4.
Time series of the flow filed around the cylinder by smoke flow visualization. Comparison of wake flow for (a) baseline and (b) micro-fiber coating at θ = 40°, and (c) micro-fiber coating at θ = 80°.
Figure 4.
Time series of the flow filed around the cylinder by smoke flow visualization. Comparison of wake flow for (a) baseline and (b) micro-fiber coating at θ = 40°, and (c) micro-fiber coating at θ = 80°.

Figure 5.
Comparison of mean velocity profiles in wake for baseline and microfiber at θ = 40°: (a) x/D = 4; (b) x/D = 6; (c) x/D = 8.
Figure 5.
Comparison of mean velocity profiles in wake for baseline and microfiber at θ = 40°: (a) x/D = 4; (b) x/D = 6; (c) x/D = 8.

Figure 6.
Comparison of mean velocity profiles in wake for baseline and microfiber at θ = 80°: (a) x/D = 4; (b) x/D = 6; (c) x/D = 8.
Figure 6.
Comparison of mean velocity profiles in wake for baseline and microfiber at θ = 80°: (a) x/D = 4; (b) x/D = 6; (c) x/D = 8.

Figure 7.
Schematic of the coating position and configuration: (a) Microfiber coating at θ = 40°, coating position is θ = 40°–74°; (b) Microfiber coating at θ = 80°, coating position is θ = 80°–114°.
Figure 7.
Schematic of the coating position and configuration: (a) Microfiber coating at θ = 40°, coating position is θ = 40°–74°; (b) Microfiber coating at θ = 80°, coating position is θ = 80°–114°.

Table 1.
Normalized drag coefficients, cd-norm, at the downstream location.
| Surface | Measurement Location | ||
|---|---|---|---|
| x/D = 4 | x/D = 6 | x/D = 8 | |
| No-coating (baseline) | 1.00 | 1.00 | 1.00 |
| Micro-fiber Coating, θ = 40° | 0.68 | 0.68 | 0.67 |
| Micro-fiber Coating, θ = 80° | 1.11 | 1.13 | 1.13 |
© 2018 by the authors. Licensee MDPI, Basel, Switzerland. This article is an open access article distributed under the terms and conditions of the Creative Commons Attribution (CC BY) license (http://creativecommons.org/licenses/by/4.0/).
Share and Cite
MDPI and ACS Style
Hasegawa, M.; Sakaue, H. Microfiber Coating for Drag Reduction by Flocking Technology. Coatings 2018, 8, 464. https://doi.org/10.3390/coatings8120464
AMA Style
Hasegawa M, Sakaue H. Microfiber Coating for Drag Reduction by Flocking Technology. Coatings. 2018; 8(12):464. https://doi.org/10.3390/coatings8120464
Chicago/Turabian StyleHasegawa, Mitsugu, and Hirotaka Sakaue. 2018. "Microfiber Coating for Drag Reduction by Flocking Technology" Coatings 8, no. 12: 464. https://doi.org/10.3390/coatings8120464
Note that from the first issue of 2016, this journal uses article numbers instead of page numbers. See further details here.