TEM Microstructural Evolution and Formation Mechanism of Reaction Layer for 22MnB5 Steel Hot-Dipped in Al–10% Si

1
Pos Ceramics, Pusan 48059, Korea
2
Department of Materials Science and Engineering, Pusan National University (PNU), Busan 46241, Korea
*
Author to whom correspondence should be addressed.
Coatings 2018, 8(12), 467; https://doi.org/10.3390/coatings8120467
Submission received: 5 November 2018
/
Revised: 13 December 2018
/
Accepted: 13 December 2018
/
Published: 15 December 2018
Abstract
:Microstructural evolution and formation mechanism of reaction layer for 22MnB5 steel hot-dipped in Al–10Si (in wt %) alloy was investigated. The microstructural identification of the reaction layer was characterized via transmission electron microscopy and electron backscatter diffraction. In addition, the formation mechanisms of the phases were discussed with vertical section (isopleth) of the (Al–Si–Fe) ternary system. The solidified Al–Si coating layer consisted of three phases of Al, Si, and τ5 (Al8Fe2Si). The reaction layer on the Al–Si coating layer side is a fine τ5 phase (Al8Fe2Si) of 5 μm thickness. The layer on the steel side consisted of an η phase (Fe2Al5) of thickness of 500 nm or less. τ1 (Al2Fe3Si3, triclinic) phase of 200-nm-thickness was formed in the η phase, and κ phase (Fe3AlC) of 40–50 nm thickness was formed between η phase and steel. The τ5 phase was formed by isothermal solidification at 690 °C in the liquid Al–10 wt % Si when 3.73–29.0 wt % of Fe was dissolved from the boron steel into the Al–Si liquid bath. It was considered that the η phase was formed by the diffusion reaction of Al, Si, and Fe between τ5 and ferrite steel. κ (Fe3AlC) phase was formed by the reaction of the carbon, which is barely employed in η and τ phases, and diffused Al.
1. Introduction
Aluminized steels have a higher oxidation resistance than that of Zn-coated steels, and hot-dip aluminizing processes for coating steels with Al and Al alloys are widely used [1,2,3,4]. Particularly, Al–10 wt % Si coating is a type of well-known coating for preventing the oxidation of steel in the hot stamping process [5,6,7,8,9]. The coated layer of the Al–Si hot-dipped steel is composed of a solidified layer formed on the steel and a reactive layer. The solidified Al–Si coating layer mainly consists of Al, Si, and τ5 (Al7Fe2Si) [10], which is a ternary phase in the Al–Si–Fe ternary phase.
In the study of the reaction layer of a low-carbon steel and boron steel that is hot-dip coated with Al–Si, the types of phases formed from the liquid side on the steel side are reported to be different. Specifically, they are: (1) three phases consisting of the τ5 phase (Al7Fe2Si), θ phase (FeAl3), and η phase (Fe2Al5) [11]; (2) three phases consisting of the τ5 phase (Al7Fe2Si), η phase (Fe2Al5), and τ1 phase (Al2Fe3Si3 or Fe3(AlSi)5) [12,13]; and (3) four phases consisting of the τ5 phase (Al8Fe2Si), θ phase (Fe4Al13), η phase (Fe2Al5), and τ1 phase (Fe3Al2Si) [14,15]. The composition of the τ5 phase is represented by Al7Fe2Si, Al7.4Fe2Si, and Al8Fe2Si, but all have a hexagonal crystal structure (space group: P63/mmc(194)). In addition, the composition of the θ phase can be represented by Fe4Al13 or FeAl3, but both are monoclinic (space group: C12/m1(12)) with the same crystal structure. The thicknesses of the τ5 and η phases are 2.5–6.8 μm and 0.3–3.0 μm, respectively, and particularly, the thickness of the τ1 phase is 300 nm or less. In most studies [11,12,13,15], the phase analysis of the reaction layer was conducted based on the correlation between the compositions obtained using a scanning electron microscope (SEM), an energy dispersive spectrometer (EDS), an analysis of the X-ray diffraction (XRD), and an electron backscatter diffraction (EBSD). However, the thicknesses of the above phases are extremely small that the results of the analysis with these devices are expected to have reliability problems.
Generally, it is known that when steel is hot-dipped in Al–10 wt % Si alloy, not only melting point and viscosity of Al–Si coating decreased but also the growth of the η phase is suppressed. Thus, the thickness of the brittle intermetallic compound can be effectively minimized [16,17,18,19]. Moreover, the effect of Si on the growth mechanism of the η phase has been studied extensively. It has been found: (1) a diffusion delay of Al was due to the Si addition to the internal vacancy in the η phase [17,18,20]) a diffusion delay of Al was caused by the concentration of Si in the θ phase and η phase grain boundaries [21]; (2) the activity coefficient of the Si was affected, or there was a reduction in the activation energy for the η phase formation [14,21]; (3) there was a decrease in the activation coefficient of Al [22,23]; and (4) the formation of a ternary chemical compound acted as a diffusion barrier [23]. So far, there have been many studies on the effect of Si and growth suppression mechanism for reducing the thickness of the η phase in the Al–Si hot-dip coating process of carbon steel, but some scientific issues remain. First, when adding 5 wt % or more of Si in the Al–Si hot-dip coating, the reaction layer of the coating layer has an η phase of thickness 2 μm or less and a τ1 phase of grain size 1 μm or less. Therefore, the constitution, distribution, and characteristics of the phases in the reaction layer analyzed via XRD, EDS, and EBSD is insufficient to characterize the fine microstructure. Therefore, studies using a transmission electron microscope (TEM) are needed, but such studies have been little reported, which studied that an 800-nm band consisting of a β phase (FeAl) and κ phase was formed between the steel and η phase via inter-diffusion between a low-carbon steel and pure Al at 600 °C [15]. Thus, it is necessary to observe and analyze the grain size, shape, and lattice defects in the reaction layer using a focused ion beam (FIB) milling technique to collect the thin section. Second, although there are eleven ternary phases of Al–Si–Fe [24], the mechanisms for determining the formation of the τ5 phase in the solidified Al–Si coating layer and of the τ1 phase in the η phase are not explained. Finally, there is no report on the formation of carbon-related phases, particularly if there is some pearlite present, such as boron steel (0.22 wt % C).
The hot-dipping temperature and time were set as 690 °C and 120 s, respectively, considering that the hot-dipping time is several tens of seconds in the actual hot-dip coating process, A1 temperature of boron steel is 703 °C, and melting point of Al–10 wt % Si is 597 °C.
In this study, to characterize the constitution, size, and distribution (formation position) of the phases in the reaction layer of the Al–10 wt % Si hot-dipped steel, the reaction layer was deflected by an FIB and analyzed using TEM/EDS. The macroscopic microstructure was analyzed via EBSD. In addition, the vertical section (isopleth) of the (Al–Si–Fe) ternary system was prepared by Thermo-CalcTM to investigate the formation mechanism of the reaction phase.
2. Materials and Methods
In this study, the base substrate was a 1.2-mm-thick boron steel 22MnB5, and its chemical composition is 0.21C–0.15Si–1.10Mn—0.10Cr–0.0015B in weight percent. The molten bath was prepared by mixing a high-purity 99.9 wt % Al ingot and Al–15 wt % Si ingot. The molten alloy was heated at a high frequency electrical induction furnace in a crucible maintained at a hot-dipping temperature of 690 °C.
The steel was cut into 40 × 120 mm2 size and immersed in 40 mL H2SO4 + 200 mL CH3OH solution for 300 s to clean the surface, and then washed with ethyl alcohol. The substrate was pre-heated at 150 °C for 20 s to remove moisture from the surface and subsequently hot-dipped in Al–10 wt % Si molten bath at 690 °C for 120 s and then cooled in air.
In order to distinguish the microstructure of the hot-dipped steel, the specimens were etched using 100 mL distilled water + 1 g NaOH solution and 50 mL CH3OH + 2 mL HNO3. The cross-sectional microstructure was observed using an optical microscope (BX51M, Olympus, Tokyo, Japan)) and a field-emission SEM (SUPRA 45, Carl Zeiss, Oberkochen, Germany). In addition, an EDS (EDAX, Mahwah, NJ, USA) and a field-emission electron probe micro-analyzer (FE-EPMA, JXA-8530F, JEOL, Tokyo, Japan) were used for analyzing the composition of the coated layer. In the case of FE-EPMA, the surface analysis was performed under the condition of 10 kV voltage, 100 nA current, and step sizes of 0.1–0.5 mm in the no etching state.
For the phase analysis of the reaction layer, the TEM specimens were deflected using an FIB (Scios focused ion beam, FEI, Hillsboro, OR, USA) and the diffraction pattern and chemical composition were analyzed using a field-emission TEM (F200X, TALOS, Hillsboro, OR, USA). EBSD (Hikari electron backscatter diffraction, EDAX, Mahwah, NJ, USA) was used for the phase distribution and crystal orientation analyses, and the thickness and length of the reaction layer were measured using the Image-Plus Pro image analysis program (Media Cybernetics Inc., Rockville, MA, USA). Moreover, commercial thermodynamic calculation software package (Thermo-Calc, version 6.0) on the basis of the Al database TCAL6 was used to calculate the vertical section (isopleth) of the (Al–Si–Fe) ternary system kept constant at 10 wt % Si and examine the formation mechanism of each phase.
3. Results and Discussion
3.1. Microstructure of the Solidified Al–Si Coating Layer
Figure 1 shows cross-sectional optical micrographs of hot-dipped steel and enlarged SEM images for Areas A and B in Figure 1a. Solidified Al–10 wt % Si coating layer existed above the surface of the 22MnB5 steel substrate as base metal. Reaction layer is continuously formed between both of them. It is considered that the aluminized coated steel, which has no defects such as pore and discontinuous layer, could have an improved Fe-oxidation resistance after hot-stamping forming process at high temperature [3,25].
Figure 2 shows the results of the EDS analysis of Areas A and B in Figure 1, and Table 1 presents the results of the EDS point analysis of Phases 1–5 in Figure 1b,c. From the results of these analyses, it can be determined that the dark and needle-like phases (2 and 5) in Figure 2b,c are of Si because only Si is detected. In contrast, the bright phases (1, 3, and 4) are composed of Fe-containing Al–Si–Fe, which in terms of the composition, is expected to be the τ5 phase (Al8Fe2Si).
The formation of a three-composition phase containing Fe in the solidified Al–Si coating layer implies that Fe is dissolved in the liquid phase. The (Al–10 wt % Si)–xFe pseudo-binary phase diagram is used to investigate the formation of the solidified Al–Si coating layer during the phase transformation of the liquid phase.
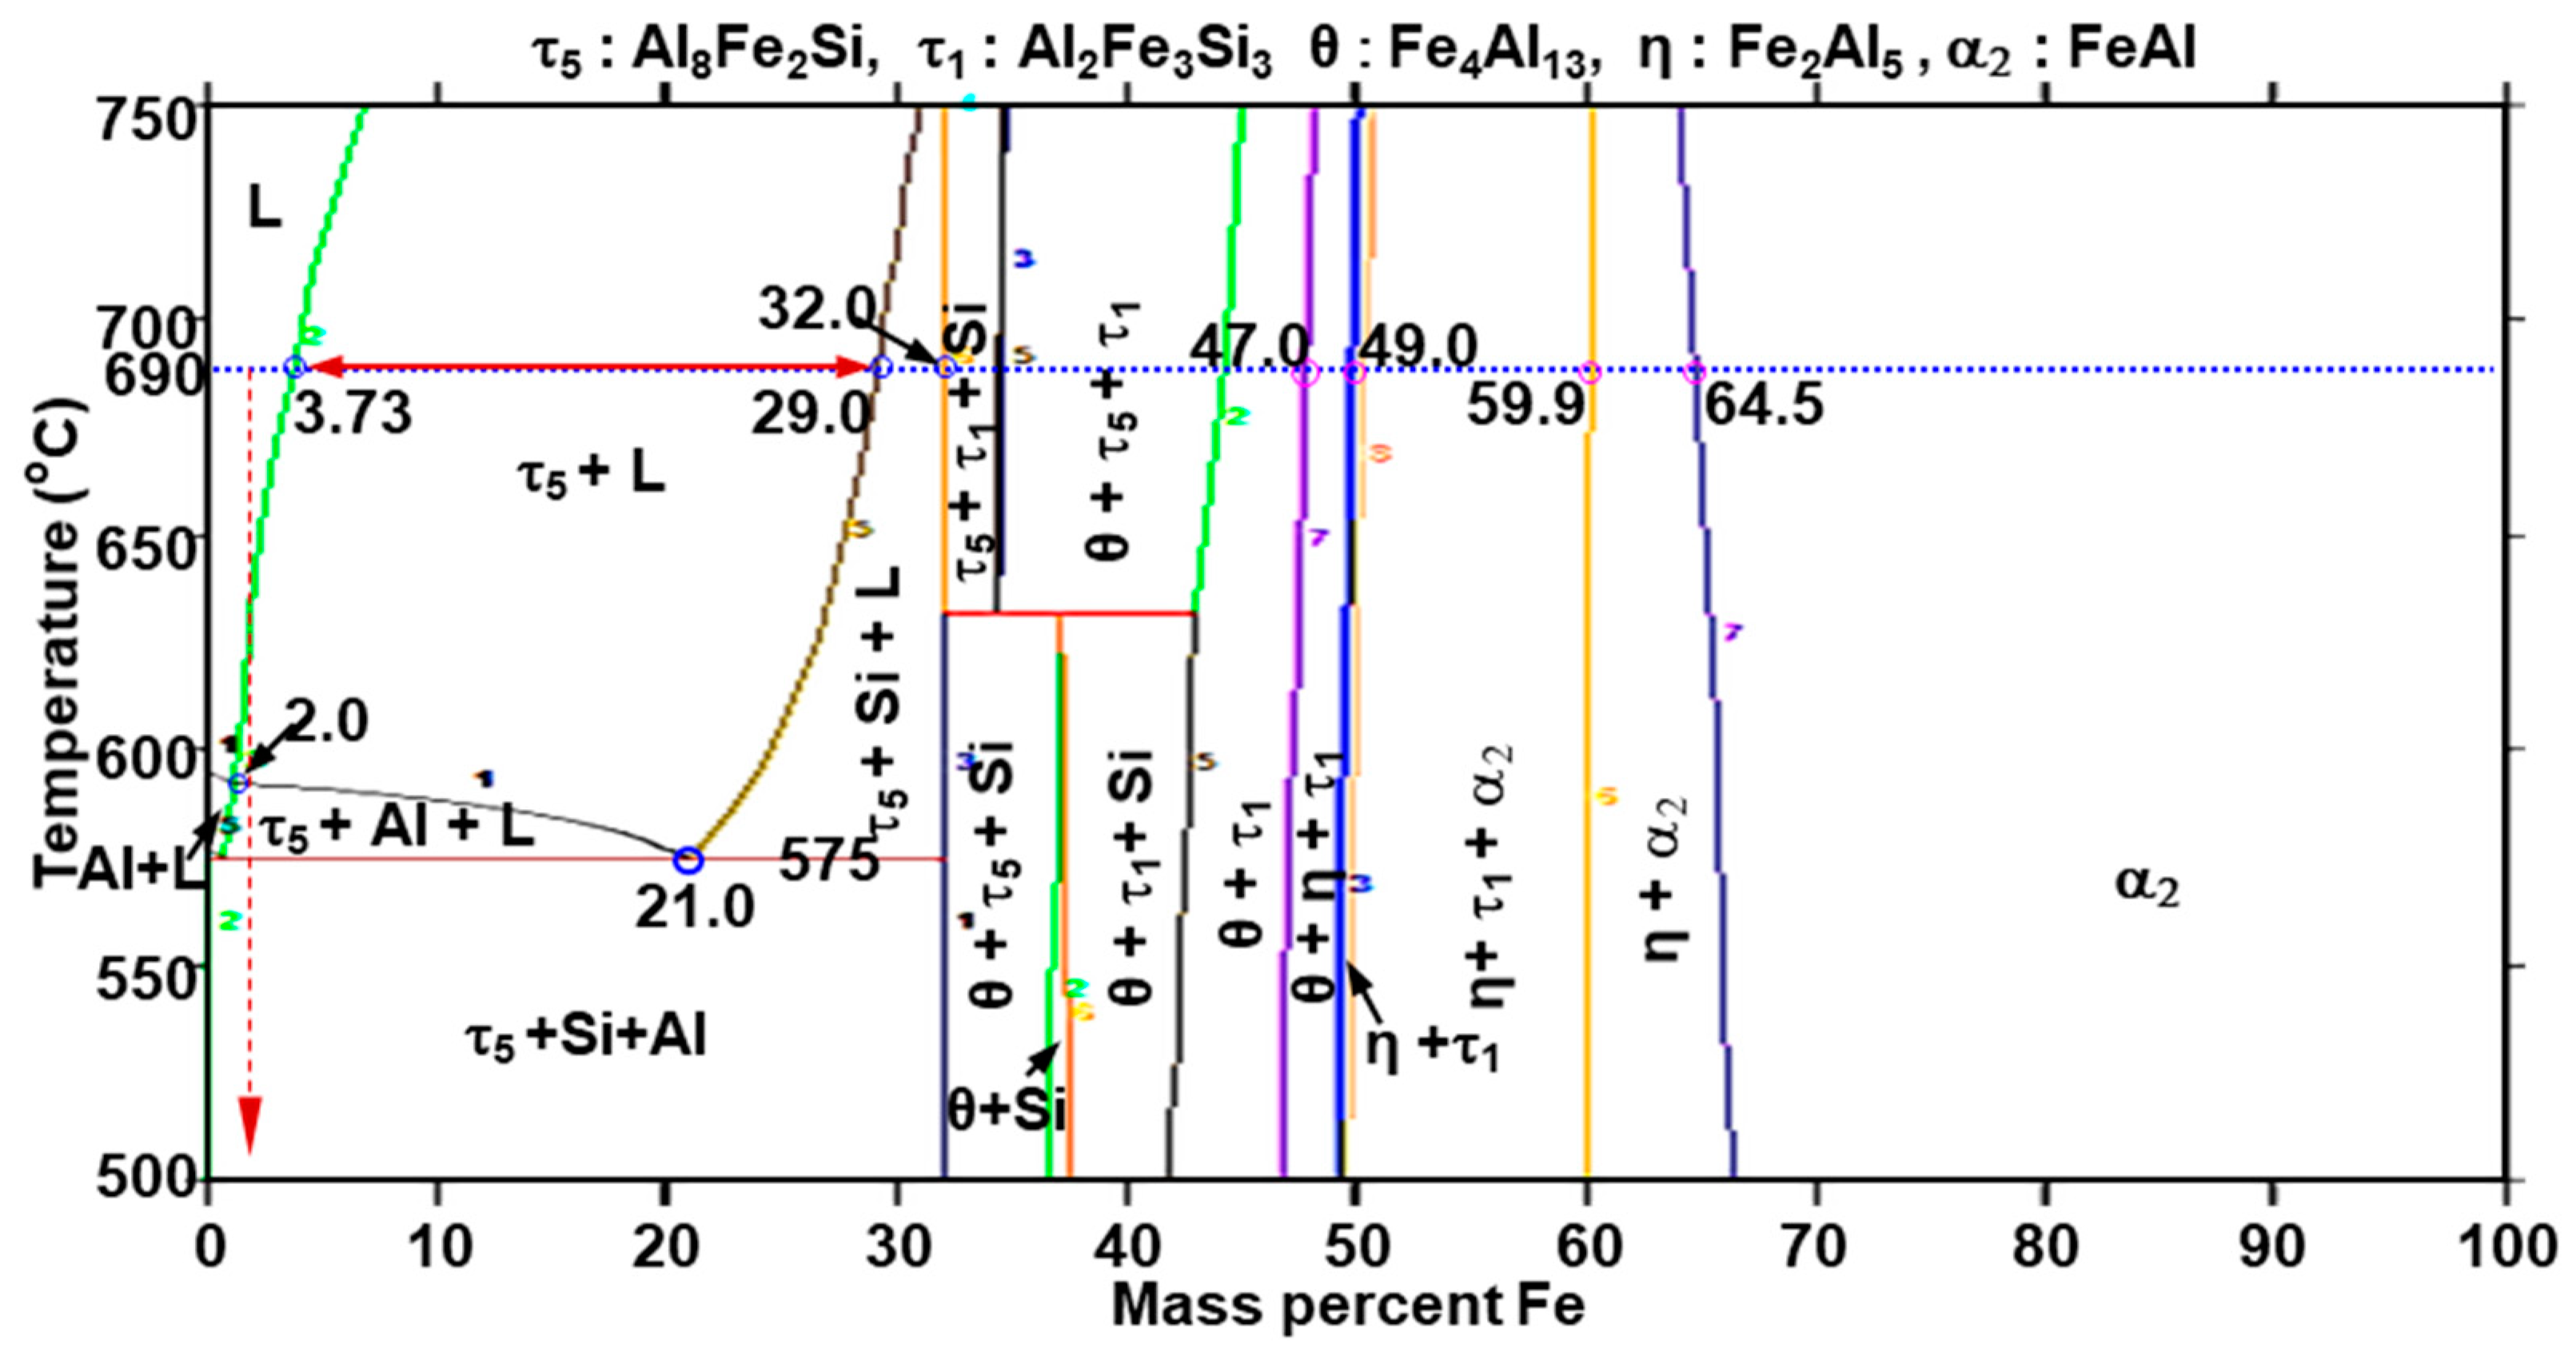
Figure 3 exhibits vertical section (isopleth) of the (Al–Si–Fe) ternary system, calculated with Thermo-Calc Al database version 6.0 (TCAL6). The silicon (Si) is kept constant at 10 wt %. The phase diagram on the right side is an enlarged rectangular area in the left phase diagram. At 690 °C, when the liquid phase having an Fe concentration of 3.73% or less is cooled, the phase transformation process differs based on the concentration; however, the final three phases (Al, Si, τ5) are the same:
- Fe concentration less than 0.6 wt %: L → Al + L → Al + Si + L → Al + Si + τ5;
- Fe concentration 0.6–1.2 wt %: L → Al + L → τ5 + Al + L → Al + Si + τ5;
- Fe concentration 1.2–3.73 wt %: L → τ5 + L → τ5 + Al + L → Al + Si + τ5.
In Figure 1, there is no primary τ5 phase, and the amount of the τ5 phase in the dendrite (grain) boundary is extremely small. Therefore, the solidified Al–Si coating layer is believed to be formed by the phase transformation of in case of 1.
3.2. Microstructure of the Reaction Layer and Phases
Figure 4a shows the SEM microstructure of the reaction layer region indicated by C in Figure 1a, and Figure 4b–e exhibits the results of area analysis of the concentration distribution of the reaction layer obtained by FE-EPMA. In Figure 4a, the reaction layer is divided into two layers (marked as #1 and #2). It is noted that Al and Si is high in the #1 layer, and the Fe is low that in the #2 layer.
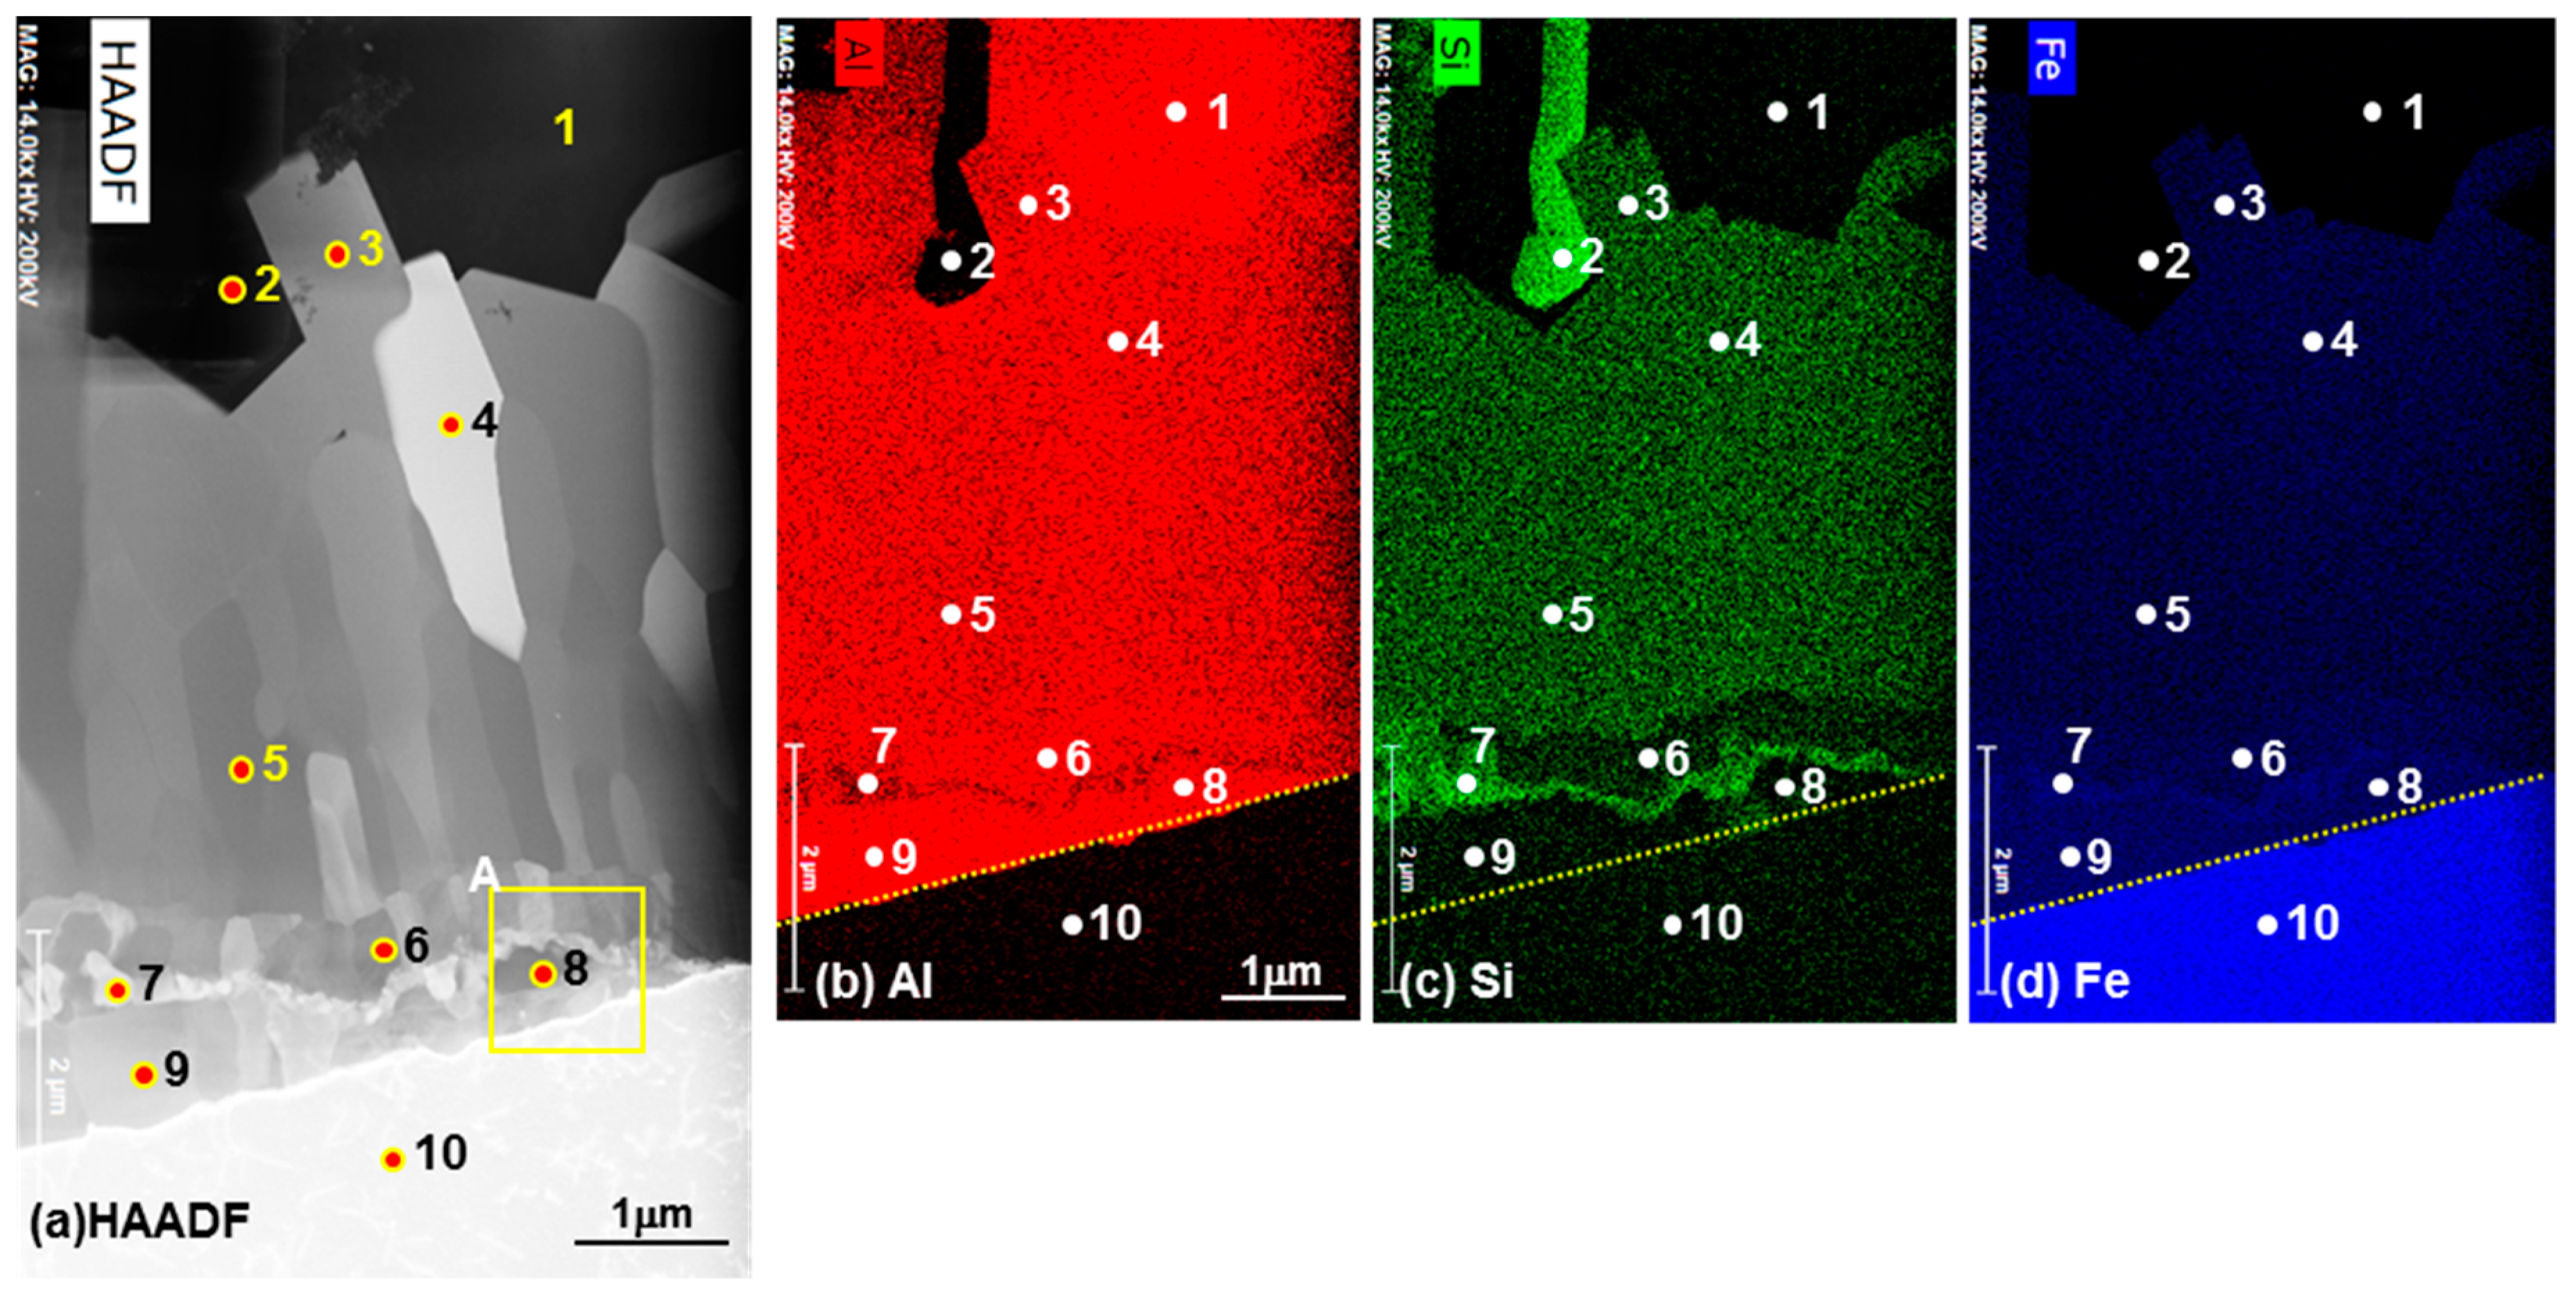
To investigate the reaction layer in detail, TEM specimens were collected by an FIB in the area marked by a yellow rectangle in Figure 4a and observed by STEM. Figure 5a presents the TEM (high-angle annular dark-field (HAADF)) structure, and Figure 5b–d show the results of the EDS area analysis. From the EDS analysis results, the diffraction pattern was analyzed by selecting the areas indicated by 1–10 from the difference in the concentration of Al, Si, and Fe. Table 2 lists the results of the EDS point analysis of each area. Figure 6 depicts the diffraction pattern of each region and the results of the analysis of these diffraction patterns. From these analysis results, it can be confirmed that Regions 1 and 2 are Al (FCC) and Si (FCC) in the coated layer and Region 10 is α-Ferrite (BCC) in the steel structure. Regions 3, 4, and 5, which show a shape grown long toward the solidified Al–Si coating layer side, are found to be the τ5 phase (Al8Fe2Si, Hexagonal). At the bottom of the τ5 phase, Regions 6, 8, and 9 with a lower Si concentration are found to be the η phase (Fe2Al5, Orthorhombic). Inside the η phase, Regions 7 and 8 with a high Si concentration are the τ1 phase (Al2Fe3Si3, Triclinic).
Figure 7 shows a TEM bright field image of Area A in Figure 5a using focused ion beam (FIB) technique. The τ5 grains have a shape grown long toward the solidified Al–Si coating layer side, and the τ5 grains on the solidified Al–Si coating layer side are larger than on the η phase side. Figure 7b is an enlarged image of the X region in Figure 7a, and Figure 7c is an enlarged bright field image of the X1 region in Figure 7b. The thicknesses of the upper η layer, τ1 layer, and lower η layer are approximately 500, 200, and 400 nm, respectively. Figure 7d is an enlarged image of the X2 region in Figure 7b. Figure 7e shows the microstructure at the η phase/ferrite (steel) interface, and it shows that a dislocation is formed in ferrite.
Figure 8 shows the result of the EDS area analysis to confirm the shape of the τ1 phase in the τ1 layer. It can be seen that the τ1 phases in the particle shape are arranged to form a layer. From the above TEM structure, it is confirmed that the reaction layer is formed in the following order from the solidification Al–Si coating/τ5 phase (Al8Fe2Si) layer (thickness = 4–6 μm)/upper η phase (Fe2Al5) layer (thickness = 500 nm)/τ1 phase (Al2Fe3Si3) layer (thickness = 200 nm)/lower η phase (Fe2Al5) layer (thickness = 400 nm)/κ phase (Fe3AlC) layer (thickness = 40–50 nm).
Figure 9 presents the result of analyzing the reaction layer in Figure 4 by EBSD, where (a) is the phase-map and (b) is the inverse pole figure (IPF). Although confidence index (CI) clean-up for high quality indexing and right orientation enforcement for the phases were used in the EBSD analyses (Figure 9b), the quality of the indexing for the phases, especially for τ5, is not sufficient, which would be related to the fine grains in the phases. The phase-map (Figure 9a) with color-code for the reaction layer was represented for the existence of distinctive different phases that could not be obviously determined by automated EBSD. The reaction layer is analyzed to be composed of two layers: τ5 phase and η phase. Because the EBSD is observed at a lower magnification than the TEM result, the very fine τ1 phase and κ phase observed in the TEM images are not detected and are simply classified as the η layer. This suggests that the EBSD analysis cannot accurately identify the phase distribution when the reaction layer thickness is as thin as 1 μm or less.
3.3. Formation Mechanism of the Reaction Layer and Phases
Figure 10 is a schematic showing the shapes of the reaction layer and reaction phase based on the EBSD and TEM analysis of the coated layer. The solidified Al–Si coating layer consists of three phases: Al, Si, and τ5 (Al8Fe2Si, ternary phase). The reaction layer consists of the τ5 phase (Al8Fe2Si) of thickness of approximately 4–6 μm, η phase (Fe2Al5) of approximately 1-μm thickness, and κ phase (Fe3AlC) of 40–50-nm thickness.
Table 3 presents the composition of the phases formed in the reaction layer of an Al–10 wt % Si hot-dipped coating in a recent study. The order of the phases is shown from the liquid side to the steel side. It is determined that the ternary phase initially formed in the liquid phase is the τ5 phase (Al8Fe2Si) and the phase formed on the side of the steel is the τ1 phase (Al2Fe3Si3). In region No. 2, the τ1 phase is represented by Fe3(Al,Si)5, but it is not in the Al–Fe–Si ternary phase. The θ phase (FeAl3 or Fe4Al13) formed between the τ5 phase and η phase is not observed in Nos. 1 and 2. In particular, because the η and θ phases are 1–2 μm thick and the τ1 phase is 300 nm or less, it is difficult to specify the phase by the SEM, EDS, and XRD analysis. Therefore, it is considered to be somewhat different from the results of this study. It is also evident from the EBSD results in Figure 10 that no τ1 phase of thickness 300 nm or less and κ (Fe3AlC) of thickness 40–50 nm were detected.
It is understood from the phase diagram that the τ5 phase is formed in the liquid phase and τ1 phase is formed in the η phase despite there being eleven Al–Si–Fe ternary phases. Assuming that Fe is dissolved in liquid Al–10 wt % Si from steel at 690 °C and that the Fe concentration in the liquid phase is increased, using vertical section (isopleth) of the (Al–Si–Fe) ternary system, it is possible to identify which reaction (phase transformation) occurs depending on the amount. Figure 11 displays the vertical section (isopleth) of the (Al–Si–Fe) ternary system, calculated with Thermo-Calc Al database version 6.0 (TCAL6). The silicon (Si) is kept constant at 10 wt %. It is expected to explain the procedure for the Al, Si, and τ5 phase formations in the solidified Al–Si coating layer and of the τ5, η, and τ1 phase-formations in the reaction layer.
As shown in Figure 11, there are two processes in which solid τ5 phase can be formed as the Fe concentration increases in the vertical section (isopleth) of the (Al–Si–Fe) ternary diagram at 690 °C. The silicon (Si) is kept constant at 10 wt %. First, when the Fe concentration exceeds 3.73 wt % at 690 °C, solid τ5 (Al8Fe2Si) phase is formed via isothermal solidification. When the Fe concentration is up to 29.0 wt %, then as the amount of Fe increases, the amount of the solid τ5 phase increases based on the lever rule. Second, when the concentration of Fe in the liquid phase is 2.0 wt % (3.97 at %, peritectic point 592 °C), not only is there a τ5 phase formation in the cooling process, but also when the temperature is further lowered to 575 °C, there is a formation of τ5 + Al + Si three phases owing to the eutectic reaction. Thus, the three phases can be formed simultaneously only in the cooling process. Therefore, in Figure 10, the τ5 + Al + Si three-phase region is considered to be formed during cooling. In contrast, the layer consisting of the τ5 phase is believed to be formed only by isothermal solidification by dissolving Fe in 3.79 wt % or more at 690 °C in the liquid phase. Therefore, it is considered that the reaction phase in which the Fe is dissolved in the liquid phase and formed first is the τ5 phase.
The process of forming the η phase between the τ5 phase and steel is analyzed using the vertical section (isopleth) of the (Al–Si–Fe) ternary system. In Figure 11, the η phase can be formed in an isothermal or cooling process only when the Fe concentration is higher than 47 wt % (●) at 690 °C. Therefore, because the η phase is farther away from the liquid phase than is the τ5 phase, it is impossible to have a higher concentration than the Fe concentration for forming the τ5 phase. Thus, the η phase cannot react with the liquid phase to form. This implies that the η phase is formed by the interdiffusion of Al, Fe, and Si between the τ5 phase (solid phase) and steel. Table 4 presents the composition and crystal structure of each phase present in the (Al–Si–Fe) ternary system. In the phase diagram, the α2 phase is a solid solution containing a large amount of Al dissolved in Fe, and it has a BCC crystal structure. Based on the phase diagram, the η phase is formed when the Al + Si concentration is approximately 35.5 wt % or more (Fe concentration 64.5 wt % or less) at 690 °C, but the θ phase is formed only when it is 51 wt % or more (Fe concentration is 49.0 wt % or less). Considering the diffusion amount of Al, an η phase having a low Al concentration will naturally be formed before the θ phase. Therefore, when Al + Si diffuse into the steel through the τ5 phase and concentration becomes 35.5 wt % or more and when Fe diffuses in steel and Fe concentration at the steel/τ5 phase interface is lowered to 64.5 wt % or less, an η phase can be formed.
In Figure 11, the phase transformation in the order of decreasing Fe concentration in Fe 100% is as follows: α2 → α2 + η → α2 + η + τ1 → η + τ1. Based on the order of the phases formed as the amount of Al + Si increases in the steel (α2) at 690 °C, the α2 solid solution only exists until the concentration of Al + Si reaches 35.5 wt %, and when the concentration exceeds 35.5 wt %, the η phase is formed. When Al and Si diffuse into the steel from the already formed τ5 phase and Fe diffuses from the steel into the τ5 phase, an η phase is formed at the interface. When the diffusion amount of Al and Si increases to exceed 51.0 wt %, the η and τ1 phases can be formed together. According to vertical section (isopleth) of the (Al–Si–Fe) ternary system with constant silicon (Si) content at 10 wt %, at the hot-dipping temperature of 690 °C, the stable phase is τ5, and the phases that can be formed by the Al, Fe, and Si diffusion are the η and τ1 phases. The constitution and distribution of the reaction phase obtained in this study and the results of the above-mentioned analysis agree with each other.
It is generally known that the addition of Si in Al hot-dip coating can reduce the thickness of the η phase. The growth delay mechanism of the η phase is proposed as follows: (1) a diffusion delay of Al due to the Si addition to the internal vacancy of the η phase; (2) a diffusion delay of Al by the concentration of Si in the θ phase and η phase grain boundaries; (3) an effect on the activity coefficient of Si or a reduction in the activation energy for the η phase formation; (4) a decrease in the activation coefficient of Al; and (5) formation of a ternary chemical compound acting as a diffusion barrier. Also, the atomic model of the disordered η phase is composition-dependent showing mixed occupation of the channels by both Al and Fe atoms rather only Al atoms at high temperature of 690 °C [26]. In this study, the thickness of the reaction layer is 5–8 μm and of the η-phase layer is approximately 1 μm. This result suggests that the stable τ5 phase grows preferentially at 690 °C and that Al and Si, which are necessary for the growth of the η phase, are preferentially consumed versus the τ5 phase rather than the growth retardation of the η phase. In addition, it is believed that the thick τ5 phase acts as a diffusion barrier to Al and Si.
Another reaction phase formed by the hot-dipping process is the κ phase (Fe3AlC) formed at the η/steel interface. Springer recently reported that an 800-nm band consisting of a β’ phase (FeAl) and κ phase was formed between the steel and η phase by inter-diffusion in the solid reaction of a low-carbon steel and pure Al at 600 °C [15]. However, the forming mechanism was not discussed. As shown in Figure 4, no carbon is detected in the τ5 and η phase layers. This is evidence that the carbon solubility in the τ5 and η phases is very low. Because the boron steel used in this study contains 0.22 wt % of carbon, it is considered that the κ phase formed by the reaction of the diffusing Al and discharging carbon in the η phase region transformed from steel to the η phase. A study of pure Al and Al–7Ni hot-dip coating on boron steels similarly reported that the κ phase was formed at the grain boundaries of the η phase and adjacent steels [4,27].
4. Conclusions
In this study, the microstructures of the reaction layer and phases formed on boron steel hot dipped in Al–10 wt % Si was investigated using a TEM preparing with FIB. Moreover, the formation mechanism of each phase was discussed with vertical section (isopleth) of the (Al–Si–Fe) ternary system, and the results are obtained as follows:
- The coated layer is divided into a solidified Al–Si coating layer and reaction layer. The solidified Al–Si coating layer consists of a primary Al phase and an Al + Si + τ5 (Al8Fe2Si) ternary eutectic phase. It was observed that τ5 phase is formed on the solidified Al–Si coating layer side. η phase was formed on the steel side, and fine τ1 phase (Al2Fe3Si3) was continuously formed like a band shape inside η phase. Moreover, κ-phase (Fe3AlC) band in 40–50 nm existed on the η phase and steel interface.
- The τ5 phase had fine grains of approximately 1–2 μm in size. In considering vertical section (isopleth) of the (Al–Si–Fe) ternary system kept constant at 10 wt % Si, it was determined that τ5 phase could be formed by isothermal solidification at 690 °C when 3.73–29.0 wt % Fe was dissolved into Al–10 wt % Si liquid bath.
- The η phase consisted of fine grains of several hundreds of nanometers in size. When the Al + Si concentration was approximately 35.5% or more (the Fe concentration is 64.5% or less) via the inter-diffusion of Al, Si, and Fe, the η phase forms at the interface between the τ5 phase and ferrite steel. It was confirmed that when the amount of Fe is more than 51.0 wt %, the η and τ1 phases can be formed together.
- κ phase (Fe3AlC) was formed at the η/steel interface since the carbon in steel, which is not employed in the η and τ5 phases, was released into the steel and interacted with the Al and Fe.
Author Contributions
Conceptualization, D.S., C.-Y.K.; Formal Analysis, D.S.; Investigation, J.-Y.L.; Resources, D.S.; Data Curation, H.H.; Writing–Original Draft Preparation, D.S.; Writing–Review & Editing, J.-Y.L., C.-Y.K.; Visualization, J.-Y.L.; Supervision, C.-Y.K.; Project Administration, C.-Y.K.; Funding Acquisition, C.-Y.K.
Funding
This research was funded by a National Research Foundation of Korea (NRF) grant funded by the Korean government (MSIP) through the Engineering Research Center (No. 2012R1A5A1048294).
Conflicts of Interest
The authors declare no conflicts of interest.
References
- Kobayashi, S.; Yakou, T. Control of intermetallic compound layers at interface between steel and aluminum by diffusion-treatment. Mater. Sci. Eng. A 2002, 338, 44–53. [Google Scholar] [CrossRef]
- Chang, Y.-Y.; Tsaur, C.-C.; Rock, J.C. Microstructure studies of an aluminide coating on 9Cr-1Mo steel during high temperature oxidation. Surf. Coat. Technol. 2006, 200, 6588–6593. [Google Scholar] [CrossRef]
- Wang, C.-J.; Chen, S.-M. The high-temperature oxidation behavior of hot-dipping Al–Si coating on low carbon steel. Surf. Coat. Technol. 2006, 200, 6601–6605. [Google Scholar] [CrossRef]
- Shin, D.; Lee, J.-Y.; Heo, H.; Kang, C.-Y. Formation procedure of reaction phases in Al hot dipping process of steel. Metals 2018, 8, 820. [Google Scholar] [CrossRef]
- Ei-Mahallawy, N.; Taha, M.; Shady, M.; Ei-Sissi, A.; Attia, A.; Reif, W. Analysis of coating layer formedon steel strips during aluminising by hot dipping in Al–Si baths. Mater. Sci. Technol. 1997, 13, 832–840. [Google Scholar] [CrossRef]
- Mori, K.; Ito, D. Prevention of oxidation in hot stamping of quenchable steel sheet by oxidation preventive oil. CIRP Ann. 2009, 58, 267–270. [Google Scholar] [CrossRef]
- Cheng, W.-J.; Wang, C.-J. Observation of high-temperature phase transformation in the Si-modified aluminide coating on mild steel using EBSD. Mater. Charact. 2010, 61, 467–473. [Google Scholar] [CrossRef]
- Azushima, A.; Uda, K.; Yanagida, A. Friction behavior of aluminum-coated 22MnB5 in hot stamping under dry and lubricated conditions. J. Mater. Proc. Technol. 2012, 212, 1014–1021. [Google Scholar] [CrossRef]
- Jeon, Y.-P.; Seo, H.-Y.; Kim, J.-D.; Kang, C.-G. Experimental analysis of coating layer behavior of Al–Si-coated boron steel in a hot bending process for it applications. Int. J. Adv. Manuf. Technol. 2013, 67, 1693–1700. [Google Scholar] [CrossRef]
- Takeda, S.; Mutuzaki, K. The equilibrium diagram of Fe-Al–Si system. Tetsu-to-hagané 1940, 26, 335–361. [Google Scholar] [CrossRef]
- Cheng, W.-J.; Wang, C.-J. Microstructural evolution of intermetallic layer in hot-dipped aluminide mild steel with silicon addition. Surf. Coat. Technol. 2011, 205, 4726–4731. [Google Scholar] [CrossRef]
- Gui, Z.-X.; Liang, W.-K.; Liu, Y.; Zhang, Y.-S. Thermo-mechanical behavior of the Al–Si alloy coated hot stamping boron steel. Mater. Des. 2014, 60, 26–33. [Google Scholar] [CrossRef]
- Lemmens, B.; Springer, H.; De Graeve, I.; De Strycker, J.; Raabe, D.; Verbeken, K. Effect of silicon on the microstructure and growth kinetics of intermetallic phases formed during hot-dip aluminizing of ferritic steel. Surf. Coat. Technol. 2017, 319, 104–109. [Google Scholar] [CrossRef]
- Akdeniz, M.V.; Mekhrabov, A.O.; Yilmaz, T. The role of Si addition on the interfacial interaction in Fe-Al diffusion layer. Scripta Metallurgica et Materialia 1994, 31, 1723–1728. [Google Scholar] [CrossRef]
- Springer, H.; Kostka, A.; Payton, E.; Raabe, D.; Kaysser-Pyzalla, A.; Eggeler, G. On the formation and growth of intermetallic phases during interdiffusion between low-carbon steel and aluminum alloys. Acta Mater. 2011, 59, 1586–1600. [Google Scholar] [CrossRef]
- Heumann, T.; Dittrich, S. Uber die kinetik der reaktion von festem und flûssigem aluminium mit eisen. Zeitschrift fur Metallkunde 1959, 50, 617–625. (In German) [Google Scholar]
- Eggeler, G.; Auer, W.; Kaesche, H. On the influence of silicon on the growth of the alloy layer during hot dip aluminizing. J. Mater. Sci. 1986, 21, 3348–3350. [Google Scholar] [CrossRef]
- Shady, M.; El-Sissi, A.; Attia, A.; El-Mahallawy, N.; Taha, M.; Reif, W. On the technological properties of steel strips aluminized in Al–Si baths. J. Mater. Sci. Lett. 1996, 15, 1032–1036. [Google Scholar] [CrossRef]
- Yun, J.-G.; Lee, J.-H.; Kwak, S.-Y.; Kang, C.-Y. Study on the formation of reaction phase to Si addition in boron steel hot-dipped in Al–7Ni alloy. Coatings 2017, 7, 186. [Google Scholar] [CrossRef]
- Nicholls, J.E. Hot-dipped aluminium coatings. Anti-Corros. Methods Mater. 1964, 11, 16–21. [Google Scholar] [CrossRef]
- Lemmens, B.; Springer, H.; Duarte, M.J.; De Graeve, I.; De Strycker, J.; Raabe, D.; Verbeken, K. Atom probe tomography of intermetallic phases and interfaces formed in dissimilar joining between al alloys and steel. Mater. Charact. 2016, 120, 268–272. [Google Scholar] [CrossRef]
- Shankar, S.; Apelian, D. Die soldering: Mechanism of the interface reaction between molten aluminum alloy and tool steel. Metall. Mater. Trans. B 2002, 33, 465–476. [Google Scholar] [CrossRef]
- Yin, F.-C.; Zhao, M.-X.; Liu, Y.-X.; Wei, H.; Zhi, L. Effect of si on growth kinetics of intermetallic compounds during reaction between solid iron and molten aluminum. Trans. Nonferrous Met. Soc. Chin. 2013, 23, 556–561. [Google Scholar] [CrossRef]
- Kurakin, A. Mechanism of the influence of silicon on the processes of the reaction diffusion of iron in aluminium. Phys. Met. Metall. 1970, 30, 105–110. (In Japanese) [Google Scholar]
- Glasbrenner, H.; Wedemeyer, O. Comparison of hot dip aluminised F82h-mod. Steel after different subsequent heat treatments. J. Nucl. Mater. 1998, 257, 274–281. [Google Scholar] [CrossRef]
- Becker, H.; Leineweber, A. Atomic channel occupation in disordered η-Al5Fe2 and in two of its low-temperatures phases, η″ and η‴. Intermetallics 2018, 93, 251–262. [Google Scholar] [CrossRef]
- Lee, J.-H.; Yun, J.-G.; Kwak, S.-Y.; Kang, C.-Y. Nucleation and growth of intermetallic compounds formed in boron steel hot-dipped in Al–Ni alloy. Coatings 2017, 7, 195. [Google Scholar] [CrossRef]
Figure 1.
(a) Optical microstructure; (b,c) SEM structures of the areas denoted as A and B in (a).

Figure 2.
Energy dispersive spectrometer (EDS) area-analysis results of the Areas A and B in Figure 1. (a,d) Al; (b,e) Si; (c,f) Fe.
Figure 2.
Energy dispersive spectrometer (EDS) area-analysis results of the Areas A and B in Figure 1. (a,d) Al; (b,e) Si; (c,f) Fe.
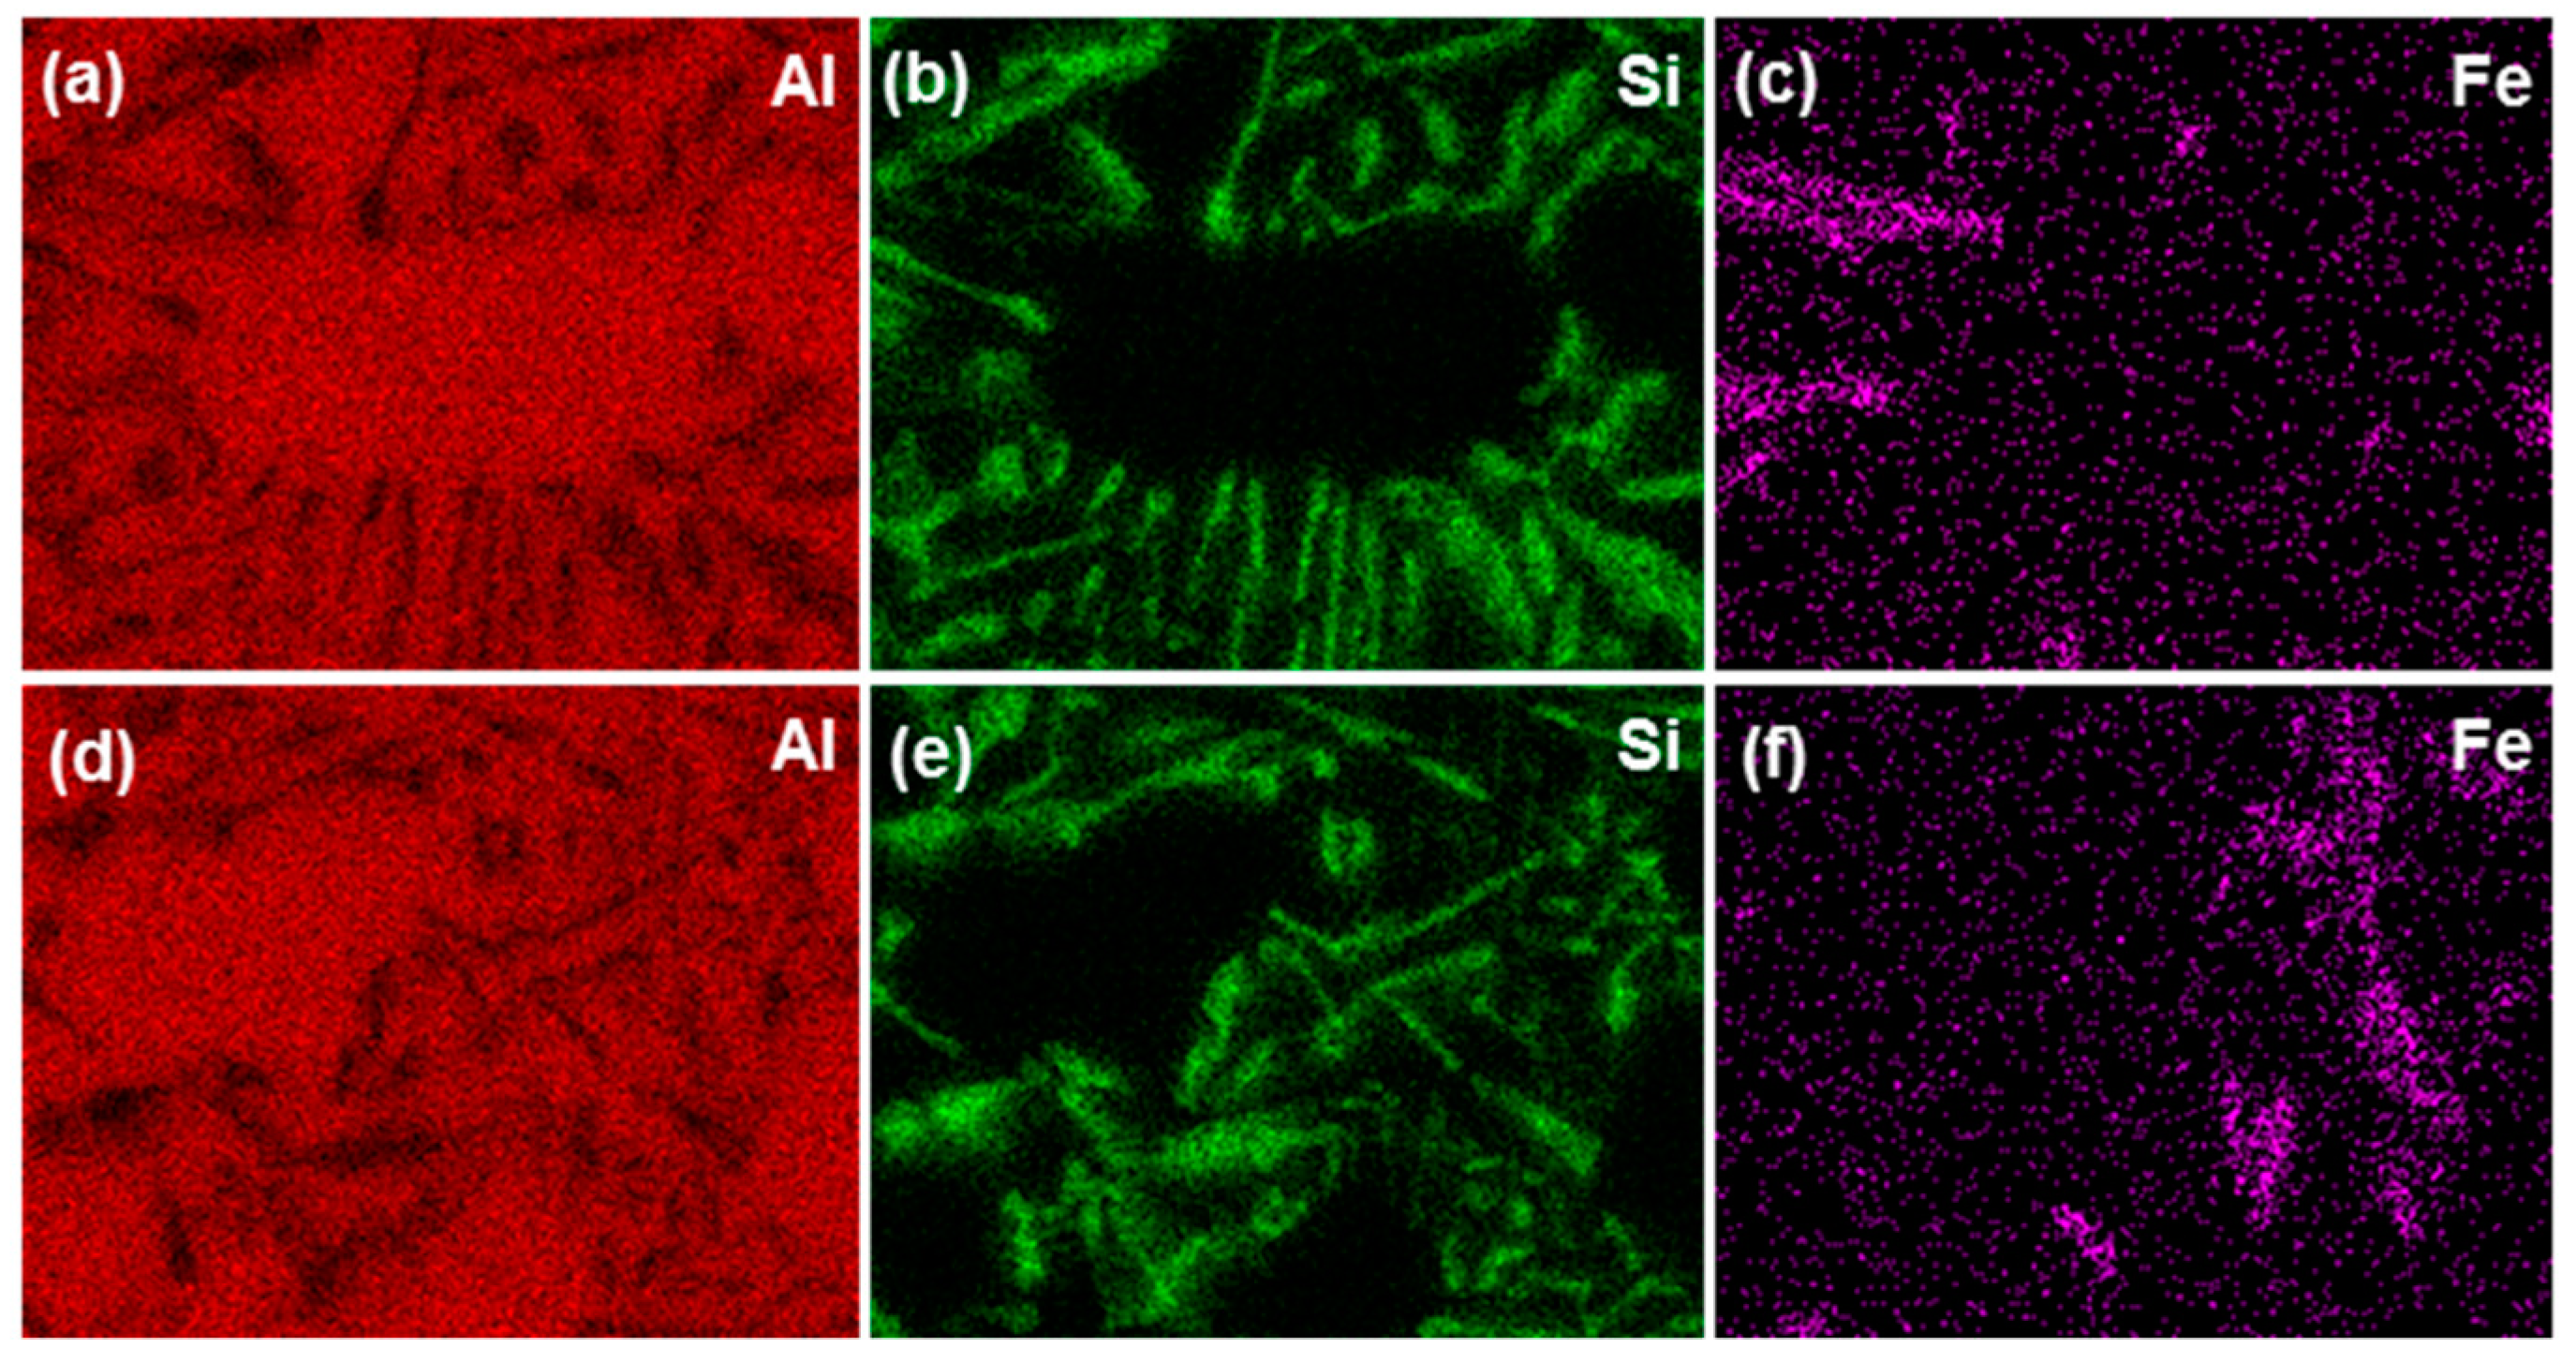
Figure 3.
(a) Vertical section (isopleth) of the (Al–Si–Fe) ternary system, calculated with Thermo-Calc Al database version 6.0 (TCAL6). The silicon (Si) is kept constant at 10 wt % and the content of Fe is ranged with 0–40 wt %. (b) Its magnified region denoted as rectangular area.
Figure 3.
(a) Vertical section (isopleth) of the (Al–Si–Fe) ternary system, calculated with Thermo-Calc Al database version 6.0 (TCAL6). The silicon (Si) is kept constant at 10 wt % and the content of Fe is ranged with 0–40 wt %. (b) Its magnified region denoted as rectangular area.
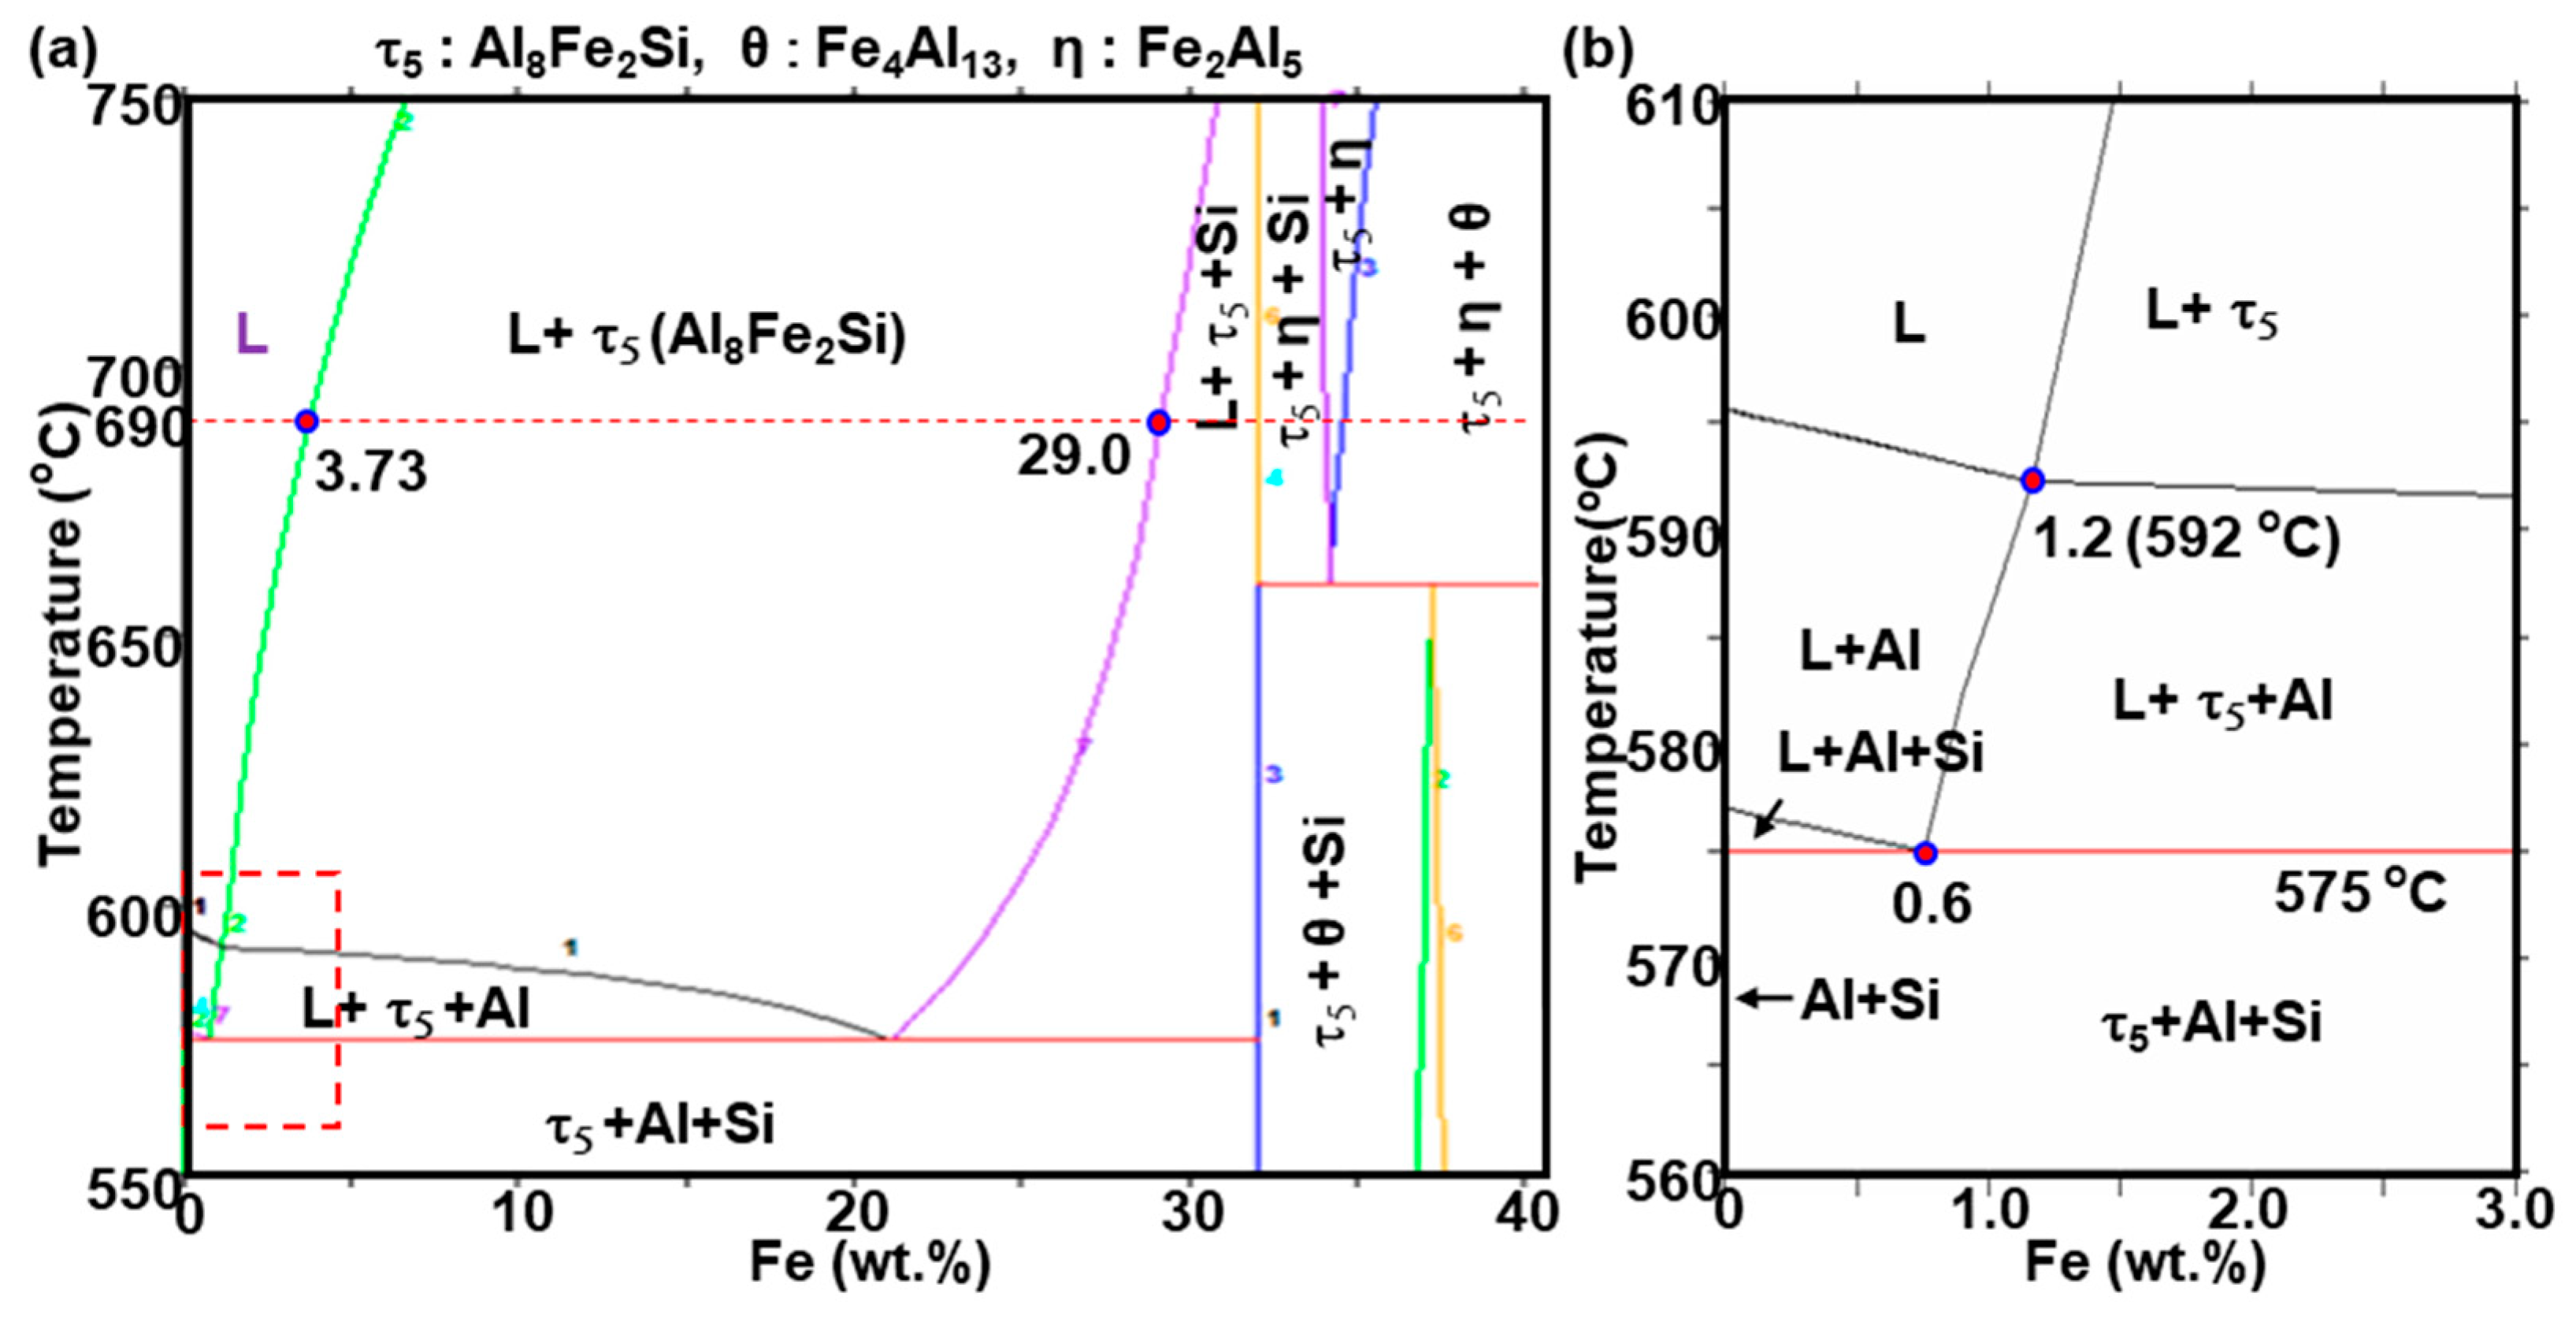
Figure 4.
(a) Secondary electron microscopy (SEM) images for the Area C in Figure 1a along with field-emission electron probe micro-analyzer (EPMA) elemental mapping analysis for (b) Al, (c) Si, (d) Fe, and (e) C.
Figure 4.
(a) Secondary electron microscopy (SEM) images for the Area C in Figure 1a along with field-emission electron probe micro-analyzer (EPMA) elemental mapping analysis for (b) Al, (c) Si, (d) Fe, and (e) C.
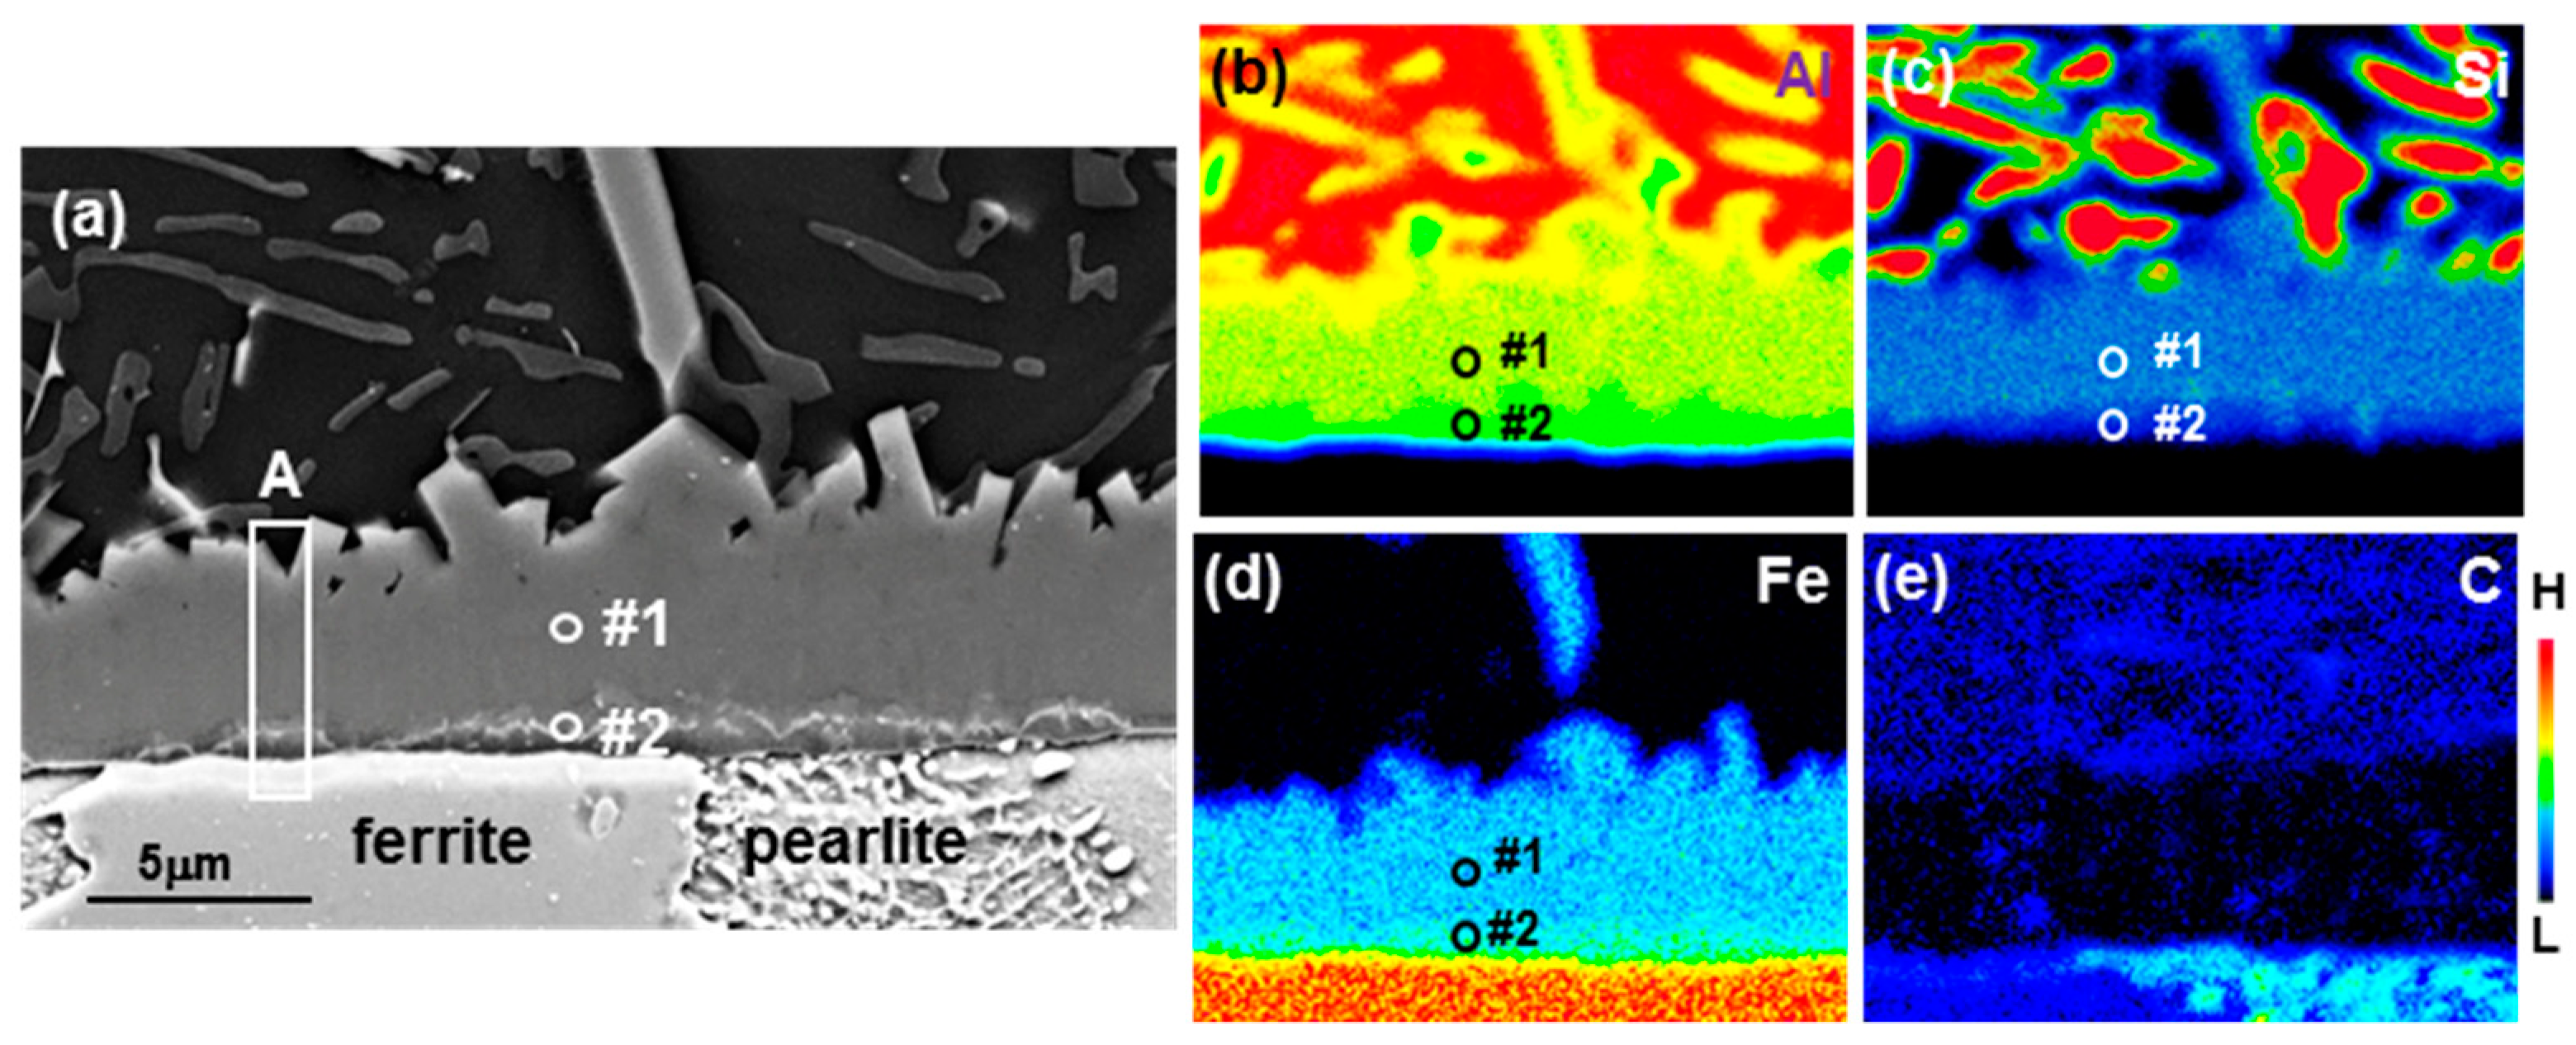
Figure 5.
(a) High-angle annular dark-field (HAADF) image of Area A in Figure 4a and energy-dispersive spectrometer (EDS) elemental mapping for (b) Al, (c) Si, and (d) Fe, respectively.
Figure 5.
(a) High-angle annular dark-field (HAADF) image of Area A in Figure 4a and energy-dispersive spectrometer (EDS) elemental mapping for (b) Al, (c) Si, and (d) Fe, respectively.

Figure 6.
Diffraction patterns and those key diagram taking from at area denoted as 1–10 in Figure 5a, respectively.
Figure 6.
Diffraction patterns and those key diagram taking from at area denoted as 1–10 in Figure 5a, respectively.

Figure 7.
(a) transmission electron microscopy (TEM) images of the Area A in Figure 4a using focused ion beam (FIB) technique, (b) enlarged image of Area X, (c) enlarged area of Area X1, (d) enlarged area of Area X2, and (e) enlarged area of Area Y, respectively.
Figure 7.
(a) transmission electron microscopy (TEM) images of the Area A in Figure 4a using focused ion beam (FIB) technique, (b) enlarged image of Area X, (c) enlarged area of Area X1, (d) enlarged area of Area X2, and (e) enlarged area of Area Y, respectively.
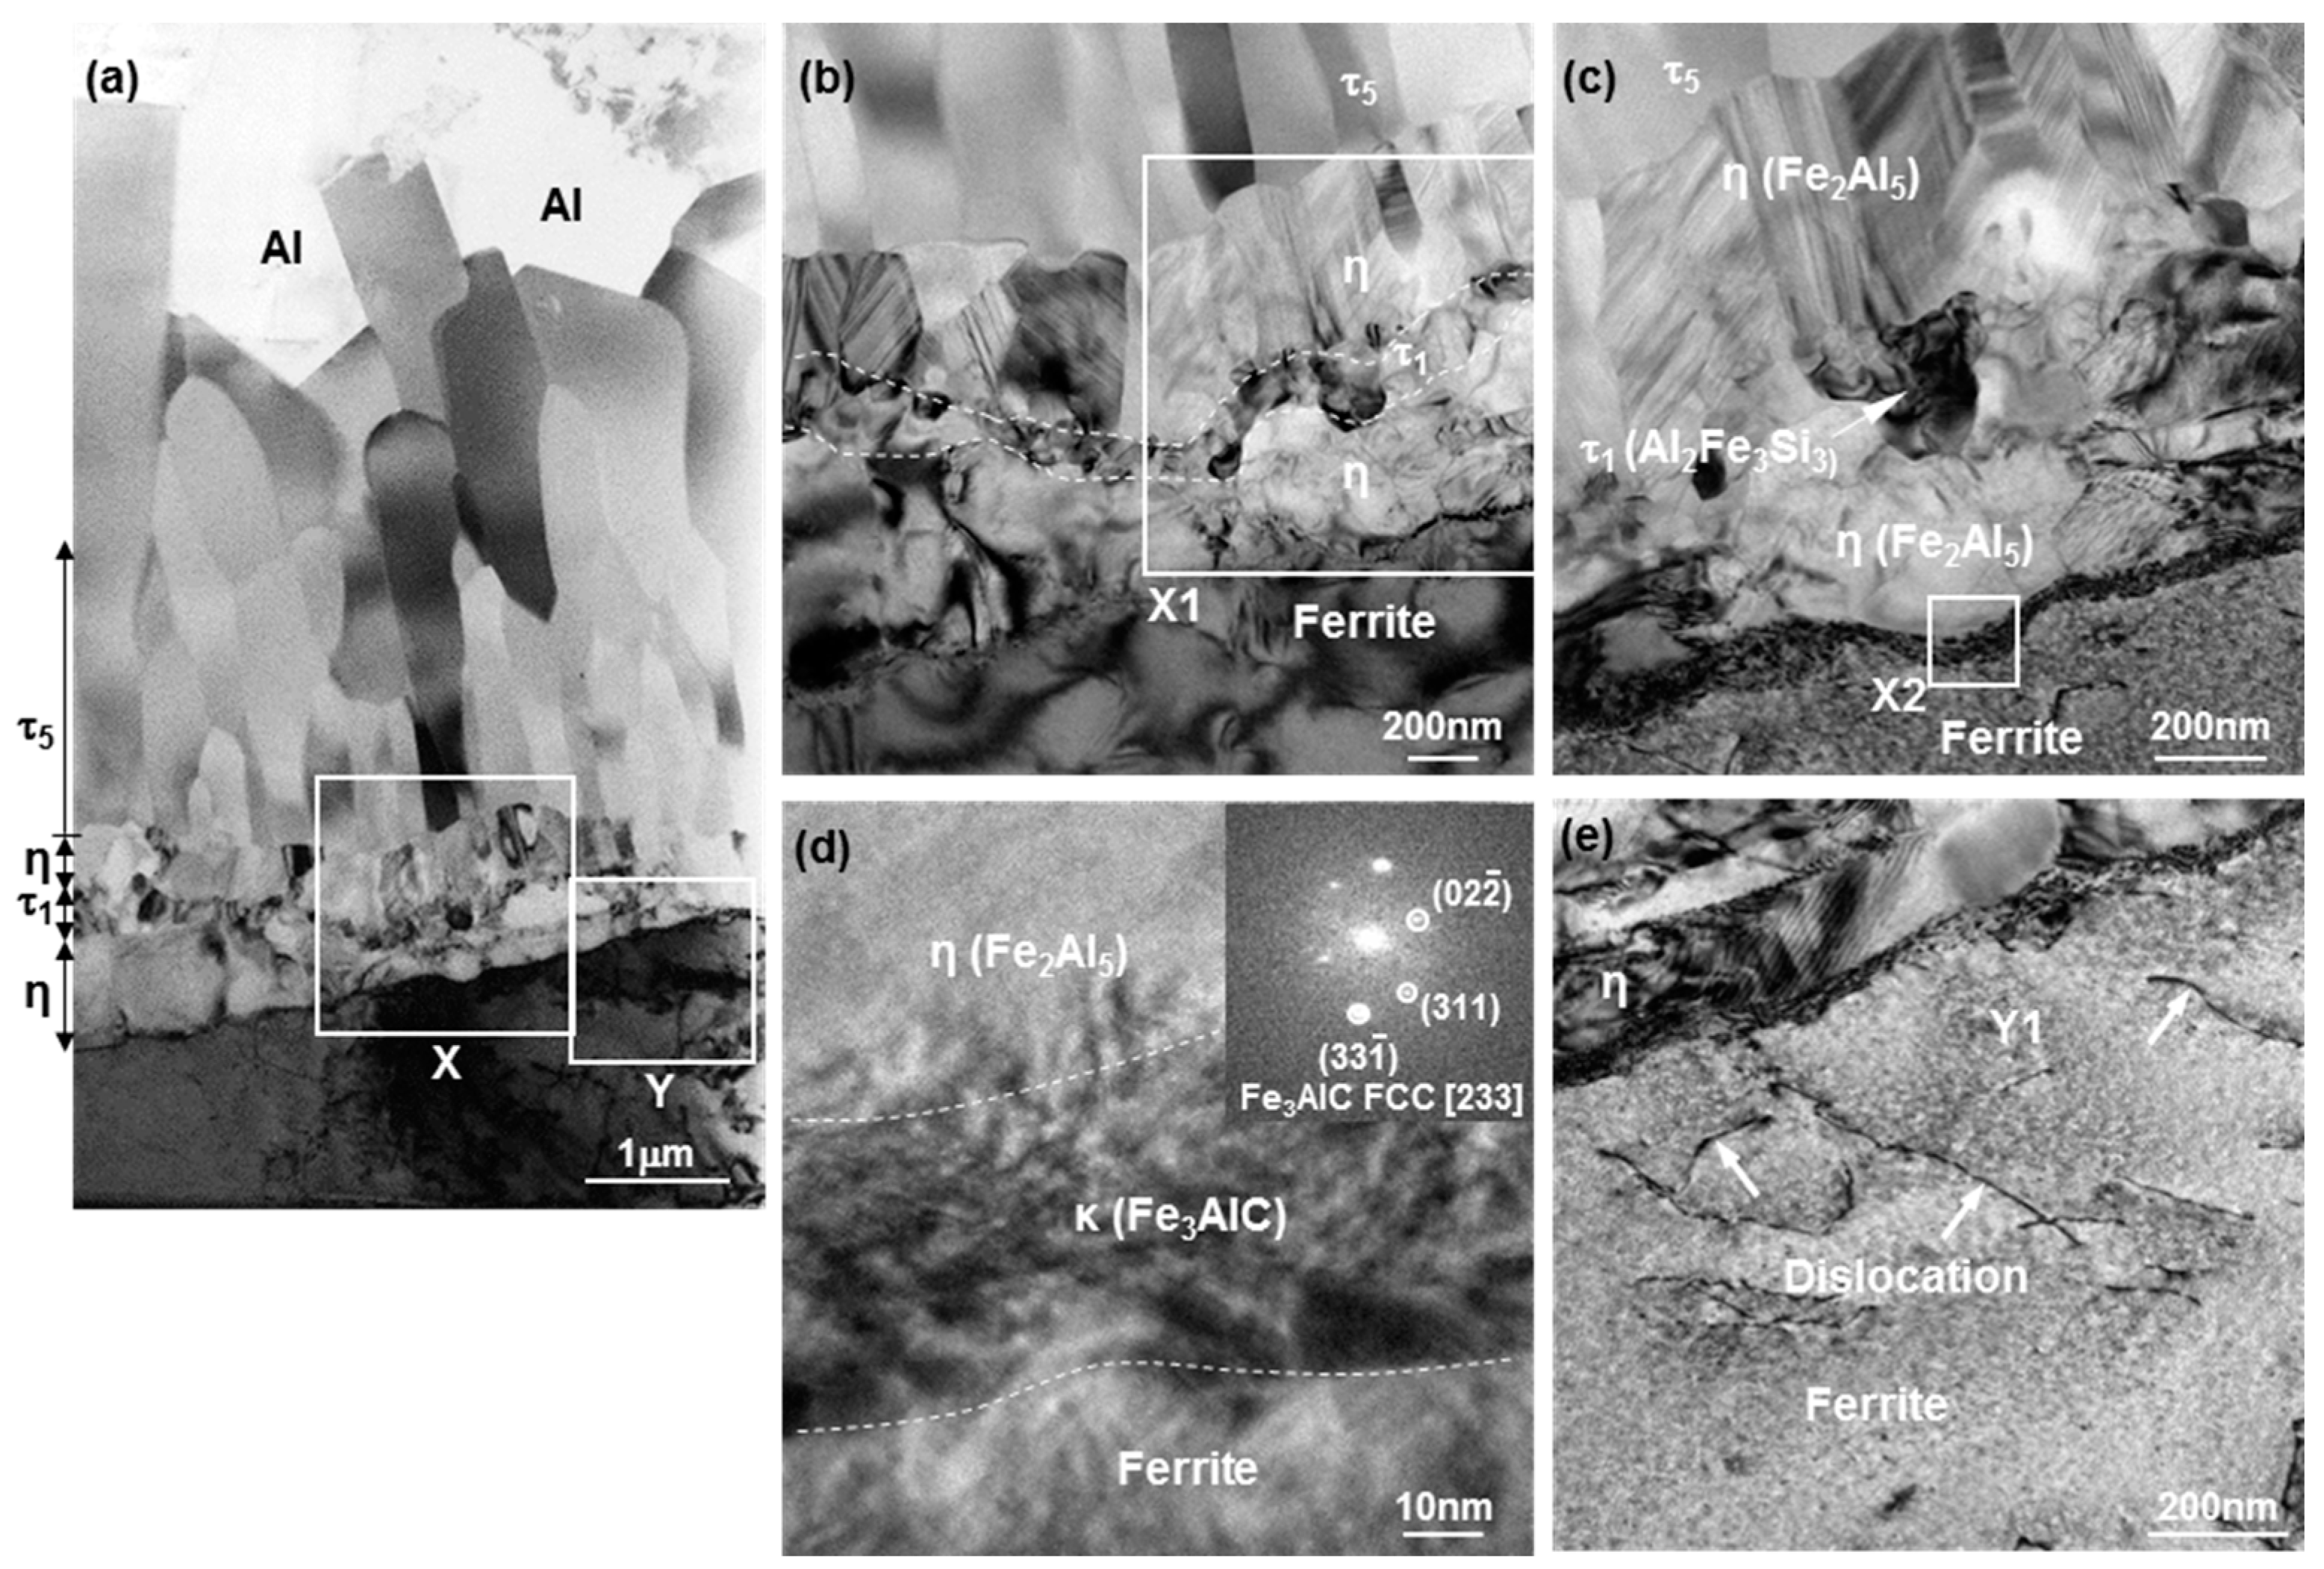
Figure 8.
(a) τ1-phase upper area denoted as Y in Figure 5a; (b–d) elemental mapping for Al, Fe, and Si, respectively.
Figure 8.
(a) τ1-phase upper area denoted as Y in Figure 5a; (b–d) elemental mapping for Al, Fe, and Si, respectively.
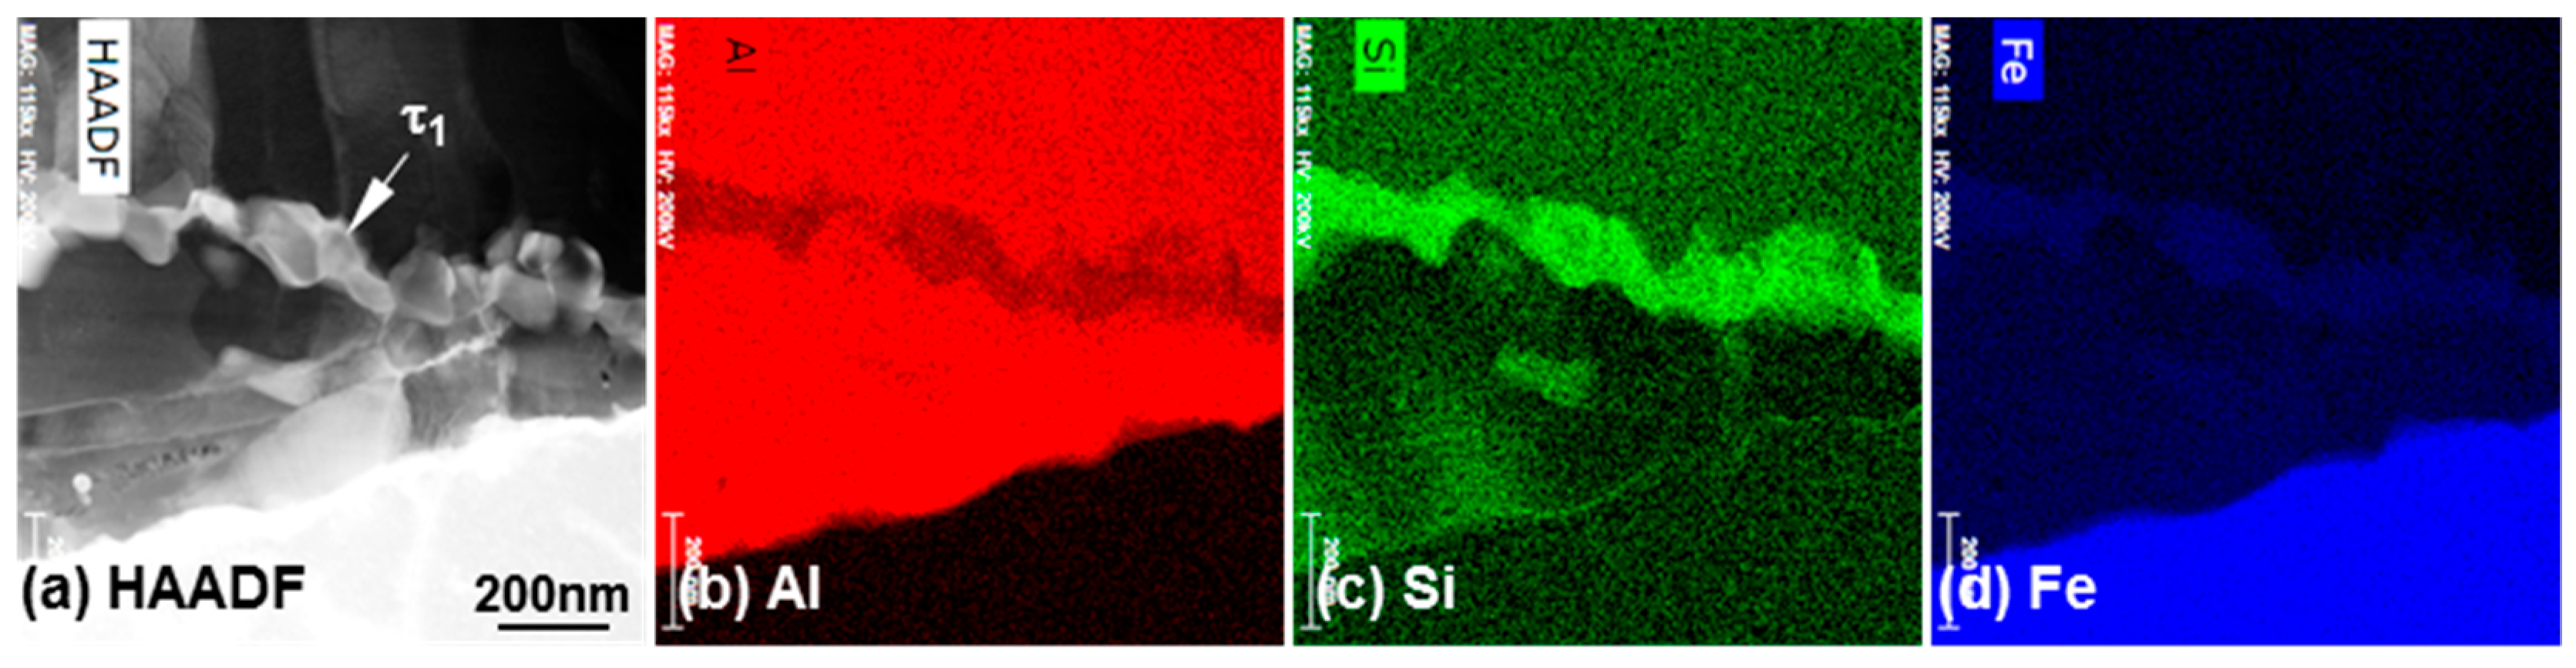
Figure 9.
Phase map (a) and IPF (b) obtained by the electron backscatter diffraction (EBSD) analysis of the specimen hot dipped in Al–10 wt % Si melt for 50 s (Figure 8).
Figure 9.
Phase map (a) and IPF (b) obtained by the electron backscatter diffraction (EBSD) analysis of the specimen hot dipped in Al–10 wt % Si melt for 50 s (Figure 8).
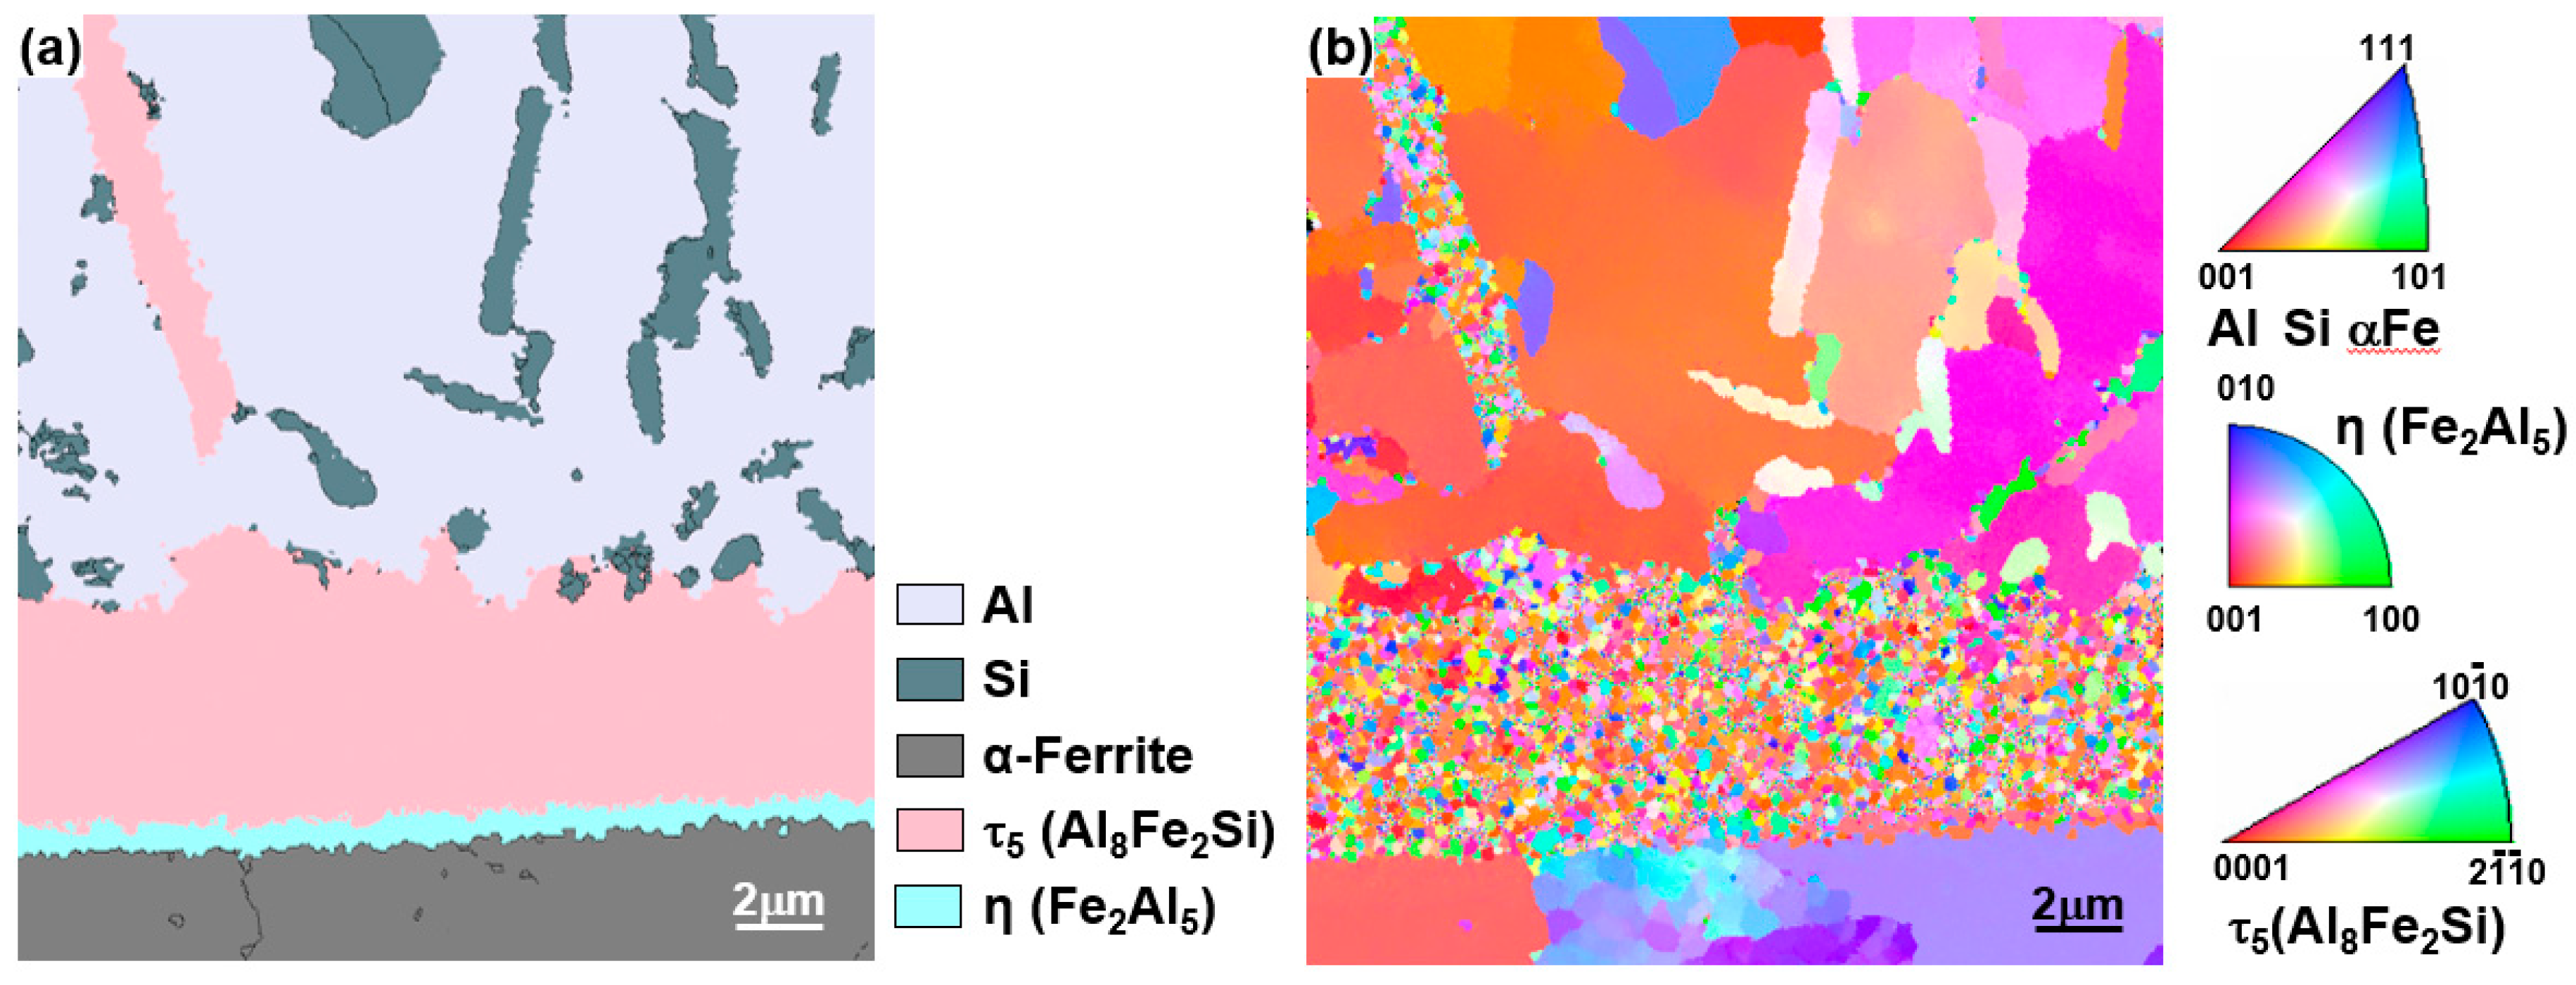
Figure 10.
Schematics of the interface layer confirmed by (a) electron backscatter diffraction (EBSD) and (b) transmission electron microscopy (TEM) analysis.
Figure 10.
Schematics of the interface layer confirmed by (a) electron backscatter diffraction (EBSD) and (b) transmission electron microscopy (TEM) analysis.
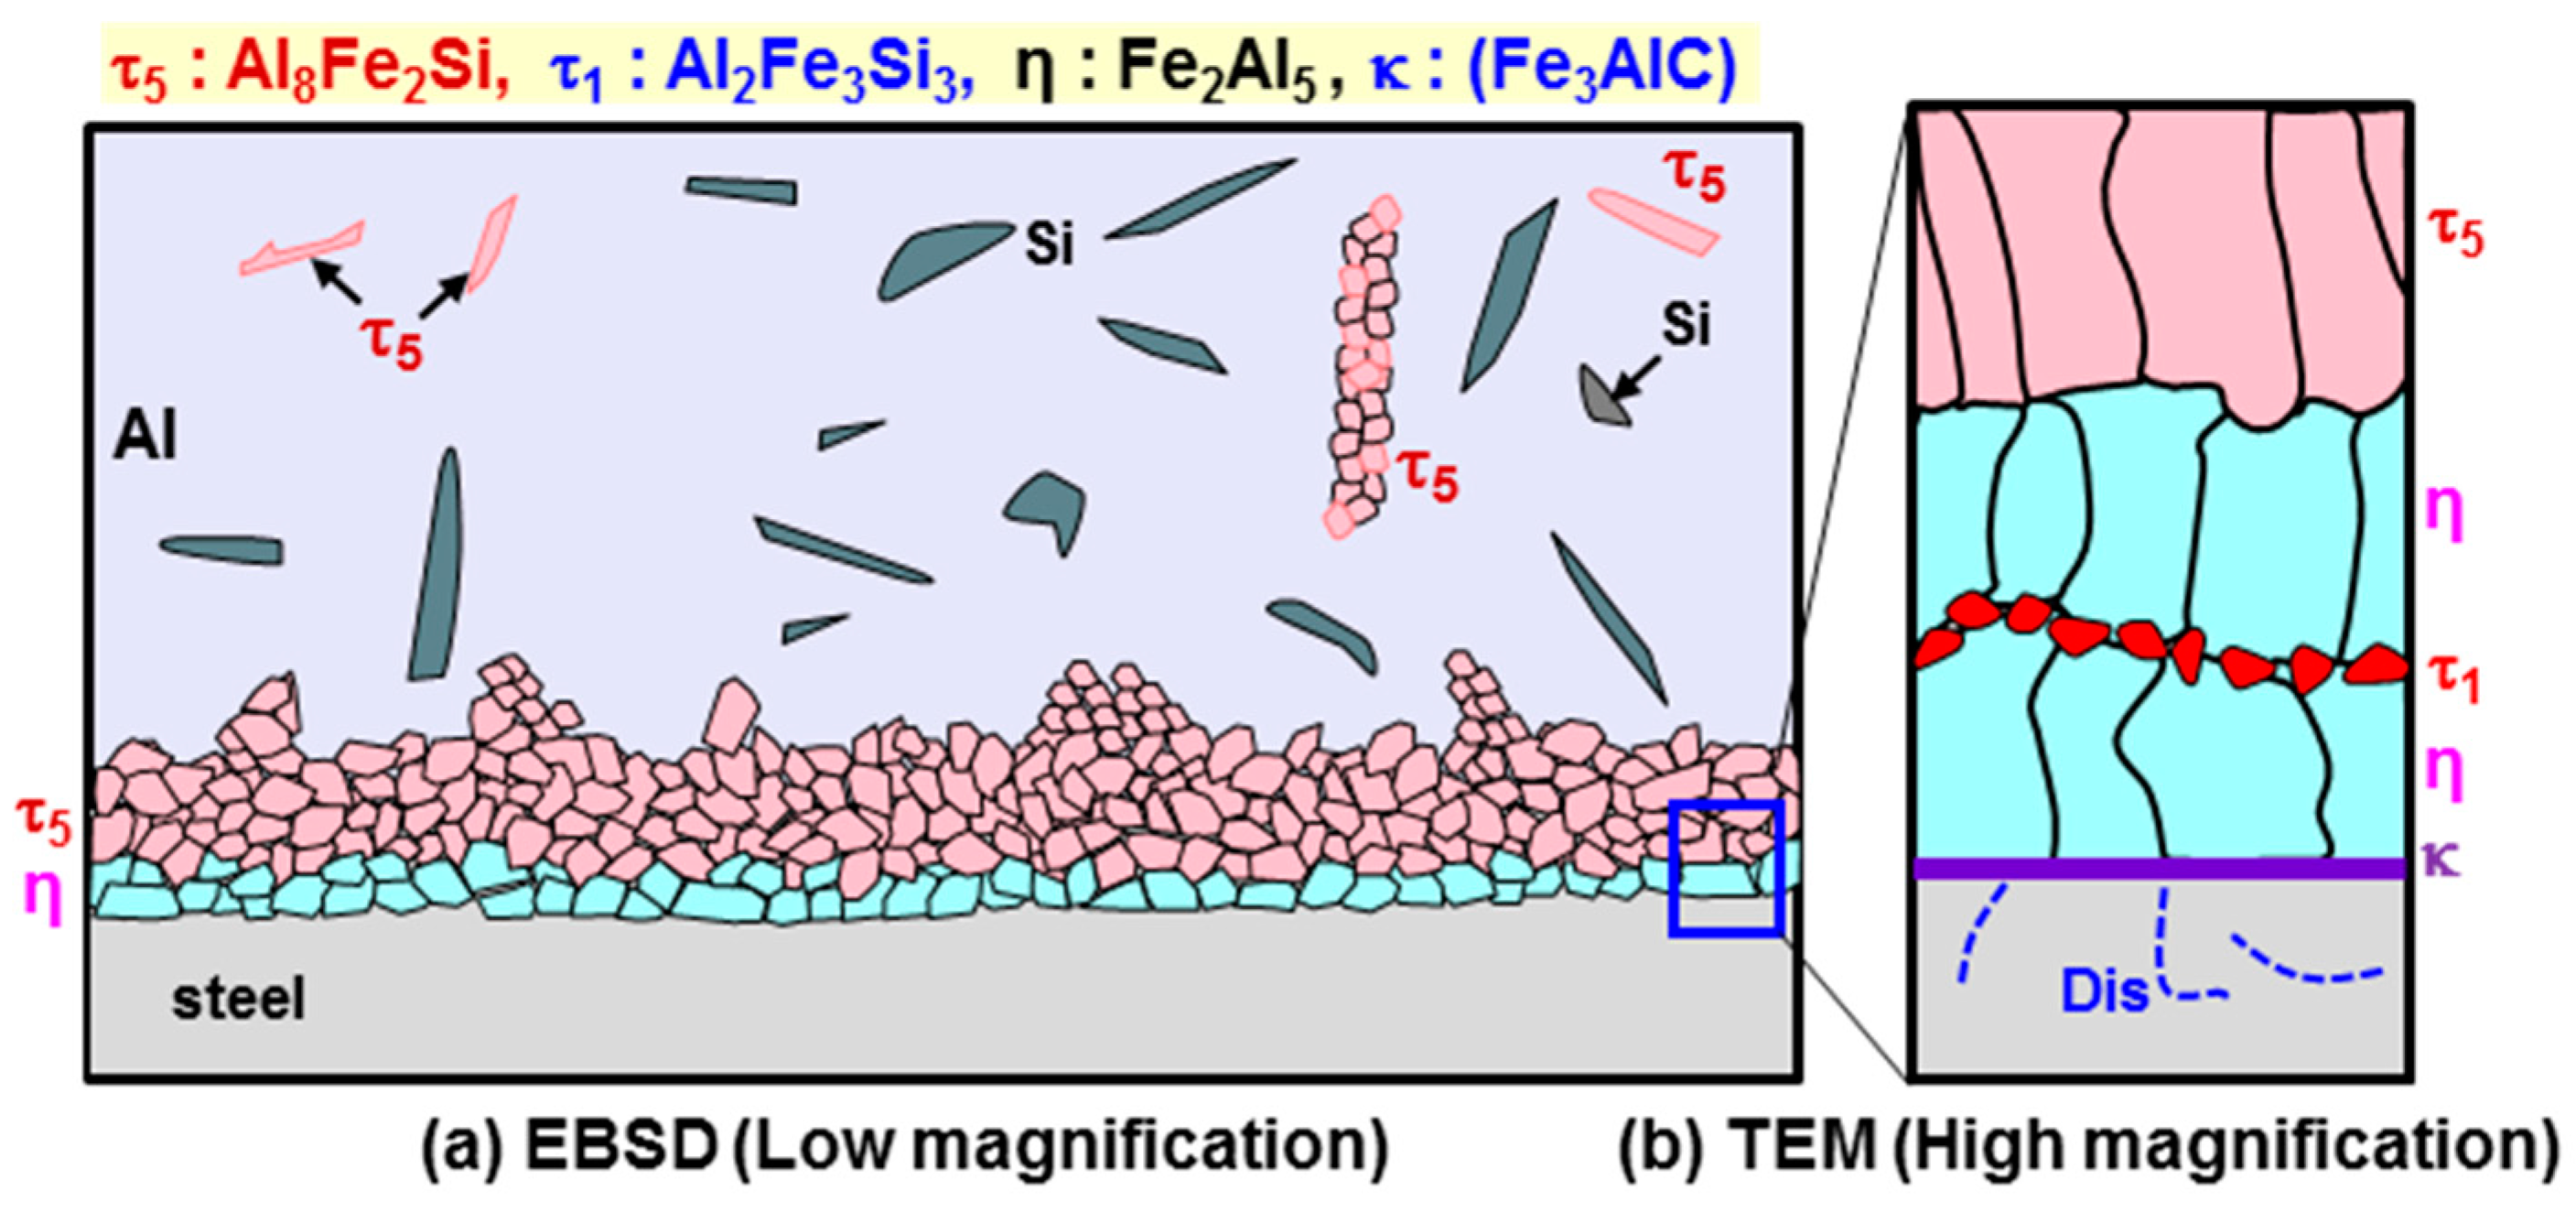
Figure 11.
Vertical section (isopleth) of the (Al–Si–Fe) ternary system, calculated with Thermo-Calc Al database version 6.0 (TCAL6). The silicon (Si) is kept constant at 10 wt %.
Figure 11.
Vertical section (isopleth) of the (Al–Si–Fe) ternary system, calculated with Thermo-Calc Al database version 6.0 (TCAL6). The silicon (Si) is kept constant at 10 wt %.

Table 1.
EDS analysis results (at %/wt %) of the phases denoted as 1–5 in Figure 1.
Table 1.
EDS analysis results (at %/wt %) of the phases denoted as 1–5 in Figure 1.
| No. | at %/wt % | Al | Si | Fe | Expected Phase |
|---|---|---|---|---|---|
| 1 | at % | 69.9 | 11.9 | 18.2 | Al8Fe2Si (τ5) |
| wt % | 58.3 | 10.4 | 31.4 | ||
| 2 | at % | 6.4 | 93.6 | − | Si |
| wt % | 6.2 | 93.8 | − | ||
| 3 | at % | 67.9 | 14.0 | 18.1 | Al8Fe2Si (τ5) |
| wt % | 56.6 | 12.1 | 31.3 | ||
| 4 | at % | 71.3 | 11.4 | 17.3 | Al8Fe2Si (τ5) |
| wt % | 60.0 | 10.0 | 30.0 | ||
| 5 | at % | 14.5 | 85.5 | − | Si |
| wt % | 13.9 | 86.1 | − |
Table 2.
EDS analysis results (at %/wt %) of the phases denoted as 1–10.
| No. | at %/wt % | Al | Si | Fe | Expected Phase |
|---|---|---|---|---|---|
| 1 | at % | 99.5 | 0.5 | 0.0 | Al |
| wt % | 99.3 | 0.5 | 0.2 | ||
| 2 | at % | 1.8 | 98.0 | 0.2 | Si |
| wt % | 1.8 | 97.8 | 0.4 | ||
| 3 | at % | 64.9 | 12.9 | 22.2 | Al8Fe2Si (τ5) |
| wt % | 52.2 | 10.8 | 37.0 | ||
| 4 | at % | 65.1 | 12.5 | 22.4 | Al8Fe2Si (τ5) |
| wt % | 52.3 | 10.4 | 37.3 | ||
| 5 | at % | 65.1 | 12.4 | 22.5 | Al8Fe2Si (τ5) |
| wt % | 52.2 | 10.4 | 37.4 | ||
| 6 | at % | 68.7 | 5.1 | 26.2 | Fe2Al5 (η) |
| wt % | 53.5 | 4.2 | 42.3 | ||
| 7 | at % | 29.1 | 30.1 | 40.8 | Al2Fe3Si3 (τ1) |
| wt % | 20.1 | 21.6 | 58.3 | ||
| 8 | at % | 69.1 | 4.9 | 26.0 | Fe2Al5 (η) |
| wt % | 53.9 | 4.0 | 42.1 | ||
| 9 | at % | 67.9 | 1.4 | 30.7 | Fe2Al5 (η) |
| wt % | 51.1 | 1.0 | 47.9 | ||
| 10 | at % | 0.1 | 0.1 | 99.8 | Fe |
| wt % | 0.1 | 0.1 | 99.8 |
Table 3.
Configuration of the phases in the reaction layer as found in the recent literature.
| No. | Steel | Temperature (°C) | Analysis | Detected Reaction Phases from the Liquid Side | Ref. |
|---|---|---|---|---|---|
| 1 | Boron | As coated | XRD/EDS, SEM | τ5–Fe2Al7Si/τ1–Fe3Al2Si3/η–Fe2Al5 | [14] |
| 2 | Boron | As coated | XRD/EDS, SEM | τ5–Fe2Al7Si/η–Fe2Al5 with τ1–Fe3(Al,Si)5 | [11] |
| 3 | 0.01C | 670–725 | SEM/EBSD | τ5/η with θ + τ1(topside) | [15] |
| 4 | 0.05C | 700 | XRD/EDS | τ5–Fe2Al7Si/θ–FeAl3/τ1–Fe3Al2Si3/η–Fe2Al5 | [13] |
Table 4.
Composition and crystal structure of the phases shown at 690 °C in the phase diagram.
| Phase | Crystal Structure | at %/wt % | Al | Si | Fe |
|---|---|---|---|---|---|
| Al8Fe2Si (τ5) | Hexagonal | at % | 71.0 | 10.0 | 19.0 |
| wt % | 58.8 | 8.4 | 32.6 | ||
| Fe4Al13 (θ) | Monoclinic | at % | 74.5 | 1.8 | 23.7 |
| wt % | 59.3 | 1.5 | 39.2 | ||
| Fe2Al5 (η) | Orthorhombic | at % | 65.5 | 5.9 | 28.6 |
| wt % | 50.1 | 4.7 | 45.2 | ||
| Al2Fe3Si3 (τ1) | Triclinic | at % | 33.9 | 28.6 | 37.5 |
| wt % | 24.0 | 21.1 | 54.9 |
© 2018 by the authors. Licensee MDPI, Basel, Switzerland. This article is an open access article distributed under the terms and conditions of the Creative Commons Attribution (CC BY) license (http://creativecommons.org/licenses/by/4.0/).
Share and Cite
MDPI and ACS Style
Shin, D.; Lee, J.-Y.; Heo, H.; Kang, C.-Y. TEM Microstructural Evolution and Formation Mechanism of Reaction Layer for 22MnB5 Steel Hot-Dipped in Al–10% Si. Coatings 2018, 8, 467. https://doi.org/10.3390/coatings8120467
AMA Style
Shin D, Lee J-Y, Heo H, Kang C-Y. TEM Microstructural Evolution and Formation Mechanism of Reaction Layer for 22MnB5 Steel Hot-Dipped in Al–10% Si. Coatings. 2018; 8(12):467. https://doi.org/10.3390/coatings8120467
Chicago/Turabian StyleShin, Dongik, Jeong-Yong Lee, Hoejun Heo, and Chung-Yun Kang. 2018. "TEM Microstructural Evolution and Formation Mechanism of Reaction Layer for 22MnB5 Steel Hot-Dipped in Al–10% Si" Coatings 8, no. 12: 467. https://doi.org/10.3390/coatings8120467
Note that from the first issue of 2016, this journal uses article numbers instead of page numbers. See further details here.