Article

Synthesis of Polydimethylsiloxane-Modified Polyurethane and the Structure and Properties of Its Antifouling Coatings

Department of Materials Science and Engineering, Dalian Maritime University, Dalian 116026, China
*
Author to whom correspondence should be addressed.
Coatings 2018, 8(5), 157; https://doi.org/10.3390/coatings8050157
Submission received: 24 March 2018 / Revised: 21 April 2018 / Accepted: 24 April 2018 / Published: 26 April 2018
(This article belongs to the Special Issue Novel Marine Antifouling Coatings)

Abstract

:
Polydimethylsiloxane (PDMS) could be used to improve the antifouling properties of the fouling release coatings based on polyurethane (PU). A series of polydimethylsiloxane-modified polyurethane coatings were synthesized with various PDMS contents, using the solvent-free method. The effects of PDMS content and seawater immersion on the chain structure and surface morphology were investigated by confocal laser scanning microscopy (CLSM), atomic force microscopy (AFM), Fourier transform infrared spectroscopy (FTIR), differential scanning calorimetry (DSC), thermogravimetric analysis (TGA) and X-ray diffraction (XRD). Based on the measurements of contact angles of deionized water and diiodomethane, surface free energies of the coatings were estimated according to the Owens two-liquid method. The PDMS-modified polyurethane exhibited lower surface free energy and a lower glass transition temperature than polyurethane. The presence of PDMS increased the degree of microphase separation, and enhanced the water resistance of the coatings. The optimum amount of PDMS reduced the elastic modulus and increased the ductility of the coating. The presence of PDMS benefited the removal of weakly attached organisms. Panel tests in the Yellow Sea demonstrated the antifouling activity of the PDMS-modified polyurethane.

1. Introduction

Biofouling is the undesirable growth of marine organisms on artificial structures immersed in the ocean. Ships hulls fouled by marine organisms experience frictional drag, increased fuel consumption, longer voyage times, higher dry-docking frequency, and increased fuel emissions [1,2]. Organisms may be transported between regions, harming local ecosystems and marine environments [3,4].
Antifouling coatings are applied on ships’ hulls to act against biofouling. Traditional antifouling coatings often contained tin and copper species, which are now or will be banned because of their environmental risks [5]. This has promoted the development of environmentally friendly antifouling coatings. Fouling-release coatings are a mature technology that has been commercialized. They do not necessarily inhibit the attachment of marine organisms, but allow only weak bonding between marine organisms and the surface. Organisms are then released with sufficient hydrodynamic force, which is applied as the ship moves through the water [6]. So far, most of investigations showed that there are currently two key types of fouling-release coatings, namely fluoropolymers and silicone-based polymer coatings [1,7].
Fluoropolymers exhibit interesting bulk and surface properties, including excellent environmental stability, water and oil repellency, low coefficients of friction, biocompatibility, excellent thermal stability and chemical resistance, and low interfacial free energies [8,9,10,11]. Silicones exhibit low glass transition temperatures (Tg), low surface energies, good biocompatibility, and high thermal and oxidative stability [12]. Fluoropolymers based on fluorocarbon backbone suffer from limited mobility because of rigidity of F–C bonds, which hinders rotation about backbone bonds. A higher critical stress is also required to sever the adhesive-substrate bond, because of their higher bulk modulus compared with elastomers. Thus, fouling that does accumulate on the surface is not easily released from rigid fluoropolymers [1,13].
Silicones exhibit better non-stick properties than fluoropolymers, because of their conformational mobile surface, low elastic modulus, and low Tg. Silicone-based coatings are the most widely used fouling-release coatings [1,9,14]. Studies have shown that the attachment of fouling organisms to such coatings can be related not only to the surface free energy, but also the elastic modulus of the coatings and other factors (e.g., thickness and smoothness) [14]. Specifically, it was experimentally confirmed that adhesion is proportional to the square root of the product of elastic modulus (E, MPa) and surface energy (γ, mJ/m2) [15,16]. Accordingly, the value of parameter γ · E can be used as a key reference for screening fouling-release coating.
Silicone-based fouling-release coatings exhibit poor adhesion to substrates and mechanical properties, are easily damaged (e.g., by cutting, tearing, puncturing). Their recoatability also needs improvement. In addition, polyurethanes not only exhibit good toughness, flexibility, substrate adhesion, but also more favorable elastomeric properties than most polymers [17]. A wide variety of monomers including macrodiols, diisocyanates and chain extenders can be employed in their synthesis [18]. Polyurethanes can also be modified by many reagents [13]. In view of these, combining polyurethane with low surface energy polymers is expected to offer outstanding antifouling ability and excellent mechanical properties and adhesion [19]. The siloxane-polyurethane coating is a robust and durable fouling-release coating. Ekin et al. [20] explored the use of polydimethylsiloxane (PDMS) oligomers terminated with hydroxylalkyl carbamate and dihydroxyalkyl carbamate groups to increase the compatibility between the polyurethane underlayer and PDMS top layer. In addition, poly (ε-caprolactone) (PCL) blocks were added to previously functionalized PDMS oligomers to further increase the compatibility between the polyurethane and PDMS [21,22]. Pieper et al. [23] prepared siloxane-polyurethane coatings from 3-aminopropyl-terminated polydimethylsiloxane, the acrylic polyols and a polyisocyanate cross linker, and showed a low-force of release in the pseudo-barnacle pull-off adhesion test.
In our previous article [24], PPG-TDI-BDO polyurethanes with different hard segment contents of 20, 30, 40, 50, 60, and 65 wt % was synthesized by polypropylene glycol (PPG), toluene diisocyanate (TDI) and 1,4-butanediol (BDO), their antifouling properties were studied. The results showed that PPG-TDI-BDO polyurethane with a hard segment content of 40 wt % displayed the best antifouling performance. We aimed to combine the advantages of siloxanes and polyurethanes to produce a favorable fouling-release coating for marine environments. Incorporating siloxane units into the polyurethane chain imparts the resulting siloxane-modified polyurethane with the properties of both polysiloxane and polyurethane. Based on the results of previous article [24], we will introduce polyether triol and PDMS in soft segment of PPG-TDI-BDO polyurethanes, control different content of PDMS and prepare a series of PDMS-modified PPG-TDI-BDO polyurethanes with a hard segment content of 25 wt %. The influence of PDMS content on the structure of the PDMS-modified PPG-TDI-BDO polyurethanes and antifouling properties of its coatings will be investigated in this article.

2. Materials and Methods

2.1. Raw Materials

Careful design of the silicone-polyurethane copolymer structure is important for obtaining a coating with favorable surface, mechanical, and adhesive properties. Toluene-2,4-diisocyanate (2,4 TDI, Wanxiang Chemical Co., Ltd. Zhengzhou, China) was used in the current study. Macrodiols can play an important role in improving the properties of polyurethanes. As a soft segment we chose polyether diol (HSH220, Jiangsu Haian Petrochemical Plant, Hai’an, China) and polyether triol (HSH330, Jiangsu Haian Petrochemical Plant). Hydroxypropyl-terminated polydimethylsiloxane (PDMS2200, Ark (Fogang) Chemical Materials Co., Ltd., Qingyuan, China) was used as the modifier. 1,4-Butylene glycol (BDO, Tianjin Kemiou Chemical Reagent Co., Ltd., Tianjin, China) is widely used as a low-molecular-weight chain extender, and was used as such in the current study. TDI and BDO constitute the hard segment of polyurethane. The characteristics of monomers are listed in Table 1. Before experiment, PDMS, HSH220 and HSH330 were dried in a vacuum oven at 120 °C, to remove any absorbed water. Dimethylbenzene, butyl acetate, cyclohexanone and BDO were dried over 4 Å molecular sieves.
Epoxy anti-rust primer and iron oxide red epoxy intermediate coating were obtained from Sunrui Marine Coatings Co., Ltd. (Xiamen, China). Silicone paint was laboratory made for control panel, and composited with carbon nano-tube and polydimethylsiloxane.

2.2. Synthesis of Polyurethane

Controlling the molar ratio of NCO to OH was equal to 1.36, the molar ratio of HSH330 to HSH220 + PDMS was equal to 0.1 and the content of hard segment (TDI + BDO) is 25 wt % in polyurethane prepolymers. The molar percentage of PDMS in HSH220 is respectively 0, 6, 13, 21, 29%, in other words, the material ratio with PDMS contents of 0, 4.2, 8.5, 12.8, and 16.9 wt %, a series of polyurethane prepolymers were prepared. They were respectively named as PU-Si0, PU-Si4, PU-Si9, PU-Si13, and PU-Si17. The formulations of five polyurethane prepolymers were listed in Table 2.
The prepolymers were prepared as follows. PDMS, HSH220 and HSH330 were added to a dry vessel equipped with a reflux condenser, mechanical stirrer, and thermometer. TDI100 was then slowly added at 30 °C under N2 atmosphere. After rapid stirring for 30 min, the temperature was maintained at 75 °C for 2 h. The temperature was then lowered to 50 °C, and BDO and DBTDL were added under stirring. The vessel was then heated at 70 °C for 3 h. The reaction mixture was cooled to room temperature, and the PDMS-modified polyurethane was obtained, which was diluted twice with one solution mixed with dimethylbenzene, butyl acetate and cyclohexanone. Their ratio is 2:2:1 of dimethylbenzene:butyl acetate:cyclohexanone as weight.

2.3. Preparation of Coating Samples

Some samples were spread onto 75 mm × 25 mm × 1 mm glass slides, which had been coated with epoxy paint, and some samples were poured into Teflon molds and solidified in an oven at 40 °C for 24 h. Panel samples for antifouling test in sea were spread onto 350 mm × 250 mm × 3 mm steel plate, pre-coated with zinc rich epoxy anti-rust primer (the thickness of nominal dry film is about 30 μm) and iron oxide red epoxy intermediate coating (the thickness of nominal dry film is about 80 μm). Because the polyurethane coating is colorless and transparent, red color resulted from iron oxide red epoxy intermediate coating. Its thickness of nominal dry film was controlled as 100 μm. The slide samples were used for surface properties and immersion test in sterilized sea water, the casted ones were used for structural analysis. Except the coatings on field panels, other samples were cured for 7 days in the constant temperature and humidity test chamber of 80% relative humidity and 25 °C. Then, the prepared samples were placed in aeration cabinet at 40 °C for 24 h. The PU coatings on field panels are cured in ambient for 2 days before immersing into sea.

2.4. Characterization

2.4.1. Structural Analysis

Attenuated total internal reflectance Fourier transform infrared (ATR-FTIR) spectra were acquired using a Frontier PerkinElmer infrared spectrometer (Thermo Fisher Scientific Inc., Waltham, MA, USA) in the range of 4000–650 cm−1, at a resolution of 2 cm−1 from the average of 16 accumulated scans. Universal ATR sampling accessory and diamond crystal plate were used for ATR-FTIR. The effective path length of infrared beam is 2 μm. In the used configuration it is a single reflection ATR accessory with high IR throughput which makes it ideal for sample identification and quantitative analysis and/or quantitative calculation applications.
Differential scanning calorimetry (DSC, NETZSCH DSC 200 F3, NETZSCH-Gerätebau GmbH, Selb, Germany) was used for studying the melting and glass transitions of polymers. Measurements were performed at a heating rate of 5 °C/min from −90 °C to 200 °C.
Thermogravimetric analysis (TGA) was performed using a NETZSCH STA 409C/CD (NETZSCH-Gerätebau GmbH) under argon at a heating rate of 5 °C/min for sample weights between 10 and 15 mg.
X-ray diffraction (XRD) patterns were recorded at 45 kV and 0.66 mA (30 W), using a Molmet/Rigaku diffractometer (Rigaku Corporation, Tokyo, Japan). A solid copper target was used in this study. The camera rotation speed was 2°/min.

2.4.2. Mechanical Properties

Six specimens of each coating for the tensile test were prepared in strips (120 mm × 20 mm × 2 mm) and then stretched on a Labthink XLM Auto Tensile Tester (Ji’nan, China). The speed of stretching is 50mm/min. Stress–strain curves, tensile strength, and elongation at break were recorded. Elastic modulus was fitted with the data, which the strain was less than 0.2 mm/mm. Average value of three tests was reported in this paper.

2.4.3. Surface Properties

Confocal laser scanning microscopy (CLSM, OLS4000, Olympus, Tokyo, Japan) was used to obtain images of the surface morphologies of the films in a non-destructive manner. A series of z-axis images were generated through optical sectioning, using a slice thickness of 0.01 μm. Each polyurethane sample was scanned at selected positions. Five confocal image stacks were acquired for five films. All images (view field: 128 μm × 128 μm) were stored and analyzed using LEXT image analysis software. Roughness is accomplished by the surface roughness measurement module in the software of LEXT (version 2.2.4, Olympus, Tokyo, Japan).
The morphologies of the samples were determined by atomic force microscopy (AFM) under ambient conditions. Samples were scanned using a Nano Scope IV Multi-Mode SPM (Digital Instruments Veeco Metrology Group, Santa Barbara, CA, USA), operating in tapping mode with software version 5.30r3. The cantilevers were 235 mm long with a tip radius of 5–10 nm, spring constant of 55 N/m, and resonance frequency of 167.19 kHz. The tapping conditions were a tune tip of 3 V, drive amplitude of 150 mV, and tapping ratio of 0.80.
Contact angle measurements were conducted using the sessile drop method on a JC2000C (Shanghai Zhongchen Co., Ltd., Shanghai, China) contact angle measuring system. A 3-µL droplet was placed on the surface using a syringe. Digital images of the droplet silhouette were captured with a charge-coupled device camera. Contact angles were evaluated using the measuring angle method. Reported contact angles are the mean of those measured at five points for each sample. The surface tension of deionized water and diiodomethane respectively are 72.8 mJ/m2 and 50.8 mJ/m2 at 20 °C. The surface free energy was calculated using the Owens two-liquid method [25] based on the measurements values of contact angle of deionized water (WCA) and diiodomethane (DCA). It was calculated as Equations (1)–(3), where σ S d denotes the dispersive force and σ s p refers to the polar force of sample surface.
σ s p = [ ( 137.5 + 256.1 × cos θ H 2 O 118.6 × cos θ C H 2 I 2 ) / 44.92 ] 2 ,
σ S d = [ ( 139.9 + 181.4 × cos θ C H 2 I 2 41.5 × cos θ H 2 O ) / 44.92 ] 2 ,
σ S = σ s p + σ S d .
Interface contact angles (ICA) of diiodomethane between seawater and the samples were also measured in situ during seawater immersion test. Every slide sample was put in a polymethyl methacrylate trough with dimension 90 mm × 35 mm × 20 mm, and immersed in 40 mL sterilized seawater. After immersion for a predetermined time, a 3-µL droplet of diiodomethane was dripped at the interface, the images were captured at set intervals and then contact angles measured.

2.4.4 Antifouling Property

To test the antifouling properties of the PDMS-modified polyurethane samples, coatings panels were immersed in the Yellow Sea at depths from 0.5 to 2 m in the Lvshun Port, China, between April and June 2014. The samples were checked regularly to monitor the progress of the fouling process. The salinity was 3.2%, and the average temperature was 22 °C. A control sample containing a silicone resin fouling-release coating was tested under the same conditions for comparison. The surface state of panels immersed were checked regularly and taken pictures by camera. After the images were deducted the invalid area of the edge, transformed by gray scale and selected manually the range of gray scale, the objects were counted and the area of each object was measured by using the software Image-Pro Plus (version 5.1.0.20, Media Cybernetics, Rockville, MD, USA), the coverages of marine organism were evaluated. The coverage of marine organisms means that the area covered by the attached organisms accounts for the percentage of the effective area of the panel.

3. Results and Discussions

3.1. Influence of Polydimethylsiloxane (PDMS)

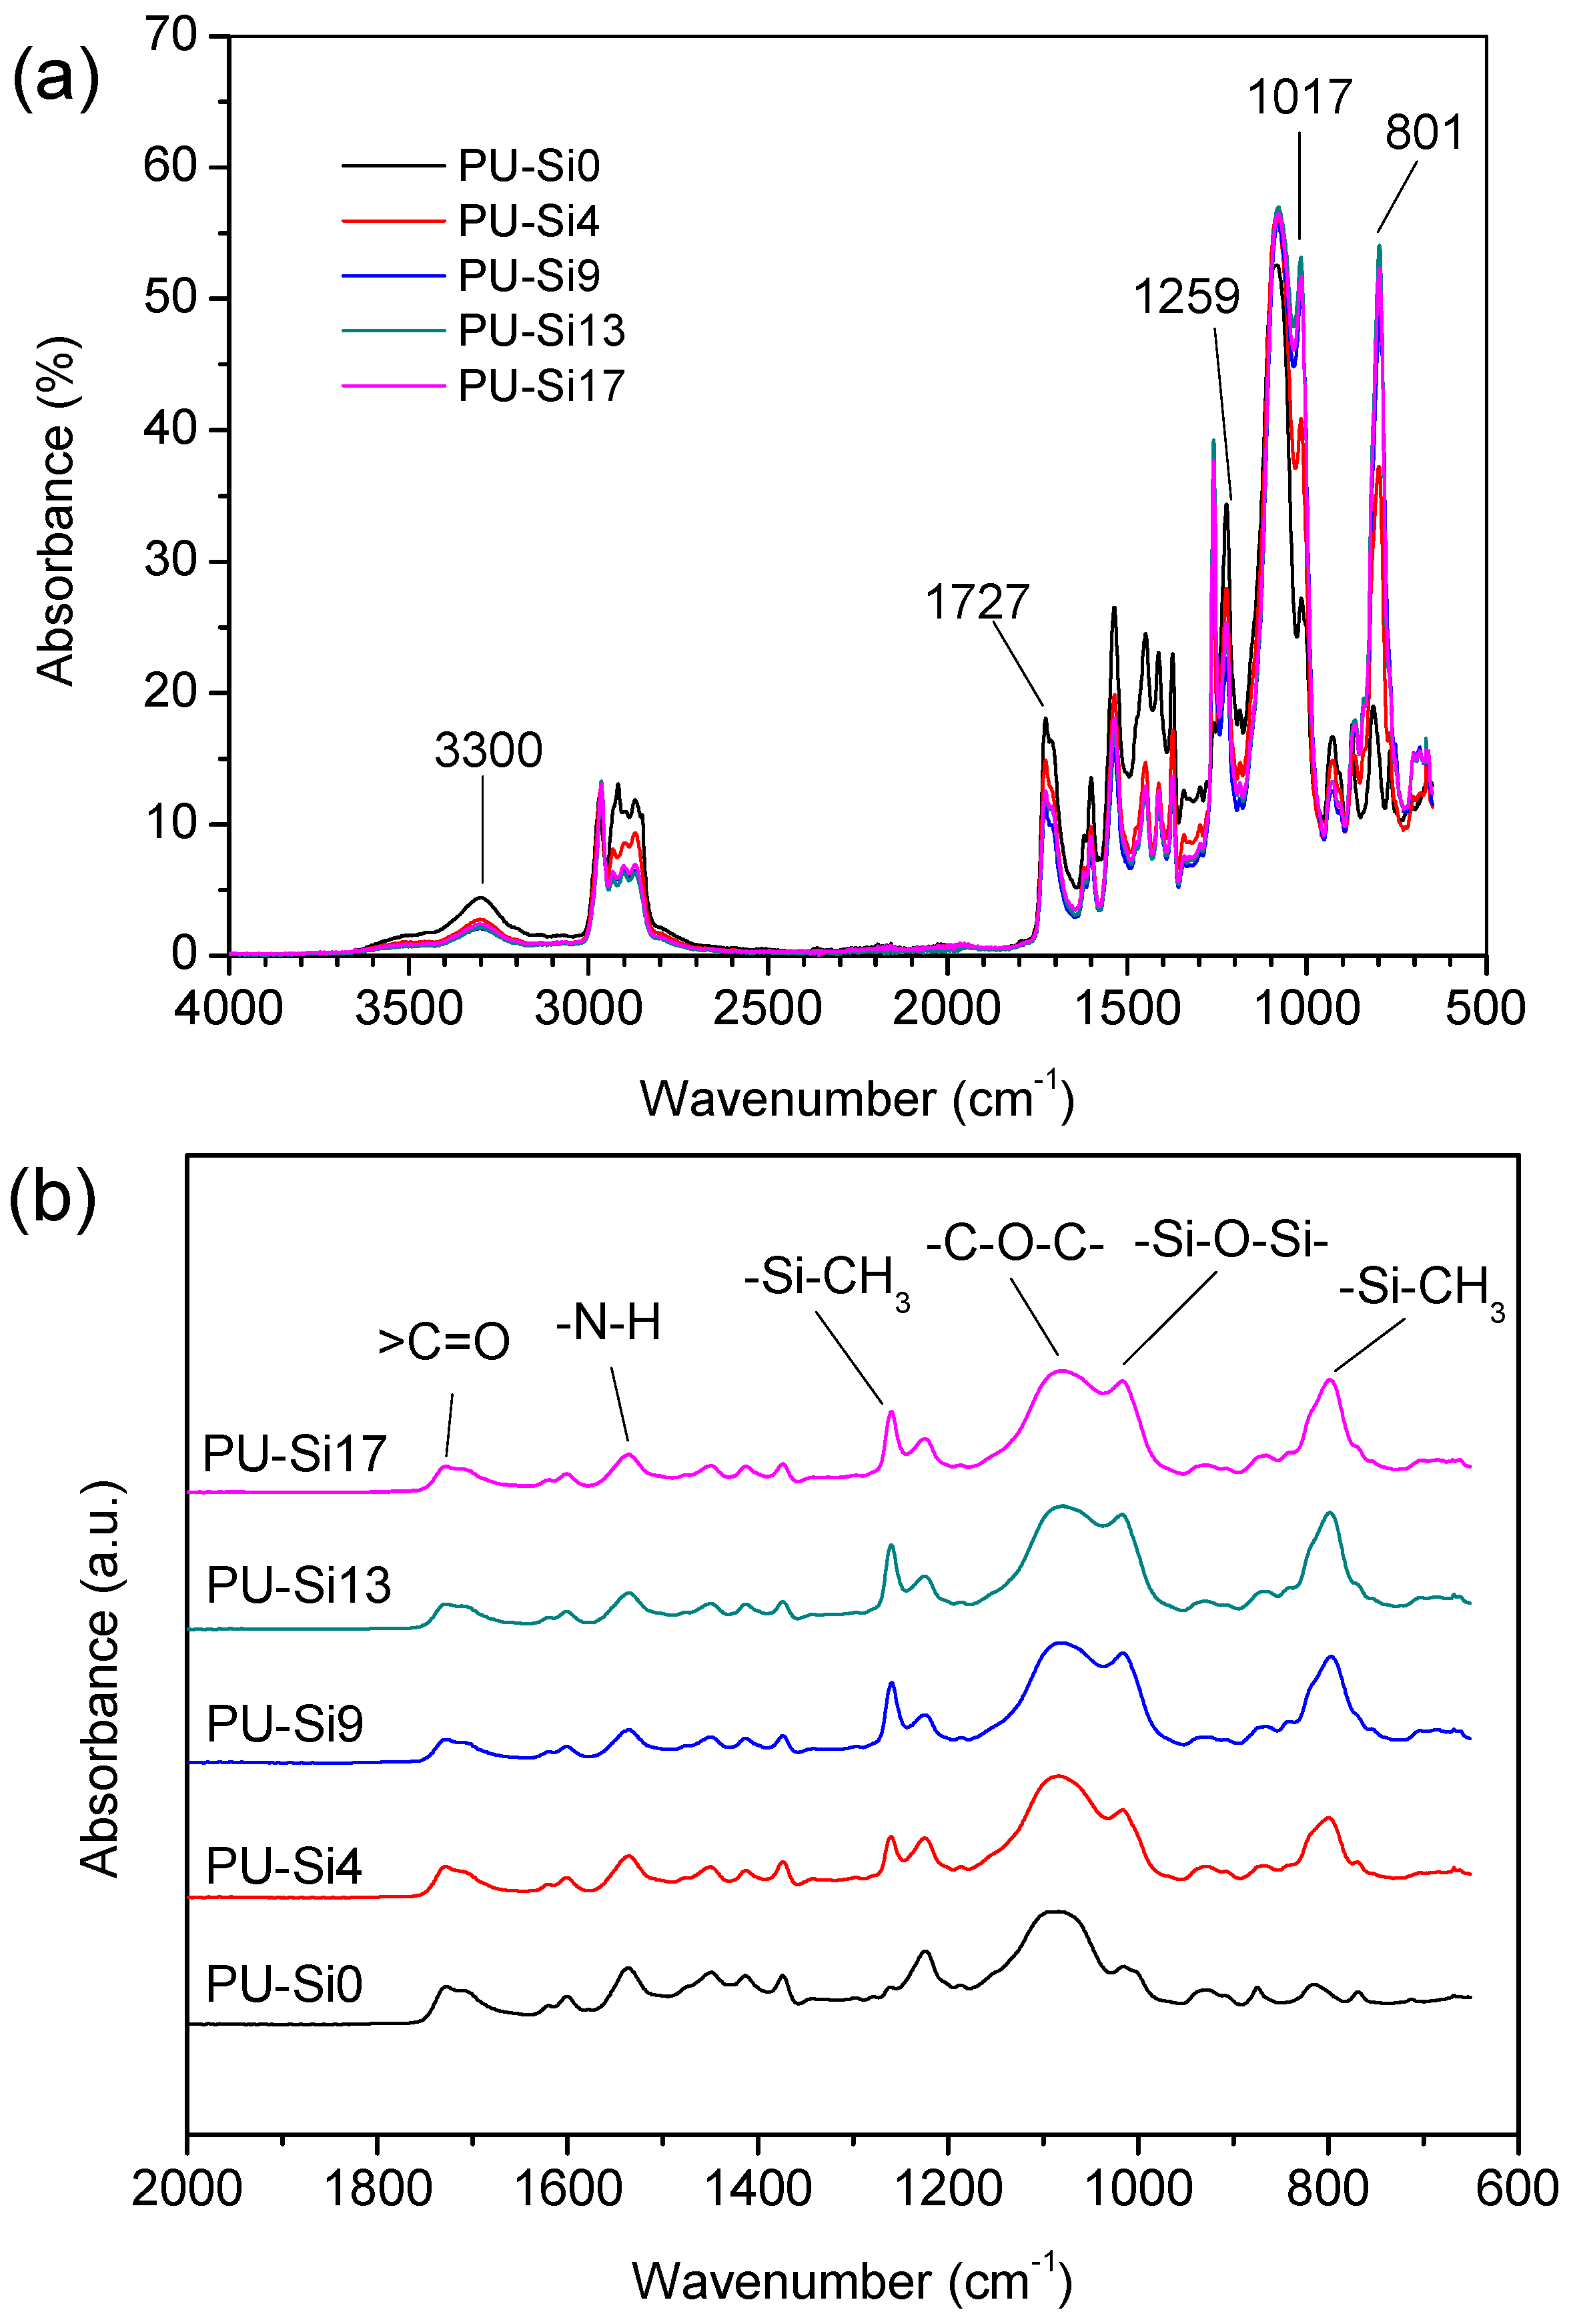
3.1.1. Molecular Structure

The synthesis of PU-Sis involved reaction between the isocyanate and hydroxyl groups to form a urethane group. Figure 1a,b shows the FTIR spectra of the PU-Sis samples. Characteristic peaks of hydrogen-bound N−H at 3300 cm−1 and urethane carbonyl groups at 1727 cm−1 were observed. No isocyanate peak at 2270 cm−1 was observed in any of the spectra, indicating that all −NCO groups were consumed during reaction. The characteristic peaks of siloxane groups at 1259, 1017, and 801 cm−1 indicated that all PDMS was incorporated into the copolymer [26].
Peaks at 3300 cm−1 (hydrogen-bound N−H), 1727 cm−1 (free urethane carbonyl), 1705 cm−1 (hydrogen-bound carbonyl) and 1600 cm−1 (benzene) weakened obviously with the addition of PDMS. The intensities of siloxane group peaks at 1259 cm−1 (Si−CH3 bending), 1017 cm−1 (Si−O−Si stretching), and 801 cm−1 (Si−CH3 rocking) increased with increasing PDMS content. This indicated that more and more PDMS present in PU-Sis samples with increasing PDMS content. XRD is a bulk characterization technique that can provide direct evidence for crystalline or amorphous in segmented and block copolymers, and was used to investigate the microstructures of the PU-Sis films. The XRD patterns of the samples (Figure 2) were similar, with intense and weak broad diffractions at 2θ = 20° and 42°, respectively. The former shows that there is micro crystalline domain in the hard segment of polyurethanes. The latter is typical of amorphous polymers. In addition, weaker peak observed at 2θ = 12° appears only in the samples containing PDMS. With the increase of the content of the PDMS, the intensity of the peaks decrease, the order degree in the polyurethanes decrease. Adding PDMS resulted in the characteristic diffraction peak at 21.28° shifting to 20.63°, because of the narrower molecular width of PDMS compared with pure polyurethane [27].
DSC curves of PU-Si0 and PU-Si17 are shown in Figure 3, and show clear glass transitions. The Tg values of PU-Si0 and PU-Si17 were −37.9 and −46.6 °C, respectively. The lower Tg of PU-Si17 was due to the PDMS has lower glass transition. Tg of PDMS is 2000 g/mol should be around −120 °C. With the increase of PDMS content, the glass transition temperature of silicone modified polyurethane decreases. The decrease may be due to partial mixing of the soft segment of urethane with the PDMS. Poly(ether-urethanes) exhibit additional interactions between urethane N−H and ether groups [28]. The decrease in polyether content reduced hydrogen bonding between the hard and soft segments, which increased phase separation and lowered the Tg. The crystallization peak of the soft segment at −17.4 °C for PU-Si0 was identical to that for PU-Si17. The melting peaks of the hard segments in PU-Si0 and PU-Sis17 were observed at 50 and 86.6 °C, respectively. This increased temperature was also caused by phase separation. The hard domain in PU-Si17 contained less soft segment, and thus exhibited a higher melting temperature.
TGA scans of the PU-Sis series were collected under argon at a heating rate of 5 °C/min to detail the thermal degradation (Figure 4). All samples showed a 5 wt % loss at 238–272 °C.

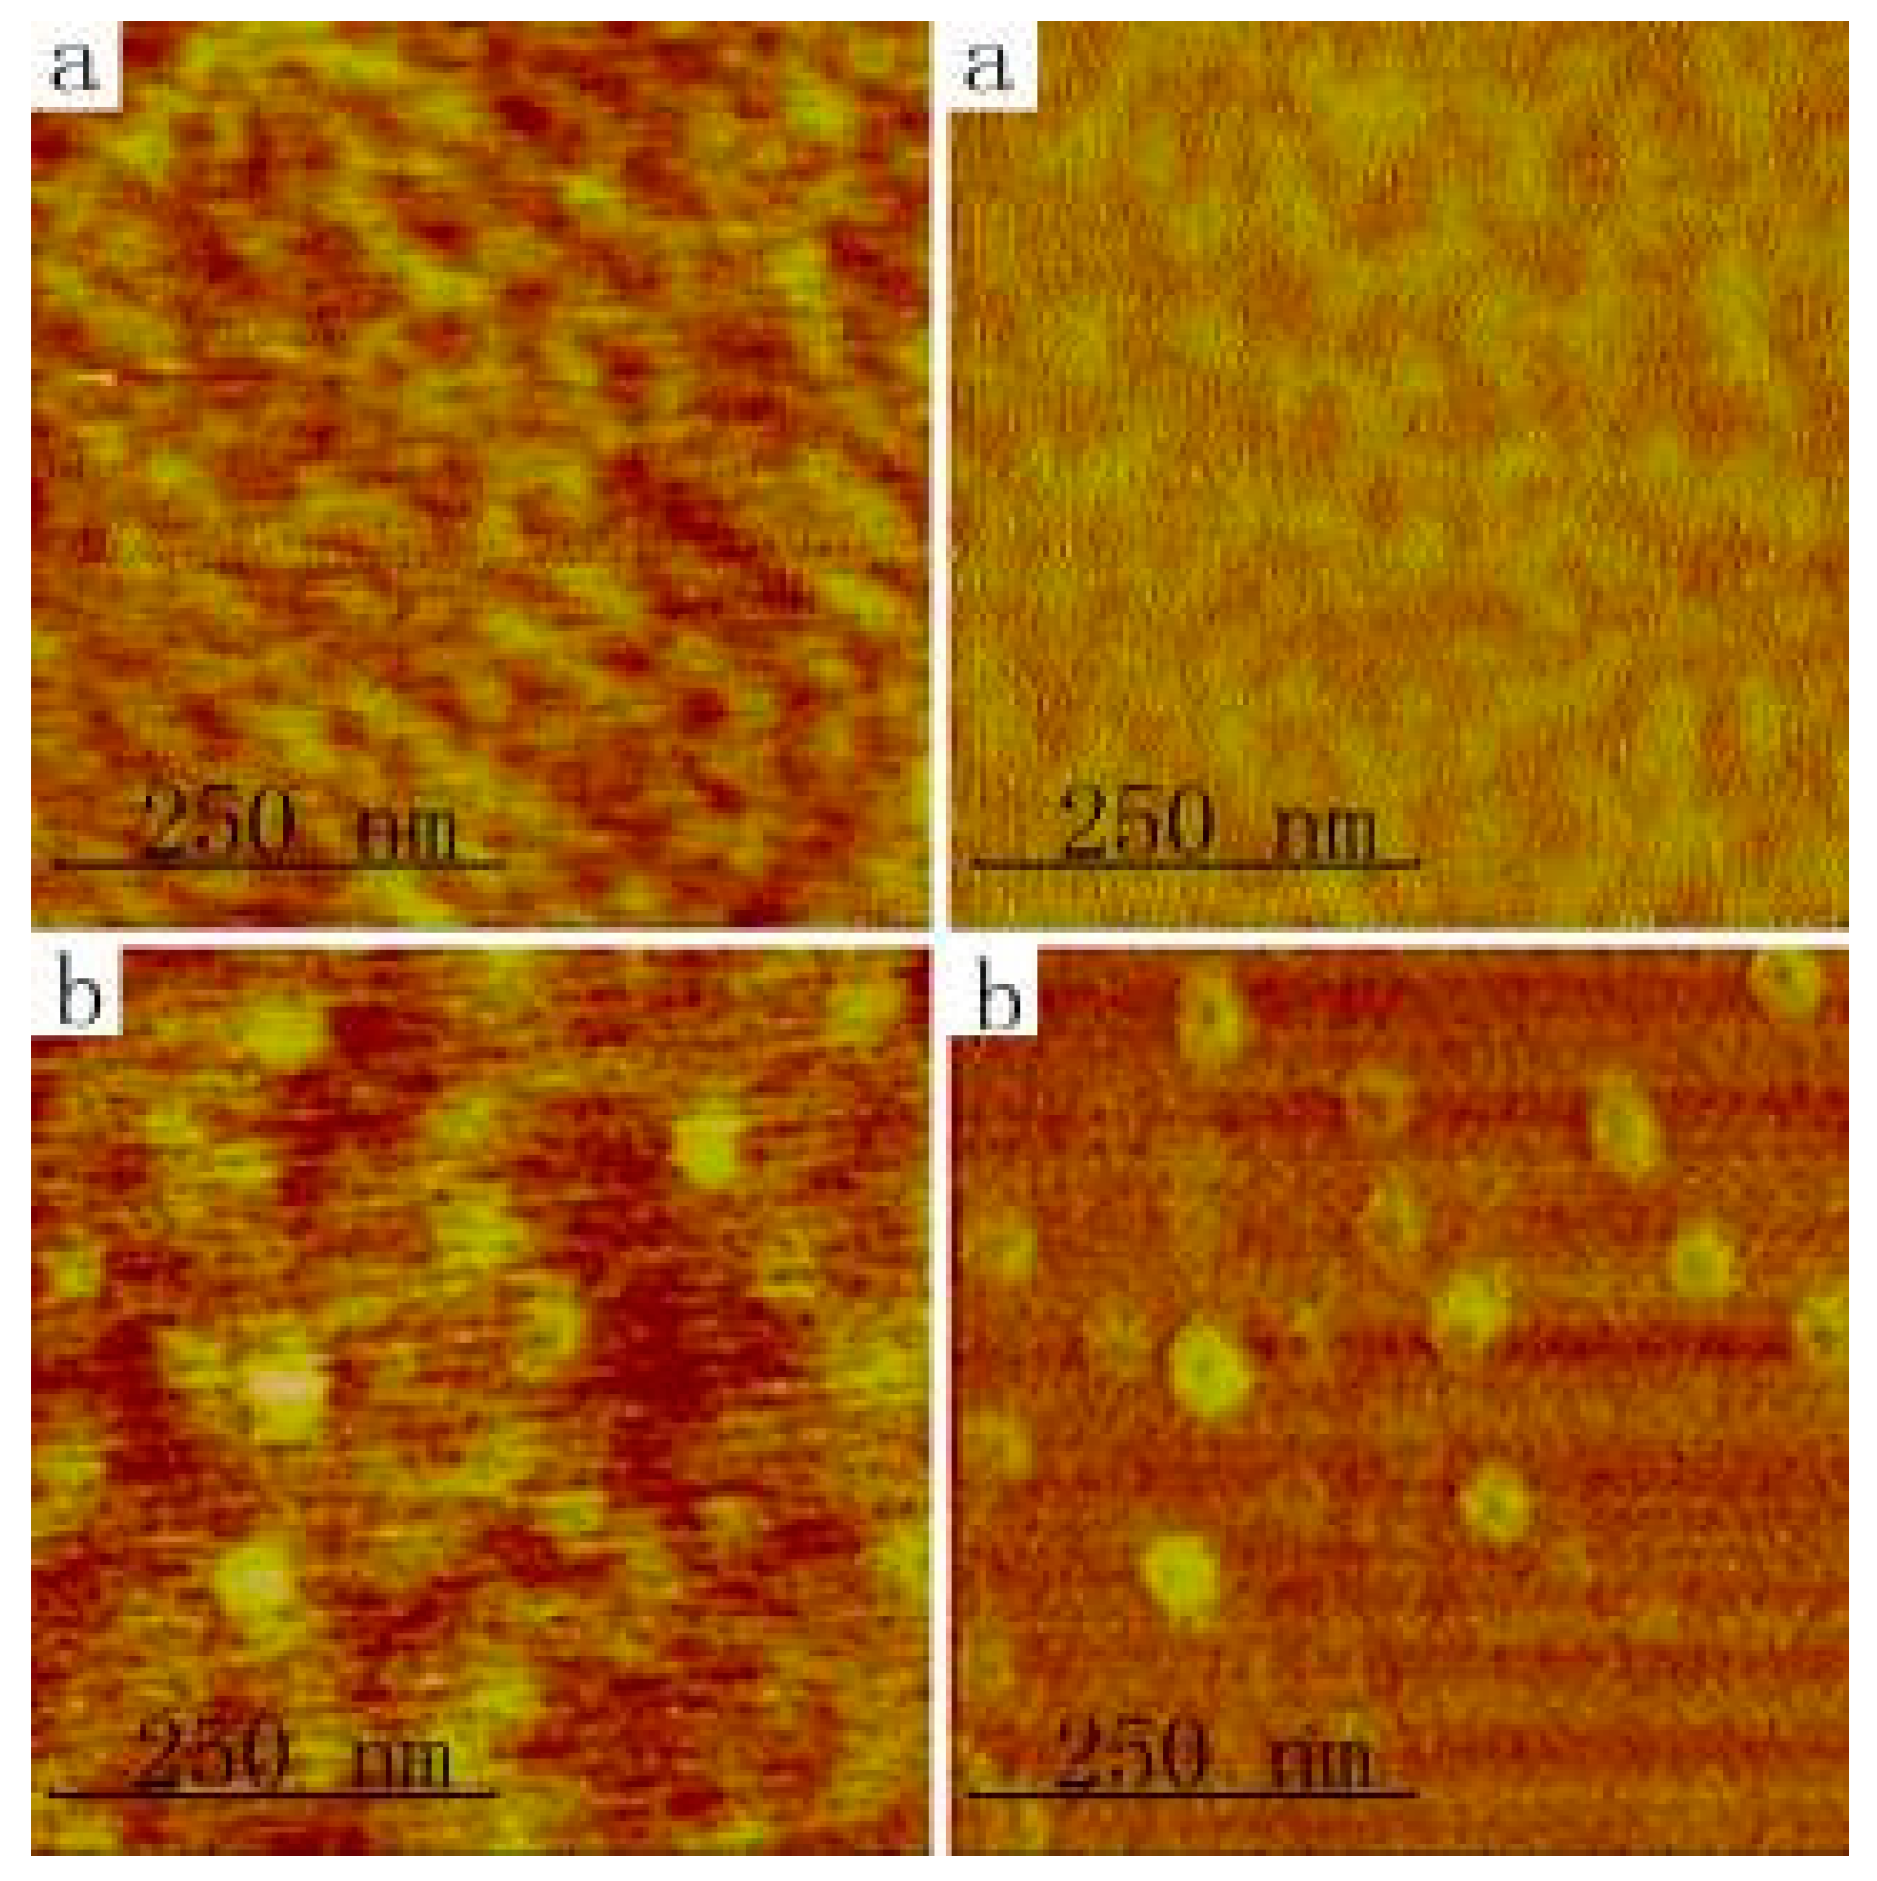
3.1.2. Surface Topography

Figure 5 shows trends in surface roughness of the PU-Sis samples, as determined in the field of 128 μm × 128 μm by CLSM. This trend could be explained by phase separation, and the tendency of PDMS to enrich on the copolymer surface. Introducing PDMS in PU increased the phase separation, so the surface of PU-Si4 was rougher than that of PU-Si0. Increasing the PDMS ratio also enriched the PDMS content on the copolymer surface, which led to the lower surface roughness observed for PU-Si9. This enrichment in PDMS had reached saturation in PU-Si9. Phase separation continued to increase with increasing PDMS content, which increased the roughness from PU-Si9 to PU-Si13 and then to PU-Si17.
AFM was used to observe the phase-separated microstructures of the PU-Sis samples in the field of 500 nm × 500 nm. The regular texture is shown by the AFM height and phase maps of PU-Si0 in Figure 6. During AFM scanning, smaller phase angles indicate harder or more rigid materials, whereas higher phase angles indicate the presence of softer material such as PDMS. In view of the above, the bright phase should be soft PDMS domains, as shown in Figure 6b AFM phase (right) maps. Based on this conclusion, we can conclude that the bright phase in Figure 6b AFM height (left) maps is soft PDMS domains. The fact indicates that the soft PDMS domains do not appear as dips, but as bulges on the surface of polyurethane. Very prominent surface features were observed for the coatings with high content of PDMS. This is similar to the results of the reference [1]. PU-Si0 contained alternating small soft and hard regions, which indicated phase separation. In the height images, soft regions are represented by lighter coloring. Urethanes self-associate by forming intermolecular hydrogen bonds between the N−H and carbonyl groups. Poly(ether-urethanes) contains additional interactions between urethane N−H and ether groups. The phase boundary was not clearly defined, because of hydrogen bonding between urethane N−H and ether groups. Light regions in the phase map of PU-Si17 corresponded to PDMS domains. PDMS domains tended to aggregate during film formation. A sufficiently high surface PDMS concentration resulted in the PDMS chains beginning to aggregate. The phase-separated microstructure is similar to that showed in reference [21].

3.1.3. Mechanical Properties

The tensile properties of the polyurethane samples were examined. The results listed in Table 3 showed that the tensile strength of all PU-Sis samples is higher than that of the PU samples, and increases with increasing PDMS contents. Except of the PU-Si9 samples, the elongation at break of other PU-Sis samples is lower than that of the PU samples. The PU-Si9 samples represent not only the highest elongation at break, but also the lowest elastic modulus. It means that the PU-Si9 samples have excellent ductility.

3.1.4. Interface Characterization

The change in molecular chain structure and topography of the surface layer affected the interfacial properties of the PU-Sis samples. The interface properties were characterized by water contact angle (WCA) and diiodomethane contact angle (DCA) measurements and surface free energy calculations. Figure 7 shows that the WCAs of all the PU-Sis samples were >100°, which indicated hydrophobicity. The DCA of PU-Si0 was smaller than those of PU-Si4, PU-Si9, PU-Si13 and PU-Si17, which resulted from the enrichment of PDMS on the surface. The WCAs of PU-Si13 and PU-Si17 are lower than that of PU-Si4 and PU-Si9, which may have resulted from surface roughness.
Figure 8 shows the surface free energies and their corresponding polar and dispersive components of the PU-Sis samples. The surface free energies and components were calculated from contact angle measurements according to the Owens two-liquid method [25]. The test liquids were deionized water and diiodomethane. The total surface free energies of PU-Si4, PU-Si9, PU-Si13 and PU-Si17 were approximately 5 mJ/m2 lower than that of PU-Si0. PU-Si0 had the highest polar component and lowest dispersive component of the surface free energy. Samples containing PDMS exhibited similar dispersive components.

3.2. Influence of Seawater Immersion

Seawater immersion experiments were carried out to understand the water resistance of the PU-Sis samples. Following immersion, the properties of the samples were investigated by FTIR spectroscopy, DSC, AFM, CA measurements, and surface free energy calculations.

3.2.1. Fourier Transform Infrared (FTIR) Analysis

Figure 9 shows the FTIR spectra of PU-Si0 before and after immersion in seawater. The intensities of peaks at 876 cm−1 (out-of-plane flexural vibration of benzene C−H) and 1413 cm−1 (vibration of benzene ring) were significantly enhanced after immersion in seawater. Figure 10 shows the FTIR spectra of PU-Si4 before and after immersion in seawater. The intensities of peaks at 801 cm−1 (Si−CH3 rocking vibration) and 1259 cm−1 (Si−CH3 symmetric bending) decreased after immersion in seawater. This may have been caused by polar groups migrating toward the surface during seawater immersion, effectively decreasing the content of nonpolar PDMS.
Figure 11 shows the absorption reduction at 801 and 1259 cm−1 of samples containing PDMS after immersion. The absorptivity reduction at 801 cm−1 decreased with increasing PDMS content. This indicated that the water resistance of PU-Sis increased with increasing PDMS content.

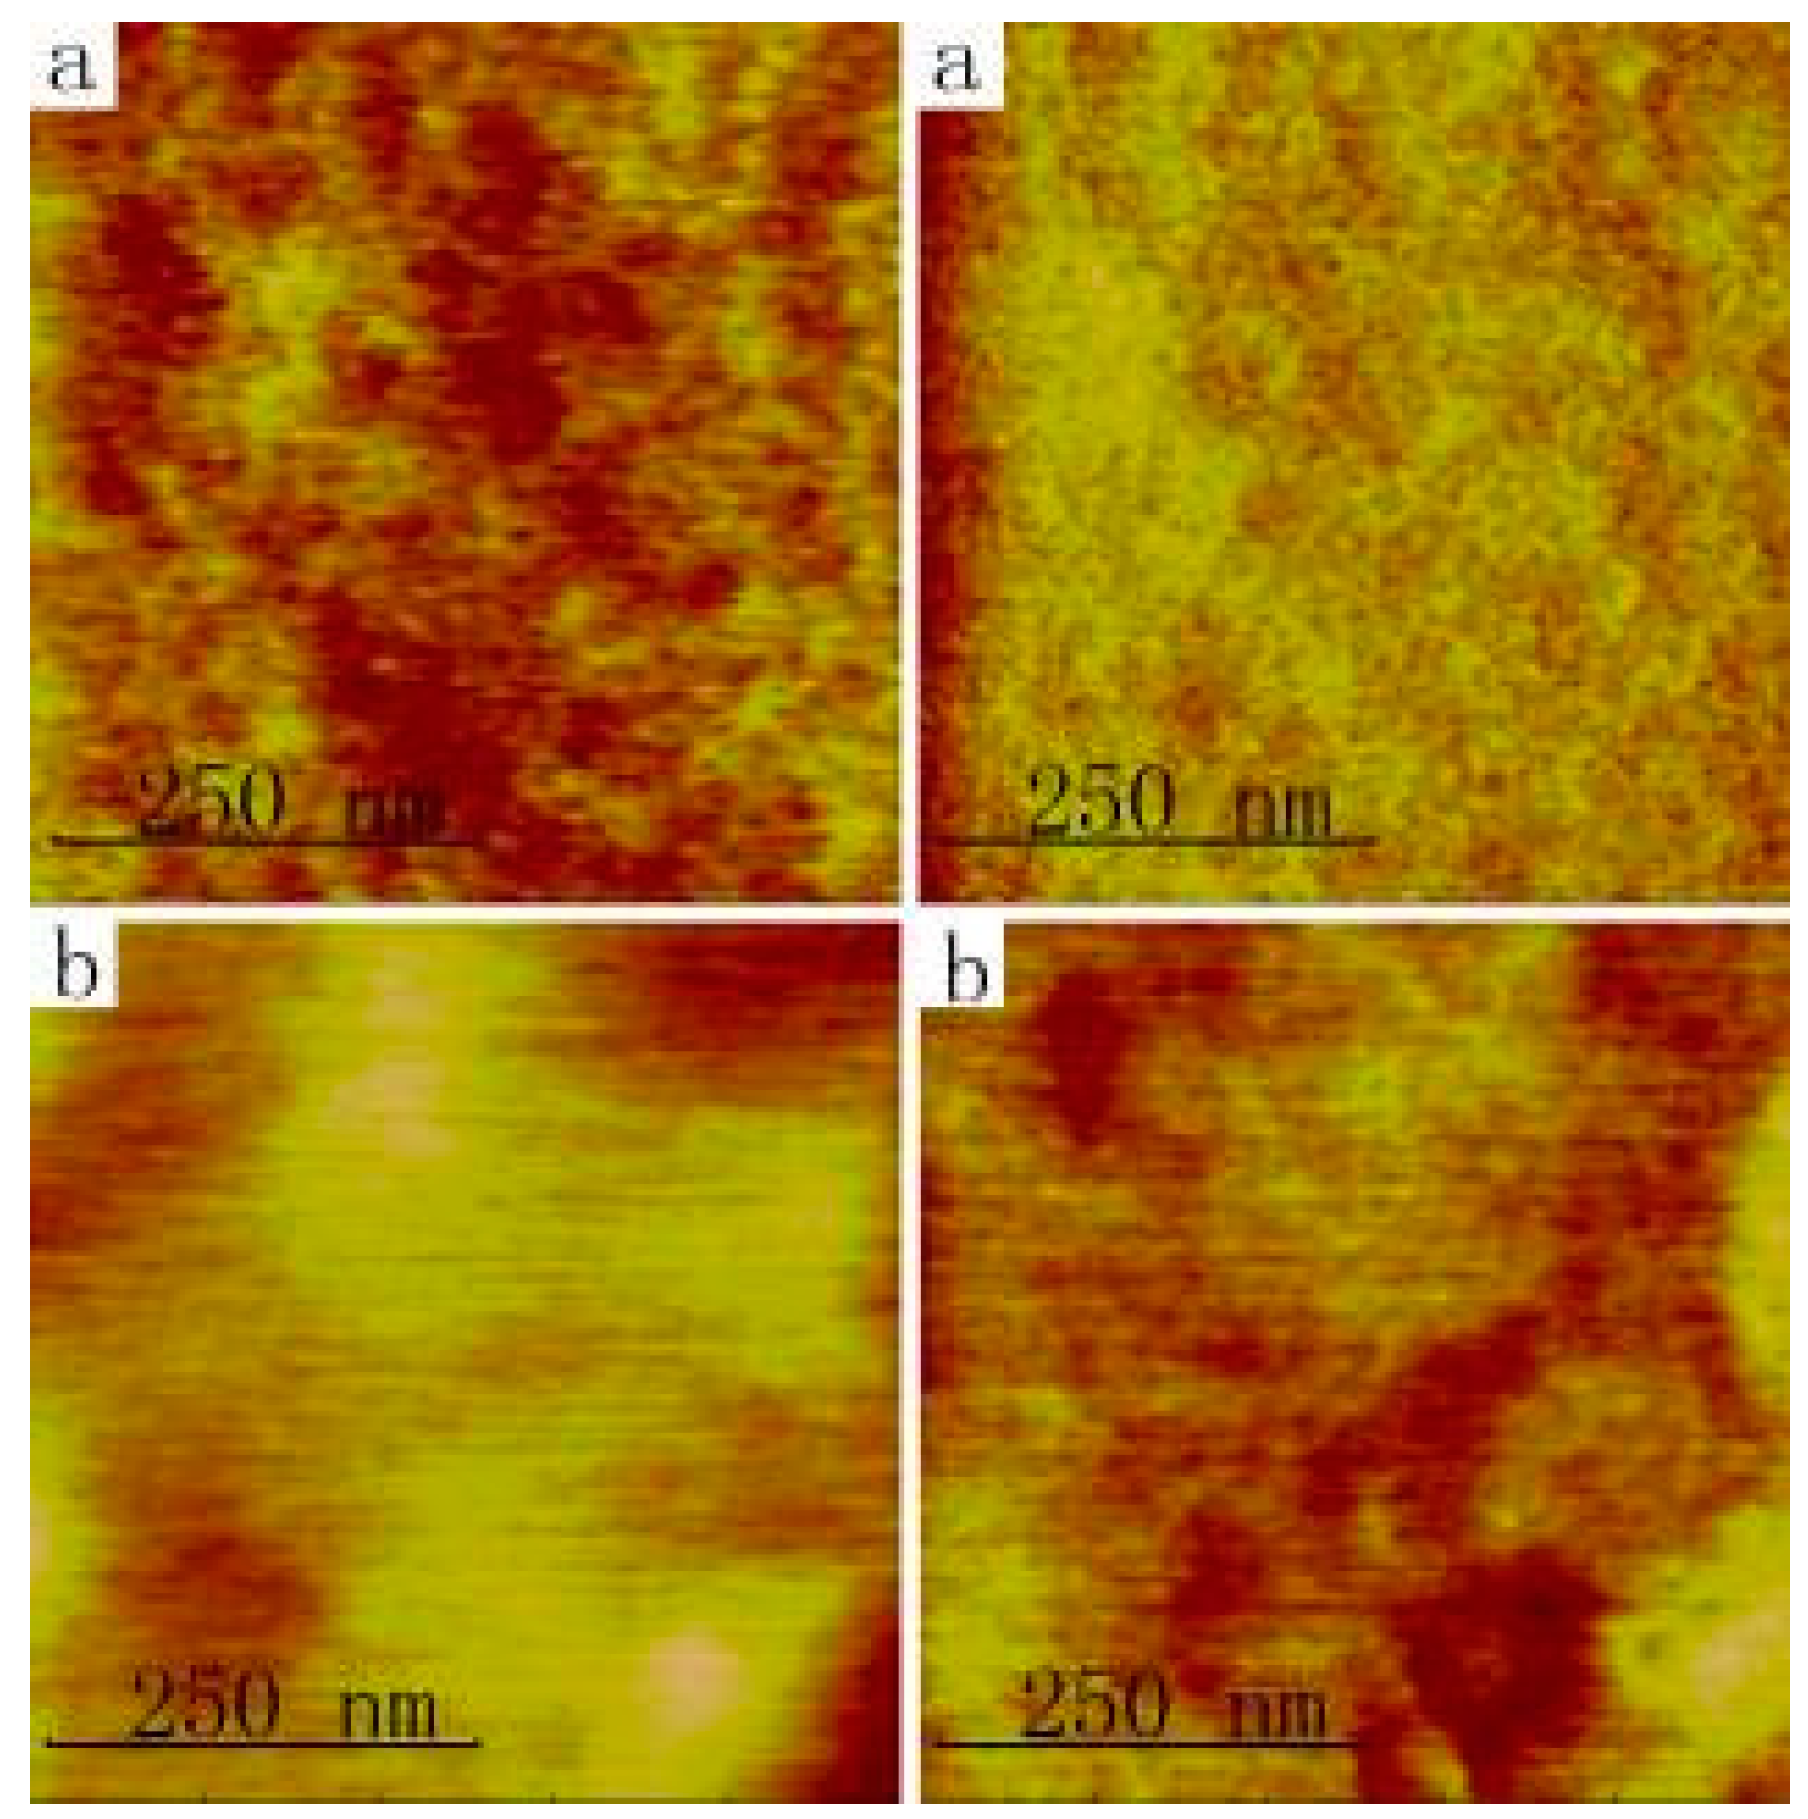
3.2.2. Atomic Force Microscopy (AFM) Analysis

Figure 12 shows AFM height and phase maps in the field of 500 nm × 500 nm of PU-Si0 and PU-Si17 after immersion in seawater. The texture of the height and phase maps of PU-Si0 after immersion was not regular. This was attributed to seawater influencing H-bonding interactions and phase separation. The height map of PU-Si0 contained small bulges, and exhibited an increase in surface roughness. The surface of PU-Si17 contained bulges that were larger and smoother. This was attributed to hard domains under the surface migrating toward the surface during immersion.

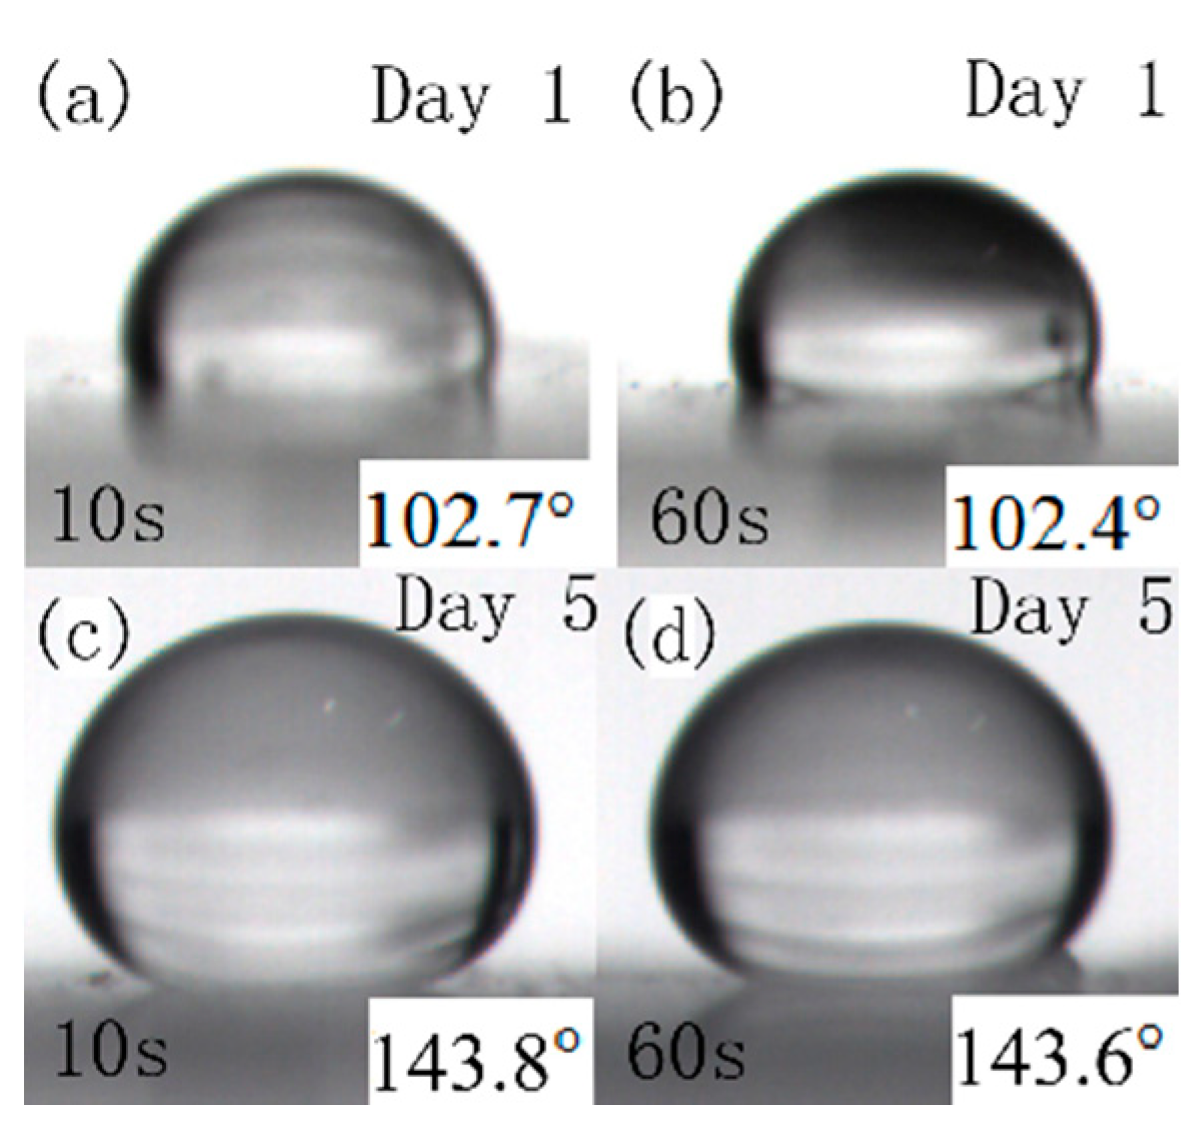
3.2.3. Water Contact Angle (WCA) and Surface Free Energy

The WCA of PU-Si0 decreased from 104° to 74° (hydrophilicity) upon immersion. Figure 13 shows the WCA reductions of the PU-Sis samples after immersion in seawater. The WCA reductions of PU-Si4, PU-Si9, PU-Si13 and PU-Si17 were small, and decreased slightly with increasing PDMS content. Figure 14 shows that the surface free energy of PU-Si0 increased from 25.1 to 38.7 mJ/m2 after immersion. The polar and dispersive components of PU-Si0 both significantly increased after immersion.
The surface free energies of PU-Si4, PU-Si9, PU-Si13 and PU-Si17 also increased after immersion. The magnitudes of these increases were similar to that of PU-Si0. This was attributed to hard segments migrating toward the surface during immersion. The dispersive components of the four PDMS-containing samples showed little change upon immersion, which was attributed to PDMS segments on the surface. These PDMS chains migrated to the surface of the copolymer film, forming a uniform hydrophobic layer with a low surface energy.

3.2.4. Interface Contact Angles (ICA) In-Situ Measurements during Immersion in Seawater

As mentioned earlier, the chemical properties of the coating surface change upon immersion in seawater as the surface molecules of the coating rearrange and the polar hard segments move to the surface of the coating. Hence, to better evaluate the interface behavior of the polyurethane coatings during seawater immersion, diiodomethane was selected for in-situ measuring ICA. Due to that diiodomethane has significant solubility in water (1.2 g/L). With increasing time immersed in seawater of diiodomethane droplet, we are afraid that in case of the diiodomethane dissolved in water, it might lead to smaller measurements. To evaluate its effect, we carried out a long time in-situ observation of diiodomethane droplets on the interface between seawater and coating. The results of PU-Si17 coating respectively immersed one day and five days were showed in Figure 15. With increasing of immersion time, both of the droplet and ICA changed smaller. However, as showed in Figure 16, in which Figure 16a,b for coating immersed one day in sterilized seawater, Figure 16c,d for coating immersed five days. Figure 16a,c for dripped diiodomethane droplet in 10 s, and Figure 16b,d at 60 s. Quite evidently, the dissolution of diiodomethane was not obvious at the early stage of immersion in seawater, and the change of shape of droplets and interface contact angle were not obvious. In order to ensure the validity and comparability of the measurement results during the experiment, the images were frozen after dripped in ten seconds. Based on these images, the measured results of ICA of all samples were reported in Figure 17.
The ICA increases with increasing immersion time, the ICA tends to be stable after four days immersion. It increases from around 100° at early immersion to 135° after five days immersion. Similarly phenomenon used to observe for the PPG-TDI-BDO polyurethane coatings in previous research [24]. When immersed in seawater, polyurethane coatings will exhibit different physicochemical properties from those exposed in air. Because polar hard segments tended to migrate toward the coating surface during immersion, it tends to form a hydrophilic and oleophobic surface. The enhanced oleophobicity further inhibited the adhesion of marine organisms. The increase in the contact angle may also have some contribution from an increase in surface roughness caused by the collapse of surface PDMS chains underwater.

3.3. Antifouling Properties of the PU-Sis Samples

The antifouling properties of the PU-Sis coatings were investigated by immersing coated panels in the Yellow Sea, China. A PDMS fouling-release coating was also tested as a control. Its surface free energy is 26.07 mJ/m2, its elastic modulus is 0.31 MPa. The panels were coated with PDMS-modified polyurethane. Because the polyurethane coating is transparent, the red color resulted from the intermediate coat. Because of the uncontrollable factors, the panels were regretfully found having fallen into the sea at the time of three months of inspection. Therefore, this article can only give the photographs until immersion for 77 days. The photographs of the panels after immersion for 25 and 77 days are shown in Figure 18. The calculated coverages are shown in Table 4. Only a few green algae were adhered to the PU-Sis panels after 77 days. Although the effect of PDMS content is not obvious on the antifouling properties of the PU-Sis coatings, it can be seen that the difference between the PDMS-modified polyurethane and the polyurethane coating. The PU-Si0 panel was partly covered by bacterial biofilm. The control silicone panel was not only covered wholly by bacterial biofilm, but also by macroalgae. This demonstrated obviously the enhanced antifouling activity of the PDMS-modified polyurethane, compared with the control sample and non-modified polyurethane. However, it does not enhance with increasing PDMS content, nor with decreasing the surface free energy of the PDMS-modified polyurethane.
The relative adhesion factor γ · E values of the coatings with different PDMS contents are also listed in Table 4. As observed, the relative adhesion factor decreases significantly with increasing PDMS contents, it reaches the lowest at PU-Si9 sample, then it increases with increasing PDMS contents. For the PDMS-modified polyurethane coatings, it seems that the bigger the relative adhesion factor is, the more the coverage of marine organism is. However, the values obtained therein were inconsistent well with the panel test results, thereby indicating that the relative adhesion factor is inappropriate for characterizing the adhesion properties (or antifouling performance) of the PDMS-modified polyurethane coatings examined herein. In other words, the antifouling performance is dependent not only on mechanical properties and surface free energy, but also on the properties of the coating such as topography and surface structure stability in seawater.

4. Conclusions

This study investigated the effect of incorporating PDMS on the structure and morphology of polyurethane, and the effect of immersing the resulting PU-Sis materials in seawater. PDMS-modified polyurethane samples of different PDMS contents were prepared. The structure and morphology of the segmented polyurethanes were analyzed by various methods.
(1)
Clear microphase separation was observed in polyurethane, but decreased or even disappeared after immersion in seawater. Incorporating PDMS weakened H-bonding between the soft and hard phases, and increased phase separation. The size of the soft and hard domains also increased. Phase separation was not observed on the surface of samples containing PDMS, because the surface layer was enriched in PDMS.
(2)
The flexible PDMS segments decreased the Tg of polyurethane. This improved the flexibility and elasticity of polyurethane, so fouling organisms could be more readily removed.
(3)
PDMS chains migrated toward the film surface, forming a uniform hydrophobic layer with a low surface free energy. This surface enrichment of PDMS increased with increasing PDMS content. Because of this enrichment, PU-Si4, PU-Si9, PU-Si13 and PU-Si17 exhibited low surface energies, and were stable toward immersion in seawater. During seawater immersion, polar groups have an upward tendency.
(4)
Immersed panels tests in seawater demonstrated the antifouling activity of the PDMS-modified polyurethane. However, it was not the case that the higher the PDMS content, the better the antifouling performance of the PDMS-modified polyurethane. The best modified polyurethane is with 8.5 wt % PDMS. It is a promising material for fouling-release coatings.

Author Contributions

Y.-H.Q., X.-F.S. and Z.-P.Z. conceived and designed the experiments; X.-F.S. and L.-Y.C. performed the experiments; X.-F.S. and Z.-P.Z. analyzed the data; Z.-P.Z., Y.-H.Q. and L.-Y.C. contributed reagents/materials/analysis tools; Z.-P.Z., X.-F.S. and Y.-H.Q. wrote the paper.

Acknowledgments

This work was supported by National nature science foundation of China (51079011, 51179018), The Defense Funds. The authors gratefully acknowledge for financial support.

Conflicts of Interest

The authors declare no conflict of interest.

References

  1. Galhenage, T.P.; Webster, D.C.; Moreira, A.M.S.; Burgett, R.J.; Stafslien, S.J.; Vanderwal, L.; Finlay, J.A.; Franco, S.C.; Clare, A.S. Poly(ethylene) glycol-modified, amphiphilic, siloxane–polyurethane coatings and their performance as fouling-release surfaces. J. Coat. Technol. Res. 2017, 14, 307–322. [Google Scholar] [CrossRef]
  2. Cavas, L.; Yildiz, P.G.; Mimigianni, P.; Sapalidis, A.; Nitodas, S. Reinforcement effects of multiwall carbon nanotubes and graphene oxide on PDMS marine coatings. J. Coat. Technol. Res. 2018, 15, 105–120. [Google Scholar] [CrossRef]
  3. Yamaguchi, T.; Prabowo, R.E.; Ohshiro, Y.; Shimono, T.; Jones, D.; Kawai, H.; Otani, M.; Oshino, A.; Inagawa, S.; Akaya, T. The introduction to Japan of the Titan barnacle, Mega balanus coccopoma (Darwin 1854) (Cirripedia: Balanomorpha) and the role of shipping in its translocation. Biofouling 2009, 25, 325–333. [Google Scholar] [CrossRef] [PubMed]
  4. Hopkins, G.A.; Forrest, B.M. A preliminary assessment of biofouling and non-indigenous marine species associated with commercial slow-moving vessels arriving in New Zealand. Biofouling 2010, 26, 613–621. [Google Scholar] [CrossRef] [PubMed]
  5. Selim, M.S.; Shenashen, M.A.; El-Safty, S.A.; Higazy, S.A.; Selim, M.M.; Isago, H.; Elmarakbi, A. Recent progress in marine foul-release polymeric nanocomposite coatings. Prog. Mater. Sci. 2017, 87, 1–32. [Google Scholar] [CrossRef]
  6. Kavanagh, C.J.; Quinn, R.D.; Swain, G.W. Observation of barnacle detachment from silicones using high-speed video. J. Adhes. 2005, 81, 43–868. [Google Scholar] [CrossRef]
  7. Chambers, L.D.; Stokes, K.R.; Walsh, F.C.; Wood, R.J.K. Modern approaches to marine antifouling coatings. Surf. Coat. Technol. 2006, 201, 3642–3652. [Google Scholar] [CrossRef]
  8. Almeida, E.; Diamantino, T.C.; Sousa, O.D. Marine paints: The particular case of antifouling paints. Prog. Org. Coat. 2007, 59, 2–20. [Google Scholar] [CrossRef]
  9. Jiang, M.; Zhao, X.L.; Ding, X.B.; Zheng, Z.H.; Peng, Y.X. A novel approach to fluorinated polyurethane by macromonomer copolymerization. Eur. Polym. J. 2005, 41, 1798–1803. [Google Scholar] [CrossRef]
  10. Ameduri, B.; Boutevin, B.; Kostov, G. Fluoroelastomers: Synthesis, properties and applications. Prog. Polym. Sci. 2001, 26, 105–187. [Google Scholar] [CrossRef]
  11. Eduok, U.; Faye, O.; Szpunar, J. Recent developments and applications of protective silicone coatings: A review of PDMS functional materials. Prog. Org. Coat. 2017, 111, 124–163. [Google Scholar] [CrossRef]
  12. Fatima, J.; Tuula, T.P. Incorporation of polydimethylsiloxane into polyurethanes and characterization of copolymers. Eur. Polym. J. 2011, 47, 1694–1708. [Google Scholar]
  13. Brady, R.F. A fracture mechanical analysis of fouling release from nontoxic antifouling coatings. Prog. Org. Coat. 2001, 43, 188–192. [Google Scholar] [CrossRef]
  14. Gui, T.J. Preparation and Characterization of the Organic Silicone/Fluorine Antifouling Coatings with Low Surface Energy. Ph.D. Thesis, Ocean University of China, Qingdao, China, 2008. [Google Scholar]
  15. Baier, R.E.; Shafrin, E.G.; Zisman, W.A. Adhesion: mechanisms that assist or impede it. Science 1968, 162, 1360–1368. [Google Scholar] [CrossRef] [PubMed]
  16. Thünemann, A.F.; Kublickas, R.H. Low surface energy polysiloxane complexes. J. Mater. Chem. 2001, 11, 381–384. [Google Scholar] [CrossRef]
  17. Yilgör, I.; Yilgör, E.; Wilkes, G.L. Critical parameters in designing segmented polyurethanes and their effect on morphology and properties: A comprehensive review. Polymer 2015, 58, A1–A36. [Google Scholar] [CrossRef]
  18. Ge, Z.; Luo, Y.J. Synthesis and characterization of siloxane-modified two-component waterborne polyurethane. Prog. Org. Coat. 2013, 76, 1522–1526. [Google Scholar] [CrossRef]
  19. Pergal, M.V.; Dzunuzovic, J.V.; Poreba, R.; Ostojic, S.; Radulovic, A.; Spirkova, M. Microstructure and properties of poly(urethane-siloxane)s based on hyperbranched polyester of the fourth pseudo generation. Prog. Org. Coat. 2013, 76, 743–756. [Google Scholar] [CrossRef]
  20. Jia, B.D.; Xing, Y.Z.; Jing, C. A new core-shell type fluorinated acrylic and siliconated polyurethane hybrid emulsion. J. Coat. Technol. Res. 2007, 4, 283–288. [Google Scholar]
  21. Majumdar, P.; Stafslien, S.; Daniels, J.; Webster, D.C. High throughput combinatorial characterization of thermosetting siloxane–urethane coatings having spontaneously formed microtopographical surfaces. J. Coat. Technol. Res. 2007, 4, 131–138. [Google Scholar] [CrossRef]
  22. Sommer, S.; Ekin, A.; Webster, D.C. A preliminary study on the properties and fouling-release performance of siloxane-polyurethane coatings prepared from poly(dimethylsiloxane) (PDMS) macromers. Biofouling 2010, 26, 961–972. [Google Scholar] [CrossRef] [PubMed]
  23. Pieper, R.J.; Ekin, A.; Webster, D.C.; Cassé, F.; Callow, J.A.; Callow, M.E. Combinatorial approach to study the effect of acrylic polyol composition on the properties of crosslinked siloxane-polyurethane fouling-release coatings. J. Coat. Technol. Res. 2007, 4, 453–461. [Google Scholar] [CrossRef]
  24. Zhang, Y.; Qi, Y.H.; Zhang, Z.P. Synthesis of PPG-TDI-BDO polyurethane and the influence of hard segment content on its structure and antifouling properties. Prog. Org. Coat. 2016, 97, 115–121. [Google Scholar] [CrossRef]
  25. Owens, D.K.; Wendt, R.D. Liquid spreading on rough metal surfaces. J. Mater. Sci. 1980, 15, 431–437. [Google Scholar]
  26. Choi, T.; Weksler, J.; Padsalgikar, A.; Runt, J. Influence of soft segment composition on phase separated microstructure of polydimethylsiloxane-based segmented polyurethane copolymers. Polymer 2009, 50, 2320–2327. [Google Scholar] [CrossRef]
  27. Choi, T.; Weksler, J.; Padsalgikar, A.; Runt, J. Microstructural organization of polydimethylsiloxane soft segment polyurethanes derived from a single macrodiol. Polymer 2010, 51, 4375–4382. [Google Scholar] [CrossRef]
  28. Rahman, M.M.; Kim, H.D. Characterization of waterborne polyurethane adhesives containing different soft segments. J. Adhes. Sci. Technol. 2007, 21, 81–96. [Google Scholar] [CrossRef]
Figure 1. Fourier transform infrared (FTIR) spectra of the PU-Sis samples: (a) wave number from 4000 to 600, (b) wave number from 2000 to 600 local amplification of (a).
Coatings 08 00157 g001
Figure 2. X-ray diffraction (XRD) patterns of the PU-Sis samples.
Coatings 08 00157 g002
Figure 3. Differential scanning calorimetry (DSC) curves of PU-Si0 and PU-Si17.
Coatings 08 00157 g003
Figure 4. Thermogravimetric analysis (TGA) curves of the PU-Sis samples.
Coatings 08 00157 g004
Figure 5. Surface roughness of the PU-Sis samples as determined by CLSM.
Coatings 08 00157 g005
Figure 6. Atomic force microscopy (AFM) images showing height (left) and phase (right) maps of (a) PU-Si0 and (b) PU-Si17.
Coatings 08 00157 g006
Figure 7. Water contact angle (WCA) and diiodomethane contact angle (DCA) measured results of the PU-Sis samples.
Coatings 08 00157 g007
Figure 8. Surface free energies of the PU-Sis samples.
Coatings 08 00157 g008
Figure 9. FTIR spectra of PU-Si0 before and after immersion in seawater.
Coatings 08 00157 g009
Figure 10. FTIR spectra of PU-Si4 before and after immersion in seawater.
Coatings 08 00157 g010
Figure 11. Infrared absorptivity reduction at 800 and 1260 cm−1 of samples containing PDMS after immersion in seawater.
Coatings 08 00157 g011
Figure 12. AFM images showing height (left) and phase (right) maps of (a) PU-Si0 and (b) PU-Si17 after immersion in seawater.
Coatings 08 00157 g012
Figure 13. WCA reductions of the PU-Sis samples after immersion in seawater.
Coatings 08 00157 g013
Figure 14. Surface energies of the PU-Sis samples before and after immersion in seawater.
Coatings 08 00157 g014
Figure 15. Long time interface contact angles (ICA) in-situ measurements of diiodomethane for PU-Si17 sample immersed in seawater.
Coatings 08 00157 g015
Figure 16. ICA in-situ measurements of diiodomethane at initial period for PU-Si17 sample immersed in seawater.
Coatings 08 00157 g016
Figure 17. ICA of the PU-Sis samples during immersion in seawater.
Coatings 08 00157 g017
Figure 18. Photographs of panels immersed in the Yellow Sea, China.
Coatings 08 00157 g018
Table 1. The characteristics of monomers.
MonomerHSH220HSH330PDMS2200BDOTDI100
Functional group−OH−OH−OH−OH−N=C=O
Functionality23222
Molecular weight20003000200090.121174.15
Table 2. The formulation of five prepolymers.
Amount of Monomer (wt %)PU-Si0PU-Si4PU-Si9PU-Si13PU-Si17
HSH22067.764.159.956.152.5
HSH3307.67.16.76.35.8
PDMS22000.04.28.512.816.9
TDI20.320.220.520.420.4
BDO4.44.44.44.44.4
Table 3. The mechanical properties of five coatings.
Mechanical PropertyPU-Si0PU-Si4PU-Si9PU-Si13PU-Si17
Tensile strength (MPa)0.511.091.051.372.09
Elongation at break (%)2070955244212581315
Elastic modulus (MPa)0.690.790.401.101.13
Table 4. The γ · E values and coverage of marine organism studied of the coatings.
SpecimenPU-Si0PU-Si4PU-Si9PU-Si13PU-Si17Silicone Coating
Coverage (%)26.78.21.62.922.1100
γ · E 4.153.682.674.414.722.86

