Influence of Lamellar Interface Morphology on Cracking Resistance of Plasma-Sprayed YSZ Coatings

1
Key Laboratory of Pressure System and Safety, Ministry of Education, East China University of Science and Technology, Shanghai 200237, China
2
Shanghai Baosteel Industry Technological Service Co., Ltd., Shanghai 201900, China
*
Author to whom correspondence should be addressed.
Coatings 2018, 8(5), 187; https://doi.org/10.3390/coatings8050187
Submission received: 21 March 2018
/
Revised: 4 May 2018
/
Accepted: 11 May 2018
/
Published: 15 May 2018
(This article belongs to the Special Issue Coatings for Harsh Environments)
Abstract
:Splat morphology is an important factor that influences the mechanical properties and durability of thermal barrier coatings (TBCs). In this study, yttria-stabilized zirconia (YSZ) coatings with different lamellar interface morphologies were deposited by atmospheric plasma spraying (APS) using feedstocks with different particle sizes. The influence of lamellar interface roughness on the cracking resistance of the coatings was investigated. Furthermore, the thermal shock and erosion resistance of coatings deposited by two different powders was evaluated. It was found that the particle size of the feedstock powder affects the stacking morphology of the splat that forms the coating. Coatings fabricated from coarse YSZ powders (45–60 μm) show a relatively rough inter-lamellar surface, with a roughness about 3 times greater than those faricated from fine powders (15–25 μm). Coatings prepared with fine powders tend to form large cracks parallel to the substrate direction under indentation, while no cracking phenomena were found in coatings prepared with coarse powders. Due to the higher cracking resistance, coatings prepared with coarse powders show better thermal shock and erosion resistances than those with fine powders. The results of this study provide a reference for the design and optimization of the microstructure of TBCs.
1. Introduction
Plasma-sprayed (PS) ceramic coatings are widely used in engineering applications, such as the thermal barrier coatings (TBCs) applied to insulate the high-temperature components of gas turbines from hot gas [1,2,3]. The formation of the coatings in the plasma spraying process is characterized by the impingement of substantial molten and semi-molten particles, which are deposited on the previously deposited ones. Therefore, coatings fabricated by PS developed by successive build-up of solidified lamellae are known as splats [4]. The layering of the individual splats determines the microstructure and, ultimately, the quality of the coating [4,5]. Therefore, establishing the relationships between spraying parameters, the flattening behavior of splats, and ultimately the coating performance is of great significance, and has received considerable attention [6,7,8].
The primary factor determining splat formation and ultimately the coating properties has been identified as the melting degree of the individual particles at the impingement on the substrate [5]. The feedstock powder morphology is an important parameter affecting the properties of TBCs [9]. The feedstock size affects the deposition, solidification, and crystallization of molten droplets by influencing the particle state in the plasma, thus affecting the microstructure of the coatings [10]. Fine particles typically result in good melting during deposition, and promote the low porosity of the coatings due to the decreased volume of inter-lamellar gaps and voids [11].
The particle size has an effect on the mechanical properties of the coatings. Dwivedi et al. investigated the effect of particle size distribution on the fracture toughness of APS YSZ coatings. In their report, the fracture toughness of plasma-sprayed ceramics was significantly affected by the porosity of the coatings. Coatings sprayed with finer powders showed higher fracture toughnesses due to their denser microstructures. The fracture toughness values of the coatings deposited with particles in the range 10–45 μm and those in the range 79–117 μm showed significant differences, which ranged from 1.35 to 2.2 MPa·m1/2 [12]. However, apart from the porosity, the mechanical properties of YSZ coatings also depend on the individual splat morphology, adhesion between the splat and the substrate, cohesive strength among individual splats, and the microstructure of the splats themselves [13,14,15]. Wang et al. studied the effects of pores and lamellar interfaces on the properties of plasma-sprayed zirconia coatings, and reported that the lamellar interfaces were equally as important as the porosity in defining the properties of the coatings [16]. Although the importance of the lamellar interface has been recognized, its exact impact on coating performance still remains unclear.
In plasma-sprayed TBCs, the YSZ coating is sprayed onto a rough bond coat (BC), guaranteeing good mechanical locking of the top coat (TC) to the bond coat [17]. Specifically, the interface roughness has been shown to play a major role in the development of the induced stresses and lifetime of TBCs [18,19]. The roughness of the bond coat and the previously deposited layer should be about 5–10 μm, as suggested by Vaßen et al., for good adhesion of the ceramic coating [17]. Li et al. also pointed out that asperities similar to the splat thickness might be beneficial to promoting mechanical bonding between the bond coat and the top coat [6]. In some cases, the spalling of the top coat occurs before the initiation and propagation of cracks at the BC/TC interface due to the cracking of the ceramic coating [15,20]. Therefore, the mechanical bonding at the ceramic–lamellae interface is also an important factor affecting the durability of the TBCs. Coating formation is comprised of the flattening and solidification of droplets when they impact the previously formed coating surface, which is undulating. The publications mentioned above showed that the interface roughness was able to affect the bonding strength between the bond coat and top coat. However, until now, the effect of the inter-lamellar surface morphology on the mechanical property of the plasma-sprayed ceramic coating has not been examined.
Previous work has found that the particle size of YSZ may significantly affect the microstructure and the thermal shock resistance of plasma-sprayed TBCs [21]. The surfaces of the coatings prepared by coarse particles are rougher than those prepared with fine ones [21]. The aim of this work is to obtain more information on the influence of the inter-lamellar surface morphology on the relevant coating properties. For this purpose, the stacking morphology of the splats in coatings made from different particle sizes was analyzed. The hardnesses and X-ray diffraction (XRD) patterns of the coatings were measured to evaluate the effect of particle size on mechanical properties and phase structure. Furthermore, the indentation technique was used to evaluate the influence of the lamellar interface morphology on the cracking resistance of the coatings. Based on these results, the failure modes of the coatings fabricated from different particle sizes under thermal cycling and erosion conditions were analyzed and discussed.
2. Materials and Methods
2.1. Sample Preparation
Samples were produced by air plasma spraying (APS) of YSZ powders (8 wt. % Y2O3) onto disk nickel-based super alloy (IN-738) substrates with thicknesses of 3 mm and diameters of 25.4 mm. Prior to coating deposition, the surface of the substrate was grit blasted to obtain a rough surface. Sand blasting was performed using corundum with a particle size of 60–80 mesh at an air pressure of 0.6 MPa. Before deposition of the YSZ coating, a commercially available NiCrAlY powder (45–106 µm, Beijing SunSpraying New Material Co., Ltd., Beijing, China) was used to deposit the bond coat. To analyze the effect of lamellar interface morphology on the performance of YSZ coatings, YSZ powders with the size of 15–25 µm and 45–60 µm (Chengdu HuaYin Powder Technology Co., Ltd., Chengdu, China) were selected as the feedstocks for the deposited ceramic coat. Both the YSZ top coat and the bond coat were deposited by a commercial air plasma spray (APS) system (APS-2000, Beijing Aeronautical Manufacturing Technology Research Institute, Beijing, China) onto the substrate. Spraying parameters (such as plasma power, spray distance and powder feed rate) could influence the microstructure and mechanical properties of the coating. Therefore, in this study, except for the difference in particle size distribution of the YSZ powders, all process parameters were kept constant in order to introduce deliberate variations in the coating microstructures. During spraying, argon was used as the main gas and hydrogen as the auxiliary gas. The pressure was controlled at 0.4 MPa and 0.25 MPa, respectively. The main gas flow was controlled at 47 L/min. Argon was also used as the powder feed gas, with a flow rate of 9 L/min. The plasma power was maintained at approximately 36 kW (600 A/60 V) and 30 kW (500 A/60 V) to deposit the YSZ and the bond coat, respectively. The traverse speed of the spray gun was kept as 150 mm/s with a spray distance of 100 mm for the bond coat deposition and 70 mm for YSZ deposition. According to previous research experience, the YSZ powders with particle sizes of less than 60 μm were completely melted under these spray parameters [21,22]. Therefore, the spraying parameters in this study are suitable for the deposition of these two kinds of YSZ powders. The total thickness of the TBCs, including both the bond coat and ceramic coat, was about 450 µm, and the ceramic top coat was about 300 µm thick. For simplicity, in this study, the coatings fabricated from fine and coarse YSZ powders are labeled as F-TBC and C-TBC, respectively.
2.2. Sample Characterization
Microstructural analysis was conducted on the coating surfaces, polished cross-sections, and fracture surfaces using a scanning electron microscope (SEM, ZEISS EVO MA15, Carl Zeiss SMT Ltd., Cambridge, UK). Moreover, the 3D morphologies and roughness of coating surface were obtained using a non-contact profiler (Infinite Focus G4, Alicona, Graz, Austria). The phase analyses of the YSZ feedstocks and coatings before and after thermal cyclic testing were examined by X-ray diffraction (XRD, D/max2550VB/PC, RIGAKU, Tokyo, Japan) using filtered Cu Kα radiation at an accelerated voltage of 40 kV and a current of 100 mA. Diffraction angles were set in the range of 10°–80° with a step width of 0.02°. The Young’s modulus and micro-hardness of YSZ coatings were determined using nano-indentation tests (Agilent Nano Indenter G200, Agilent Technologies Inc., Santa Clara, CA, USA). The indentation experiments were carried out using a Berkovich indenter in displacement-controlled mode with a constant strain rate of 0.05 s−1. The maximum displacement was set to 1000 nm. Regions relatively devoid of cracks and surface defects were identified using a microscope and 15 indents made in those regions to obtain the Young’s modulus and micro-hardness values of the coatings. It should be noted that measurements performed by nano-indentation give values approaching those of the local stiffness of the coatings, so the Vickers hardness of the coatings was also measured. The Vickers hardness of the coatings was measured on a polished cross-section at a load of 9.8 N with a loading duration of 15 s. 10 points were measured on each coating sample to obtain a reliable hardness value. The Vickers indentation fracture (VIF) test is a popular experimental technique for estimating of the fracture resistance of brittle ceramics. The cracking resistance of the YSZ coatings fabricated from the fine and coarse powders were investigated by analyzing crack behavior during the Vickers indentation test.
2.3. Thermal Shock and Erosion Test
Cyclic thermal shock and particle erosion testing were conducted to investigate the influence of cracking resistance on the failure modes of coatings fabricated from the fine and coarse YSZ powder. Thermal shock tests were conducted using a muffle furnace. When the temperature of the furnace reached 1050 °C, the samples were put into the furnace with a holding time of 10 min, then they were directly quenched in deionized water with a temperature of 20–30 °C until the samples had cooled to room temperature.
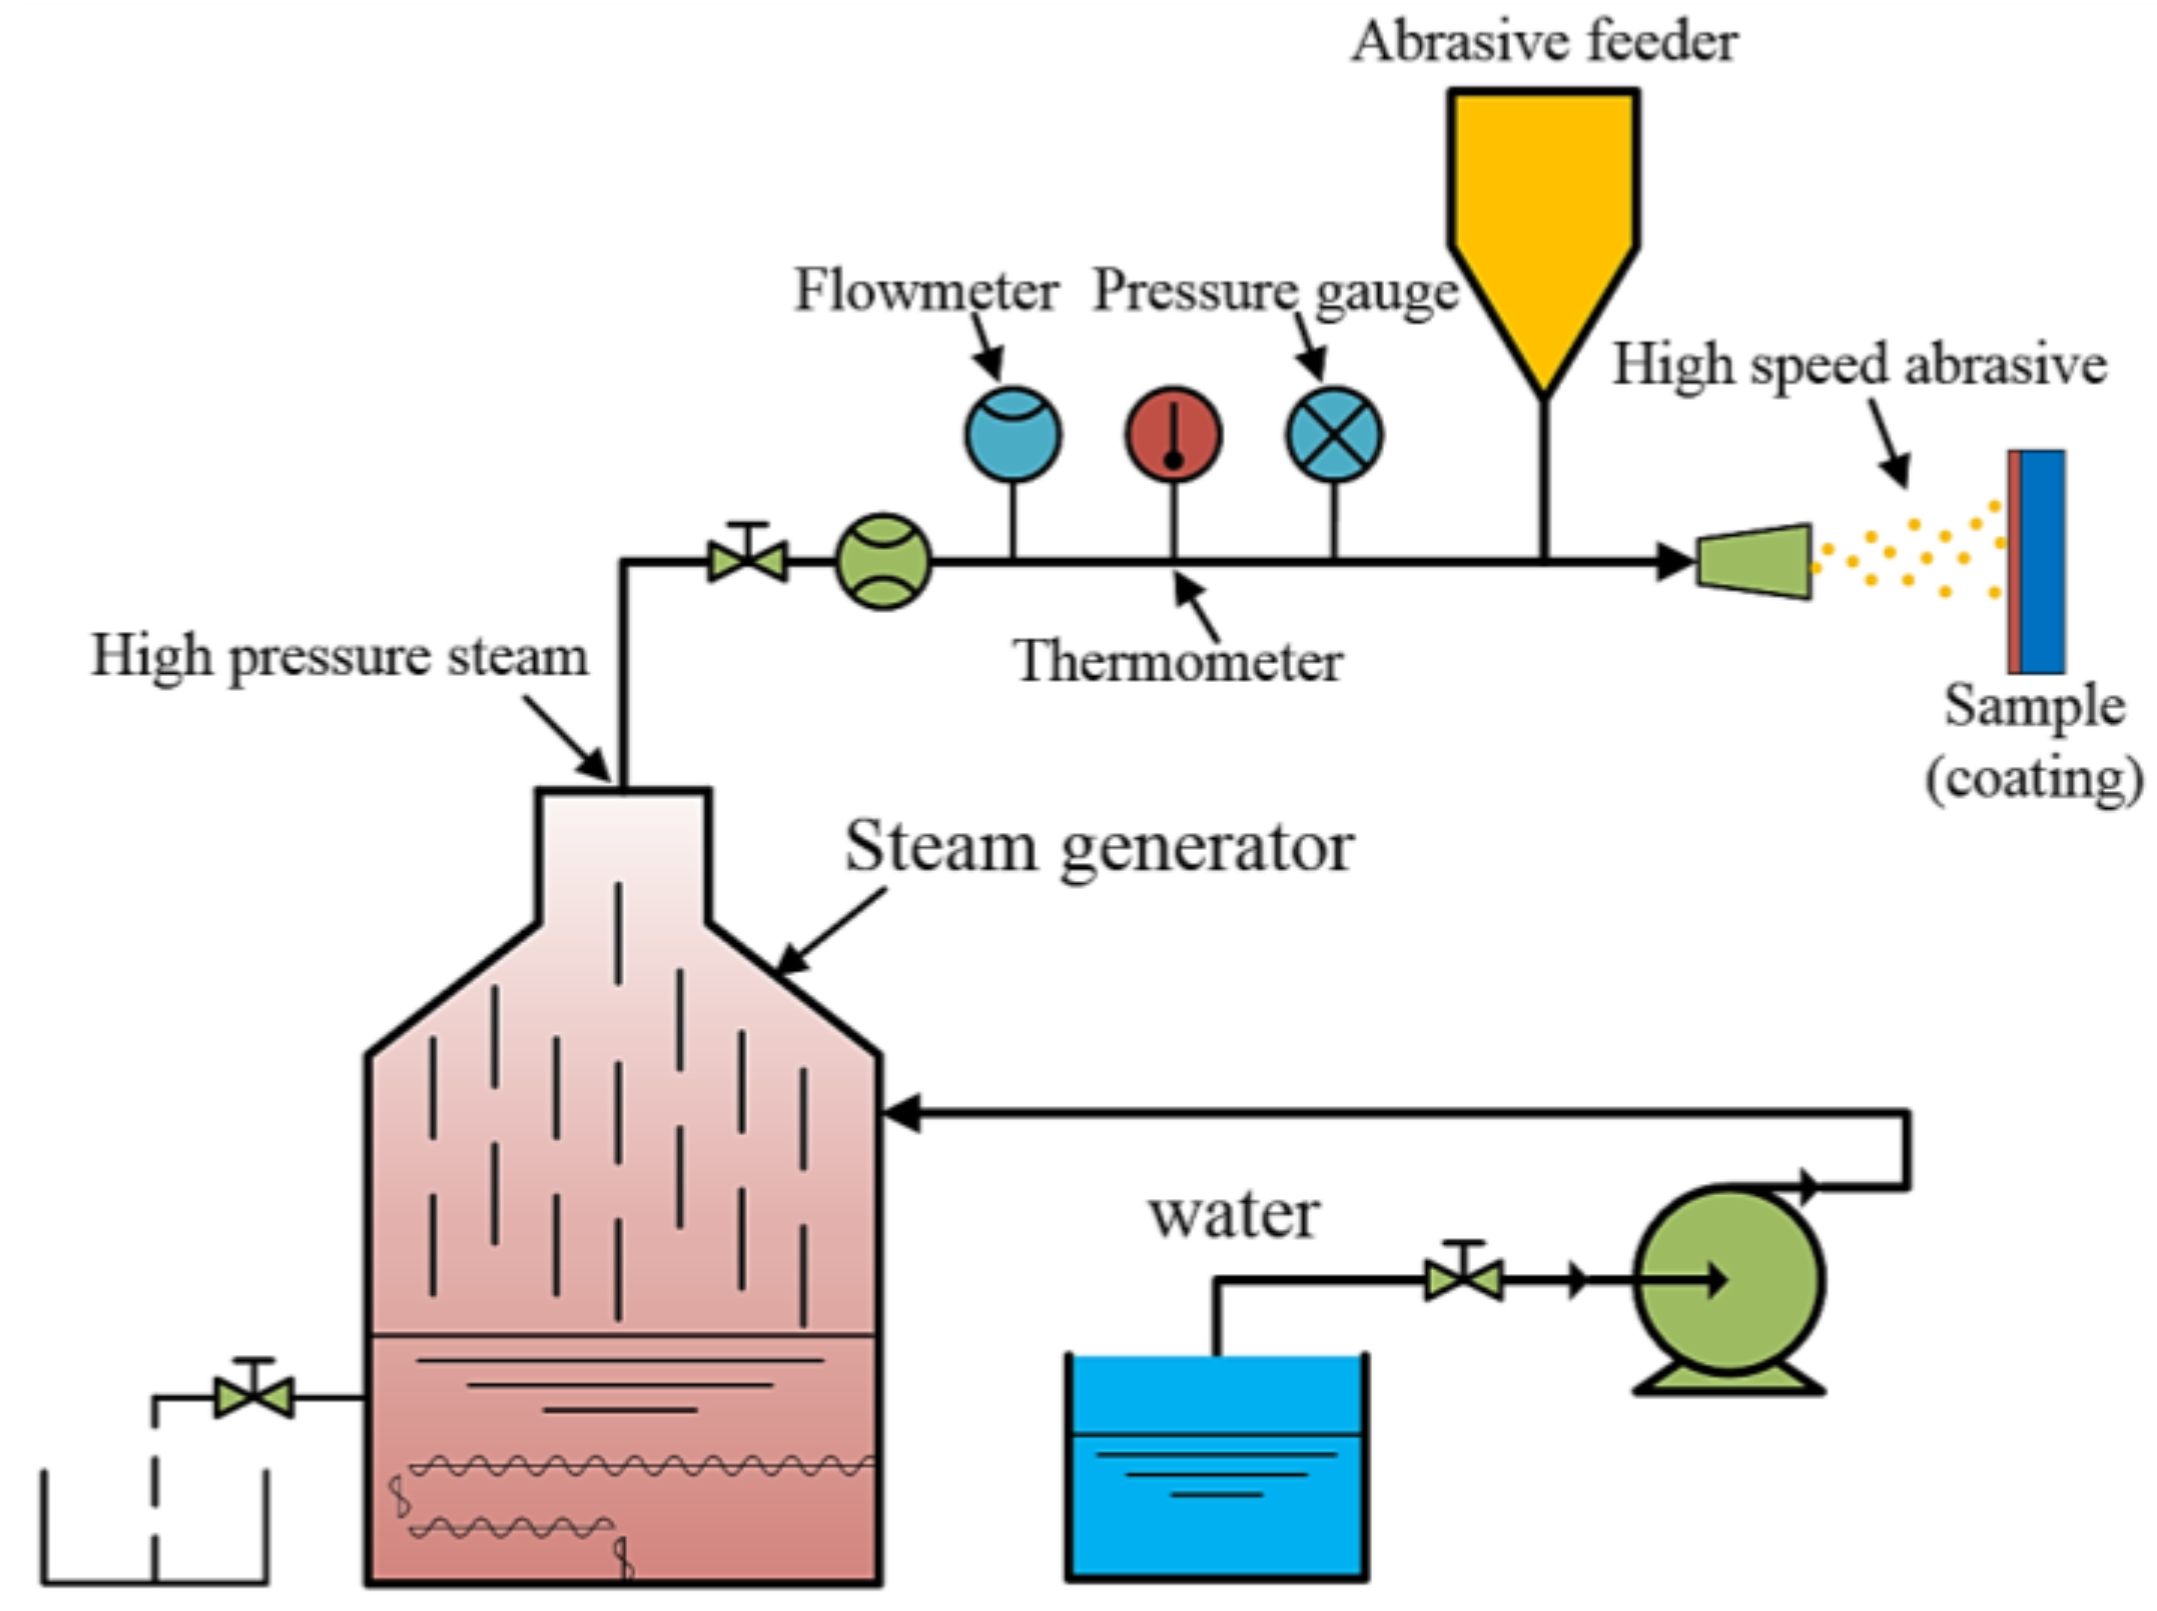
Erosion tests were carried out using a homemade erosive tester. The schematic of the erosion experiment is shown in Figure 1. The abrasive particles are fed into the high-speed steam and accelerated, then the particles are ejected from the steel tube nozzle to impact the coating. Irregular SiC powder with sizes in the range of 61–75 µm was used as abrasive. During the erosion process, the flow of the steam gas was fixed at 6.8 kg/h, and the feed rate of the abrasive was 5.12 g/min. A 6-cm nozzle-to-substrate distance was used, with an impingement angle of 90°. To produce an erosion scar with a well-defined geometry, the specimen surface was masked with a 20 mm diameter opening. Specimen mass was measured prior to erosion and after every 5.12 g of erodent feed.
3. Results and Discussion
3.1. Microstructural
Figure 2 shows the cross-section microstructure of as-sprayed coatings. It can be seen that more macro-pores are present in the coating prepared from the coarse YSZ powder (Figure 2d). The porosity of the coating prepared by the fine powder (Figure 2a) is lower than that by the coarse powder. Vertical cracks are the common in the structures of plasma-sprayed coatings and are caused by the release of residual stress during the deposition process [11,23]. In this study, vertical cracks were observed in the coatings prepared from both fine and coarse YSZ powders. However, some vertical cracks in F-TBC were accompanied by branching cracks, as shown in Figure 1b. Some branches were formed by cracking along the lamellar interface (Figure 2c). In contrast, no branching cracks were found in C-TBC. Instead, some intra-splat cracks were observed near the vertical cracks (Figure 2f).
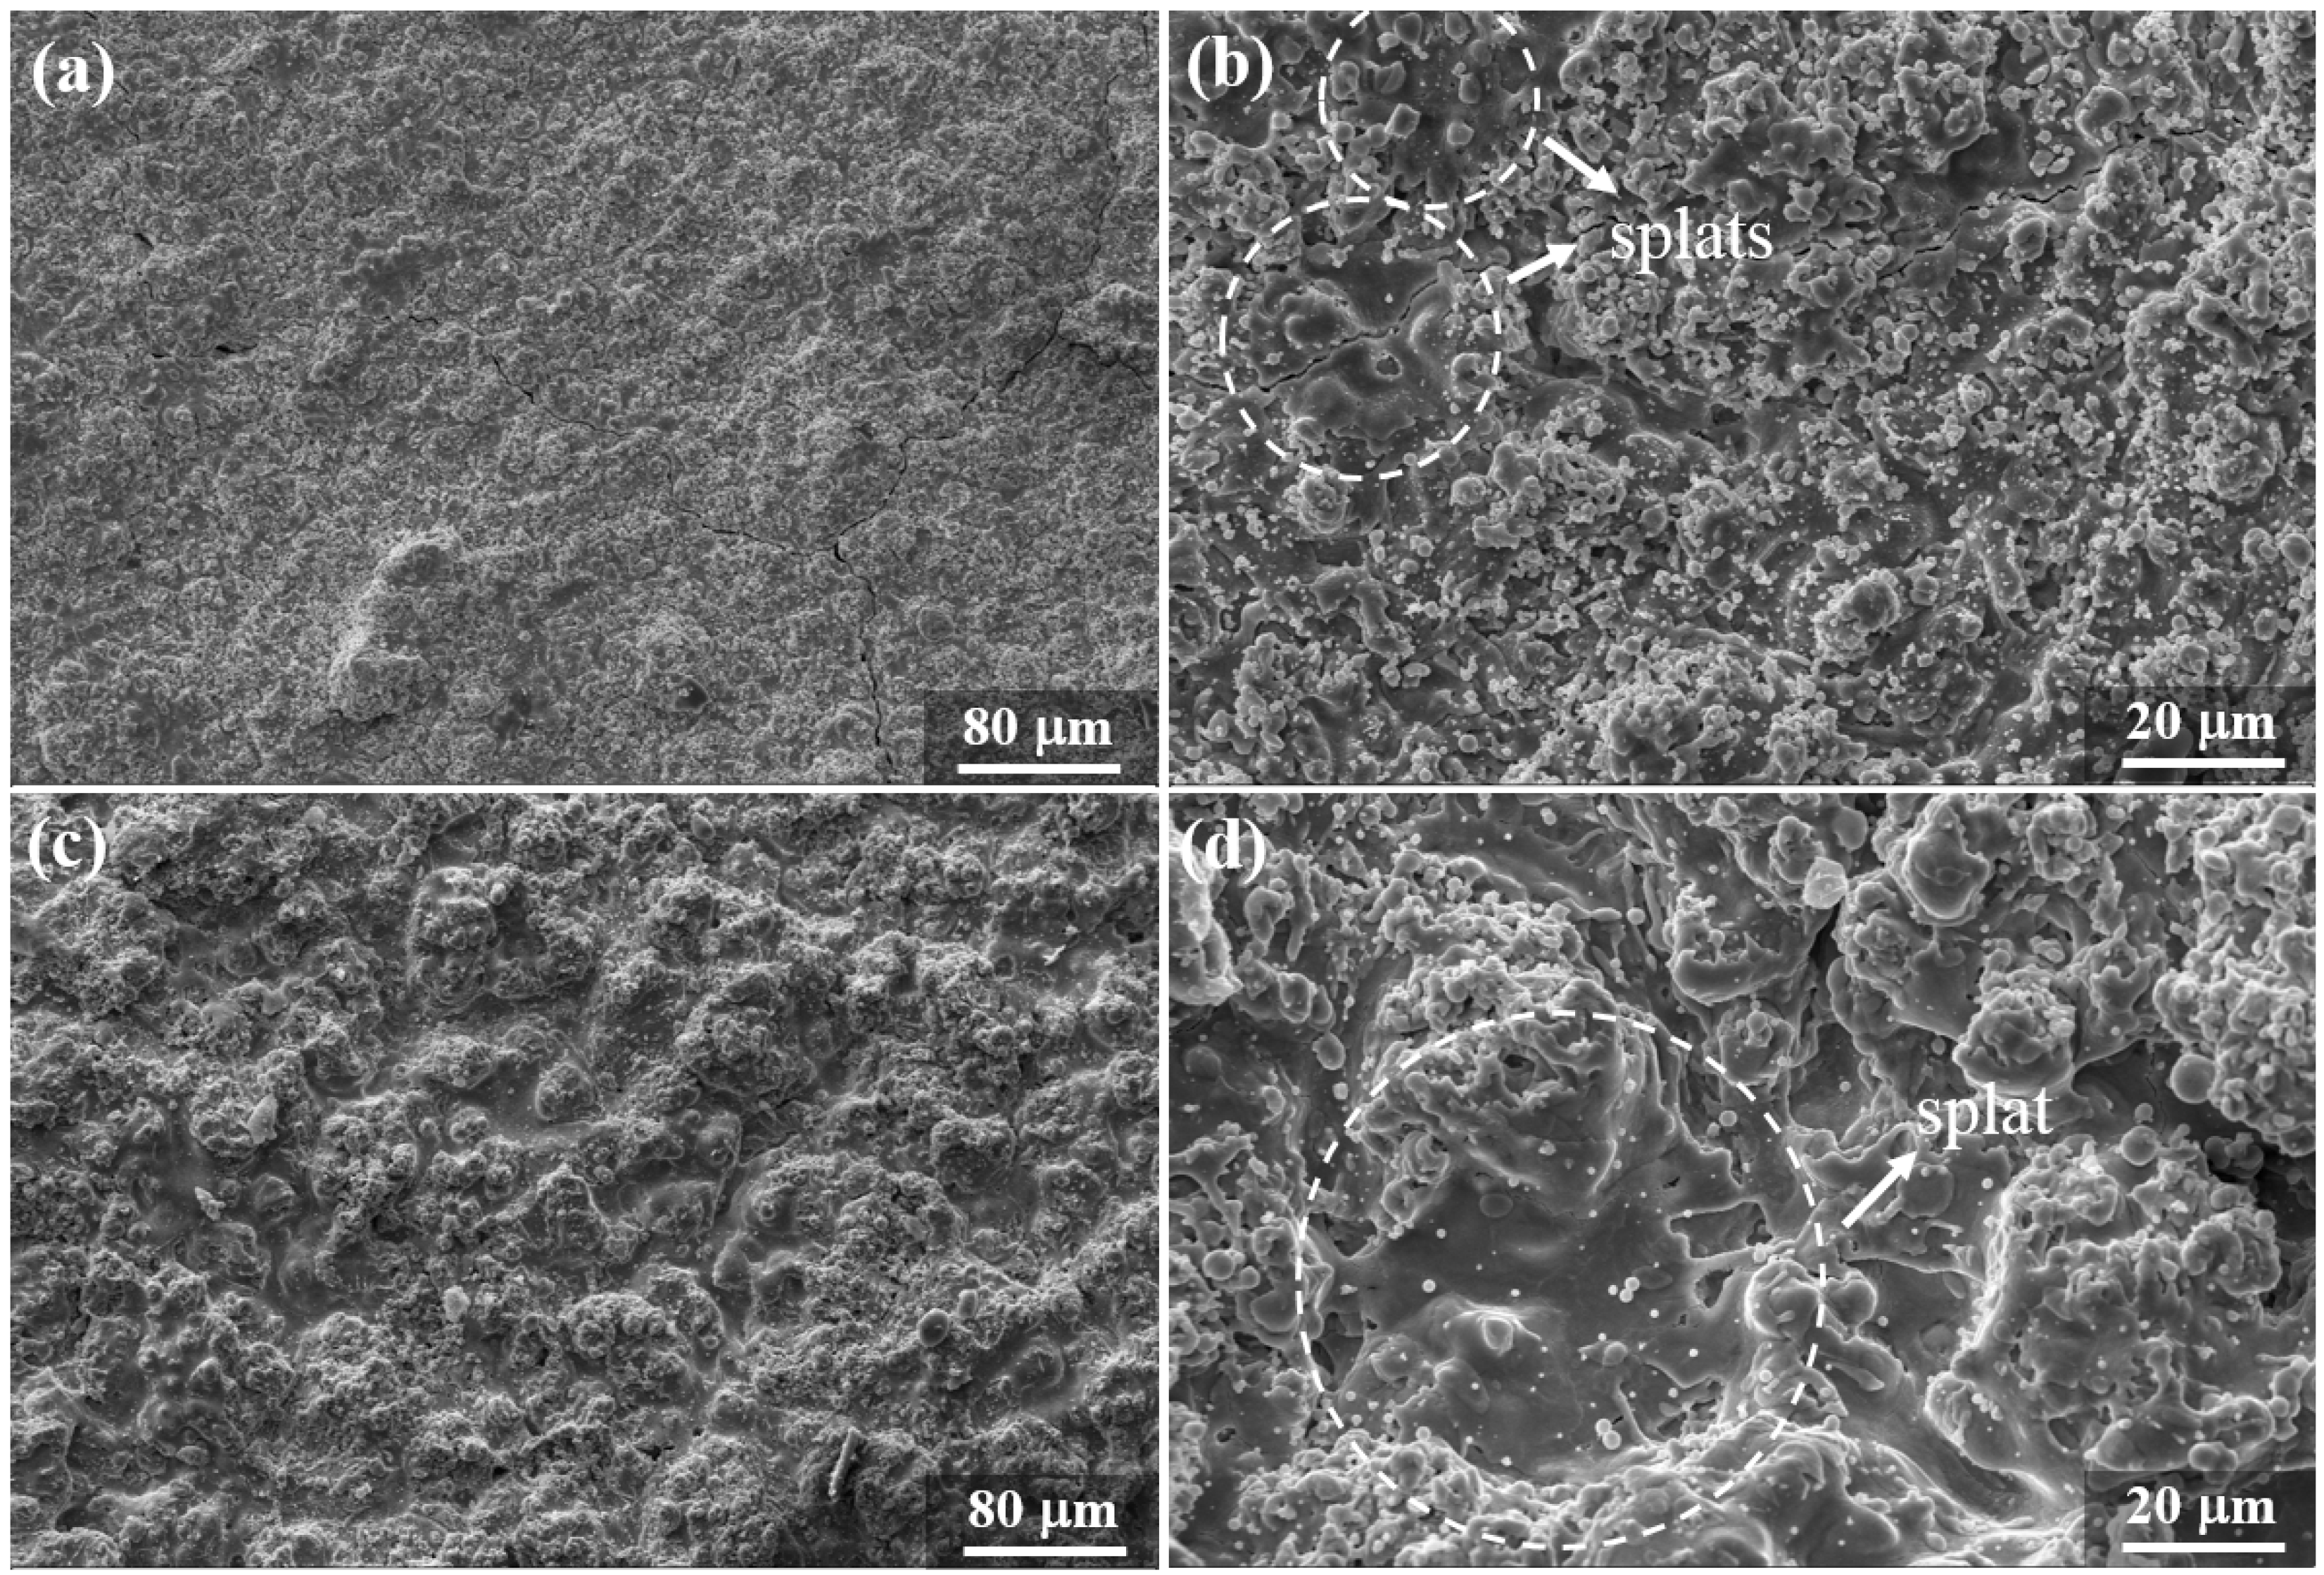
Figure 3 shows the surface morphology and the splat stacking features of the coatings deposited using the two different YSZ powders. As shown in Figure 3a,c, the surface of the F-TBC is much smoother than that of the C-TBC. Babu et al. also reported that the surface roughness and porosity increased with an increase in powder particle size in the case of Ni-Cr and Al2O3 coatings [24]. As expected, the splats formed by the fine powder are much smaller than that those formed by the coarse powder, marked in Figure 3b,d. In addition, due to the tortuous lamellar interface of C-TBC, the splats formed by molten particles are stacked in waves in this coating. In contrast, the splats formed in F-TBC are much smoother.
The 3D images of the YSZ coating surface are shown in Figure 4a. The surface roughness presented in Ra was obtained by measuring the contour along the coating surface (shown in Figure 4b). The roughness of C-TBC is 2.71 μm, which is about three times that of F-TBC (0.99 μm). The maximum amplitude of the C-TBC surface profile exceeded 8 μm, whereas that of the F-TBC was less than 4 μm.
3.2. Mechanical Properties and Phase Structure
The performance of plasma-sprayed coatings depends on the mechanical properties of the material itself and the defect structure formed during the deposition process. Table 1 shows the elastic modulus and hardness values of the coatings obtained by the nano- and micro-indentation method. The elastic modulus and hardness obtained through nano-indentation of the C-TBC is 213 and 15 GPa, respectively, which is larger than those of the F-TBC. However, the hardness of the C-TBC measured by Vickers indentation is slightly lower than that of F-TBC. There are some fine pores in the coating beneath the nano-indenter, which causes the Young’s modulus of coatings measured by nano-indentation to be lower than that of the corresponding bulk material (~200–210 GPa [25]). The pore size in PS TBC usually reveals a bimodal distribution [11]. Due to the small size of the splats, the number of fine pores attributed to micro-cracks such as inter-splats gaps in F-TBC is relatively greater [21]. Therefore, the hardness and Young’s modulus examined by nano-indentation are lower than those of C-TBC. There are more large voids in the C-TBC (show in Figure 2d), which leads to it having a lower Vickers hardness compared to F-TBC.
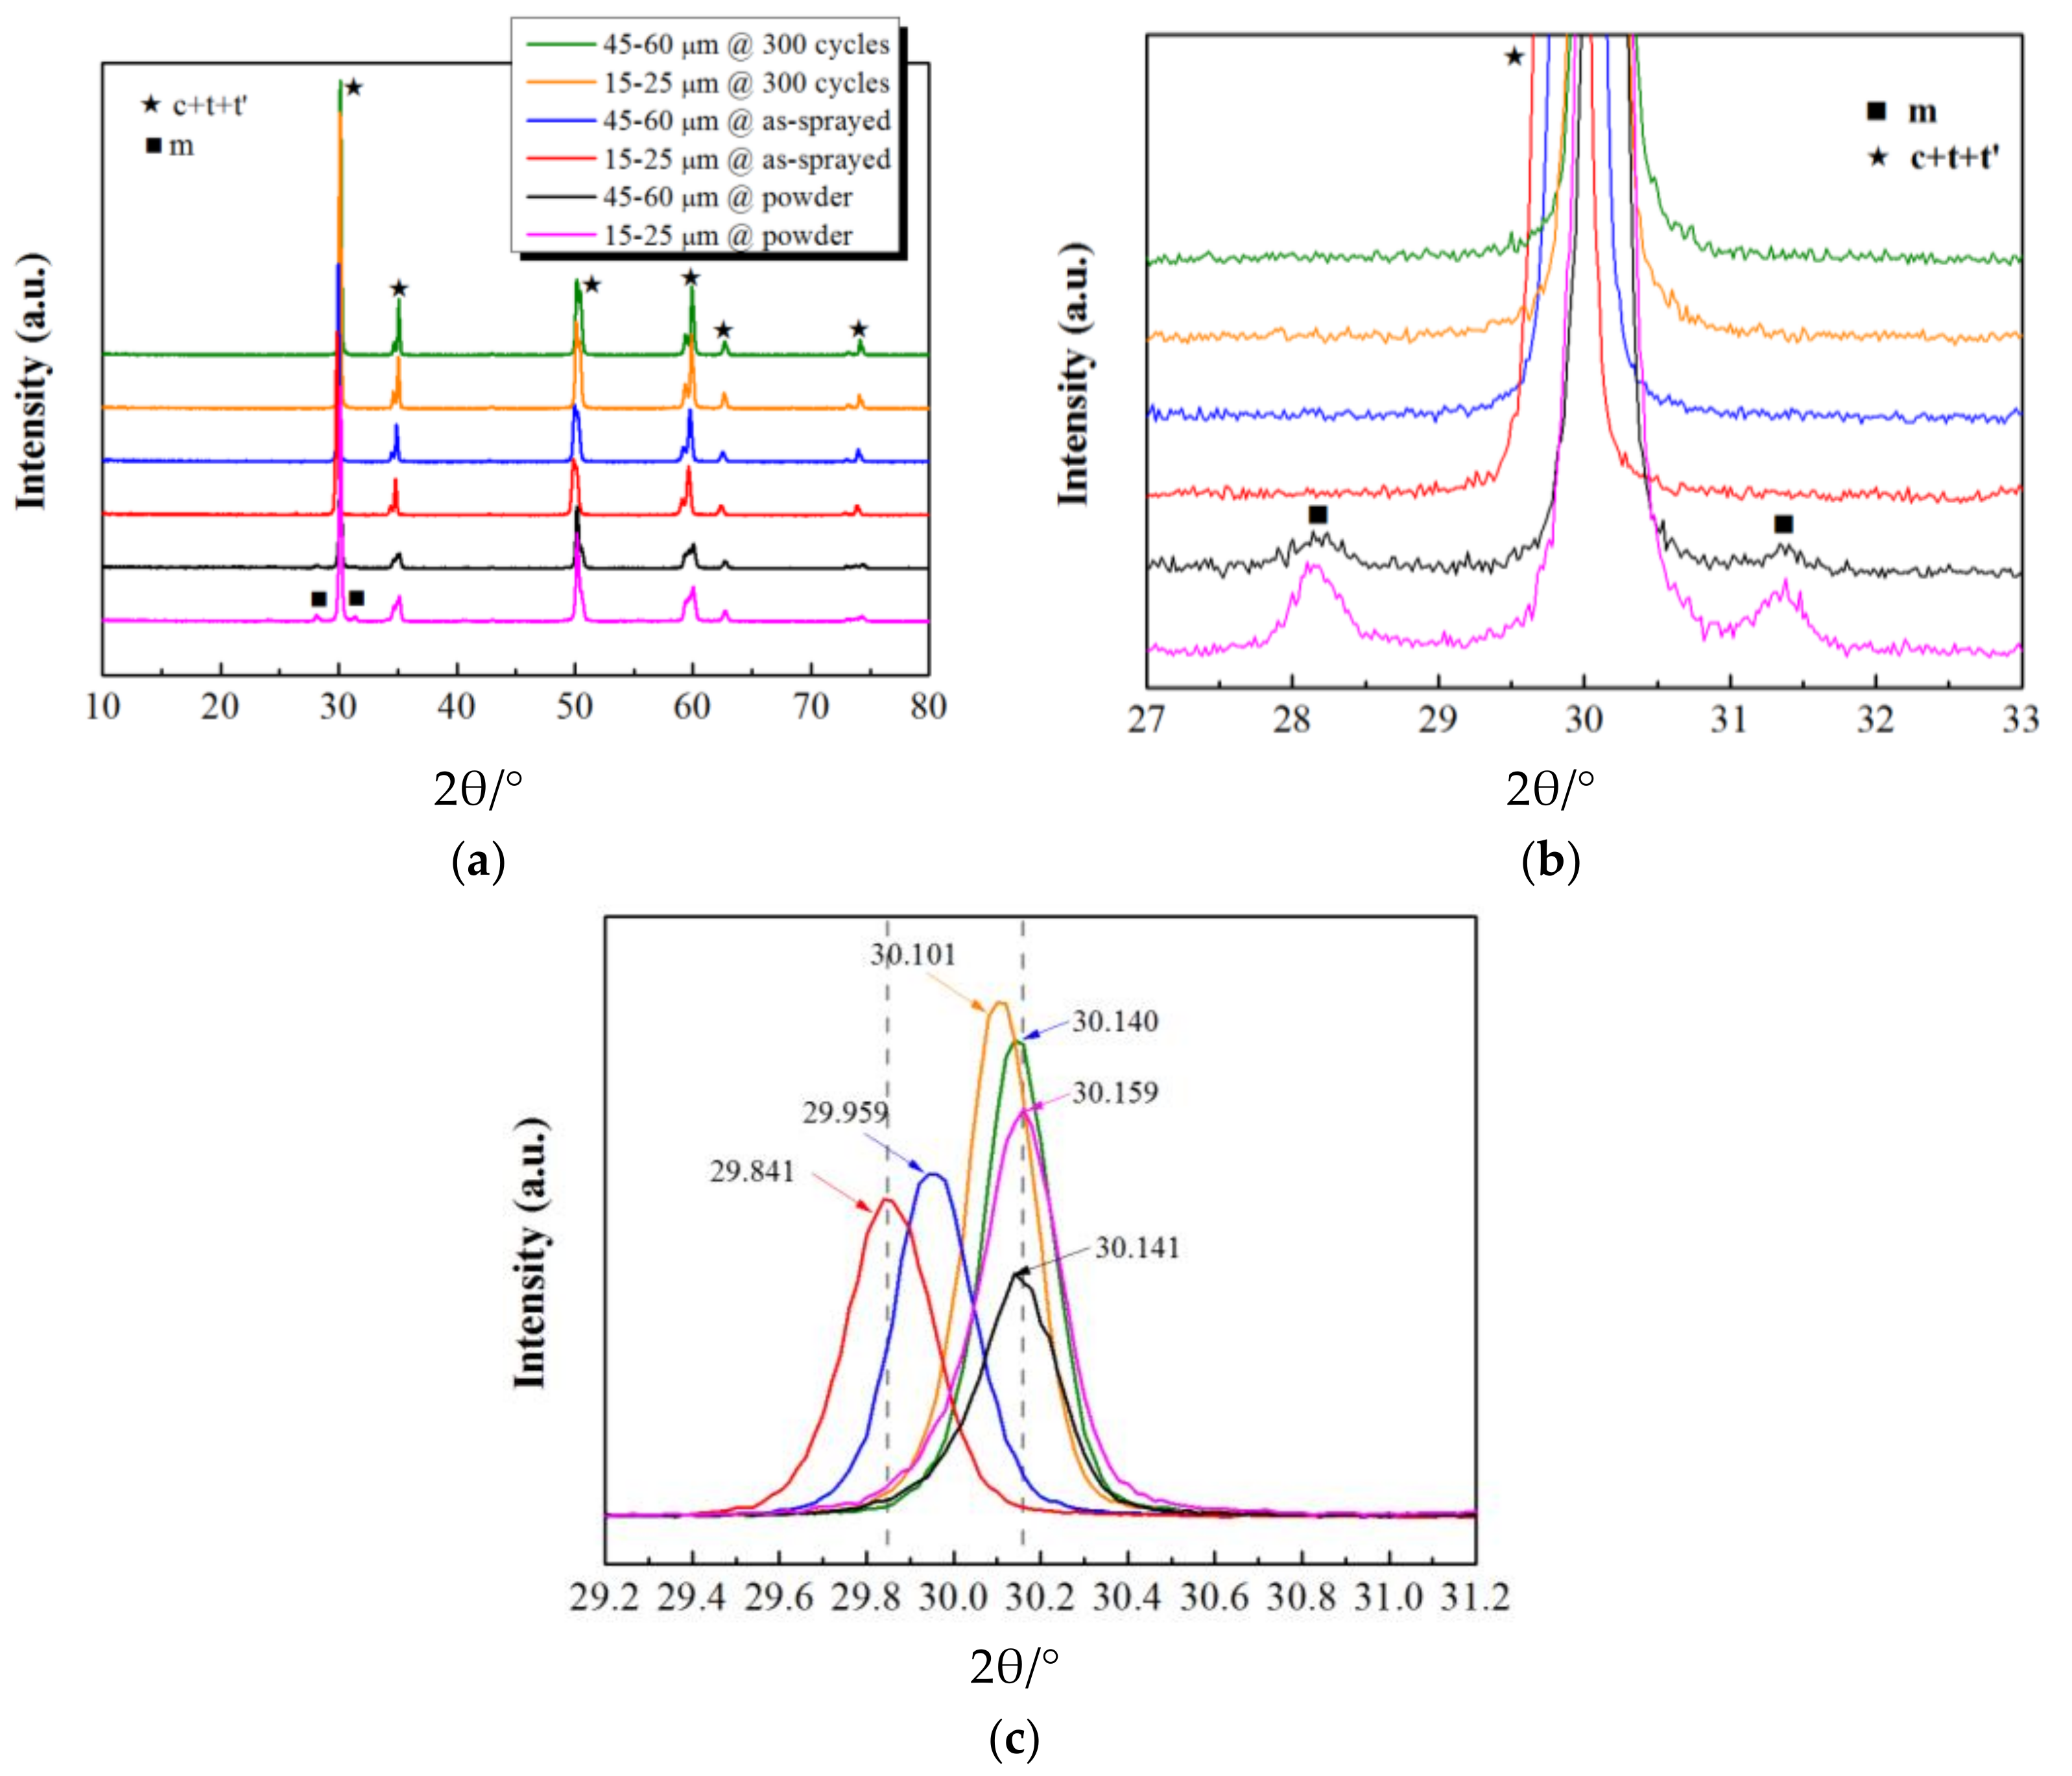
Phase composition is considered to be a crucial factor affecting the properties and durability of TBCs. The XRD patterns of the two kinds of YSZ feedstocks and the corresponding coatings before and after thermal cycling testing are shown in Figure 5. It can be seen that coatings made from coarse and fine YSZ powders have the same phase structure. Tetragonal zirconia is the main phase for the YSZ coatings before and after thermal cyclic test. From the detailed analysis in a diffraction angle range from 27° to 33° (Figure 5b), a very small fraction of monoclinic phase can be detected for both fine and coarse YSZ feedstocks. However, no monoclinic phase was present in any of the coatings after the plasma spraying process. No obvious changes in phase composition can be found for the coatings before and after the thermal cycling test. Consequently, the phase structure may not influence the cracking resistance and service performance of YSZ coatings prepared from particles with different sizes.
Besides the phase composition, residual stresses in coatings also have an important influence on the service behavior, performance, and lifetime of the TBCs. As shown in Figure 5c, the XRD peak positions of the as-sprayed F-TBC and C-TBC shifted to the left with respect to the YSZ powders, which indicates that both F-TBC and C-TBC contain tensile residual stress arising from the plasma spraying process during the coating deposition. In addition, the residual stress in F-TBC is higher than that of C-TBC, based on the peak position offset. After thermal cycling, the peak positions of both coatings shifted to the right, indicating that stress relaxation had occurred during the thermal cyclic test.
3.3. Cracking Resistance
It is known that YSZ spallation is often related to crack initiation and propagation in the vicinity of the YSZ/bond coat interface [26]. Therefore, the cracking behavior in the coating under the action of indentation was studied in this study. Figure 6 shows four typical indentation morphologies under the same load conditions: indentation with vertical cracks, indentation with horizontal cracks, crushed indentation, and indentation with inter-lamellar cracking. The difference between inter-lamellar cracking and horizontal crack is judged by the crack length. Horizontal cracks exceeding the diagonal length of the indentation are considered to be inter-lamellar cracking. It can be seen that there is a great difference in the morphology of cracks generated near the indentation, and some indentations do not even cause cracks. Due to the complexity of the crack morphology, the fracture toughness of the coatings in this study could not be measured by the indentation method. Other publications have also pointed out that indentation-based measurement techniques are not very reliable for coatings, as they do not provide legitimate toughness values [12,27].
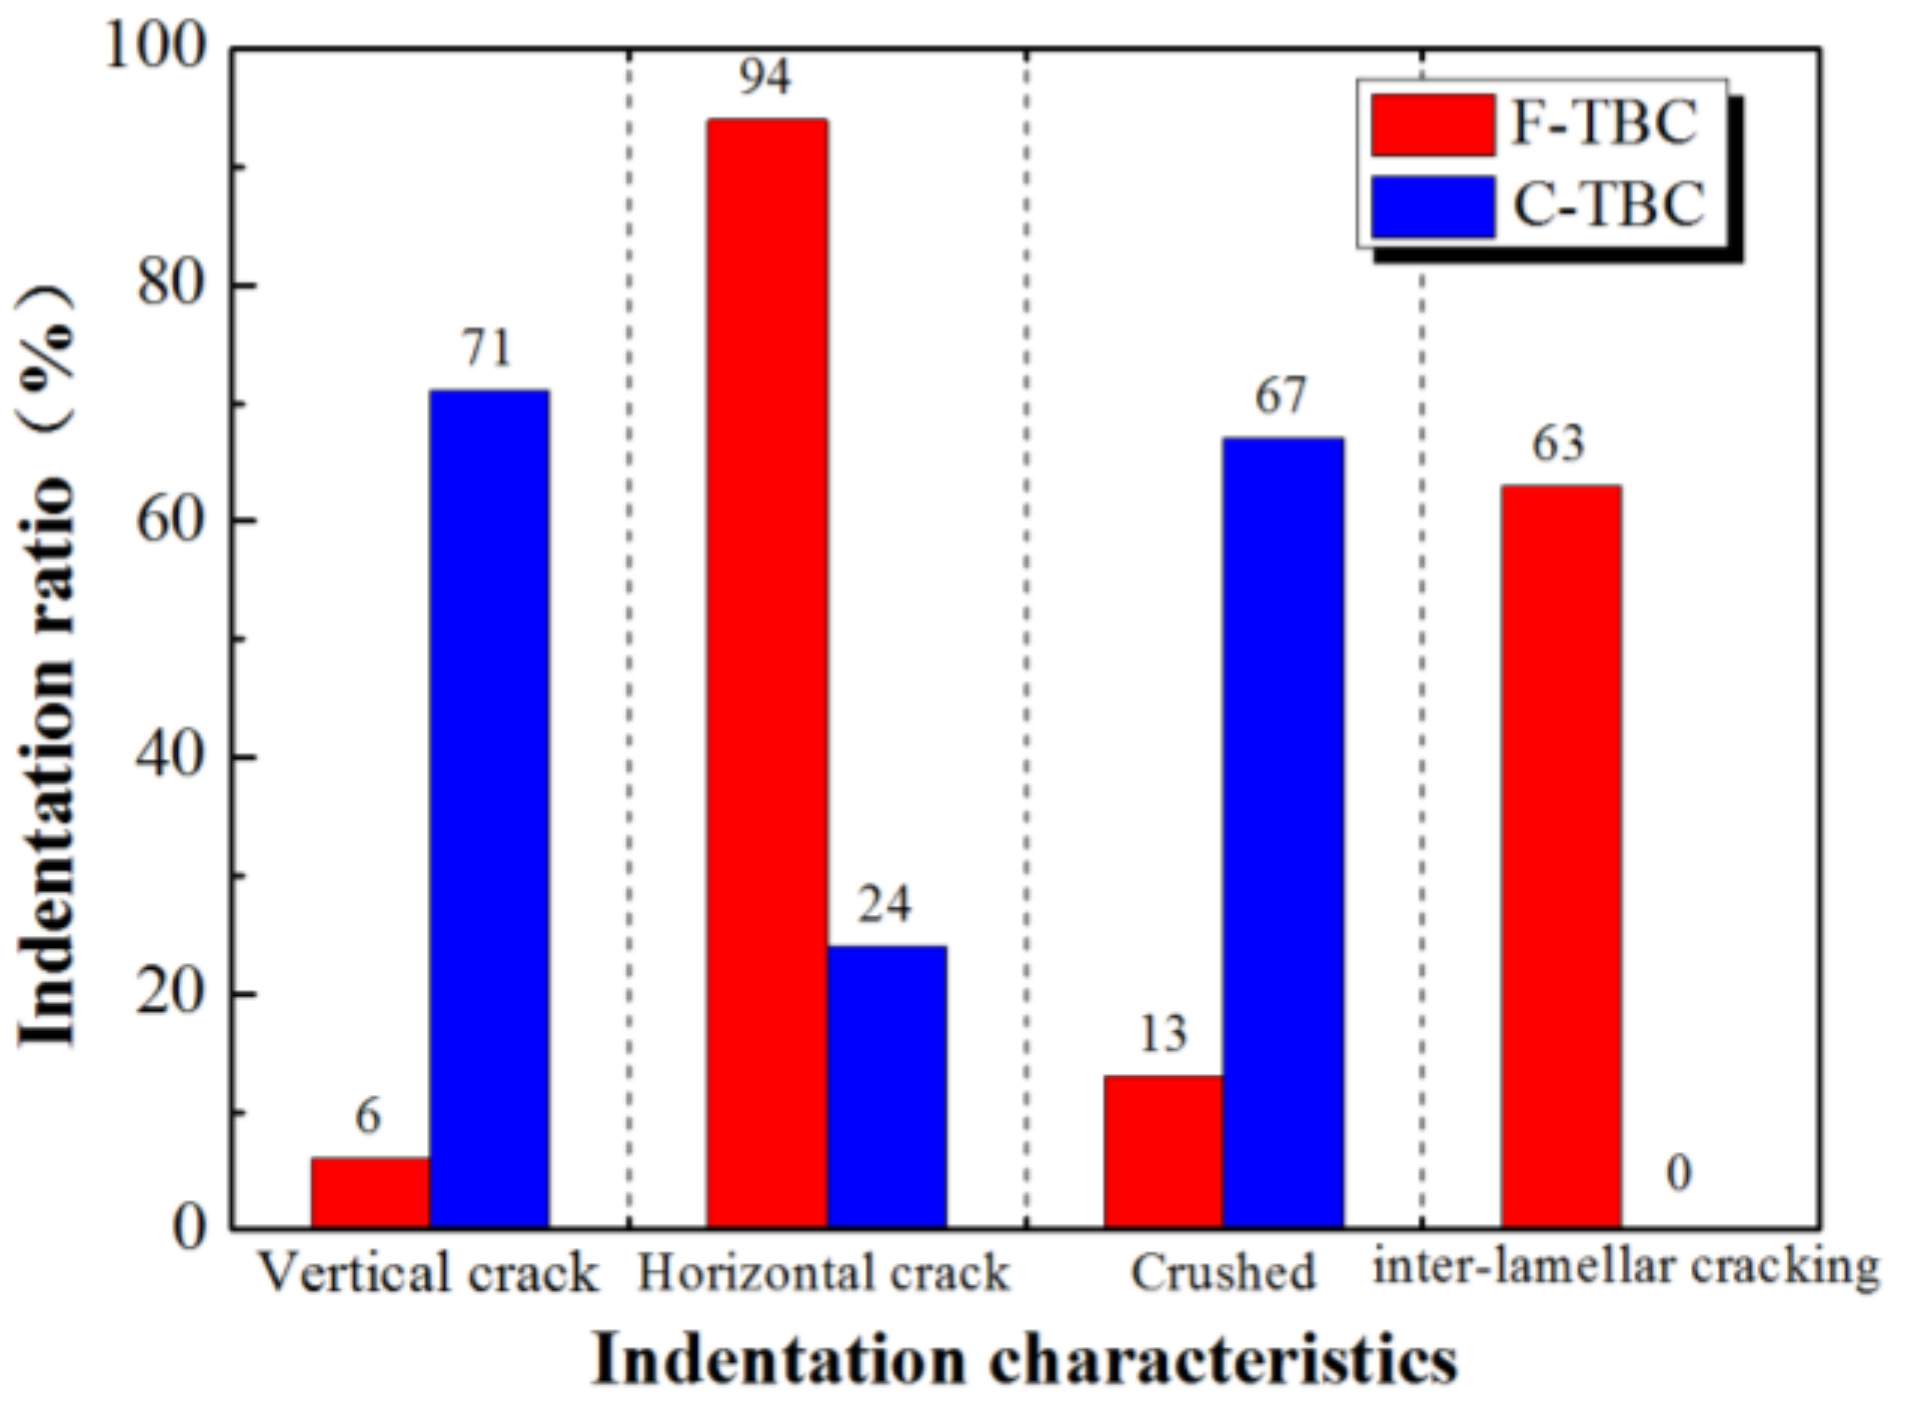
Although the specific fracture toughness of the coatings cannot be obtained, the cracking resistance of F-TBC and C-TBC can be evaluated by analyzing the crack morphology formed by indentation. By sorting the indentations in the coating according to the features in Figure 6, the statistics of the indentation features of F-TBC and C-TBC are shown in Figure 7. The percentage of indentation is determined by the number of indentations containing the feature divided by the total number of indentations performed in the coating. The same indentation may belong to several features. For example, indentations with inter-lamellar cracking also belong to the indentation with horizontal cracks. It can be seen that more than 90% of the indentations in F-TBC are accompanied by horizontal cracks, and that more than 65% of the horizontal cracks belong to inter-lamellar cracking. However, in C-TBC, the indentations accompanied by horizontal cracks are fewer than 25%, and no inter-lamellar cracking can be observed. These data show that coatings prepared by fine powder tend to form large cracks parallel to the substrate direction, indicating that the cracking resistance of F-TBC is worse than that of C-TBC. In addition, the presence of delamination in the as-sprayed F-TBC (Figure 2b) also shows that coatings deposited by fine YSZ powders have poor cracking resistance.
According to Dwivedi’s report, coatings prepared by finer powders show higher fracture toughness due to the denser microstructure with lower defect density [12]. The proportion of the crushed indentation of C-TBC is about 5 times that of F-TBC, indicating that C-TBC contains more macro-pores, which is consistent with the microstructure observation. Therefore, prior to our study, the cracking resistance of F-TBC was considered to be superior to that of C-TBC. The results of this study show that the cracking resistance of plasma-sprayed coatings cannot be judged solely from the macroscopic pore structure. Besides the pore structure, the stacking morphology of the splats and the adhesion between the splats are also important factors for the cracking resistance of coatings. As illustrated by the surface morphologies shown in Figure 3 and Figure 4, the particle size of YSZ powder affects the stacking morphology of the splats that form the coating. The lamellar interface roughness of C-TBC is about 3 times that of F-TBC. Furthermore, from the cracking propagation path in the F-TBC (Figure 2b,c and Figure 6d), it can be inferred that the cracking in the coating tends to propagate along the lamellar interface. Therefore, by considering the effect of pore structure, mechanical properties, phase composition, splat stacking morphology, and crack behavior of the coats all together, insufficient lamellar interface roughness is believed to be the major factor responsible for the poor cracking resistance of F-TBC in this study.
A bond coat with a roughness approximately in the range of Ra 5–10 μm provides good adhesion for the ceramic coating [17]. The roughness value Ra of C-TBC is about 3 μm, with a maximum amplitude of the surface profile of up to 8 μm. Therefore, such a rough interface facilitates the adhesion of the subsequent droplets with the previously formed coating surface during the plasma spraying process. Due to the good adhesion of the lamellar interface, it is difficult for the cracks to expand along the lamellar interface in C-TBC. In addition, the rough interface makes the crack propagation path twist and turn, which also increases the difficulty of crack expansion. As a result, intra-splat cracks perpendicular to the substrate (vertical cracks) are formed in C-TBC instead of cracking along the lamellar interface (horizontal cracks). From the statistics of the indentation characteristics in Figure 7, it can be seen that more than 70% of the indentations in C-TBC are accompanied by vertical cracks, and indentations accompanied by horizontal cracks are fewer than 25% with no inter-lamellar cracking. In contrast, the smooth lamellar interface in F-TBC could only provide limited mechanical bonding to accommodate splats. Thus, the cracking resistance of F-TBC is poor due to its susceptibility to cracking along the lamellar interface.
3.4. Thermal Shock Resistance
The macro images of F-TBC and C-TBC samples after 300 thermal cycles are shown in Figure 8a,d. It can be seen that more than 20% of the coating in F-TBC has peeled off, and the failure happens within the top coating (cohesive failure). Failure phenomena did not occur in C-TBC, even after 300 thermal cycles, and the coating remained intact. Figure 8b,e shows the fracture morphologies of F-TBC and C-TBC after 300 thermal cycles. From the fracture characteristics of F-TBC, it can be seen that the coating prepared by fine powder has formed substantial inter-lamellar cracks after the thermal shock test, due to the poor cracking resistance of the interface between the lamellas. It is interesting to note that the distance between these cracks is about 25 μm, exactly the thickness of the coating deposited for each pass. The crack path is consistent with the lamellar interface, indicating that the lamellar interface is prone to debonding. As vertical cracks inside the coating propagate to the lamellar interface, the coating will peel off along the interface, resulting in the partial spalling of the coating, as shown in Figure 8a. For C-TBC, no horizontal cracking along the interface occurs in the coating, so the coating will not fracture, even with vertical cracks.
The interfaces within the plasma-sprayed coating include the lamellar interface, splat interface, and grain boundary. In F-TBC, the lamellar interfaces are smooth, and most of the droplets are stacked on the surface in a flat manner. The cracking resistance of the lamellar interface is worse than that of the splat interface and grain boundary, so inter-lamellar cracking occurs in the coating. The schematic of the crack behavior in F-TBC is shown in Figure 8c. In C-TBC, due to the undulating lamellar interface, the splats in the coating are stacked and anchored to each other. Therefore, the resistance of the cracks propagating along the lamellar interface is too high for continuous transverse cracks to form. Only some scattered intra-splat cracks form in the coatings (cracking along grain boundary), as shown in the scheme in Figure 8f.
Previous study has found that the rate of crack propagation in coatings prepared with coarse YSZ powder is slower than that prepared with fine powder [22]. Based on the results of this study, it can be seen that the stacking morphology of splats has a great influence on the crack propagation behavior of coatings. The roughness of the lamellar interface may affect the cracking resistance of the coatings. A certain degree of roughness is conducive to increasing the resistance to transverse crack expansion along the lamellar interface. Therefore, in future studies, apart from the porosity, the effects of the splat interface on the performance of the coating should also be taken into consideration.
3.5. Particle Erosion Resistance
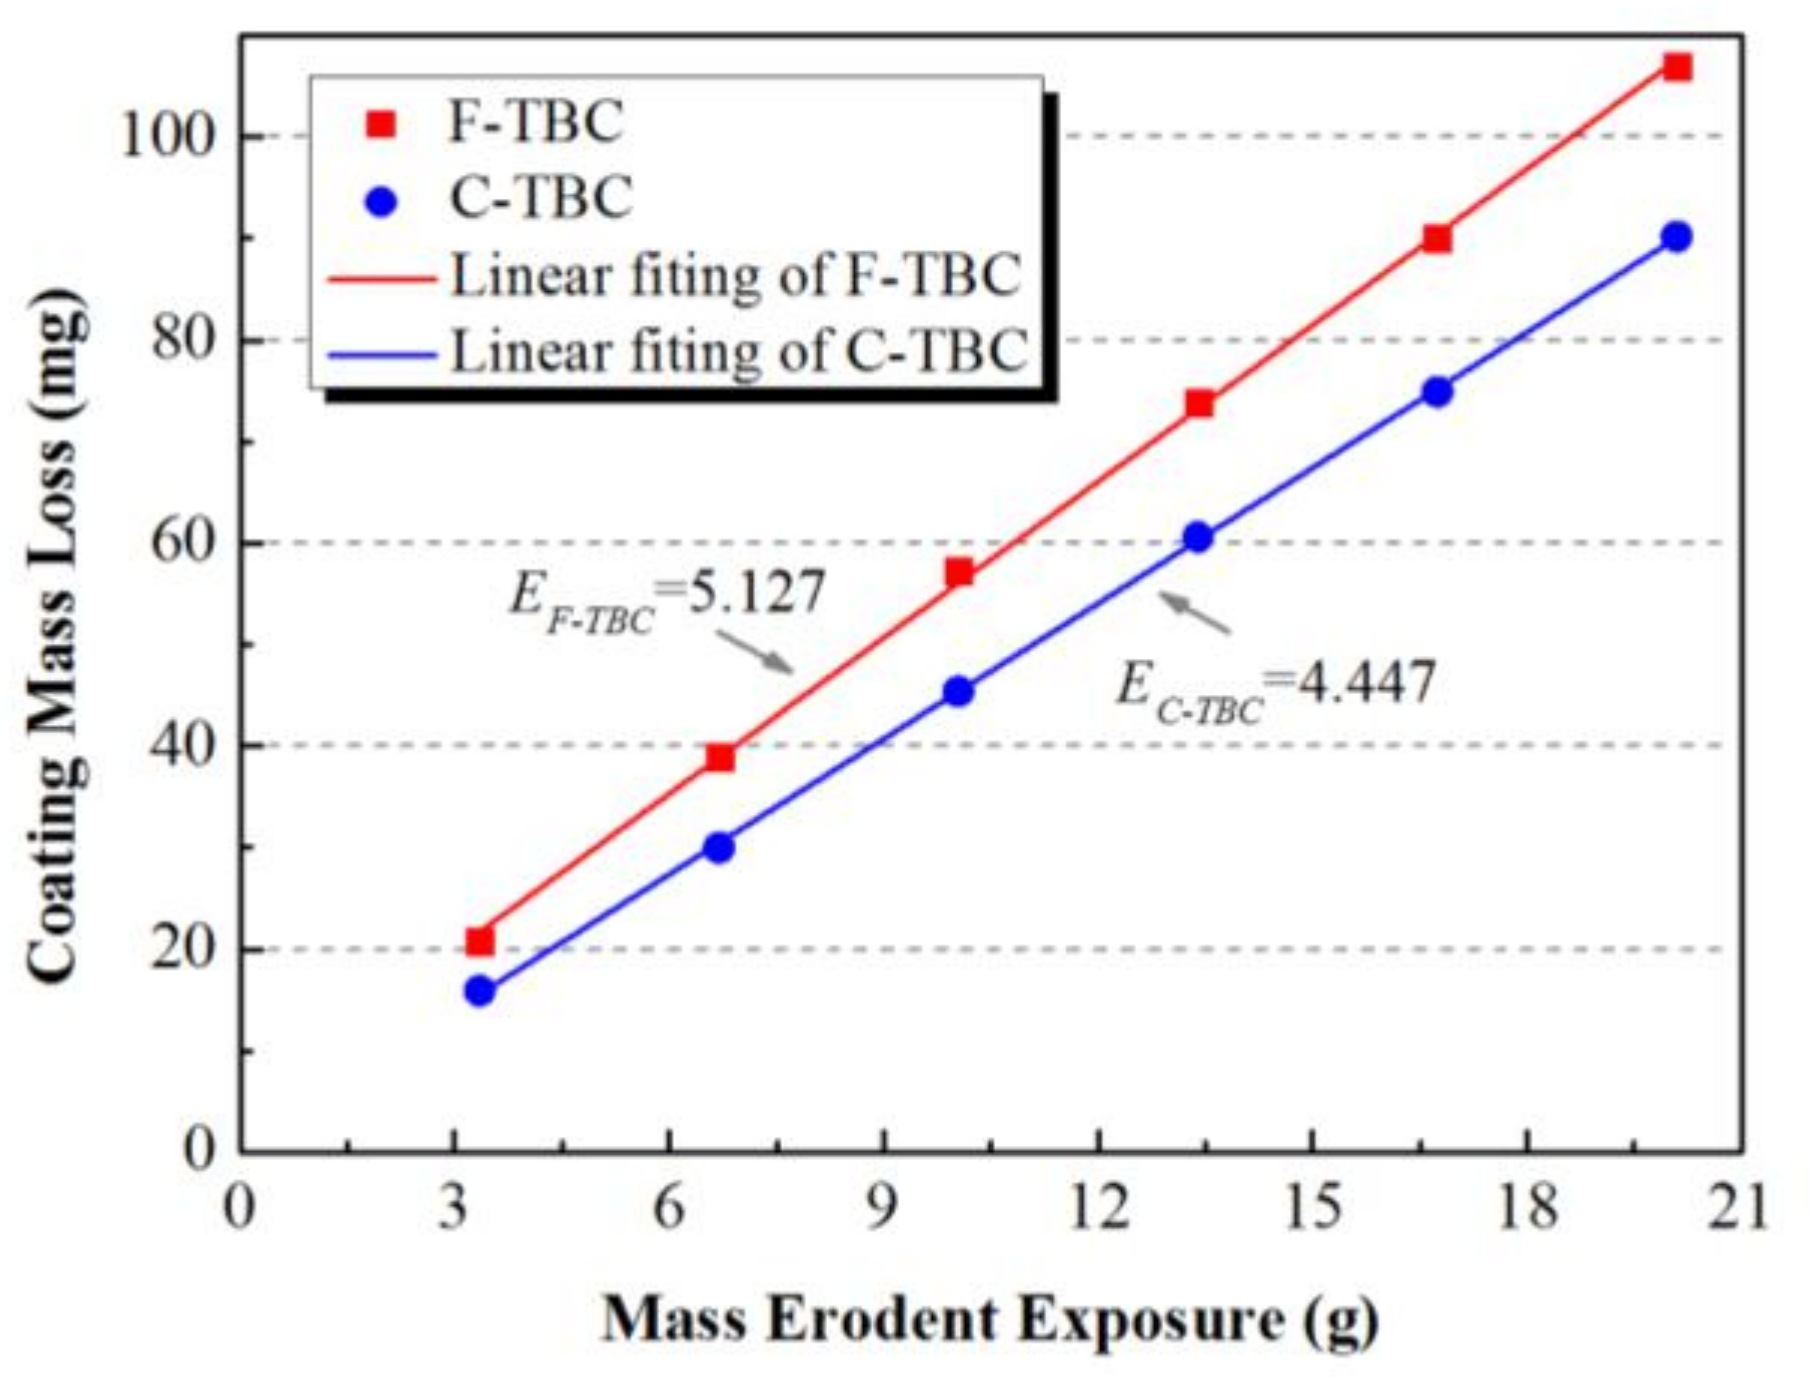
The erosion results are provided in Figure 9. From the ratio of coating mass loss to erodent exposure, it can be seen that the erosion rate of F-TBC is slightly higher than that of C-TBC. Since the erosion failure of the APS coating is mainly due to the delamination of the layered elements, the erosion performance of the coating mainly depends on the porosity, thickness of the lamellas and the bonding strength between the splats [28]. The pores and cracks in the coating may provide the starting sources for the peeling of the coating, and thus the erosion resistance of the coating decreases with increasing porosity [28,29]. In addition, according to Schmitt’s research, smaller splat size provides a lower surface roughness, which has been shown to reduce erosion rate by yielding smaller failure regions [30,31]. In this study, the porosity of F-TBC is lower than that of C-TBC, and the splat size of F-TBC is smaller than that of C-TBC due to the fine feedstock. However, the erosion resistance of F-TBC is worse than that of C-TBC, indicating that in addition to the size of splat and porosity, there are other more important factors that affect the erosion rate of the coating.
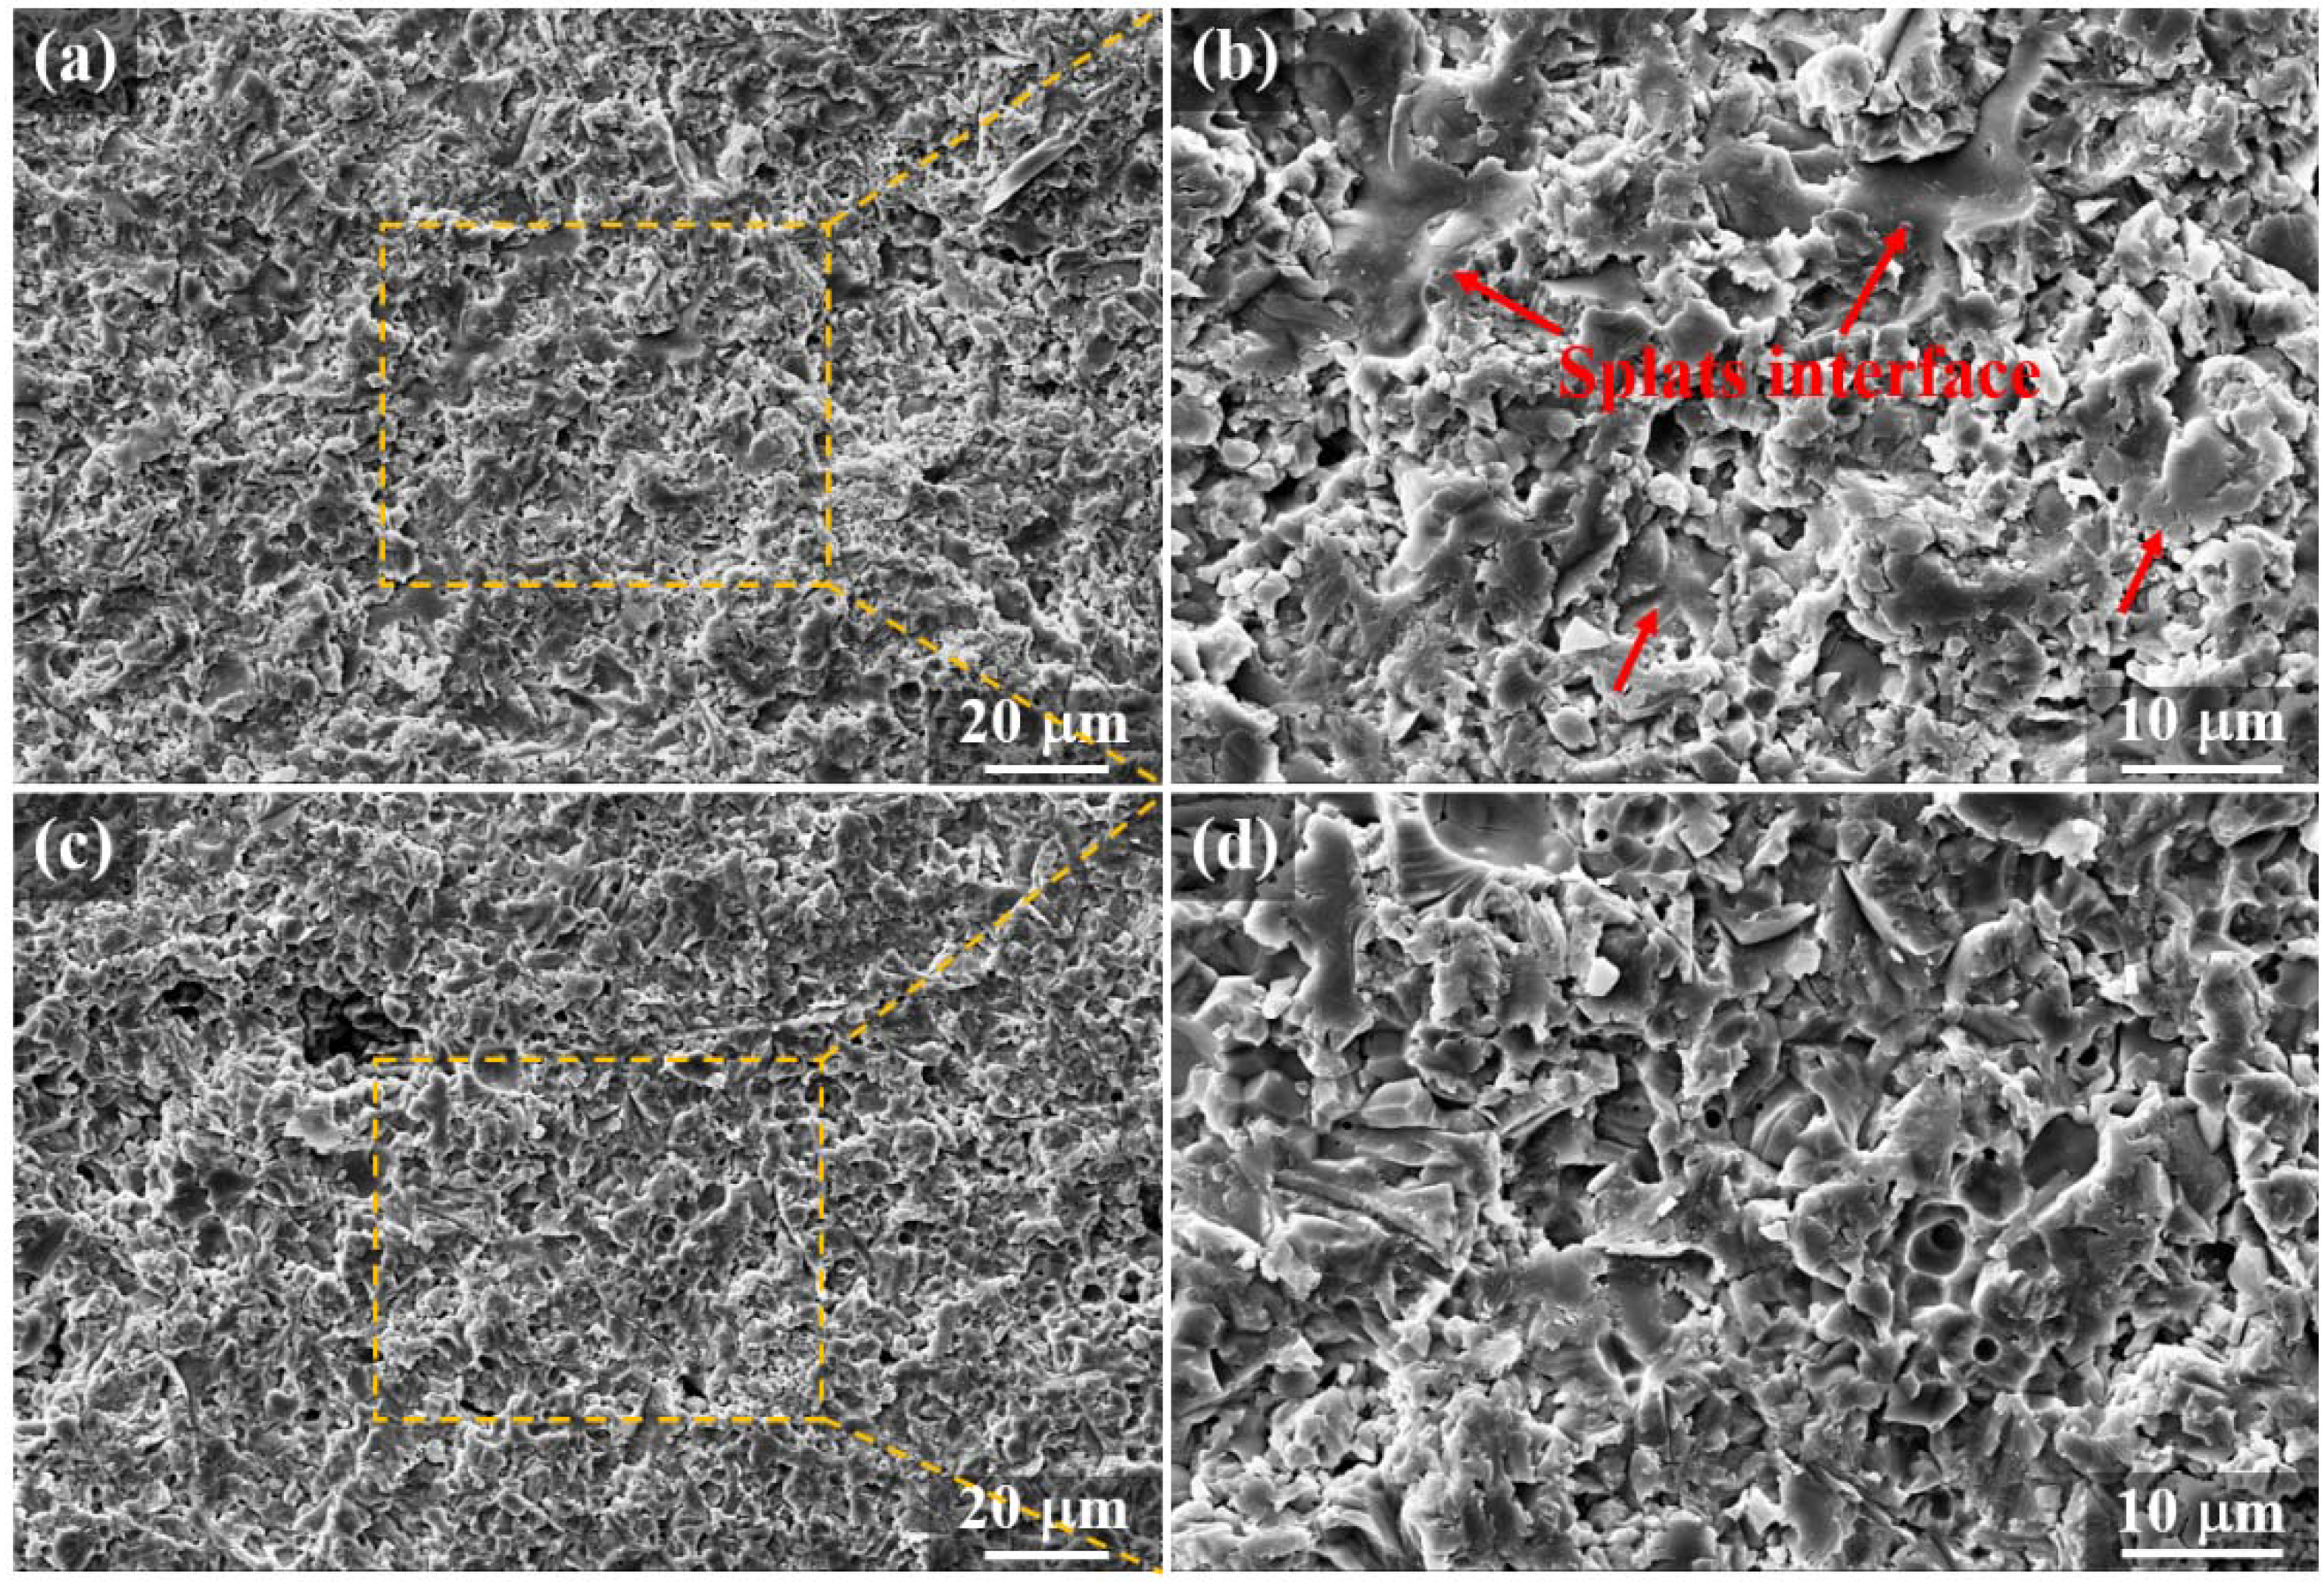
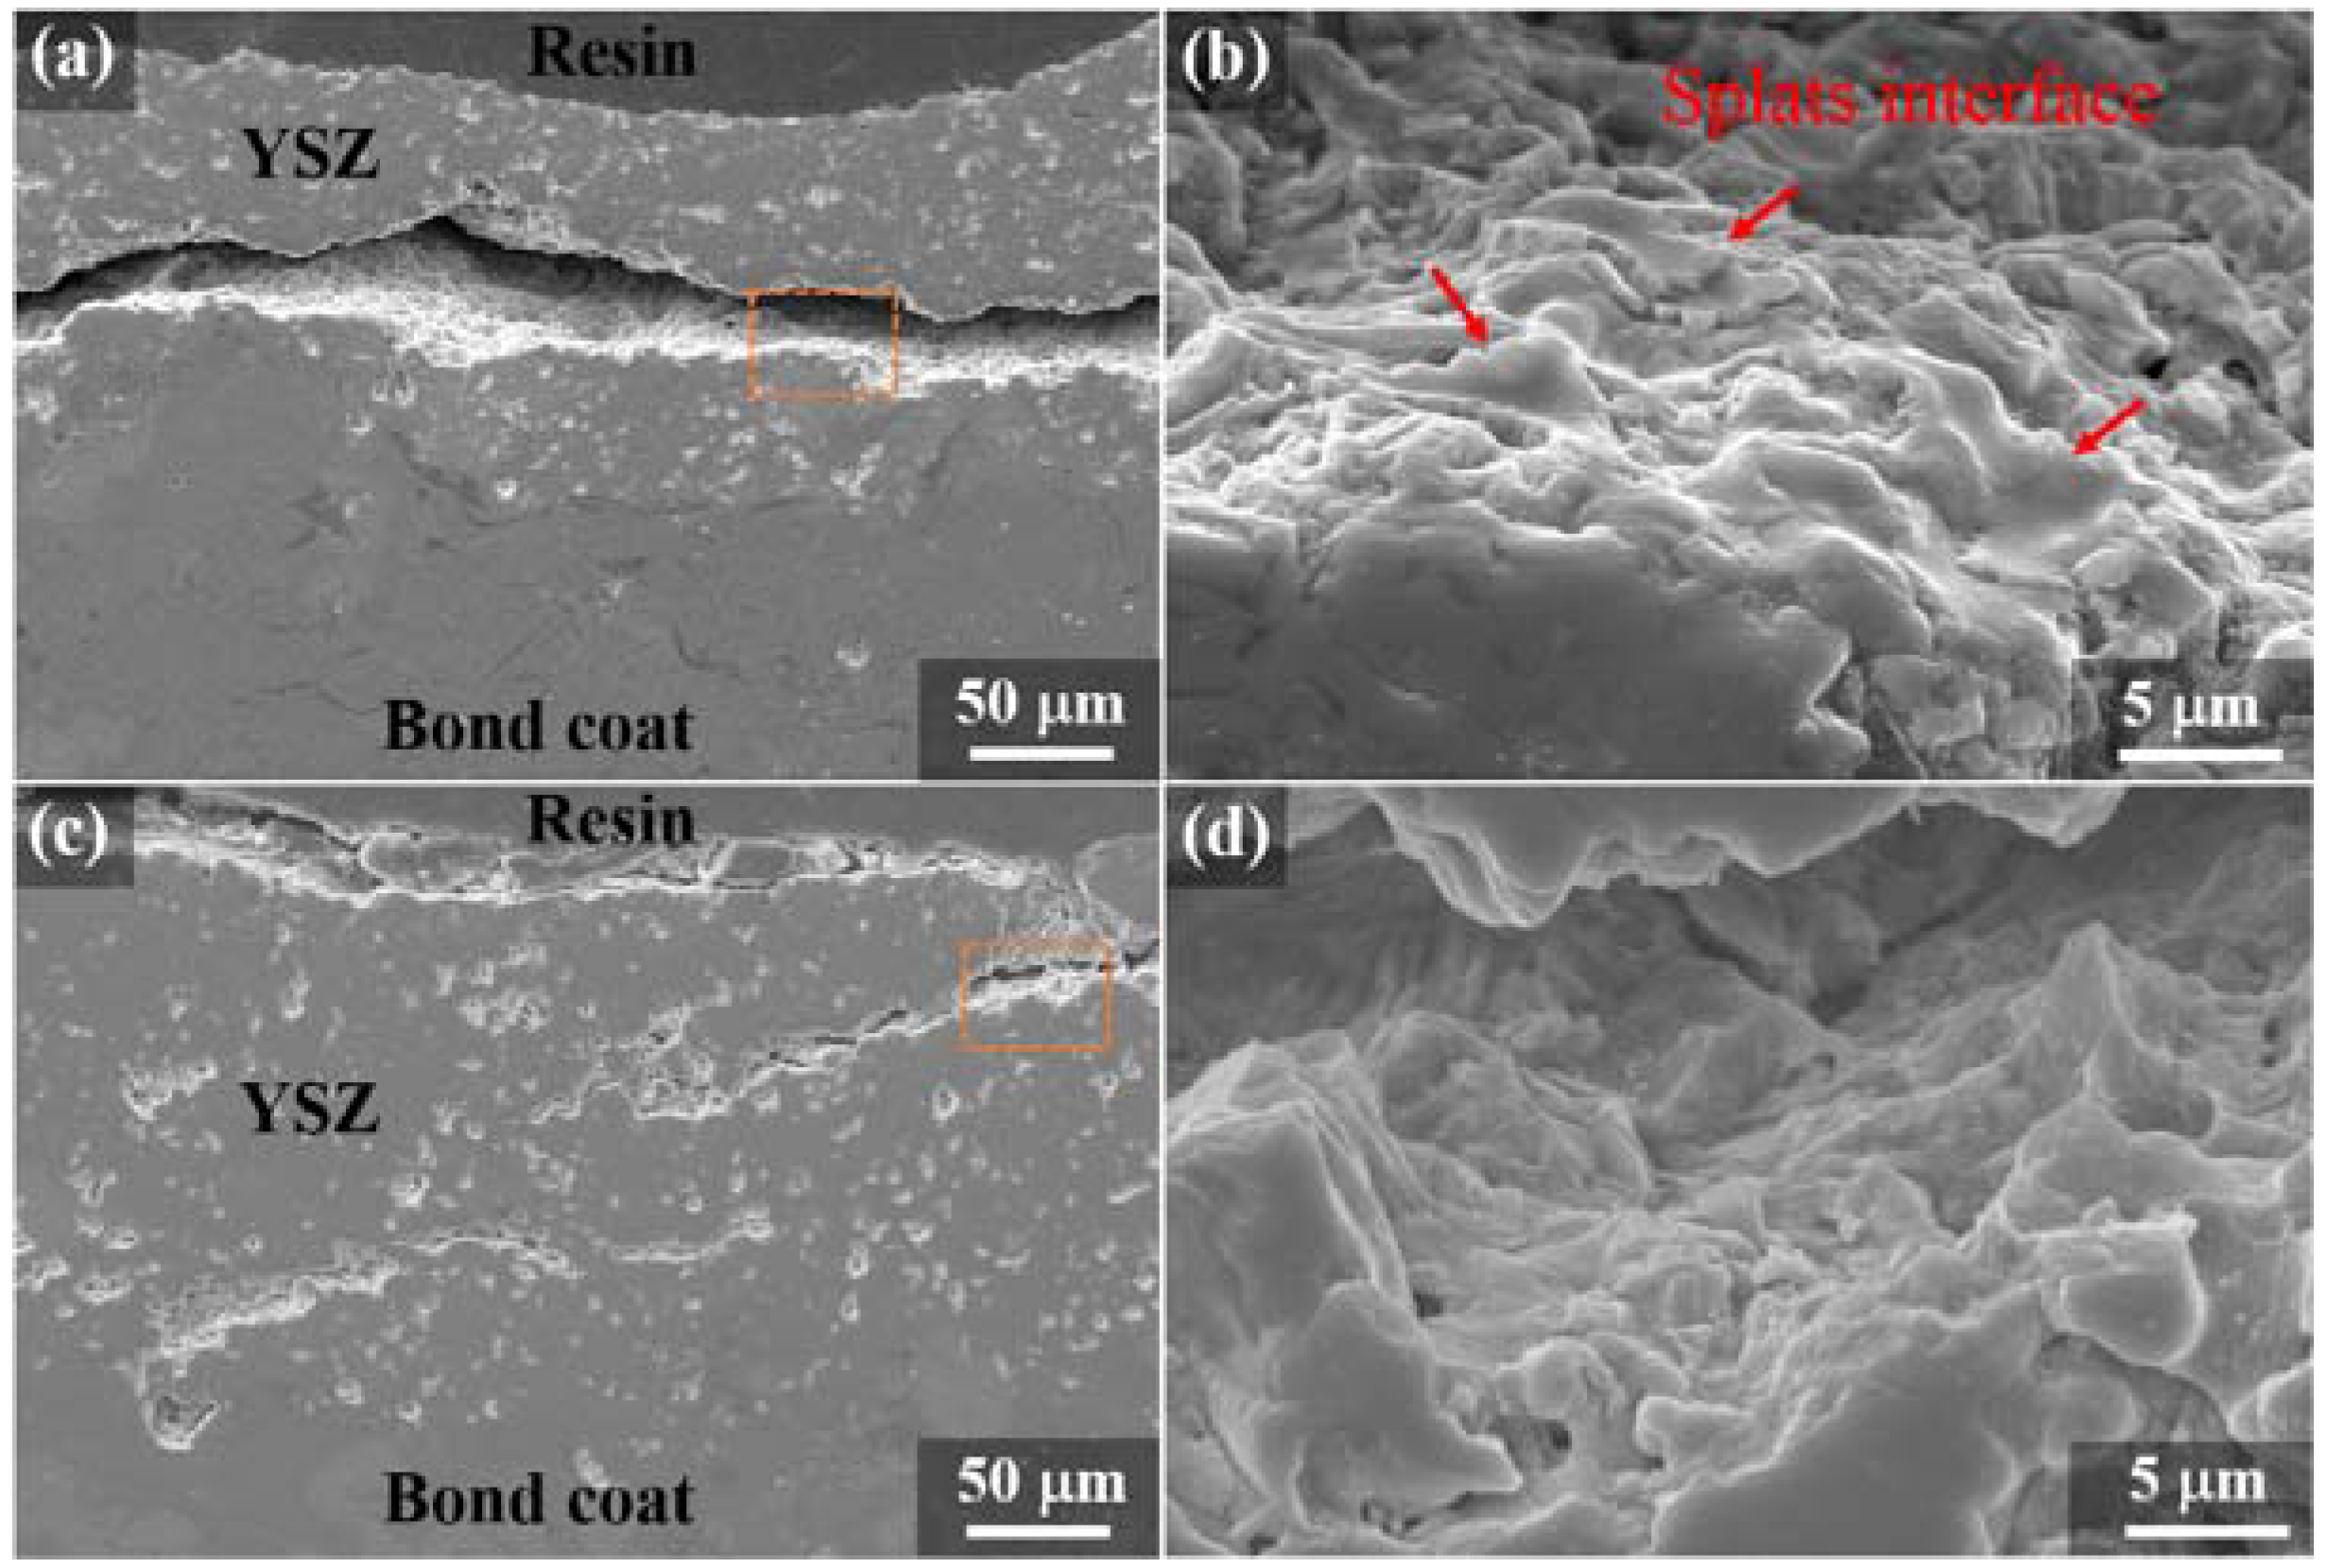
Figure 10 shows the typical surface morphology of the coatings after the erosion test. It was found that the number of splat interfaces (marked in Figure 10b) in the fracture of F-TBC was much higher than that of C-TBC. These interfaces mean that the cracks in F-TBC tend to propagate along the splat boundary under the impact of abrasives. For C-TBC, a large number of splat sections are present in the fracture surface, indicating that the expansion of cracks has to cross the splat. Figure 11 shows the cross-sectional microstructure of the coatings after erosion. Lateral cracking occurred in both F-TBC and C-TBC, and the cracks in F-TBC are larger than those in the C-TBC in terms of both crack length and width. By observing the surface of the cracks at a high magnification, one can see that the cracking in F-TBC is torn along the splat interface, while it is elusive in C-TBC.
Li et al. have reported that the erosion of plasma-sprayed coatings occurred through spalling of the lamella exposed to the coating surface resulting from cracking along the lamellar interface [28]. In this study, the erosion of the F-TBC occurred from the lamellar or splat interfaces, whereas cracking in C-TBC tends to occur inside the splat. The difference in crack propagation mode may be an important factor that affects the erosion resistance of F-TBC and C-TBC. Figure 12 illustrates the behavior of cracks in the coating under the impact of abrasives. As described in Section 3, the cracking resistance of the lamellar interface in F-TBC is poor, so it is easy for cracks to expand through the whole interface of the lamella and consequently lead to the spalling of the coating. For C-TBC, the stack of splats is undulating, and the adhesion between splats is strong. Therefore, the expansion of the cracks needs to cross the splats, instead of cracking along the lamellar interface. It is well known that cracking within the splat is more difficult than that along the splat or lamellar interface, so from the perspective of the anti-cracking performance of the coating, the erosion resistance of C-TBC should be better than that of F-TBC. Considering the effect of porosity, splat size and cracking resistance on the erosion performance of the coatings together, although the splat size and porosity of F-TBC are smaller than those of C-TBC, the poor crack resistance of the F-TBC has a more significant impact on decreasing the erosion resistance of the coating.
4. Conclusions
In this study, YSZ coatings with different lamellar interface morphologies were prepared by using feedstocks with different particle sizes. The influence of lamellar interface roughness on cracking resistance of the coatings was investigated. Furthermore, the effect of cracking resistance on thermal shock and erosion resistance of the coatings was evaluated. The major useful conclusions can be summarized as follows:
- The cracking resistance of plasma-sprayed coatings cannot be judged solely from the macroscopic pore structure. Besides the pore structure, the stacking morphology of the splats and adhesion between the splats are also important factors for the cracking resistance of coatings.
- The particle size of the feedstock powders affects the stacking morphology of the splats that form the coating. The splat stack in C-TBC is undulating, while that in F-TBC is much smoother. Coatings fabricated from the coarse YSZ powders show a relatively rough inter-lamellar surface.
- The cracking resistance of F-TBC is worse than that of C-TBC, and the insufficient lamellar interface roughness is the major factor responsible for the poor cracking resistance of F-TBC. The smooth lamellar interface in F-TBC can only provide limited mechanical bonding to accommodate splats. Thus, the cracking resistance of F-TBC is poor due to its tendency to crack along the lamellar interface. In C-TBC, due to the undulating lamellar interface, the splats in the coating are stacked and anchored to each other. Therefore, the resistance of cracks propagating along the lamellar interface is large.
- The stacking morphology of splats have a great influence on the crack propagation behavior of coatings. During the thermal shock and erosion test, the cracking of F-TBC tends to occur from the lamellar or splat interfaces, whereas that in C-TBC tends to occur inside the splat. The difference in crack propagation mode is an important factor that affects the cracking resistance of the coatings. Coatings prepared using the coarse powder show better thermal shock and erosion resistance than those using the fine one due to their higher cracking resistance.
Author Contributions
J.H., W.W. and C.L. conceived and designed the experiments; J.H., X.L. and S.L. performed the experiments; and J.H. and W.W. analyzed the data and wrote the paper.
Funding
This research was funded by National Natural Science Foundation of China (No. 51775189), Science and Technology Commission of Shanghai Municipality Project (16DZ2260604), Aviation funding (2015ZES7001) and Shanghai Pujiang Program (15PJD009).
Conflicts of Interest
The authors declare no conflict of interest.
References
- Darolia, R. Thermal barrier coatings technology: Critical review, progress update, remaining challenges and prospects. Int. Mater. Rev. 2013, 58, 315–348. [Google Scholar] [CrossRef]
- Padture, N.P.; Gell, M.; Jordan, E.H. Thermal barrier coatings for gas-turbine engine applications. Science 2002, 296, 280–284. [Google Scholar] [CrossRef] [PubMed]
- Bakan, E.; Vaßen, R. Ceramic top coats of plasma-sprayed thermal barrier coatings: Materials, processes, and properties. J. Therm. Spray Technol. 2017, 26, 992–1010. [Google Scholar] [CrossRef]
- Fauchais, P.; Vardelle, M.; Goutier, S. Latest researches advances of plasma spraying: From splat to coating formation. J. Therm. Spray Technol. 2016, 25, 1534–1553. [Google Scholar] [CrossRef]
- Mutter, M.; Mauer, G.; Mücke, R.; Guillon, O.; Vaßen, R. Correlation of splat morphologies with porosity and residual stress in plasma-sprayed ysz coatings. Surf. Coat. Technol. 2017, 318, 157–169. [Google Scholar] [CrossRef]
- Li, D.; Zhao, H.; Zhong, X.; Liu, C.; Wang, L.; Yang, K.; Tao, S. Effect of the bond coating surface morphology on ceramic splat construction. J. Therm. Spray Technol. 2015, 24, 1450–1458. [Google Scholar] [CrossRef]
- Song, X.; Liu, Z.; Suhonen, T.; Varis, T.; Huang, L.; Zheng, X.; Zeng, Y. Effect of melting state on the thermal shock resistance and thermal conductivity of aps ZrO2–7.5 wt. % Y2O3 coatings. Surf. Coat. Technol. 2015, 270, 132–138. [Google Scholar] [CrossRef]
- Syed, A.; Denoirjean, A.; Hannoyer, B.; Fauchais, P.; Denoirjean, P.; Khan, A.; Labbe, J. Influence of substrate surface conditions on the plasma sprayed ceramic and metallic particles flattening. Surf. Coat. Technol. 2005, 200, 2317–2331. [Google Scholar] [CrossRef]
- Ercan, B.; Bowman, K.J.; Trice, R.W.; Wang, H.; Porter, W. Effect of initial powder morphology on thermal and mechanical properties of stand-alone plasma-sprayed 7 wt. % Y2O3–ZrO2 coatings. Mater. Sci. Eng. A 2006, 435, 212–220. [Google Scholar] [CrossRef]
- Kulkarni, A.; Vaidya, A.; Goland, A.; Sampath, S.; Herman, H. Processing effects on porosity-property correlations in plasma sprayed yttria-stabilized zirconia coatings. Mater. Sci. Eng. A 2003, 359, 100–111. [Google Scholar] [CrossRef]
- Guo, H.; Murakami, H.; Kuroda, S. Effect of hollow spherical powder size distribution on porosity and segmentation cracks in thermal barrier coatings. J. Am. Ceram. Soc. 2006, 89, 3797–3804. [Google Scholar] [CrossRef]
- Dwivedi, G.; Viswanathan, V.; Sampath, S.; Shyam, A.; Lara-Curzio, E. Fracture toughness of plasma-sprayed thermal barrier ceramics: Influence of processing, microstructure, and thermal aging. J. Am. Ceram. Soc. 2014, 97, 2736–2744. [Google Scholar] [CrossRef]
- Li, C.-J.; Ohmori, A. Relationships between the microstructure and properties of thermally sprayed deposits. J. Therm. Spray Technol. 2002, 11, 365–374. [Google Scholar] [CrossRef]
- Zheng, Z.; Luo, J.; Li, Q. Mechanism of competitive grain growth in 8YSZ splats deposited by plasma spraying. J. Therm. Spray Technol. 2015, 24, 885–891. [Google Scholar] [CrossRef]
- Li, C.J.; Li, Y.; Yang, G.J.; Li, C.X. Evolution of lamellar interface cracks during isothermal cyclic test of plasma-sprayed 8YSZ coating with a columnar-structured YSZ interlayer. J. Therm. Spray Technol. 2013, 22, 1374–1382. [Google Scholar] [CrossRef]
- Wang, Z.; Kulkarni, A.; Deshpande, S.; Nakamura, T.; Herman, H. Effects of pores and interfaces on effective properties of plasma sprayed zirconia coatings. Acta Mater. 2003, 51, 5319–5334. [Google Scholar] [CrossRef]
- Vaßen, R.; Kerkhoff, G.; Stöver, D. Development of a micromechanical life prediction model for plasma sprayed thermal barrier coatings. Mater. Sci. Eng. A 2001, 303, 100–109. [Google Scholar] [CrossRef]
- Eriksson, R.; Sjöström, S.; Brodin, H.; Johansson, S.; Östergren, L.; Li, X.H. TBC bond coat-top coat interface roughness: Influence on fatigue life and modelling aspects. Surf. Coat. Technol. 2013, 236, 230–238. [Google Scholar] [CrossRef]
- Gupta, M.; Skogsberg, K.; Nylén, P. Influence of topcoat-bondcoat interface roughness on stresses and lifetime in thermal barrier coatings. J. Therm. Spray Technol. 2014, 23, 170–181. [Google Scholar] [CrossRef]
- Cheng, B.; Zhang, Y.M.; Yang, N.; Zhang, M.; Chen, L.; Yang, G.J.; Li, C.X.; Li, C.J. Sintering-induced delamination of thermal barrier coatings by gradient thermal cyclic test. J. Am. Ceram. Soc. 2017, 100, 1820–1830. [Google Scholar] [CrossRef]
- Huang, J.; Wang, W.; Lu, X.; Hu, D.; Feng, Z.; Guo, T. Effect of particle size on the thermal shock resistance of plasma-sprayed ysz coatings. Coatings 2017, 7, 150. [Google Scholar] [CrossRef]
- Huang, J.; Wang, W.; Yu, J.; Wu, L.; Feng, Z. Effect of particle size on the micro-cracking of plasma-sprayed ysz coatings during thermal cycle testing. J. Therm. Spray Technol. 2017, 26, 755–763. [Google Scholar] [CrossRef]
- Guo, H.; Kuroda, S.; Murakami, H. Microstructures and properties of plasma-sprayed segmented thermal barrier coatings. J. Am. Ceram. Soc. 2006, 89, 1432–1439. [Google Scholar] [CrossRef]
- Babu, P.S.; Rao, D.S.; Rao, G.V.N.; Sundararajan, G. Effect of feedstock size and its distribution on the properties of detonation sprayed coatings. J. Therm. Spray Technol. 2007, 16, 281–290. [Google Scholar] [CrossRef]
- Paul, S. Stiffness of plasma sprayed thermal barrier coatings. Coatings 2017, 7, 68. [Google Scholar] [CrossRef]
- Ahmadian, S.; Jordan, E.H. Explanation of the effect of rapid cycling on oxidation, rumpling, microcracking and lifetime of air plasma sprayed thermal barrier coatings. Surf. Coat. Technol. 2014, 244, 109–116. [Google Scholar] [CrossRef]
- Quinn, G.D.; Bradt, R.C. On the vickers indentation fracture toughness test. J. Am. Ceram. Soc. 2010, 90, 673–680. [Google Scholar] [CrossRef]
- Li, C.J.; Yang, G.J.; Ohmori, A. Relationship between particle erosion and lamellar microstructure for plasma-sprayed alumina coatings. Wear 2006, 260, 1166–1172. [Google Scholar] [CrossRef]
- Janos, B.Z.; Lugscheider, E.; Remer, P. Effect of thermal aging on the erosion resistance of air plasma sprayed zirconia thermal barrier coating. Surf. Coat. Technol. 1999, 113, 278–285. [Google Scholar] [CrossRef]
- Schmitt, M.P.; Schreiber, J.M.; Rai, A.K.; Eden, T.J.; Wolfe, D.E. Development and optimization of tailored composite tbc design architectures for improved erosion durability. J. Therm. Spray Technol. 2017, 26, 1062–1075. [Google Scholar] [CrossRef]
- Schmitt, M.P.; Harder, B.J.; Wolfe, D.E. Process-structure-property relations for the erosion durability of plasma spray-physical vapor deposition (PS-PVD) thermal barrier coatings. Surf. Coat. Technol. 2016, 297, 11–18. [Google Scholar] [CrossRef]
Figure 1.
Schematic diagram of the erosion device.

Figure 2.
Cross-section microstructure of the as-sprayed YSZ coatings: (a–c) F-TBC; (d–f) C-TBC.
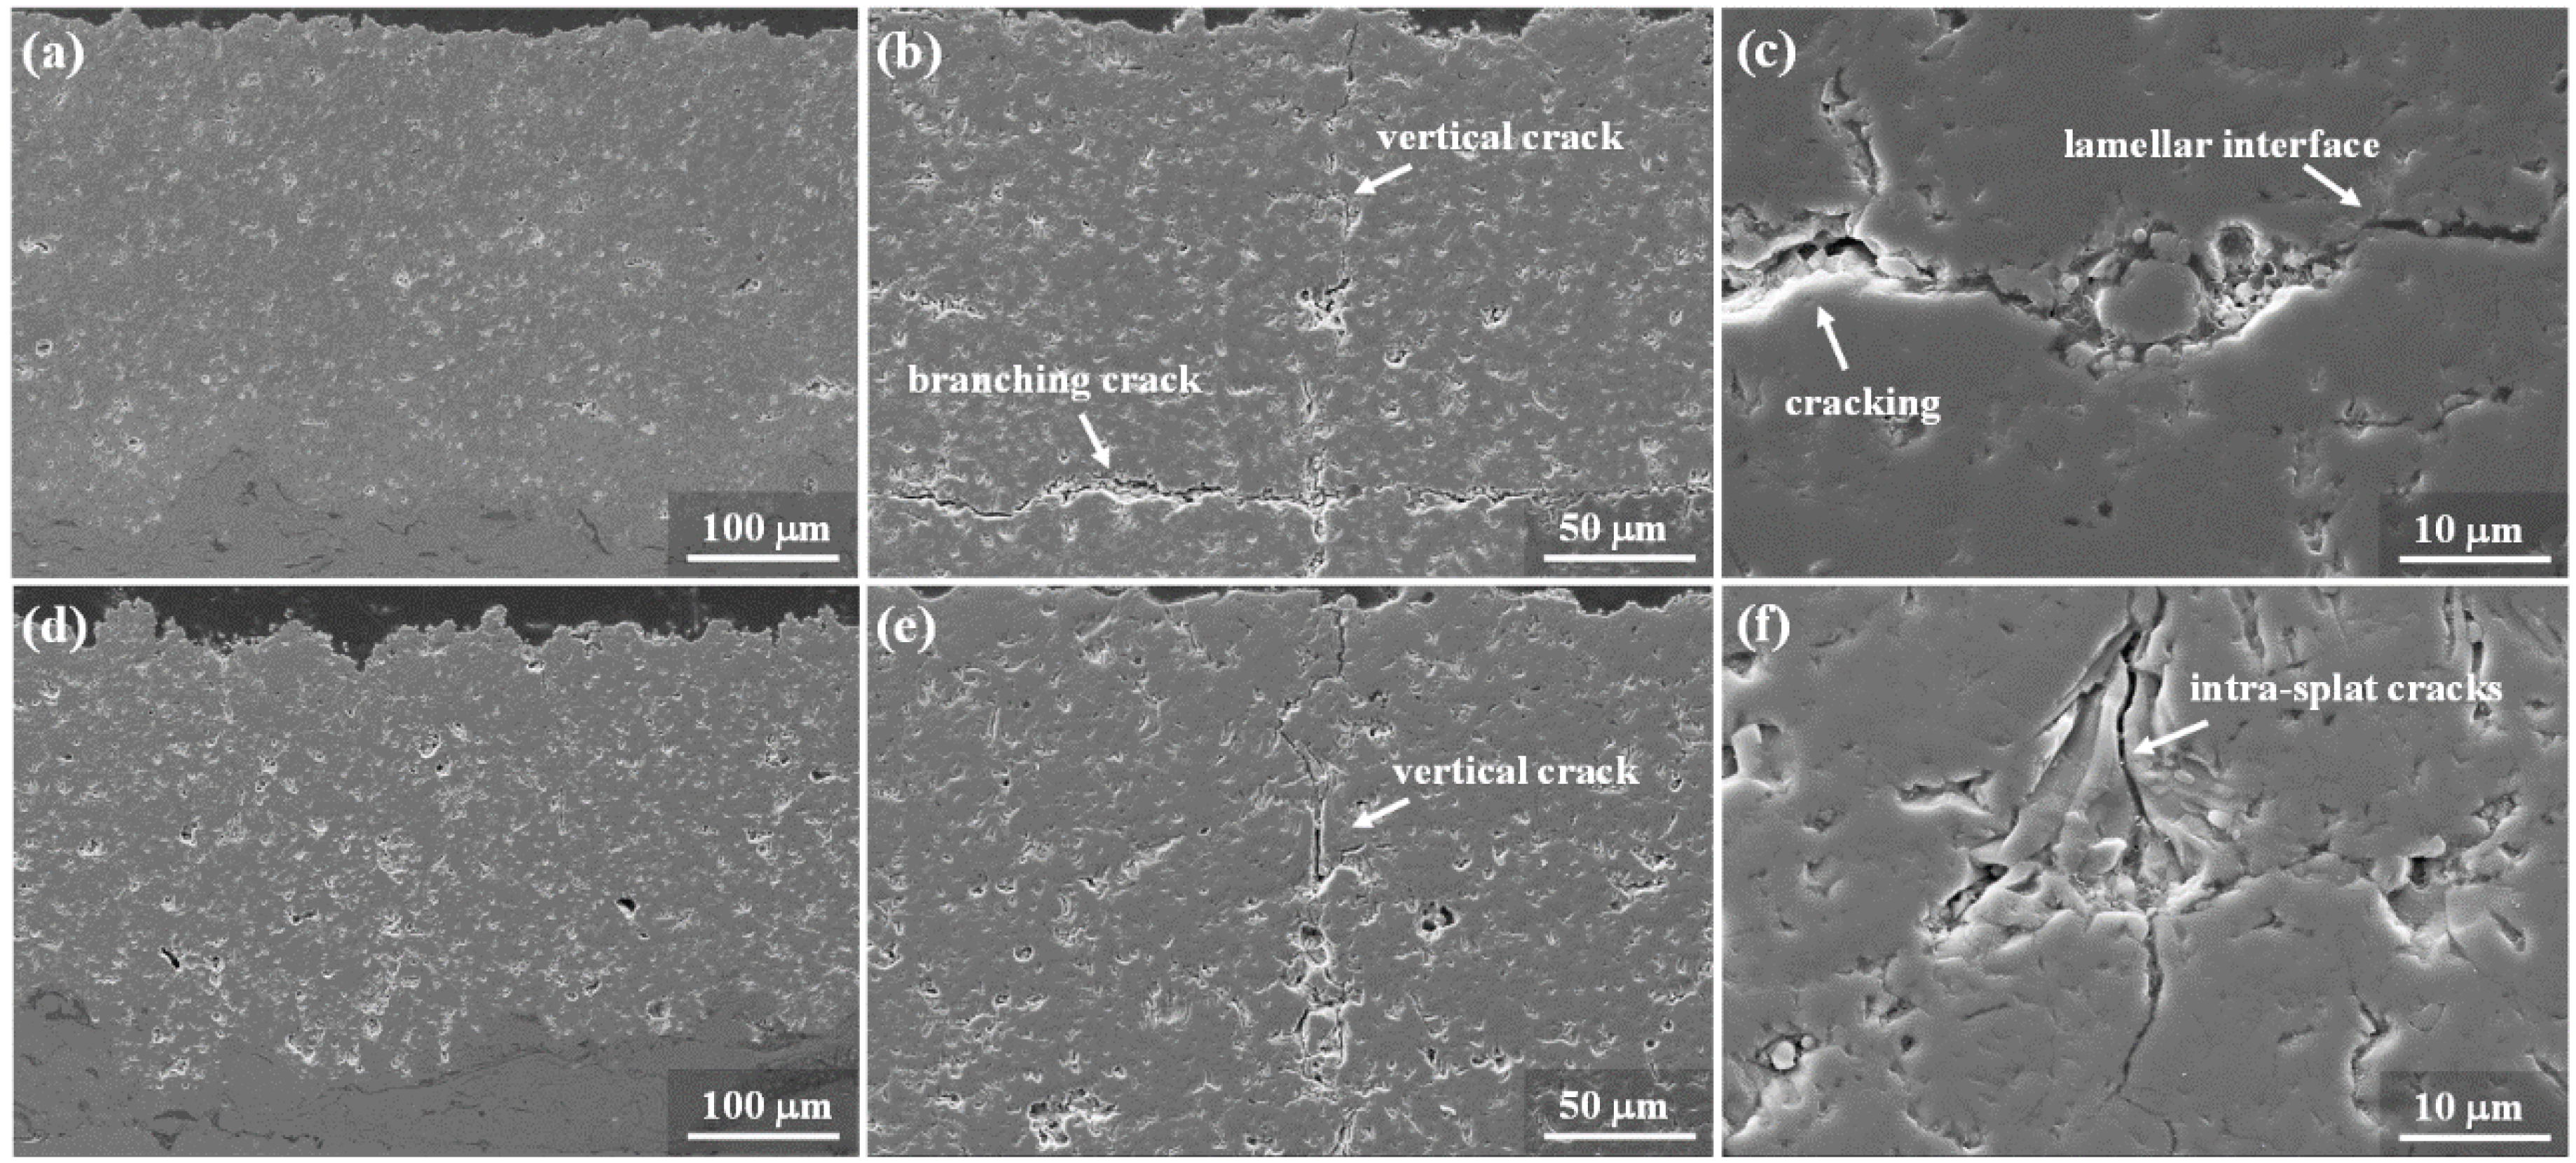
Figure 3.
Surface morphology of the YSZ coatings: (a,b) F-TBC; (c,d) C-TBC.

Figure 4.
3D morphological views (a) and roughness (b) of F-TBC and C-TBC.

Figure 5.
XRD patterns of YSZ feedstocks and coatings before and after the thermal cyclic test: (a) global analysis in a diffraction angle range from 10° to 80°; (b) detailed analysis in a diffraction angle range from 27° to 33° and (c) peak shift of XRD patterns of coatings during thermal cycling.
Figure 5.
XRD patterns of YSZ feedstocks and coatings before and after the thermal cyclic test: (a) global analysis in a diffraction angle range from 10° to 80°; (b) detailed analysis in a diffraction angle range from 27° to 33° and (c) peak shift of XRD patterns of coatings during thermal cycling.

Figure 6.
Four types of typical indentation morphology of F-TBC and C-TBC: (a) indentation with vertical cracks, C-TBC; (b) indentation with horizontal cracks, F-TBC; (c) crushed indentation, C-TBC and (d) indentation with inter-lamellar cracking, F-TBC.
Figure 6.
Four types of typical indentation morphology of F-TBC and C-TBC: (a) indentation with vertical cracks, C-TBC; (b) indentation with horizontal cracks, F-TBC; (c) crushed indentation, C-TBC and (d) indentation with inter-lamellar cracking, F-TBC.

Figure 7.
Statistics of the indentation features of F-TBC and C-TBC.

Figure 8.
Illustration of thermal shock failure modes of two kinds of coatings. Macro image of F-TBC (a) and C-TBC (d) after 300 thermal cycles; fracture morphology of F-TBC (b) and C-TBC (e); schematic of crack behavior of F-TBC (c) and C-TBC (f).
Figure 8.
Illustration of thermal shock failure modes of two kinds of coatings. Macro image of F-TBC (a) and C-TBC (d) after 300 thermal cycles; fracture morphology of F-TBC (b) and C-TBC (e); schematic of crack behavior of F-TBC (c) and C-TBC (f).

Figure 9.
Erosion results in terms of coating mass loss as a function of erodent exposure.

Figure 10.
Surface morphology of the coatings after the erosion test. (a,b) F-TBC; (c,d) C-TBC.

Figure 11.
Cross-sectional microstructure of the coatings after erosion. (a,b) F-TBC; (c,d) C-TBC.

Figure 12.
Illustration of particle erosion failure modes of two kinds of coatings.


Table 1.
Elastic modulus and hardness of the F-TBC and C-TBC.
| Coatings | Elastic Modulus by Nano-Indentation Technique (GPa) | Hardness by Nano-Indentation Technique (GPa) | Vickers Hardness (Hv) |
|---|---|---|---|
| F-TBC | 166 ± 16 | 10 ± 2 | 786 ± 28 |
| C-TBC | 213 ± 19 | 15 ± 2 | 765 ± 46 |
© 2018 by the authors. Licensee MDPI, Basel, Switzerland. This article is an open access article distributed under the terms and conditions of the Creative Commons Attribution (CC BY) license (http://creativecommons.org/licenses/by/4.0/).
Share and Cite
MDPI and ACS Style
Huang, J.; Wang, W.; Lu, X.; Liu, S.; Li, C. Influence of Lamellar Interface Morphology on Cracking Resistance of Plasma-Sprayed YSZ Coatings. Coatings 2018, 8, 187. https://doi.org/10.3390/coatings8050187
AMA Style
Huang J, Wang W, Lu X, Liu S, Li C. Influence of Lamellar Interface Morphology on Cracking Resistance of Plasma-Sprayed YSZ Coatings. Coatings. 2018; 8(5):187. https://doi.org/10.3390/coatings8050187
Chicago/Turabian StyleHuang, Jibo, Weize Wang, Xiang Lu, Shaowu Liu, and Chaoxiong Li. 2018. "Influence of Lamellar Interface Morphology on Cracking Resistance of Plasma-Sprayed YSZ Coatings" Coatings 8, no. 5: 187. https://doi.org/10.3390/coatings8050187
Note that from the first issue of 2016, this journal uses article numbers instead of page numbers. See further details here.