Assessing of New Coatings for Iron Artifacts Conservation by Recurrence Plots Analysis


1
Departamento de Ingeniería Metalúrgica, Facultad de Química, Universidad Nacional Autónoma de México, C.U., Ciudad de Mexico, C.P. 04510, Mexico
2
Centro de Investigación en Corrosión (CICORR), Universidad Autónoma de Campeche, Av. A. Melgar s/n, Col. Buenavista, Campeche, Cam, C.P. 24030, Mexico
*
Author to whom correspondence should be addressed.
Coatings 2019, 9(1), 12; https://doi.org/10.3390/coatings9010012
Submission received: 16 November 2018
/
Revised: 21 December 2018
/
Accepted: 23 December 2018
/
Published: 26 December 2018
(This article belongs to the Special Issue Advances in Organic and Polymeric Coatings )
Abstract
:Cast iron has stood for centuries of invention. It is a very versatile and durable material. Coating systems are a low-maintenance protection method. The purpose of this research is to increase the Paraloid coating’s resistance when applied to iron in high humidity atmospheres, with the addition of caffeine (1,3,7-dimethylxanthine) and nicotine (S)-3-(1-methylpyrrolidin-2-yl) pyridine as corrosion inhibitors; the resistance of protection versus exposure time will be evaluated by using electrochemical noise. A statistical analysis of the electrochemical noise signals was carried out. Recurrence plots were used as a powerful tool in the analysis to complement the data obtained and they predicted the evaluation of coatings behaviors performance versus time. The outcomes show that the addition of inhibitors increases and improves the performance as a temporary protection of Paraloid and that protection in high relative humidity was improved. Recurrence plots and parameter quantification show the variances in the surface corrosion dynamics.
1. Introduction
Temporary protection systems based on coatings are usually used in iron objects preserved in museums. The protective layer insulates metal surfaces from moisture, air pollutants, acids, etc. This method provides a passive protection against corrosion [1]. Acrylic systems, such as Paraloid B-72, a copolymer of ethyl methacrylate and methyl methacrylate, have been extensively used for more than twenty years in restoration work as an adhesive and in conservation as a protective film. One of its most notable properties is that, according to Feller [2], Paraloid B-72 is one of the few polymers that has an expected duration of 100 years, and that, under average museum conditions, it can be stored without changes in its transparency. Furthermore, its original solvent is soluble for more than 200 years (according to a projection based on accelerated aging studies). It is a fairly stable resin, nevertheless, its polymer chains deteriorate quickly if exposed to ultraviolet radiation, and its high water permeability decreases its useful life, which is well-known in the industrial field [3].
Another method employed for anticorrosive protection is the use of corrosion inhibitors, which contrast to industrial applications, since, in metal preservation, the addition of the inhibitor to the electrolyte is not mainly used. By definition, inhibitors are used in closed or controlled environments, while objects are exposed to atmospheric conditions that are difficult to control [4]. On the contrary, inhibitors are applied directly on the surface to produce modifications or they are mixed with the varnish. This change in concept and application is important for research on the use of inhibitors in the field of cultural heritage [5,6,7].
Some inhibitors are being widely used in the preservation and restoration treatments of copper, iron, and silver alloys [8]. For iron alloys, tannic acid and benzotriazole (BTA) are used, tannins being the most used [9]. However, the appearance of a complex of black tannate on the surface is a disadvantage, which is why the use of natural-origin corrosion inhibitors has been proposed [10].
Most of these compounds contain nitrogen, sulfur, and oxygen with a free pair of electrons; additionally, they have aromatic systems [11,12,13]. These compounds can act on the metal surface through adsorption, by blocking the active sites or by forming a protective layer that can reduce the corrosion rate. N, O, and S are atoms present in the heterocyclic compounds, and are oriented towards the sites where the adsorption probably occurs, because of the availability of a free electron pair [14]. Existing data show that most organic inhibitors act by adsorption at the metal/solution interface, specifically by the displacement of water molecules, which forms a compact film that works as a barrier.
Coating modifications used in the conservation of metallic artifacts are proposed, adding caffeine and nicotine as alternative inhibitors to increase the performance of Paraloid B-72 in high-humidity environments. Improvements are discovered in the mechanism of the metal coating interface through inhibition. Cast iron was selected for evaluation since it shows significant modifications in the corrosion mechanism when atmospheric conditions change. The evaluation of the coatings was carried out through electrochemical noise (EN) with atmospheric corrosion monitors in conditions of 40% and 98% relative humidity (RH), which allows obtaining results in relatively short exposure times due to the high sensitivity of this technique [15,16,17].
The electrochemical noise technique (the study of the spontaneous fluctuations in voltage and current of the electrode in function of the time) has been employed to determine the anticorrosive resistance in coated substrates [18,19,20,21,22]. This technique allows discerning the corrosion mechanisms that occur through the film, as well as the resistance that it presents. This is why it has proven to be an effective method for comparing coatings performance [23,24,25]. Time series can be analyzed by statistical and spectral methods, to estimate characteristics that generally describe the behavior of the coated metal [26]. The phenomena that occur on the metal surface in atmospheric conditions are not precisely stationary systems where the dynamics do not change as a function of time. Accordingly, the study of chaotic systems is justified by the existence of many phenomena that have a temporal evolution governed by perfectly deterministic models. An alternative to the statistical analysis of the phenomena that behave in a complex or non-regular way is the recurrence of plots method which allows evaluating the dynamic behavior when identifying the changes in the signals obtained.
The main aim of this research is the study of the current electrochemical noise signal to characterize the dynamics of the corrosion process of the coated iron when relative humidity conditions are modified. Qualitative and quantitative analysis is proposed by recurrence plots (RP) as a tool that promotes the use of the technique to assess coatings, optimizing the information obtained.
2. Materials and Methods
2.1. Materials
Class 25 gray iron was used as working electrode, the chemical composition was set to ensure that variations in composition and microstructure did not alter the electrochemical results. To perform the analysis, the sample was fixed with two parallel surface areas of 5 cm2. After a suitable preparation, an analysis process was carried out by arc/spark optical emission spectroscopy (OES) analyzer. The equipment used was a SpectroLab Spectrometer brand model LAVWA18B analytical instrument (Mahwah, NJ, USA). The chemical composition obtained is shown in Table 1.
The caffeine and nicotine used were Sigma-Aldrich brand (Saint Louis, MO, USA) and were analytical grade reagents with ≥99% purity. Paraloid B72 was provided by Carl Roth (Schoemperlenstraße, Karlsruhe, Germany) and the acetone used was provided by J. T. Baker RA (Center Valley, PA, USA). Paraloid B72 was dissolved in acetone 5% (w/v) and applied with Kolinsky Brush No. 7, Winsor and Newton (Glasgow, Scotland, UK). To set the concentration on the surface, the Paraloid and the compounds were mixed. For each 100 mL of coating, 5 g of Paraloid B72 and 50 mg of the compound were dissolved in acetone. A total of 0.1 mL of the mixture was applied per square centimeter of area. The inhibitor concentration on the surface was set at 50 μg · cm−2. Both compounds were added in the preparation to control the amount of inhibitor on the surface, and not on the surface as a pretreatment (as they are most commonly applied). Only one coating layer was applied and placed into a desiccator for 24 h; five linear measurements on the dry film were performed, and the typical standard deviation was calculated. The dry film thickness was set at 30 μm with a deviation of ±5 μm carried out by an Elcometer coating thickness gauge. Measurements were carried out under the ASTM B499-09 Standard [27].
2.2. Sensor Construction (Atmospheric Corrosion Monitor, ACM)
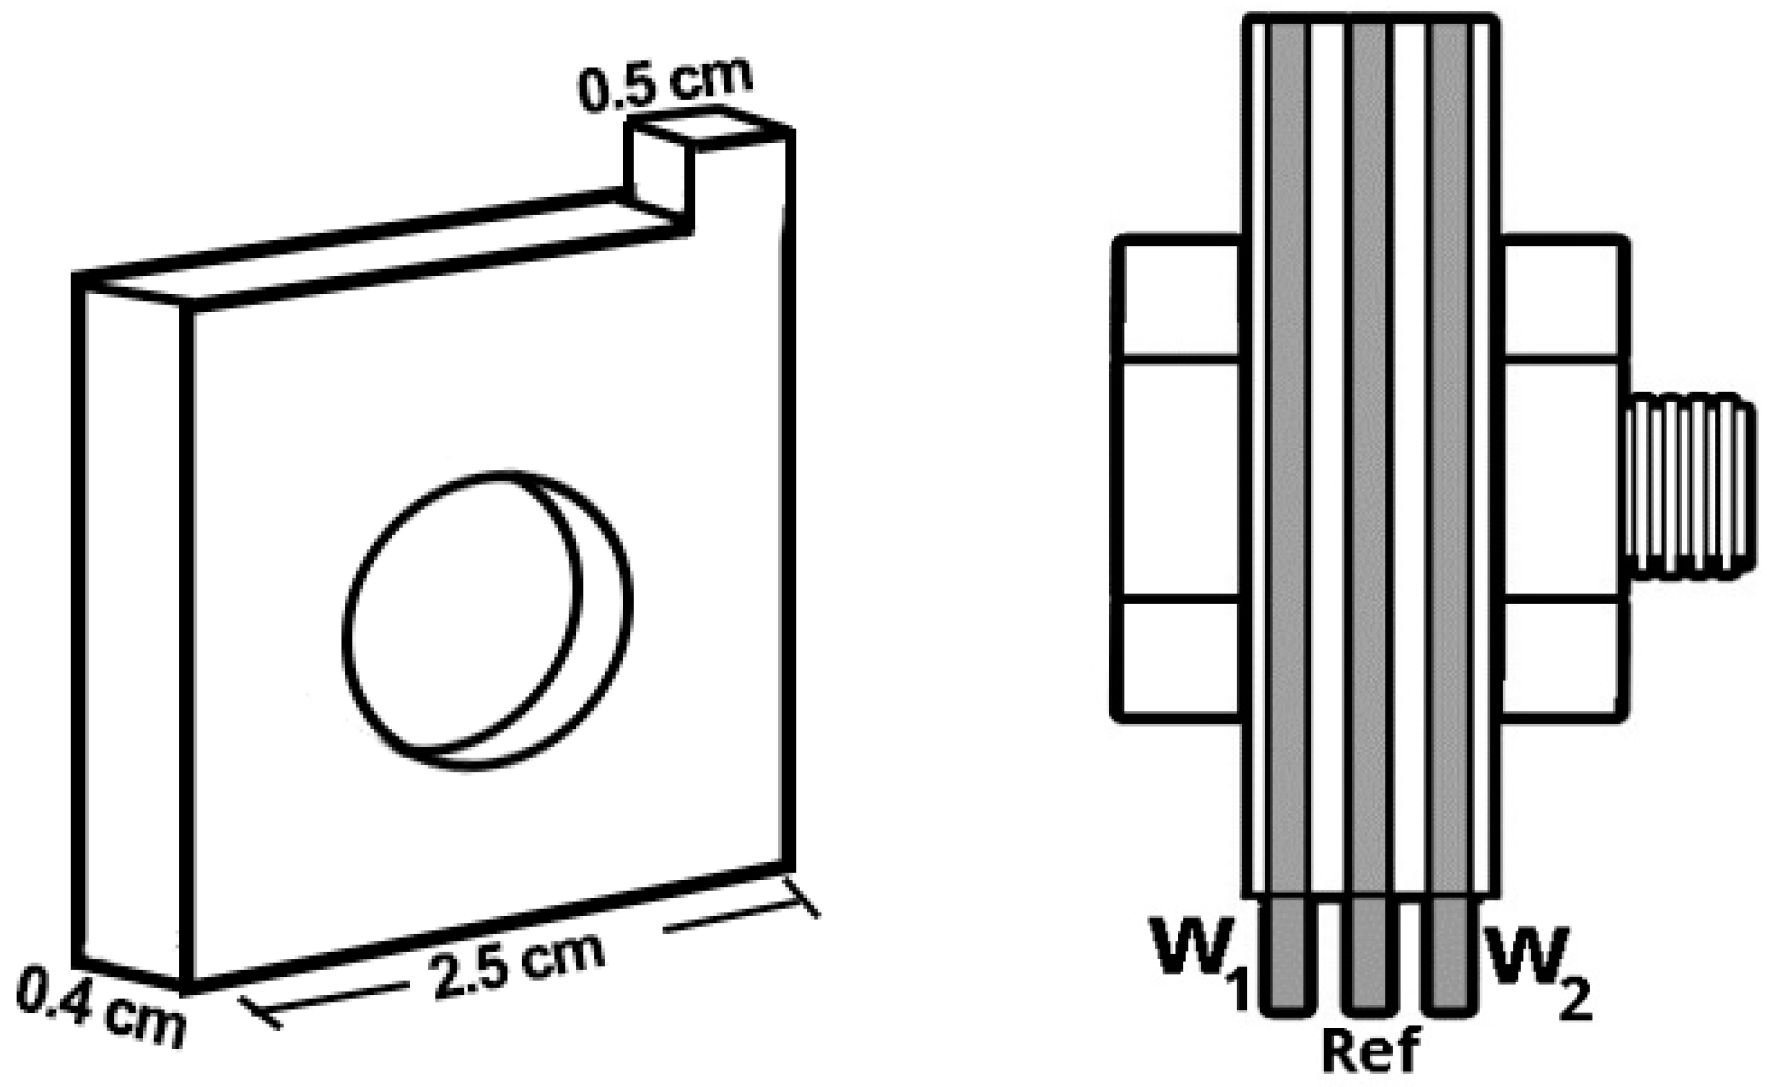
An electrochemical monitor (ACM) was assembled to assess the performance of the coatings in atmospheric conditions. The design consists of an arrangement of three identical electrodes: two electrodes as working electrodes (W1, W2) and a central electrode functions as a “pseudo” reference electrode (Ref). The metal plates were cut to 2.5 × 2.5 cm2 with a thickness of 0.4 cm. To avoid the short-circuit of the metal electrodes, a 0.1 mm thick Teflon plate was placed between each of them, as shown in Figure 1.
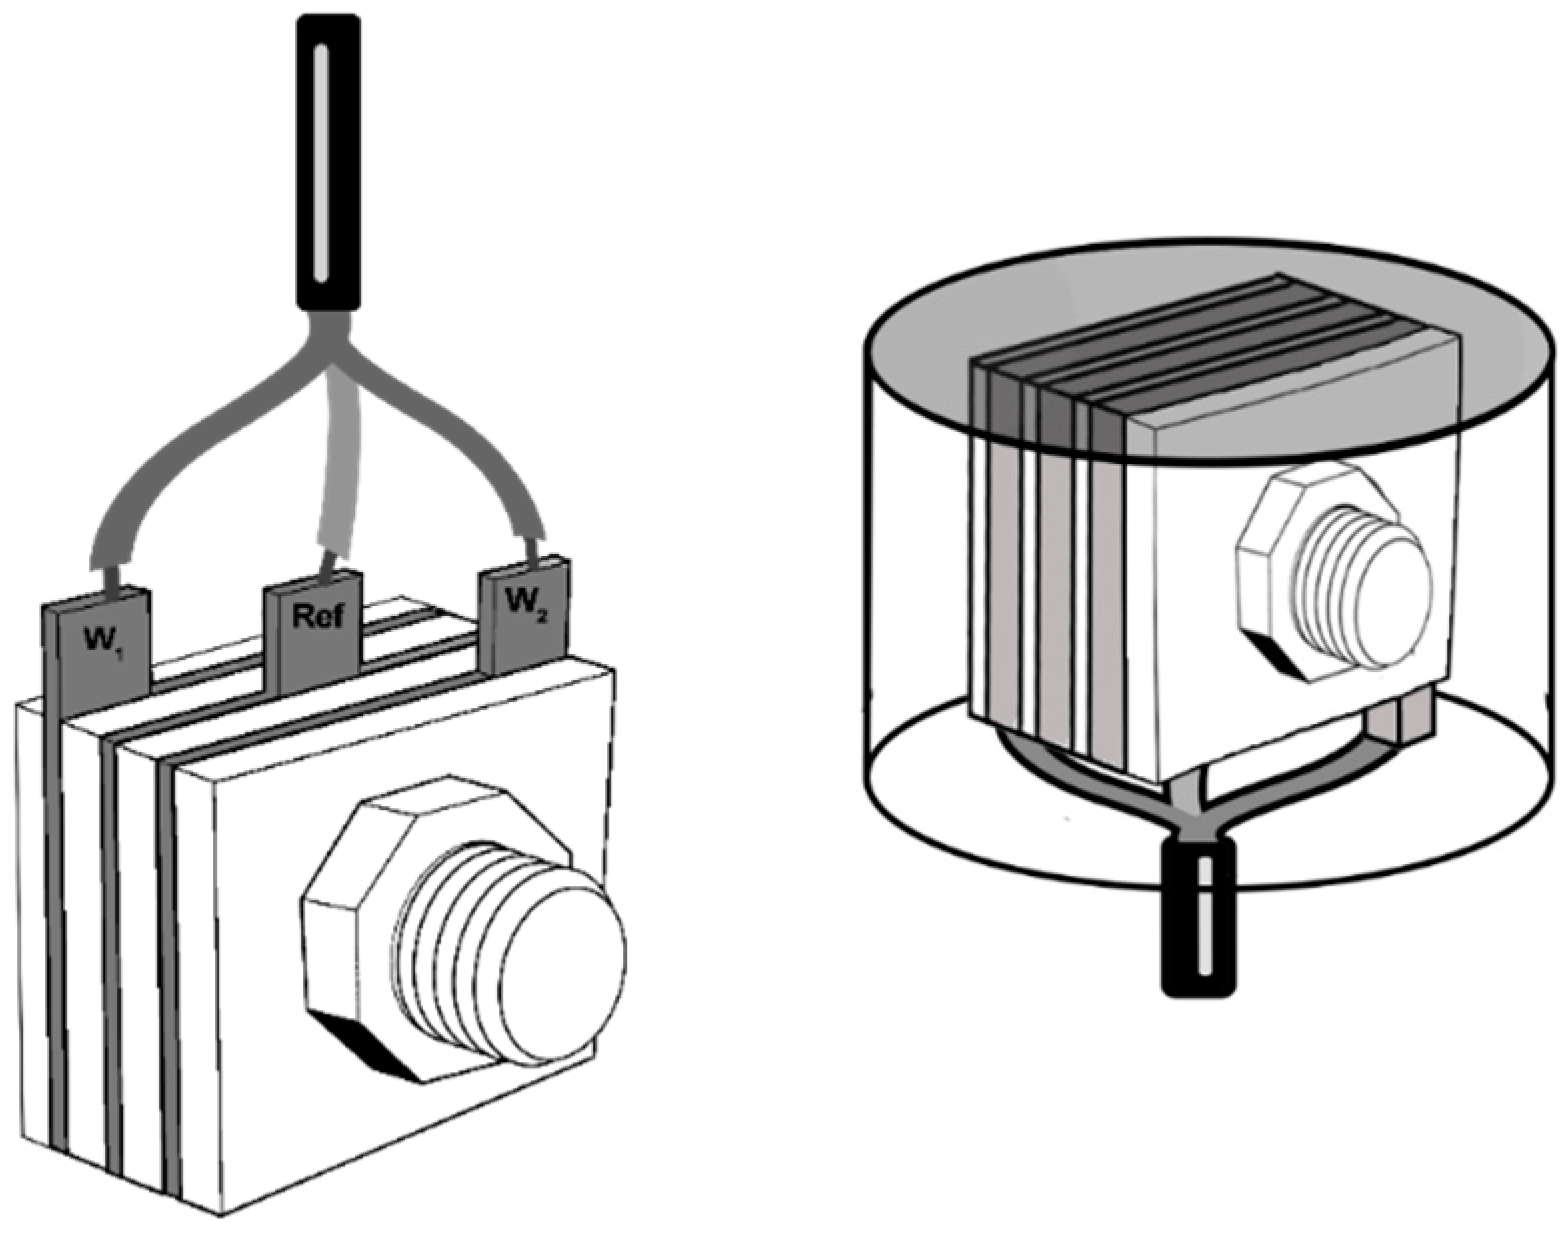
Each of the plaques was welded to a vulcanized cable, to ensure the continuity of the signal. To maintain the union of the set of plates, Teflon adjusted was used. This arrangement was isolated with epoxy glass resin resistant to chemical attack, as shown in Figure 2.
2.3. Relative Humidity
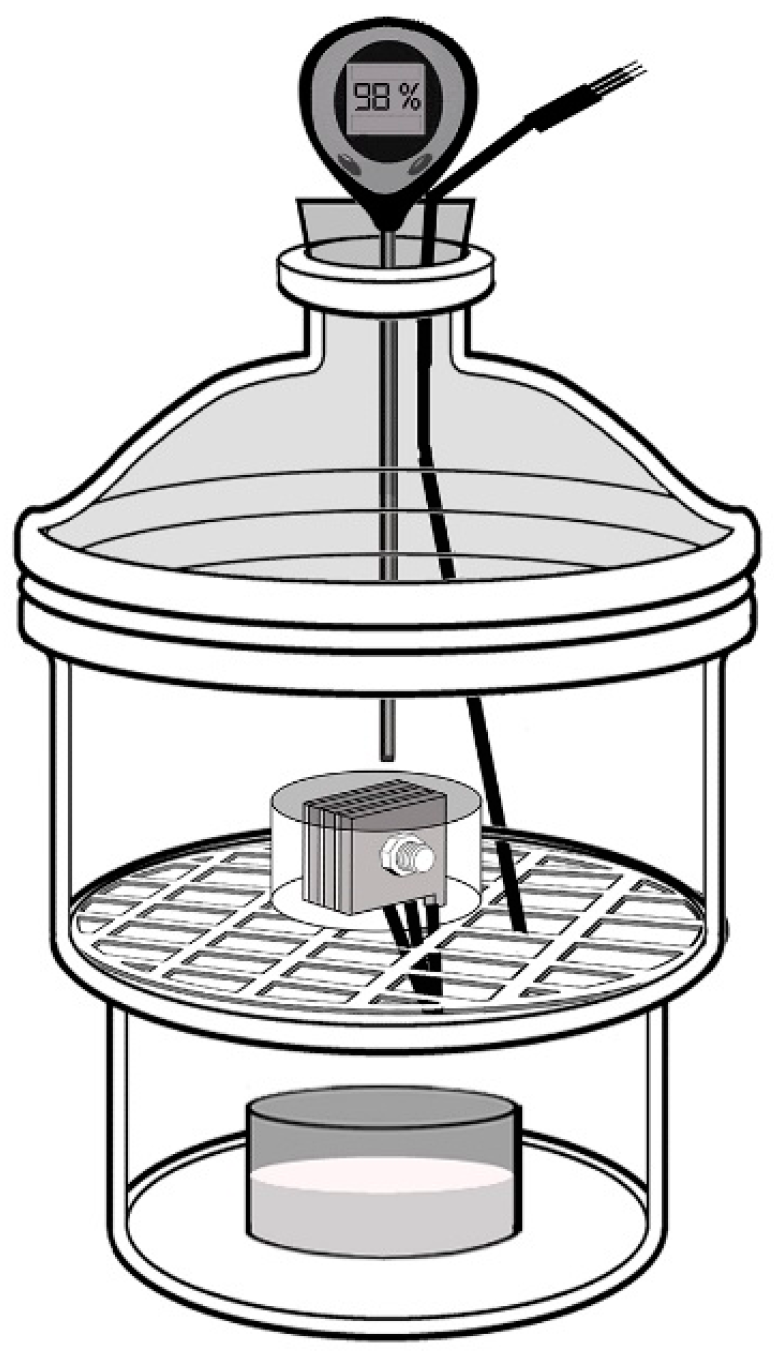
The monitor was placed in a glass desiccator, as shown in Figure 3. The relative humidity was modified with different saline solutions supersaturated under the ASTM E-104 standard [30]. The humidity measures selected during the experimentation phase were 40% RH using potassium carbonate (K2CO3) and 98% RH using potassium sulfate (K2SO4).
The humidity was monitored with a thermo-hygrometer by Instruments, and a thermostat was used to maintain a constant temperature of 25 °C. Two humidity conditions were selected: 40% to evaluate a lower thickness of water on the surface—a percentage of humidity that museums around the world have reported suitable in their exhibitions for the optimal durability of Paraloid and, consequently, the conservation of metal—and 98% relative humidity to have a thickness of water that could be considered as electrochemical corrosion and is the extreme condition.
2.4. Electrochemical Noise Measurements
Voltage and current of electrochemical noise (EN) were measured using a sampling frequency of 0.5 spots per second with 2048 measurements, and a frequency of 1 Hz in order of 0.25 MHz; a measurement was conducted every two hours for 48 h. The measurements were posted out with a zero resistance ammeter (ZRA) by Gill AC 1123 (ACM Instruments, Cumbria, UK); a Faraday cage was used to keep out external interference (static and electromagnetic influences). The resolution was 1 pA for current and 1 µV for voltage measurements. Trend removal was done by subtracting polynomial method of the raw data. The time series were obtained from the response of the system, which allows not only the analysis of the behavior of the inhibition layer but also the determination of its kinetic mechanism. The experiments for each condition were conducted in triplicate to guarantee its reproducibility and reliability.
3. Results
3.1. Electrochemical Noise Analysis
Electrochemical noise signals are registers of current and potential over time. According to this, the random or deterministic behavior of temporal records is conditioned by the possibility of establishing a relationship between the different parameters that govern the corrosion process that is being studied. The comparative analyses of the electrochemical noise signals obtained from a series of potential or current in function of the acquisition time are shown below.
Figure 4 shows the time series of potential and current with the removal of the trend after 24 h of exposure in relative humidity of 40% and 98%. No current density has been shown since the area factor of the electrode is 1 cm2. To perform a quantitative comparison, the standard deviation of the removed trend values is contained. The blank metal (Figure 4a) to 40% relative humidity presents current and potential lower values (1.8 × 10⁻⁹ mA, 0.02 mV), compared to the bare metal (Figure 4b) at 98% relative humidity (5.33 × 10⁻⁷ mA, 0.74 mV). Changes are observed in the fluctuations in both signals obtained as a function of the increase in relative humidity, as a consequence of increasing the thickness of the water film and consequently, the interaction present in the microcells becomes more intense. When the surface is covered with Paraloid (Figure 4c) at 40%, the current and potential changes are not apparently large (1.43 × 10⁻⁸ mA, 0.23 mV) compared to the bare metal. But for Paraloid (Figure 4d) at 98%, current output decreases (4.43 × 10⁻⁷ mA) and changes in the amplitude of the potential signal (1.55 mV) are observed, as a consequence of presenting localized active sites where the Paraloid loses protection by absorbing water and the iron corrosion process may occur. When the inhibitors are added to the Paraloid films, modifications are observed as shown in Figure 5.
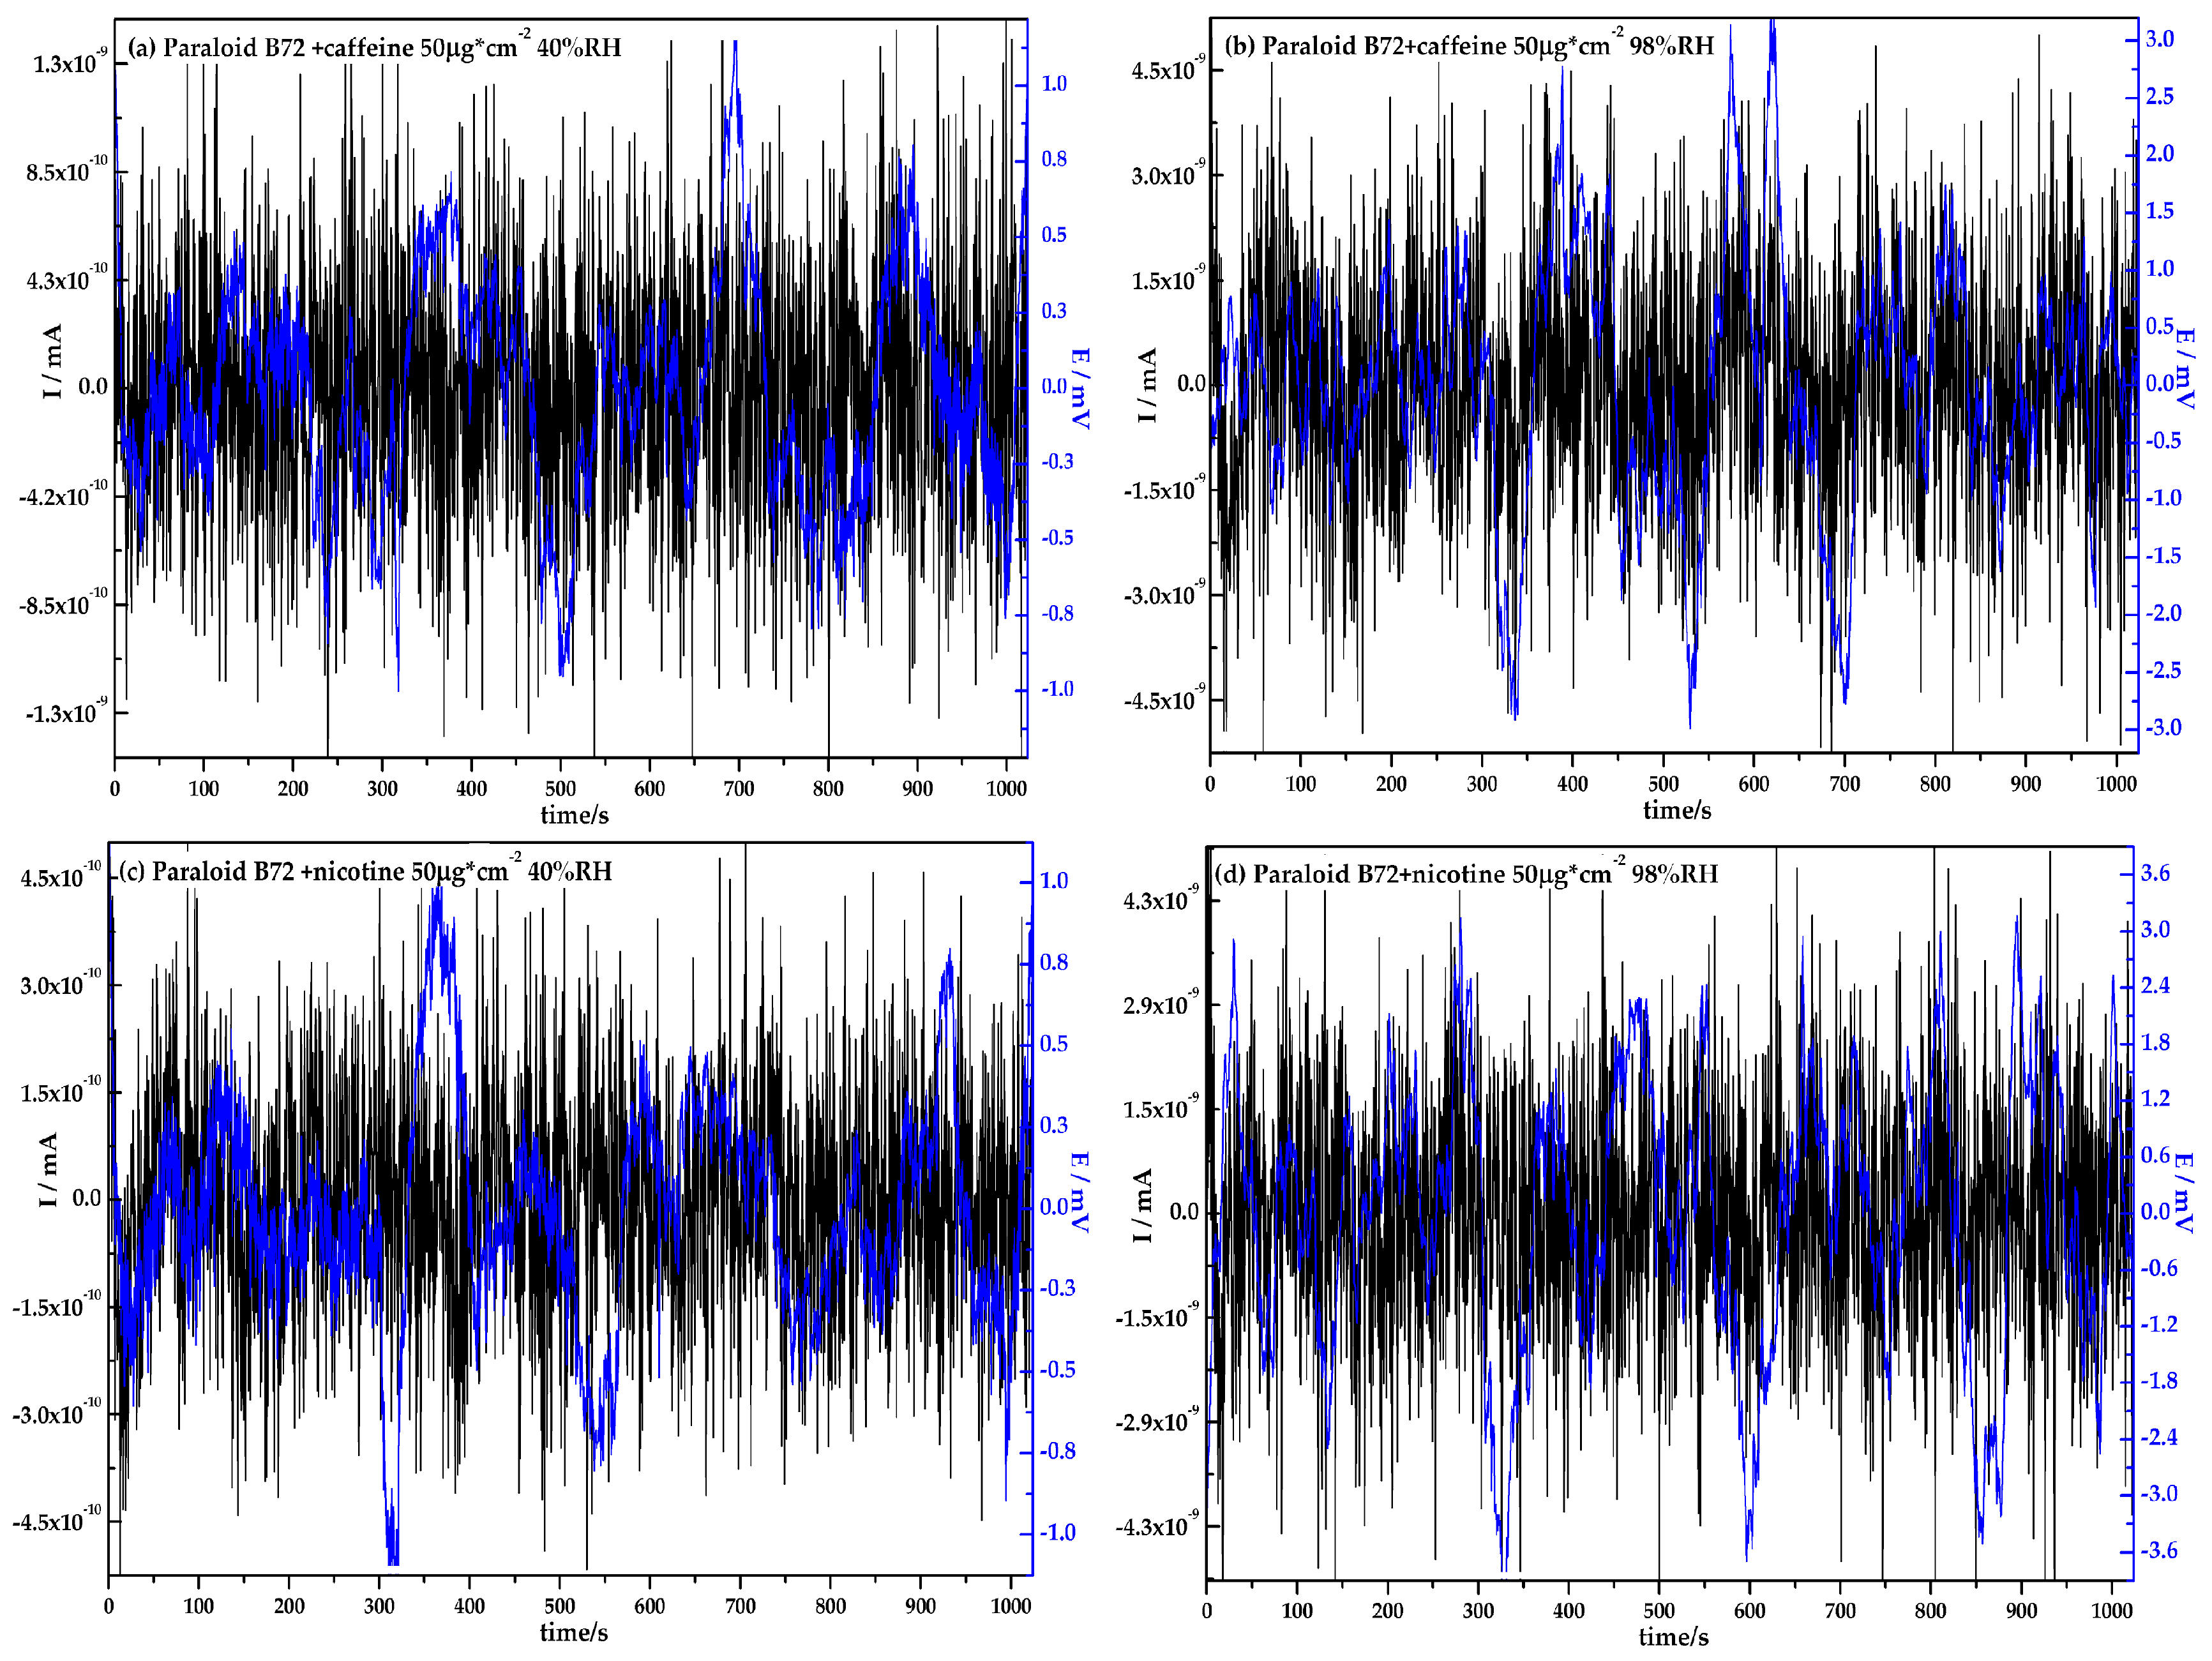
When caffeine is added to Paraloid (Figure 5a) at 40% RH, both current and potential responses decrease (5.06 × 10⁻⁹ mA, 0.36 mV) and (Figure 5b) for 98% RH (1.75 × 10⁻⁸ mA, 1.03 mV) almost an order of magnitude, while nicotine films (Figure 5c,d) have smaller values in current and potential at 40% RH (1.69 × 10⁻⁹ mA, 0.34 mV) as at 98% RH (1.68 × 10⁻⁹ mA, 0.93 mV) compared to Paraloid without inhibitor. This decrease in the amplitude and response in current and potential reveals the activity of these molecules on the superficial phenomenon of corrosion.
In general, the noise signal apparently has certain changes depending on the conditions, but performing the visual analysis only for a time series is not enough to measure the gain in the impedance of the coating or its performance as a mapping of time.
This behavior is much more evident when calculating the value of noise resistance (Rn), which is inversely proportional to the intensity of the corrosive attack [31]. Therefore, it is necessary to establish a statistical treatment of the signal to be able to recognize the changes that are submitted in an objective direction and the effect the compounds have along with the Paraloid.
First, the most common statistical parameters, which are the mean and the standard deviation of the signals both in current and in potential, are obtained. Founded on these two statistical parameters, as described in the literature, noise resistance (Rn) is limited. In many investigations, it has been associated with polarization resistance, which is known to be inversely proportional to the corrosion rate when the mechanism is controlled by charge transfer [32]. Rn is defined based on the following Equation (1) [33,34,35]:
where σI is the standard deviation in current, whereas σE is the standard deviation in potential. The second parameter that can be obtained is the so-called localization index (LI), which indicates changes in the corrosion mechanisms, whether homogeneous, mixed or localized, and shows how localized is the attack to the surface of the metal in the medium. This parameter can only take values between 0 and 1, with 0 being a homogeneous attack and 1 being an extremely localized attack [36,37]. The LI is defined based on Equation (2) and only the current noise signal is necessary to determine it. As shown, (XI) is the value of the mean in current y (σI) the standard deviation in current [38]:
Figure 6 shows summarizes the statistical analysis of the noise signals of both relative humidity, where both the noise resistance Rn and LI are determined.
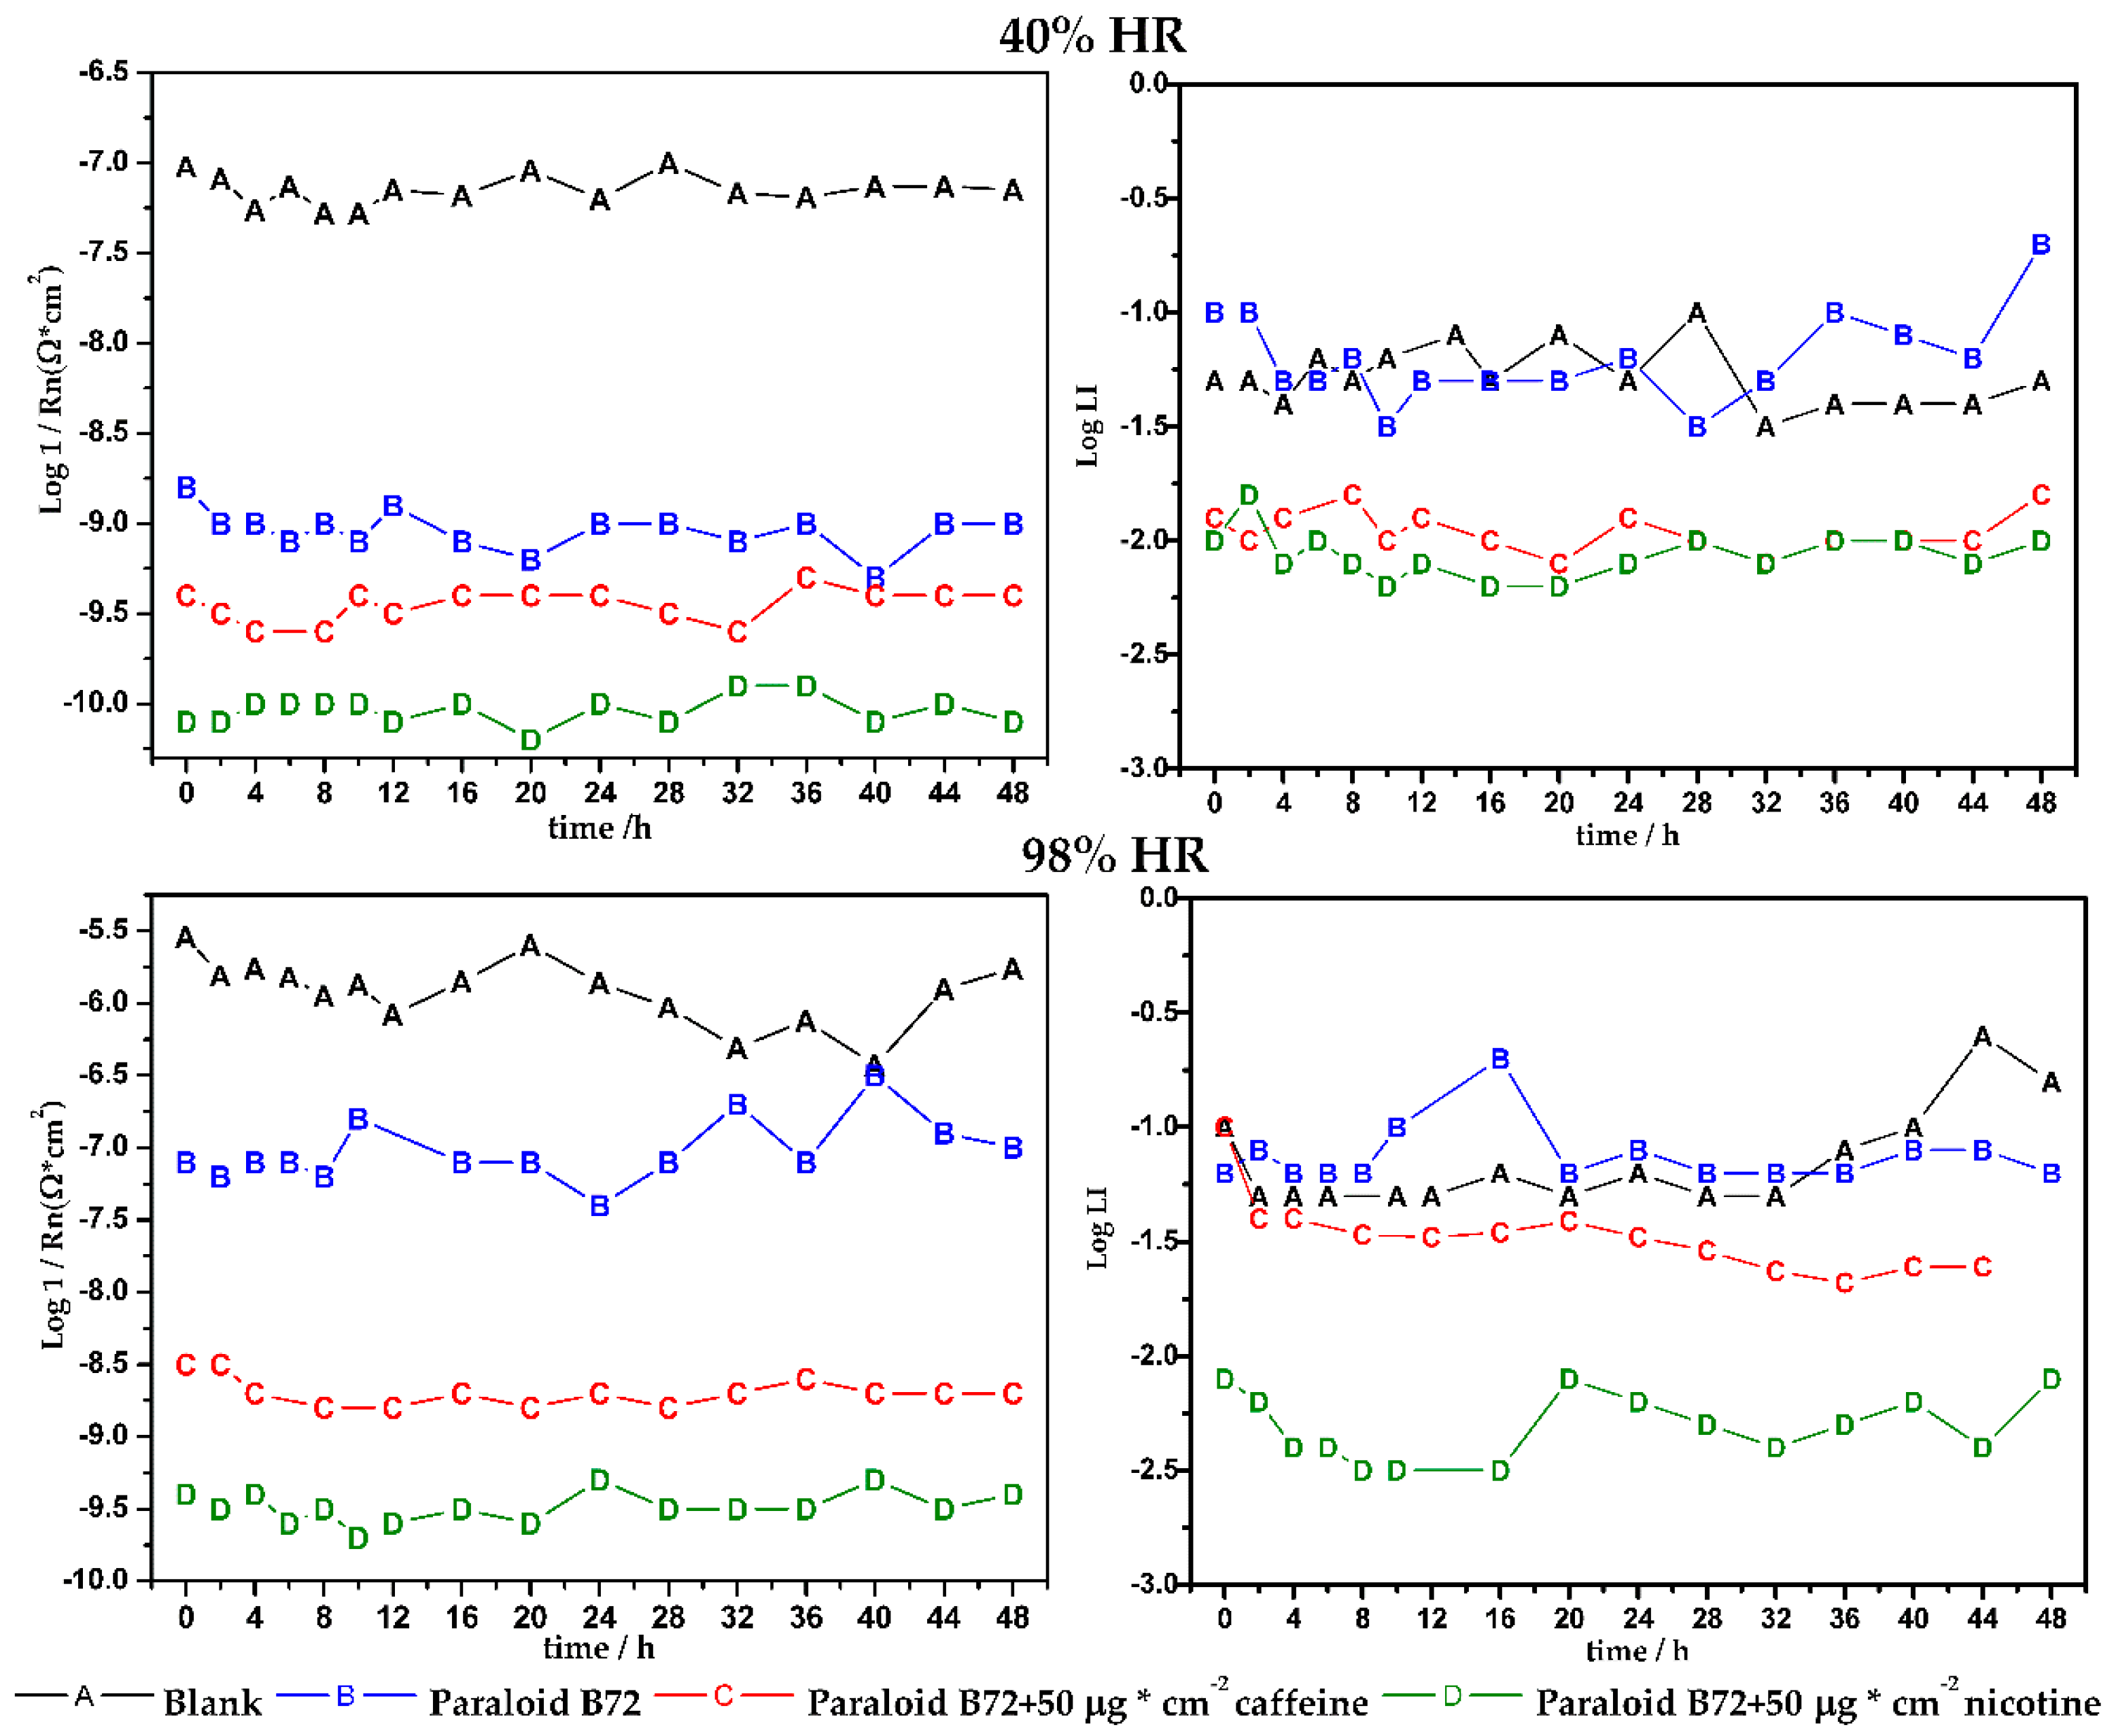
Figure 6 shows the statistical analysis of the noise signals in both relative humidities in the function of the exposure time in hours. It is important to note that the logarithm of the reciprocal of Rn is shown to easily appreciate the changes that are generated on the surface with respect to the rate of corrosion. Both Rn and LI are plotted on a logarithmic scale, which works well for comparison purposes, since the differences between the conditions evaluated are very large. In the first place, it is evident that, for both relative humidity, the bare material presents the greatest possible corrosion, as expected. In the relative humidity of 40%, a value of 1/Rn is presented in the order of 10−7 (Ω·cm2)−1, while for the relative humidity of 98%, it is 10−6 (Ω·cm2)−1, which is a higher order of magnitude. This result is logical because, in this relative humidity, a continuous water film is formed over the entire surface, resulting in a corrosion mechanism controlled by water and dissolved oxygen, while at 40% there is an ohmic type of control. This clearly shows how humidity is a critical factor in relation to the deterioration of gray iron metal parts. Subsequently, the presence of a physical barrier—the Paraloid B72—clearly decreases the values of 1/Rn, in the order 10−9 (Ω·cm2)−1 for 40% RH, where it is known that the Paraloid has good performance. However, the Paraloid does not present good protection against high relative humidity, because it tends to allow oxygen and water/moisture, resulting in a value of 1/Rn that diminishes two orders of magnitude, up to values of 10−7 (Ω·cm2)−1 for a 98% relative humidity.
This is an important component of this statistical analysis, where it is possible to watch the performance of caffeine and nicotine as corrosion inhibitors. Caffeine has an approximate value of 10−9.5 (Ω·cm2)−1 for 40% relative humidity and 10−8.5 (Ω·cm2)−1 to 98% relative humidity, while nicotine causes much lower value, of the order of 10−10 (Ω·cm2)−1 to 40% relative humidity and 10−9.5 (Ω·cm2)−1 to 98% relative humidity. It is evident how nicotine has a better efficiency as a corrosion inhibitor in both relative humidity.
The location index (LI) also shows notable changes in the different conditions assessed. For a 40% humidity, the average location index of the substrate is 10−1.22 and for the Paraloid it is 10−1.15. The LI values in the presence of inhibitor are modified and reach 10−1.76 with caffeine and 10−2.52 with nicotine. For a relative humidity of 98%, the trend is modified for bare metal and Paraloid, where the bare substrate has an LI of 10−1.03 (mixed mechanism), with changes after 32 h at an LI of 10−0.76, which is identified as a localized mechanism. The change of mechanism is affected by the presence of corrosion products on the surface, which locally changes the reactions. The Paraloid presents an intermediate LI value of 10−1.31, which represents a mixed mechanism that tends to be localized by the hydration presented by such film. With the addition of caffeine, the LI is approximately 10−1.52 and with nicotine, it is 10−2.04.
In other words, when the surface is bare or with Paraloid, the attack mechanism tends to be from mixed to localized as a function of time, while the presence of the inhibitor is manifested by a mixed mechanism for caffeine and a homogeneous one for nicotine. The resistance of Paraloid depends on the relative humidity, which leads to a mixed mechanism for caffeine, presuming that the places where it was not present would be more active due to the water absorption of Paraloid.
It should be noticed that the bare metal has the highest localization index and that the presence of caffeine and nicotine as inhibitors, mainly, reduced the LI value, showing the formation of a homogeneous film that prevents a localized approach. It can also be understood that the proposed used of caffeine and nicotine considerably increases the level of protection and modifies the morphology of the approach.
The purpose of the statistical analysis of the time series is to demonstrate the nature of the corrosion phenomenon. These analysis models are traditionally linear. The ease of the tools is the main line of reasoning in favor of linearity. Yet, theoretically, it is hardly justifiable that this phenomenon of atmospheric corrosion presents a linear behavior. The study of non-linearity is complex, but it is necessary for this type of complex systems. Thus, it is essential to introduce new concepts and instruments referred to non-linearity. Therefore, it is very interesting to be able to define the dynamic execution of this coating, so that in a study of non-linear dynamics the corrosion process is borne out through recursive graphics.
3.2. Recurrence Plots Analysis
Given all the evidence obtained about the chaotic or non-linear behavior, in the series the complete dynamics of the current mechanism cannot be captured through statistical analysis, so the implementation of visual recurrence analysis in complex performances is proposed, so that predictions are allowed for brief periods of time [39]. This method is founded on the immersion theorem of Takens, which establishes that, under certain conditions, it will be possible to receive an estimation that is topologically equivalent, and that it will, therefore, allow extracting all the relevant data about the underlying dynamic system and the unknown that generates the time series. Recurrence plots (RP) are an excellent tool to represent non-linear dynamics and find the repetition of a pattern, although the process is not periodic in the strict sense it is possible to show repetitive or “recurrent” behaviors to differentiate chaotic variability or detect changes in the state of the evolution of a system. Dynamic systems are represented in a phase space that is no more than a vector space, which can have several values. One of the ways to characterize this recurrence is to compare the difference between all the states of the path that describes the evolution of the system that requires obtaining information about the immersion dimension or the dimension of the vector space in which it is possible to represent the dynamics of the system. After choosing a reconstruction dimension and obtaining the vectors, the RP represents a lot of stages in a square of dimension M × M, where M, the axes or the sides of the second power, represent the chronological succession of the vectors in the remodeled space. This analysis was based on the methodology proposed by Eckmann et al. [40]. It consists of specifying when the levels in the reconstructed phase space are infinitesimally close because they have applied a very small dimension. The progressive increase of the dimension until the false infinitesimals disappear provides a criterion of the necessary dimension for the reconstruction.
Subsequent developments have allowed quantifying the amount of recurrence present in the graph. Zbilut and Webber [41] propose the RQA (recurrence quantification analysis) as defined by the following characteristic indices:
The percentage of recurrence (%Rec) consists of the percentage of points that are in the value threshold, or the lowest value in the total points in the recursive graph. This parameter is associated with the periodicity of the signal. Described in Equation (3) as:
NRECURS is the entire number of recurring periods in the superior triangle of the graph without counting the peaks of the bisector. The denominator of Equation (3) is the number of points in the upper triangle of the graph eliminated those of the bisector.
The percentage of determinism (%Det) is the percentage of stops that constitute a line parallel to the main diagonal. This parameter is a measurement of how much the events in the past affect those in the future. Described in Equation (4) as:
DRECURS is the number of points that are part of line segments parallel to the bisector of the square. A line segment is specified as two or more adjacent points.
The maximum line (LM) is the duration of the most recurrent segment and is reciprocally proportional to the maximum Lyapunov exponent, which, definitively, tells us about the sensibility of our system to the initial conditions. Finally, the entropy of information or Shannon Entropy corresponds to the probabilistic distribution of the diagonal lines of determinism and is related to the complexity of the determinant structure in the system [42]. Described in Equation (5) as:
where pi is the relative frequency of the length of the recurring segments. If the series is random, this measure is 0.
The analysis mutual information (AMI) function was used to establish the delay time, and the false nearest neighbors (FNN) method was used for the immersion dimension to obtain the reconstruction parameters through the method proposed by Dämming and Mitschke [43]. The analysis of recurrence values was performed by the method proposed by Garcia-Ochoa et al. [44].
The RP obtained for the 24-h exposure time series are represented below in all the conditions assessed for the current time series, since they are directly linked to the localization index of the statistical analysis. As mentioned, the most important changes in signal amplitude are shown.
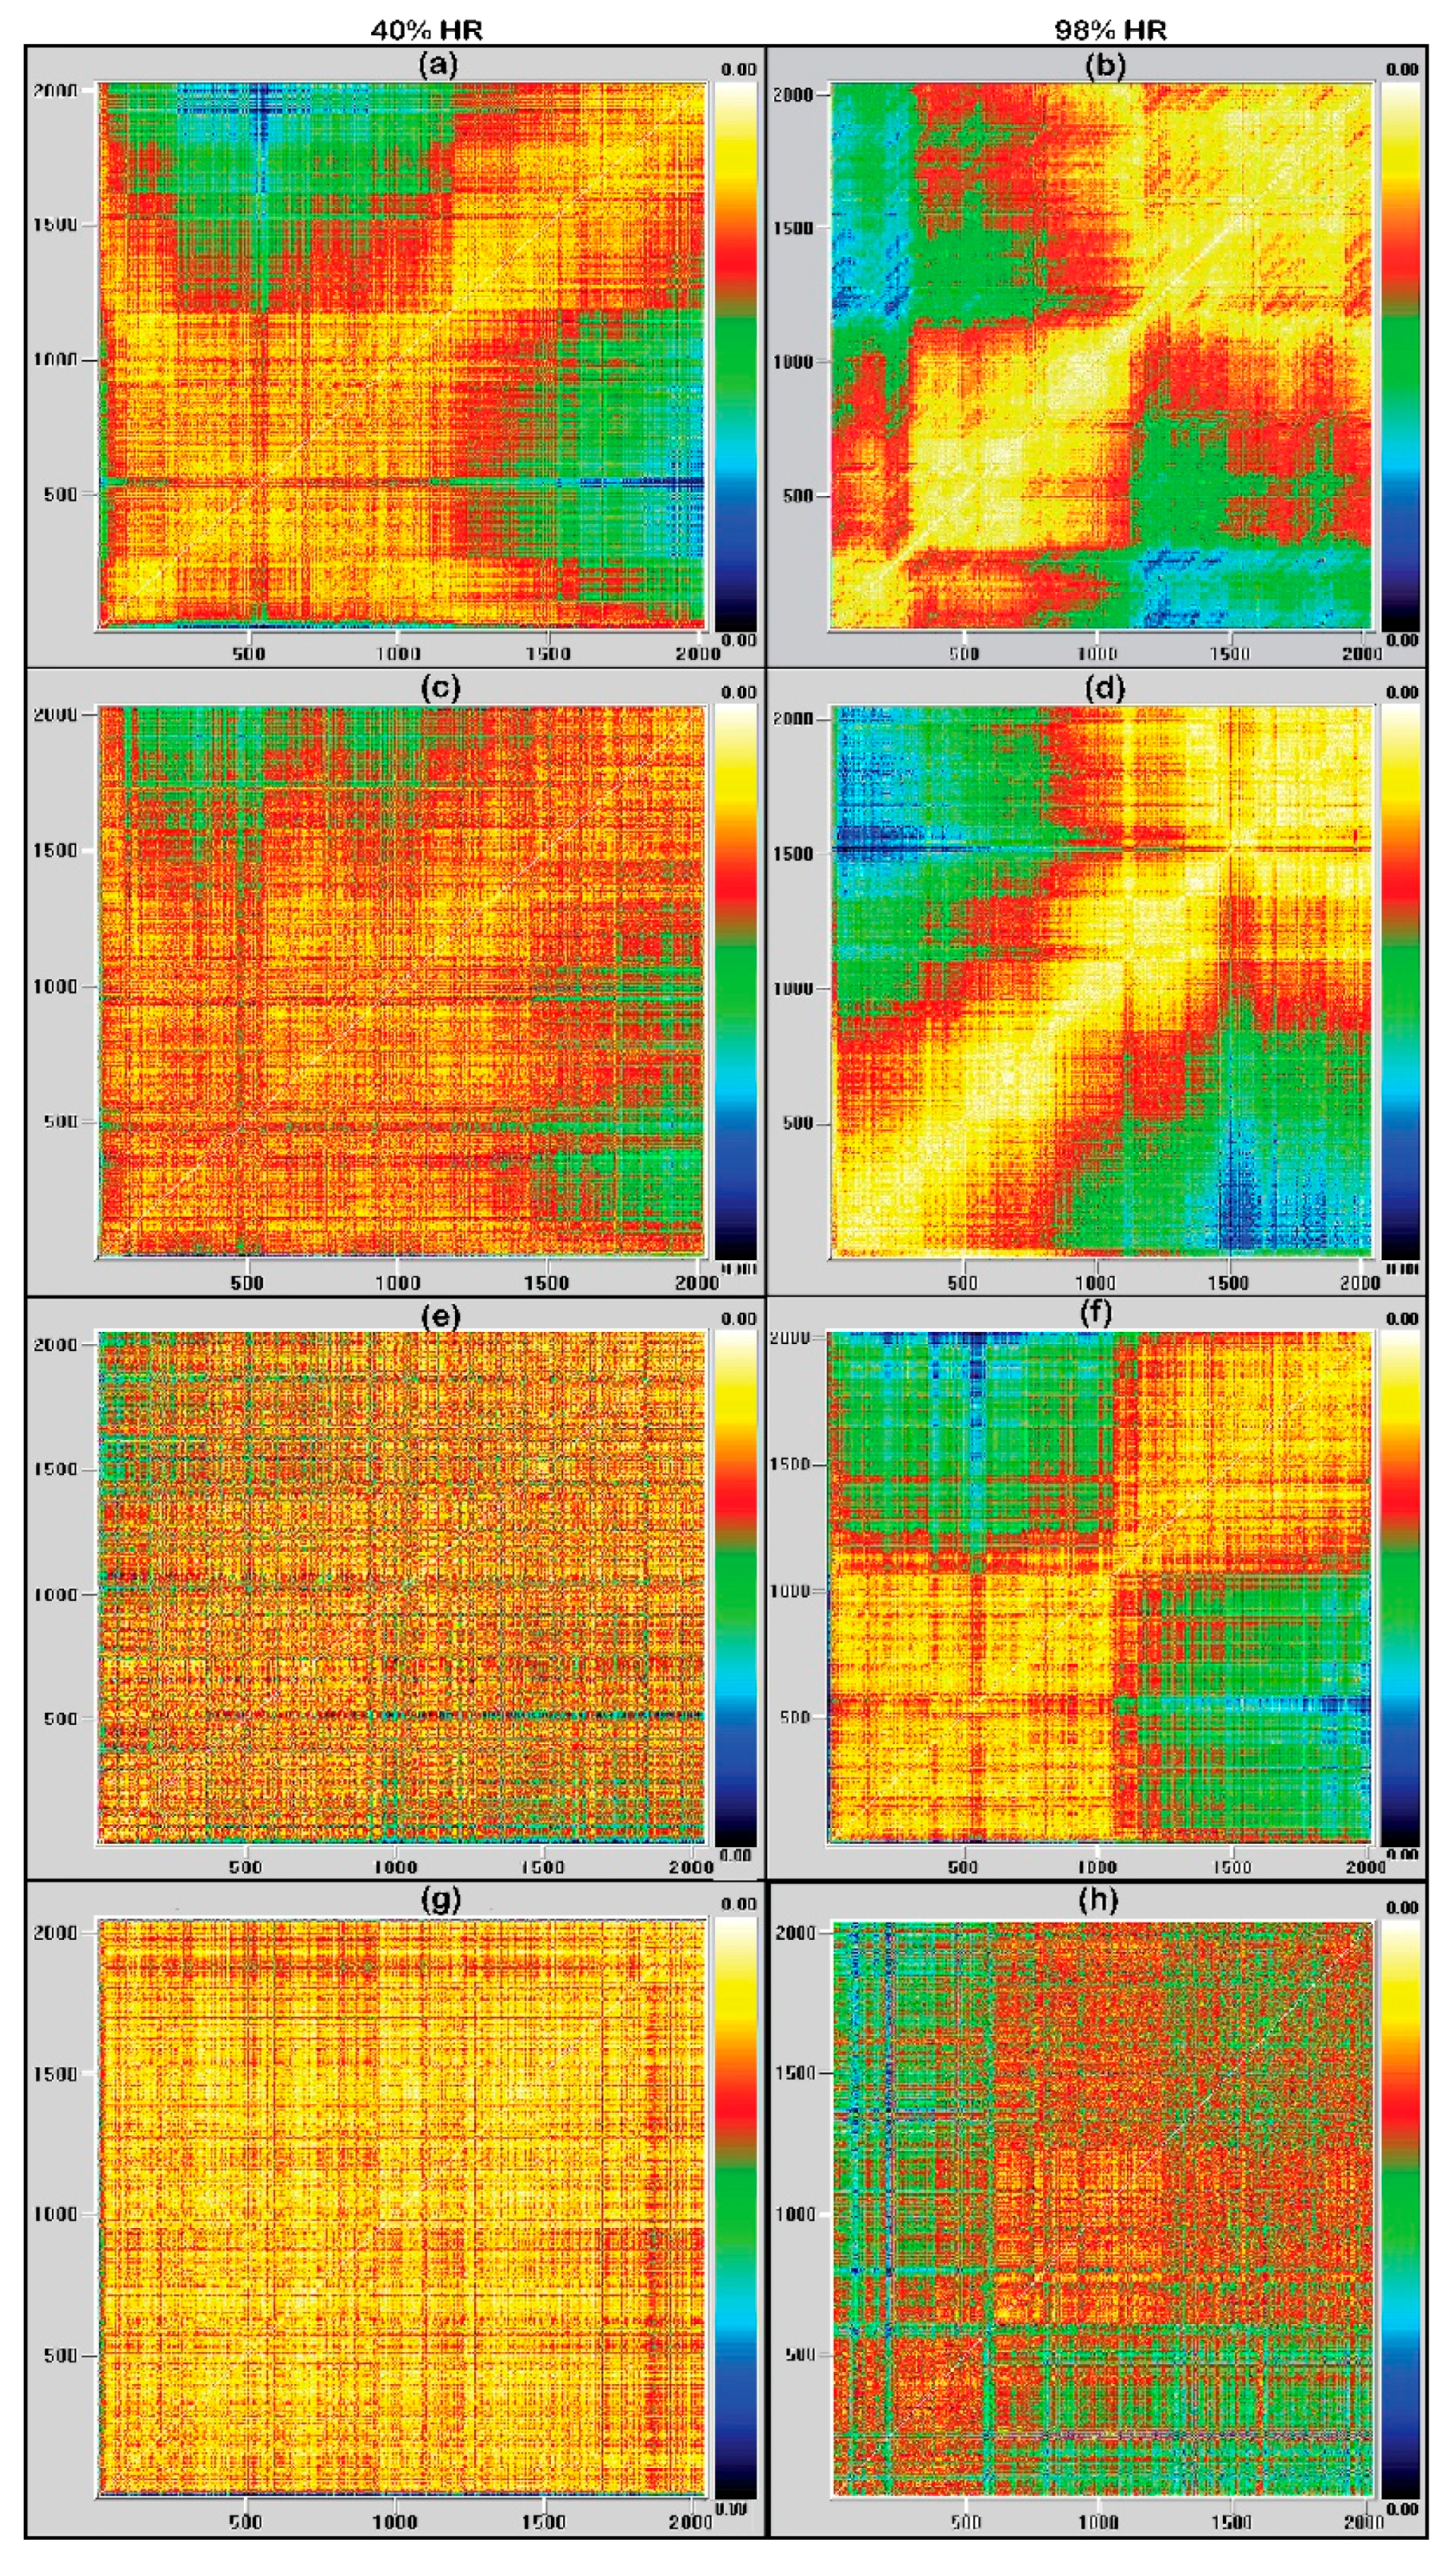
Figure 7 shows the graphs of recurrence for all the conditions assessed. Recurrence plots represent the dynamics in the time series in a two-dimensional space whose axes represent the number of data in the series (2048 data). The presence of regularities obtained in the dynamics of the time series appears in the graph. Time-series are sets of swings that have some periodicity and therefore, RP presented lines and correlation structures, which is suggestive of a stochastic behavior [45,46].
In the case of chaotic dynamics, short lines parallel to the main diagonal appear, while in the case of a random dynamics, the plot shows a uniform representation of points indicating that there is some structure in the data. In 40% relative humidity, the signals observed present more organized graphs, which shows a weakly consolidated portion of parallel structures, indicating periodicity in comparison to signals in 98% relative humidity. Furthermore, it was noted how the dynamics of the system contracts in some spots and then expands: this is a feature of systems with chaotic dynamics.
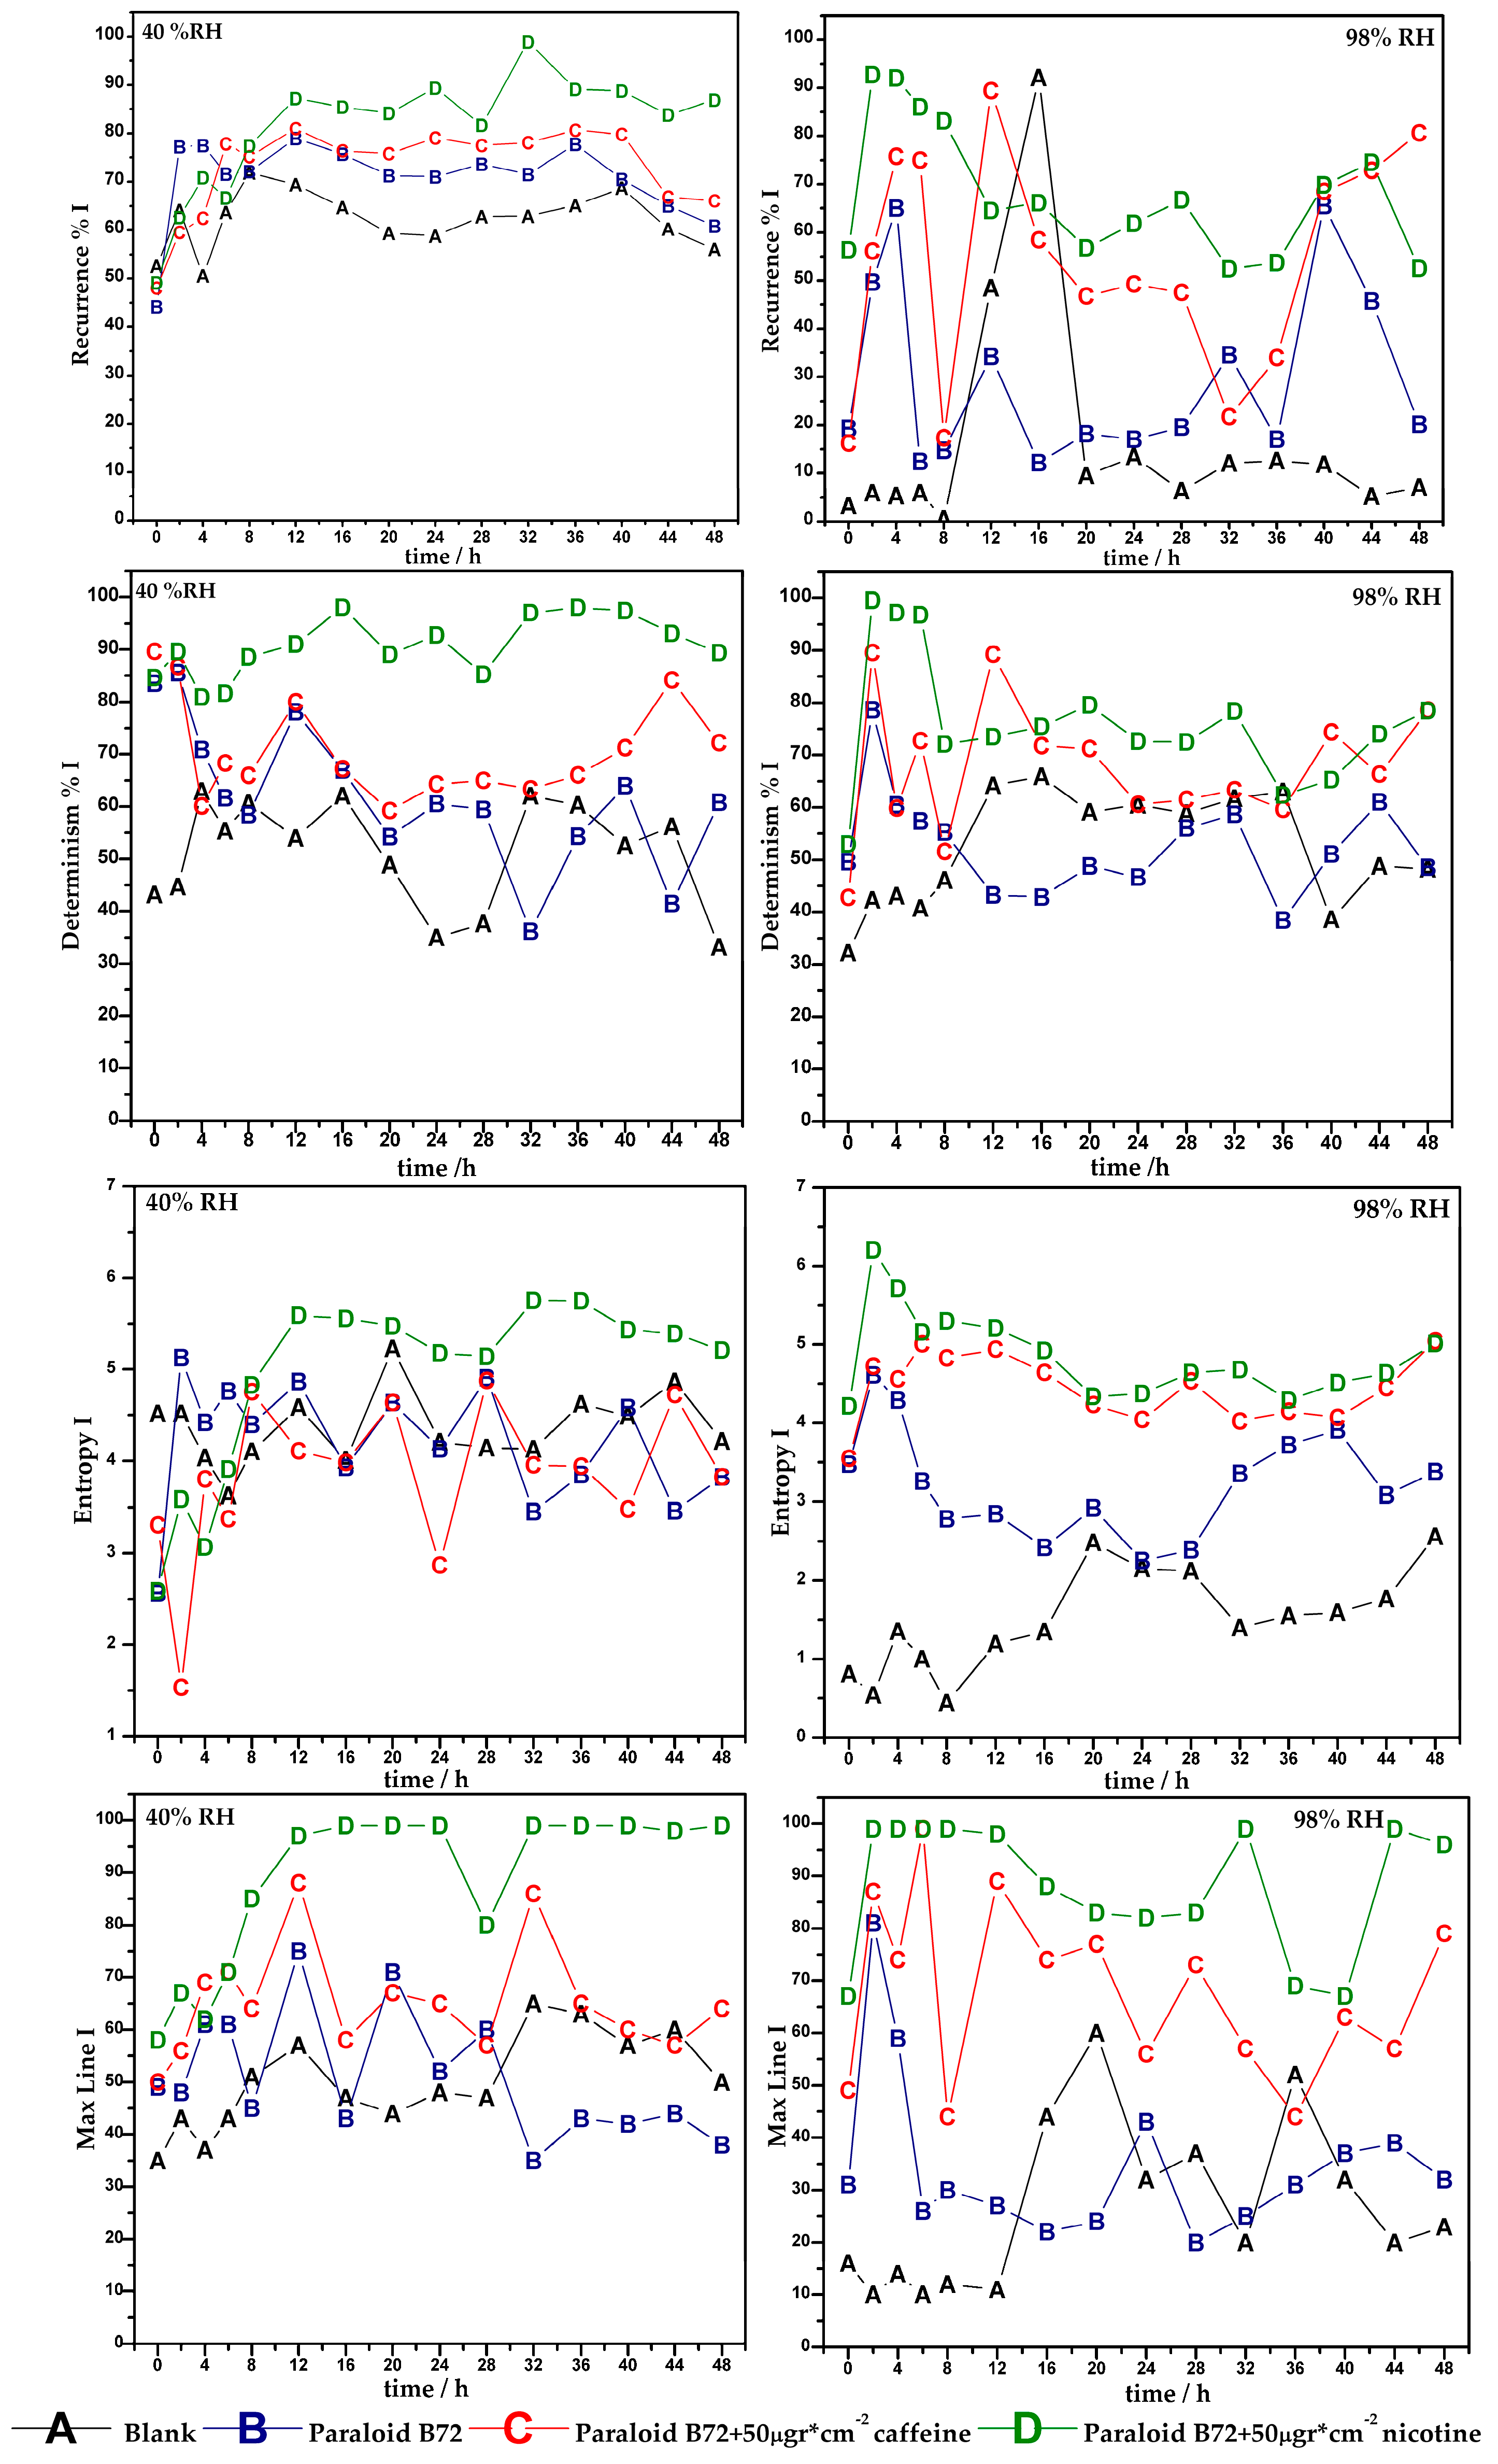
When the metal is coated with Paraloid, the formation of equidistant geometric structures was observed, which is presumed to be a more deterministic behavior. However, in this immersion condition, the recurrence plot shows a portion of reinforced parallel structures. The presence of caffeine and nicotine in two humidity conditions assessed features more structured graphics in comparison to the Paraloid, which will be reflected on signals with a higher degree of recurrence and will manifest themselves in a greater number of yellow and reddish spots. To this point, the analysis of graphs has been qualitative, and presumptive behavior may be viewed. To perform a more detailed analysis, we calculated the percentage of recurrence, the percentage of determinism, entropy and maximum line depending on weather for all series in the conditions evaluated at 40% and 98% relative humidity, set by the Euclidean method. The results are shown below in Figure 8.
The percentage of recurrence (%Rec) presents greater sensitivity, showing drastic changes as a mapping of relative humidity for uncoated iron, showing a lower value for bare metal at 98% relative humidity. This confirmation that iron modifies its periodic behavior when in contact with water, so the mechanisms that have been identified in the literature are corroborated through the recurrence of the signal. The Paraloid also presents modifications with respect to humidity, since in a relative humidity of 98% the system begins to be more random: this means that the system variables change in function of time, and then that the Paraloid, when in the presence of water, loses its protective capacities and limits its use because it will fail randomly.
The presence of nicotine in both humidity conditions reaches the highest recurrence values revealing a more periodic signal, this being a first evidence of the effect on system dynamics when adding the compound. The quantity of interaction between the different sites where the corrosion takes place, which corresponds to the percentage of determinism (%Det), is shown below. This parameter is remarkably sensitive to the surface conditions and the interaction of the microcells. First, %Det is minor for bare metal. This implies great randomness in the interactions of the electrochemical cells, since, for the case of a 40% relative humidity, an average value of 40% Det is initiated, while at a humidity of 98%, it is 40% Det during the first 10 h to values of 60% Det after 12 h, which describes how the interactions are modified when the surface presents corrosion products. This converts the response into a more synchronized system.
When the material is covered by the Paraloid, %Det is increased substantially to values of 80% at 40% relative humidity, and 50% at 98% relative humidity, but it changes with the same tendency as the percentage of recurrence, which decreases in function of time, showing again how the Paraloid loses protection in function of time, which decreases the synchronization and increases the interaction areas, allowing the surface to present arbitrary responses. When adding caffeine or nicotine, the remarkable growth of the %Det degree is quite noticeable in both humidity, this being more remarkable for the relative humidity of 98%, which, as cited above, implies the shaping of a water film on the airfoil. It can be seen that the chemical construction of both substances intervenes remarkably in the kinetics of the electrochemical microcells, being nicotine both the one that reported a greater degree of determinism and the one that reported a lower level of corrosion and localization.
It can be noted that the value of the entropy of information increases remarkably with the bearing of both caffeine and nicotine, the latter giving the highest value reported for both relative humidity. This is indicative of the increment in the complexity of the corrosion process dynamics that takes place, showing that by increasing the level of determinism, the level of complexity increases too, hence yielding a higher degree of security for both uniform and localized corrosion. Then it could be stated that there is a procedure of self-formation that results in greater protection.
Finally, the maximum line, which is an index of the level of sensibility to the initial conditions, once again demonstrates that nicotine and caffeine cause the participating sites to interact so that the system shows greater synchronization and, as a consequence, the most positive coefficient of Lyapunov is smaller.
4. Discussion
Significant changes are noted in the percentage of determinism since this is modified regarding the protection applied and the percentage of humidity assessed. The metal in different humidities has a less synchronized behavior. The best performance in anticorrosive protection is in Paraloid with nicotine, followed by Paraloid with caffeine. A relation based on the signals obtained and, on the parameters, analyzed shows that %Det indicates protection and continuity of the inhibition of the coatings over time. The dynamics of the systems have been confirmed as chaotic for both the uncoated metal and Paraloid B72 in both relative humidities since it was found that the entropy of both systems decreases, which shows that the systems have a sensitive dependence to the initial conditions.
Overall, it could be said that, based on the analysis of recursive graphs, the presence of caffeine and nicotine decreases the possibility of Paraloid to capture water and, thus, the metallic material will have fewer interactions. The inhibitors are taken up locally at these sites, which is in complete accord with the statistical analysis of the electrochemical noise signal. In this mode, the behavior of the coating is modified by adding both caffeine and nicotine, modifying and increasing the resistance when conferring protection, because when these compounds are added, the kinetics of the corrosion process are modified. This allows for the introduction of a system that is self-organized as a strategy to use the Paraloid, as the temporary security for its useful life is guaranteed in conditions where the relative humidity cannot be manipulated.
5. Conclusions
Electrochemical noise is capable to assess with great sensitivity the increase in corrosion resistance performance conferred by the inhibitors added to Paraloid; even the electrolytic resistance changes corrosion mechanism.
The addition of nicotine and caffeine to temporary protection is contemplated in a higher protection efficacy regardless of the relative humidity assessed. Nicotine presented a high degree of protection, superior to the caffeine protection added to Paraloid coatings.
The nonlinear analysis of the electrochemical noise signal by recurrence plots shows the variances in the surface corrosion dynamics, where a more synchronized process resulting in greater protection.
Author Contributions
This paper was written by all authors. P.R.B. and F.-J.R.G. conceived and designed the experiments; P.R.B. conducted a research and investigation process, specifically performed the experiments; P.R.B., F.-J.R.G. and E.G.O. discussed the results and revised the paper; P.R.B. wrote the paper.
Funding
Thanks to CONACYT for the financial support for the development of this research through the basic science project 239938.
Acknowledgments
Thanks to CONACYT for the scholarship granted to Paola Roncagliolo Barrera with (Scholarship CVU number: 332740) to develop her PhD research. The authors wish to thank to Carlos Rodríguez Rivera for the experimental assistance provided as technical supervisor throughout this study.
Conflicts of Interest
The authors declare no conflict of interest.
References
- Caple, C. Conservation Skills: Judgement, Method and Decision Making; Routledge: Abingdon, UK, 2012. [Google Scholar]
- Feller, R.L. Aspects of chemical research in conservation: The deterioration process. J. Am. Inst. Conserv. 1994, 33, 91–99. [Google Scholar] [CrossRef]
- González, M.L.G.; Gomez, M.L. La Restauración: Examen Científico Aplicado a la Conservación de Obras de arte; Cátedra: Madrid, Spain, 1998. (In Spanish) [Google Scholar]
- Garcia, E.; Díaz, S. Técnicas Metodológicas Aplicadas a la Conservación-Restauración del Patrimonio Metálico; Ministerio de Cultura: Madrid, Spain, 2011. (In Spanish) [Google Scholar]
- Mirambet, F.; Reguer, S.; Rocca, E.; Hollner, S.; Testemale, D. A complementary set of electrochemical and X-ray synchrotron techniques to determine the passivation mechanism of iron treated in a new corrosion inhibitor solution specifically developed for the preservation of metallic artefacts. Appl. Phys. A 2010, 99, 341–349. [Google Scholar] [CrossRef]
- Dillmann, P.; Beranger, G.; Piccardo, P.; Matthiessen, H. Corrosion of Metallic Heritage Artefacts: Investigation, Conservation and Prediction of Long Term Behaviour; Elsevier: New York, NY, USA, 2014. [Google Scholar]
- Cano, E.; Lafuente, D. Corrosion inhibitors for the preservation of metallic heritage artefacts. In Corrosion and Conservation of Cultural Heritage Metallic Artefacts; Elsevier: New York, NY, USA, 2013; pp. 570–594. [Google Scholar]
- Liu, A.M.; Ren, X.F.; Wang, B.; Zhang, J.; Yang, P.X.; Zhang, J.Q.; An, M.Z. Complexing agent study via computational chemistry for environmentally friendly silver electrodeposition and the application of a silver deposit. RSC Adv. 2014, 4, 40930–40940. [Google Scholar] [CrossRef]
- Hollner, S.; Mirambet, F.; Rocca, E.; Reguer, S. Evaluation of new non-toxic corrosion inhibitors for conservation of iron artefacts. Corros. Eng. Sci. Technol. 2010, 45, 362–366. [Google Scholar] [CrossRef]
- Cano, E.; Bastidas, D.M.; Argyropoulos, V.; Fajardo, S.; Siatou, A.; Bastidas, J.; Degrigny, C. Electrochemical characterization of organic coatings for protection of historic steel artefacts. J. Solid State Electr. 2010, 14, 453. [Google Scholar] [CrossRef]
- Satri, V. Green Corrosion Inhibitors: Theory and Practice; John Wiley & Sons: Hoboken, NJ, USA, 2011. [Google Scholar]
- Rahmouni, K.; Takenouti, H. Struggle against corrosion: Protection by triazoles compounds of ancient and modern bronzes covered with patina. Actual. Chim. 2009, 327–328, 38–44. [Google Scholar]
- Al-Otaibi, M.S.; Al-Mayouf, A.M.; Khan, M.; Mousa, A.A.; Al-Mazroa, S.A.; Alkhathlan, H.Z. Corrosion inhibitory action of some plant extracts on the corrosion of mild steel in acidic media. Arab. J. Chem. 2014, 7, 340–346. [Google Scholar] [CrossRef]
- Okafor, P.; Ikpi, M.; Uwaha, I.; Ebenso, E.; Ekpe, E.; Umoren, S. Inhibitory action of Phyllanthus amarus extracts on the corrosion of mild steel in acidic media. Corros. Sci. 2008, 50, 2310–2317. [Google Scholar] [CrossRef]
- Zajec, B.; Leban, M.B.; Lenart, S.; Gavin, K.; Legat, A. Electrochemical impedance and electrical resistance sensors for the evaluation of anticorrosive coating degradation. Corros. Rev. 2017, 35, 65–74. [Google Scholar] [CrossRef]
- Xia, D.H.; Ma, C.; Song, S.Z.; Ma, L.L.; Wang, J.H.; Gao, Z.M.; Zhong, C.; Hu, W.B. Assessing atmospheric corrosion of metals by a novel electrochemical sensor combining with a thin insulating net using electrochemical noise technique. Sens. Actuators B Chem. 2017, 252, 353–358. [Google Scholar] [CrossRef]
- Ma, C.; Song, S.Z.; Gao, Z.M.; Wang, J.H.; Hu, W.B.; Behnamian, Y.; Xia, D.H. Electrochemical noise monitoring of the atmospheric corrosion of steels: Identifying corrosion form using wavelet analysis. Corros. Eng. Sci. Technol. 2017, 52, 432–440. [Google Scholar] [CrossRef]
- Schaefer, K.; Mills, D.J. The application of organic coatings in conservation of archaeological objects excavated from the sea. Prog. Org. Coat. 2017, 102, 99–106. [Google Scholar] [CrossRef] [Green Version]
- Bierwagen, G.P.; Wang, X.; Tallman, D.E. In situ study of coatings using embedded electrodes for ENM measurements. Prog. Org. Coat. 2003, 46, 163–175. [Google Scholar] [CrossRef]
- Puget, Y.; Trethewey, K.; Wood, R.J.K. Electrochemical noise analysis of polyurethane-coated steel subjected to erosion-corrosion. Wear 1999, 233, 552–567. [Google Scholar] [CrossRef]
- Mansfeld, F.; Han, L.T.; Lee, C.C.; Chen, C.; Zhang, G.; Xiao, H. Analysis of electrochemical impedance and noise data for polymer coated metals. Corros. Sci. 1997, 39, 255–279. [Google Scholar] [CrossRef]
- Skerry, B.S.; Eden, D.A. Characterization of coatings performance using electrochemical noise-analysis. Prog. Org. Coat. 1991, 19, 379–396. [Google Scholar] [CrossRef]
- Greisiger, H.; Schauer, T. On the interpretation of the electrochemical noise data for coatings. Prog. Org. Coat. 2000, 39, 31–36. [Google Scholar] [CrossRef]
- Kiele, E.; Lukseniene, J.; Griguceviciene, A.; Selskis, A.; Senvaitiene, J.; Ramanauskas, R.; Raudonis, R.; Kareiva, A. Methyl-modified hybrid organic-inorganic coatings for the conservation of copper. J. Cult. Herit. 2014, 15, 242–249. [Google Scholar] [CrossRef]
- Mohamed, W.A.; Mohamed, N.M. Testing coatings for enameled metal artifacts. Int. J. Conserv. Sci. 2017, 8, 15–24. [Google Scholar]
- Mills, D.; Picton, P.; Mularczyk, L. Developments in the electrochemical noise method (ENM) to make it more practical for assessment of anti-corrosive coatings. Electrochim. Acta 2014, 124, 199–205. [Google Scholar] [CrossRef]
- ASTM b499–09 Standard Test Method for Measurement of Coating Thicknesses by the Magnetic Method: Nonmagnetic Coatings on Magnetic Basis Metals; ASTM International: West Conshohocken, PA, USA, 2014.
- Gonzalez, J.A.; Otero, E.; Cabanas, C.; Bastidas, J.M. Electrochemical sensors for atmospheric corrosion rates—A new design. Br. Corros. J. 1984, 19, 89–94. [Google Scholar] [CrossRef]
- Lecuyer, C.; Barreau, C.; Thierry, D. Electrochemical sensor for in-situ monitoring of coated metals degradation under atmospheric conditions. Mem. Etud. Sci. Rev. Met. 1991, 88, 691–701. [Google Scholar]
- ASTM e104–02 Standard Practice for Maintaining Constant Relative Humidity by Means of Aqueous Solutions; ASTM International: West Conshohocken, PA, USA, 2012.
- Sanchez-Amaya, J.M.; Cottis, R.A.; Botana, F.J. Shot noise and statistical parameters for the estimation of corrosion mechanisms. Corros. Sci. 2005, 47, 3280–3299. [Google Scholar] [CrossRef]
- Bertocci, U.; Gabrielli, C.; Huet, F.; Keddam, M. Noise resistance applied to corrosion measurements I. Theoretical analysis. J. Electrochem. Soc. 1997, 144, 31–37. [Google Scholar] [CrossRef]
- Kearns, J.R.; Metals, A.C.G. Electrochemical Noise Measurement for Corrosion Applications; ASTM: West Conshohocken, PA, USA, 1996. [Google Scholar]
- Cottis, R.; Turgoose, S. Electrochemical Impedance and Noise; NACE International: Houston, TX, USA, 1999. [Google Scholar]
- Mabbutt, S.; Mills, D.J.; Woodcock, C.P. Developments of the electrochemical noise method (ENM) for more practical assessment of anti-corrosion coatings. Prog. Org. Coat. 2007, 59, 192–196. [Google Scholar] [CrossRef] [Green Version]
- Mansfeld, F.; Sun, Z. Localization index obtained from electrochemical noise analysis. Corrosion 1999, 55, 915–918. [Google Scholar] [CrossRef]
- Cottis, R.A.; Al-Awadhi, M.A.A.; Al-Mazeedi, H.; Turgoose, S. Measures for the detection of localized corrosion with electrochemical noise. Electrochim. Acta 2001, 46, 3665–3674. [Google Scholar] [CrossRef]
- Mansfeld, F. The electrochemical noise technique—Applications in corrosion research. AIP Conf. Proc. 2005, 780, 625–630. [Google Scholar]
- Pham, T.D. From fuzzy recurrence plots to scalable recurrence networks of time series. EPL-Europhys. Lett. 2017, 118, 20003. [Google Scholar] [CrossRef]
- Eckmann, J.-P.; Kamphorst, S.O.; Ruelle, D. Recurrence plots of dynamical systems. EPL-Europhys. Lett. 1987, 4, 973. [Google Scholar] [CrossRef]
- Zbilut, J.P.; Webber, C.L. Embeddings and delays as derived from quantification of recurrence plots. Phys. Lett. A 1992, 171, 199–203. [Google Scholar] [CrossRef]
- Trulla, L.L.; Giuliani, A.; Zbilut, J.P.; Webber, C.L. Recurrence quantification analysis of the logistic equation with transients. Phys. Lett. A 1996, 223, 255–260. [Google Scholar] [CrossRef]
- Mitschke, F.; Dämmig, M. Chaos versus noise in experimental data. Int. J. Bifurcat. Chaos 1993, 3, 693–702. [Google Scholar] [CrossRef]
- Cazares-Ibanez, E.; Vazquez-Coutino, G.A.; Garcia-Ochoa, E. Application of recurrence plots as a new tool in the analysis of electrochemical oscillations of copper. J. Electroanal. Chem. 2005, 583, 17–33. [Google Scholar] [CrossRef]
- Webber, C.L., Jr.; Ioana, C.; Marwan, N. Recurrence Plots and Their Quantifications: Expanding Horizons; Springer International Publishing: Cham, Switzerland, 2016. [Google Scholar]
- Webber, C.L., Jr.; Marwan, N. Recurrence Quantification Analysis: Theory and Best Practices; Springer: Berlin, Germany, 2014. [Google Scholar]
Figure 1.
ACM monitors construction.

Figure 2.
ACM monitor assembled.

Figure 3.
An illustrative diagram of ACM into the desiccator.

Figure 4.
Cast iron’s time series in current and potential for (a) blank at 40% RH, (b) blank at 98% RH, (c) Paraloid B72 at 40% RH, and (d) Paraloid B72 at 98% RH.
Figure 4.
Cast iron’s time series in current and potential for (a) blank at 40% RH, (b) blank at 98% RH, (c) Paraloid B72 at 40% RH, and (d) Paraloid B72 at 98% RH.
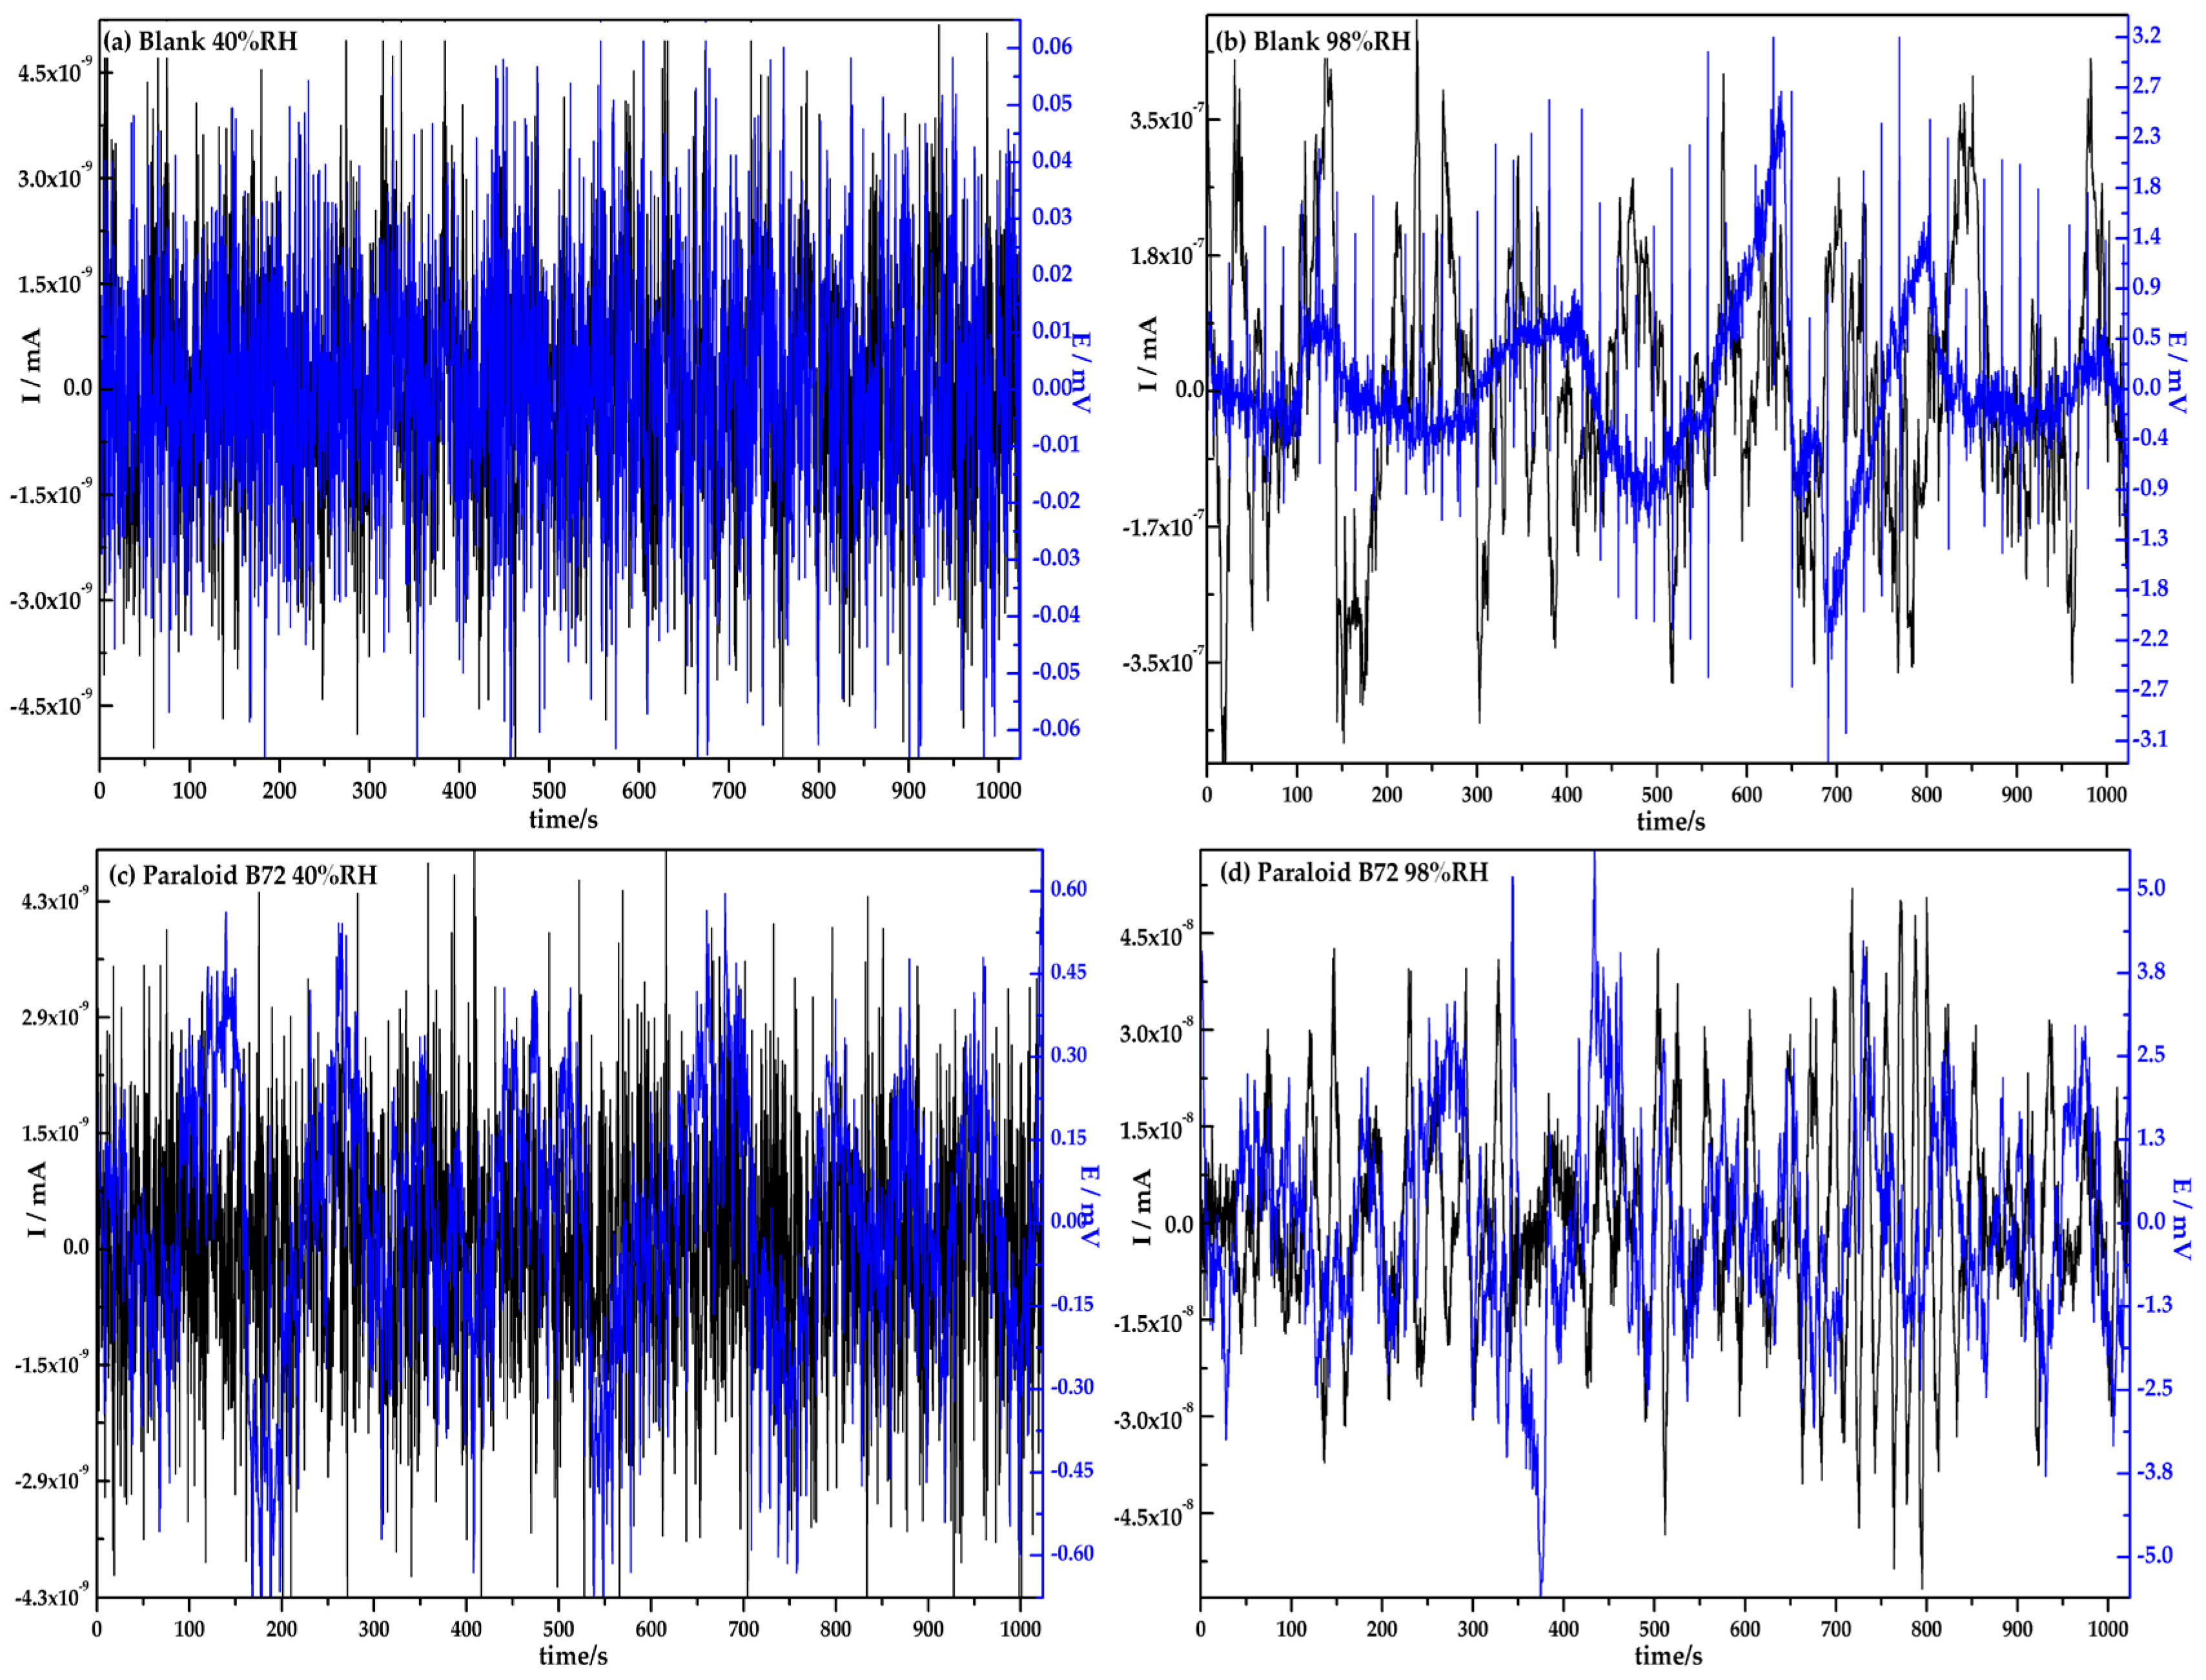
Figure 5.
Cast iron’s time series in current and potential for (a) Paraloid B72 + 50 μg∙cm−2 with caffeine at 40% RH, (b) Paraloid B72 + 50 μg∙cm−2 with caffeine at 98% RH, (c) Paraloid B72 + 50 μg∙cm−2 with nicotine at 40% of RH, and (d) Paraloid B72 + 50 μg∙cm−2 with nicotine at 98% RH.
Figure 5.
Cast iron’s time series in current and potential for (a) Paraloid B72 + 50 μg∙cm−2 with caffeine at 40% RH, (b) Paraloid B72 + 50 μg∙cm−2 with caffeine at 98% RH, (c) Paraloid B72 + 50 μg∙cm−2 with nicotine at 40% of RH, and (d) Paraloid B72 + 50 μg∙cm−2 with nicotine at 98% RH.

Figure 6.
1/Rn (proportional to the corrosion rate) and the location index (LI) according to the times for different coatings in 40% and 98% relative humidity.
Figure 6.
1/Rn (proportional to the corrosion rate) and the location index (LI) according to the times for different coatings in 40% and 98% relative humidity.

Figure 7.
Recurrence plots of (a) Blank at 40% RH, (b) blank at 98% RH, (c) Paraloid B72 at 40% RH, (d) Paraloid B72 at 98% RH, (e) Paraloid B72 + µg∙cm−2 of caffeine at 40% RH, (f) Paraloid B72 + 50 µg∙cm−2 of caffeine 98% at RH, (g) Paraloid B72 + 50 µg∙cm−2 of nicotine at 40% RH, and (h) Paraloid B72 + 50 µg∙cm−2 of nicotine at 98% RH.

Figure 8.
Recurrence time as a function of time in 40% and 98% relative humidity.


Table 1.
Chemical composition determined by an arc/spark OES.
| Code | Fe | C | Si | Mn | P | S |
|---|---|---|---|---|---|---|
| Concentration % | 92.645 | 3.65 | 2.5 | 0.6 | 0.9 | 0.15 |
© 2018 by the authors. Licensee MDPI, Basel, Switzerland. This article is an open access article distributed under the terms and conditions of the Creative Commons Attribution (CC BY) license (http://creativecommons.org/licenses/by/4.0/).
Share and Cite
MDPI and ACS Style
Roncagliolo Barrera, P.; Rodríguez Gómez, F.J.; García Ochoa, E. Assessing of New Coatings for Iron Artifacts Conservation by Recurrence Plots Analysis. Coatings 2019, 9, 12. https://doi.org/10.3390/coatings9010012
AMA Style
Roncagliolo Barrera P, Rodríguez Gómez FJ, García Ochoa E. Assessing of New Coatings for Iron Artifacts Conservation by Recurrence Plots Analysis. Coatings. 2019; 9(1):12. https://doi.org/10.3390/coatings9010012
Chicago/Turabian StyleRoncagliolo Barrera, Paola, Francisco Javier Rodríguez Gómez, and Esteban García Ochoa. 2019. "Assessing of New Coatings for Iron Artifacts Conservation by Recurrence Plots Analysis" Coatings 9, no. 1: 12. https://doi.org/10.3390/coatings9010012
Note that from the first issue of 2016, this journal uses article numbers instead of page numbers. See further details here.