Properties of Post-Consumer Polyethylene Terephthalate Coating Mechanically Deposited on Mild Steels


1
Department of Chemical Engineering, University of Minas Gerais, Av. Pres. Antônio Carlos, 6627, Pampulha, Belo Horizonte 31270-901, Brazil
2
Department of Industrial Engineering, University of Trento, via Sommarive n. 9, 38123 Trento, Italy
*
Author to whom correspondence should be addressed.
Coatings 2019, 9(1), 28; https://doi.org/10.3390/coatings9010028
Submission received: 16 October 2018
/
Revised: 26 December 2018
/
Accepted: 28 December 2018
/
Published: 5 January 2019
(This article belongs to the Special Issue Advances in Organic and Polymeric Coatings )
Abstract
:An anticorrosive coating of post-consumer polyethylene terephthalate (PET) was applied on carbon steel by using an industrial press. The PET layer showed a good adhesion on the substrate, evaluated by using a pull off test, when compared with the traditional organic coatings. In addition, scanning electron microscopy (SEM) analysis showed that the PET layer was uniform, homogeneous, and free of cracks or defects. The Fourier-transform infrared spectroscopy (FTIR) and differential scanning calorimetry (DSC) proved that the PET properties were not affected by the deposition process. The PET organic coating is a promising coating, due to its corrosion resistance evaluated by using salt spray tests, even though the applied thickness of 65 µm was considered thin for a high-performance coating. The electrochemical impedance spectroscopy (EIS) showed that the PET coating has a capacitive effect and its electrochemical behavior was not affected as the exposure time increased, resulting in an impedance modulus value of 1010 Ω·cm2, after 576 h of immersion in an aqueous solution of NaCl 3.0 wt %.
1. Introduction
An alternative contribution to solve the problem of urban solid waste (USW) is to use solid polymeric waste to develop coatings for steels [1]. Carbon steel has excellent mechanical properties and low cost but has some disadvantages such as low wear and corrosion resistance in various media [2]. The most employed method to protect the carbon steel against corrosion process has been the organic coatings. Polymeric layers are applied on the carbon steel to avoid the contact between metallic surface and the aggressive environment. The barrier protection conferred by the polymeric coatings can be associated to their water uptake property [3,4,5,6,7,8,9,10].
The organic coatings based on polyester, epoxy, and polyurethane resins, which present a lower water uptake value compared to alkyd resins, are widely used. Nevertheless, for long exposure time, the absorbed water reaches the metal and the corrosion process is established. In order to retard this process, thick films (from tens of µm to a few mm) of these organic coatings are applied on the substrate, thus causing an increase in the total cost of this project [8,9,10,11,12,13,14,15].
Lins et al. [1] demonstrated that post-consumer commingled polymer (PCCP) coatings on carbon steels can be produced by thermal spraying and investigating their erosion behavior. Literature reports the use of post-consumer tires to develop sustainable polymeric composite materials which are characterized by good mechanical and functional properties [3]. Çinar and Kar [4] mixed PET waste particles in a screwed extruder with marble dust to produce a composite material.
Municipal solid waste management has received a great deal of attention as countries such as India, which produces an estimated quantity of 50–600 million tons of urban solid waste annually [5]. The municipal solid waste is mainly composed of metals, glass and plastics. The municipal solid waste of Bangalore, India, contains 6.23% of plastics [5]. In 2016, 27.1 million tons of plastic waste was collected through official schemes in the EU28 plus Norway and Switzerland to be treated, and for the first time, more plastic waste was recycled than landfilled [6].
One of the main components of plastic fraction of USW is the polyethylene terephthalate (PET) which is one of the most versatile polymers available, which makes it the most produced and used polymer worldwide [7,8]. PET has characteristics such as flexibility, transparency, good adhesion, low permeability to liquids and gases, high thermal resistance and low cost, all of which enable PET to be an excellent candidate for a protective coating with low thickness [8,9,10,11]. Literature reports PET deposition on steels by using low-velocity flame spray technology [9].
In this work, post-consumer PET was deposited on carbon steels by using mechanical deposition. Mechanical PET deposition presents simplicity, lower cost in relation to the thermal spraying, and was not found in literature to the best of our knowledge. The process of comminution of PET from the post-consumer bottles until a powder of the desired granulometry is not a simple process; one reason for this relies on the fact that PET is hygroscopic. Based on the obtained results, a procedure was developed for the comminution of PET from the post-consumer bottles, which has proved to be very efficient. The effect of the mechanical deposition on the PET structural and thermal properties was investigated by FT-IR spectroscopy and differential scanning calorimetry (DSC) measurements. The protection properties provided by the PET coatings were evaluated by using electrochemical impedance spectroscopy (EIS) analysis and exposure in the neutral salt spray chamber (NSST, according to the ASTM B117 [12] and ISO 9227-2017 standards [13]). The obtained results have been compared with literature data of pristine paints employed for corrosion protection purposes. In addition, adhesion tests were performed by the pull-off test, in order to characterize the interaction between PET coating and steel substrate.
2. Materials and Methods
2.1. Materials
The post-consumer PET bottles were collected from household waste; the labels and the lid were removed and discarded. The bottles were washed in soapy water. The grinding process allowed a yield of 85% of the overall use of the bottle; only the top and bottom of the bottles were not used.
The substrate used was Q-Panel type R steel with dimensions 80 mm × 40 mm × 1 mm. The composition of this carbon steel was 0.15 C, 0.60 Mn, 0.030 P, 0.035 S (wt %). Prior to deposition, a blast pre-treatment of the steel samples was used, creating a roughness profile on the carbon steel surface (Rz) of approximately 20 μm. An SBC 350 sandblasting machine (Nova, Rehovot, Israel) was used with Garnet filter sand. After this process, the plate was washed with acetone in an ultrasonic bath for 2 min and dried with clean air.
2.2. Deposition Process
The amount of 0.8 g of PET ground with particle size of approximately 0.07 mm was deposited on carbon steel. The set was placed in the press for heating at 260 °C for 5 min without pressure; there after a pressure of 0.5 ton was applied for 2 min. The material remained in the press and was cooled for 5 min. The coated steel was then removed from the press and conditioned at room temperature for 24 h. The PET coating thickness was 65 ± 5 µm.
2.3. Coating Characterization
The morphology of the coating was examined by using scanning electron microscopy (SEM), with a FEG-Quanta 200 FEI equipment (FEI Company, Fremont, CA, USA). The coated steel was also characterized by using Fourier transform infrared spectroscopy employing an attenuated total reflection (ATR) geometry, by means of Varian 4100 Excalibur Series equipment (Santa Clara, CA, USA). The wavelength range was 500–4000 cm−1 and the resolution of 4 cm−1. The powder and PET coating are from the same batch before and after pressing in Caver laboratory press, model 2699, Ser. No. 2699-12748, Fred S. carver Inc., Wabash, IN, USA.
The differential scanning calorimetry (DSC) test was performed using the Mettler DSC30 (Mettler Toledo, New York, NY, USA) equipment in three cycles, with heating from 0 to 300 °C under a nitrogen flow of 10 mL·min−1, followed by cooling and heating from 0 to 300 °C, at a heating rate of 10 °C min−1. Thermal analysis provided the glass transition temperature (Tg), crystallization temperature (Tc) and melting temperature (Tm). The crystallinity value (χc) was calculated by using the values of the endothermic melting peak using the Equation (1):
where ΔHm is melting enthalpy, and the melting enthalpy for polyethylene terephthalate, considered 140 J·g−1 [14].
The adhesion of the coating was evaluated by using the pull-off test according to the ASTM D4541 standard [15]. Dollies of 20 mm were glued on the plate coated with Huntsman Araldite 2000 glue; the cure occurred in a period of 24 h. The equipment used was a De Felsko PosiTest AT-M (Ogdensburd, NY, USA). The tests were performed in triplicate.
Coating thickness was measured by using a digital layer thickness gauge on a ferrous base Digi-Derm Mitutoyo (Aurora, CO, USA). Ten measurements were collected on the coated steel.
The size distribution of the PET particles was performed by laser diffraction in the Mastersizer 3000 equipment (Worcestershire, UK). The obtained values were D(4,3), which represents the average size distribution; Dv(10), which represents that only 10% of the particles were smaller than the displayed value; Dv(50), showing that 50% of the particles were larger, and 50% smaller than the determined value; and Dv(90), which reveals that 90% of the particles were below this value.
2.4. Corrosion Resistance Evaluation
Corrosion tests were performed using an Equilam salt spray chamber (Diadema, Brazil) in compliance with the ASTM B117 standard [12] for 500 h. The solution used was 5.0 wt % NaCl with pH between 6.5 and 7.2. A linear scratch was made on the coated steel with a tungsten carbide tool at an angle of 60°.
Electrochemical impedance spectroscopy was performed by using Metrohm AUTOLAB 302 N potentiostat/FRA (Utrecht, The Netherlands) at room temperature. The measurements were performed using a three-electrode electrochemical cell; a platinum foil was used as a counter electrode, a Ag/AgCl(sat) reference electrode was used, and the coated samples were employed as working electrodes. A polyvinylchloride (PVC) tube was affixed with silicone glue on the coated plate, delimiting the exposure area to 6.25 cm2, where the 3.0 wt % NaCl solution was poured. The open circuit potential was measured for one hour or until stabilization. The EIS measurements were collected at the OCP after 1, 24, 192, 360, 480, and 576 h of immersion. The potential signal amplitude applied was 10 mV (rms), and the frequency range analyzed was 105–10−2 Hz. The data collected were analyzed by using the ZView2 software.
Evolution of the capacitance of the film was employed to measure the phenomena of water absorption since the presence of moisture modifies the dielectric constant of the polymer [16,17].
The ratio of the dielectric constant (ε) of the coating was calculated using Equation (2) [18]:
ε0 is the dielectric constant of free space (8.854 × 10⁻¹² F m−1), A is the coating area and L is the coating thickness.
The fraction of water volume of coating at saturation (Ø∞) was calculated by using the Brasher and Kingsbury (BK) formula:
where C∞ is the coating capacitance at immersion time t (determined from EIS data); C0 is the initial coating capacitance and Ct is the relative permittivity of the water. The parameters C∞ and Ø are dependent on the immersion time [19].
3. Results and Discussion
3.1. Characterization Results
Figure 1 shows the PET powder produced from post-consumer bottles. The particles are heterogeneous in shape and size. More elongated and other equiaxial particles can be identified. Particle sizes have been calculated from measurement of particle areas using the IMAGEJ-win64 software. The PET powder presented a particle area between 430 and 51,200 µm2, and 90% of PET particles showed the size of 635 µm.
Figure 2 presents the cross-sectional section of the coated steel obtained by using SEM analysis. The film is uniform and free of cracks and voids.
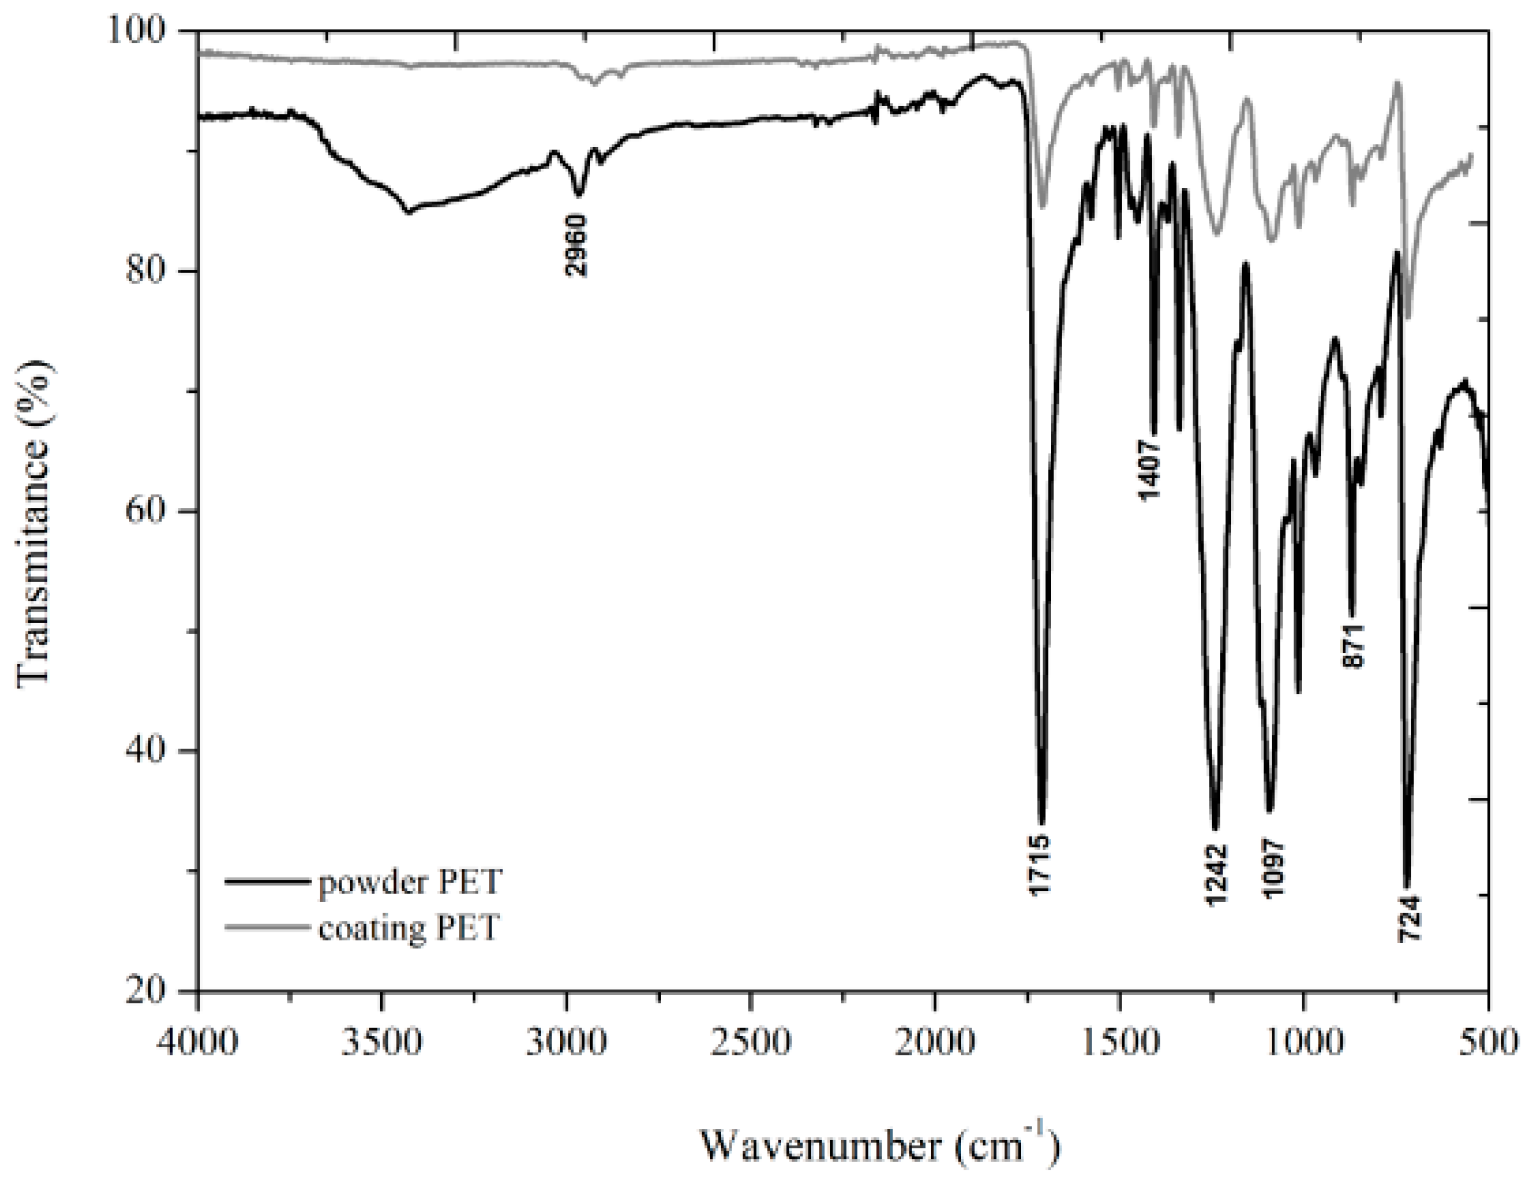
Figure 3 shows the FT-IR spectra of PET powder and coating, and Table 1 shows characteristic absorptions of functional groups present in PET powder and PET coating. The PET absorption band at 1715 cm−1 is attributed to vibrations of the carbonyl group of saturated esters; the bands at 724 and 871 cm−1 are due to the interaction of polar ester groups and benzene rings, vibration =C–H out of the plane. The 1097 cm−1 band is associated with the stretching vibration mode of C–O bonds and bands at 1242 cm−1 are associated to the specific absorption of the terephthalate group (OOC–C6H4–COO). Bands related to the asymmetric deformation in CH2, at 1407 and 1018 cm−1, were identified [20,21,22]. At 2960 cm−1, absorption associated to the symmetrical stretch of the C–H bond is observed, with a higher intensity for the PET powder than PET coating. Compared to the coating, the PET powder showed a broad band around 3600 cm−1 probably due to the water absorption. Notice that the FT-IR spectra of the powder and of the coating are very similar. The coating deposition treatment does not seem to affect the chemical structure of the polymer.
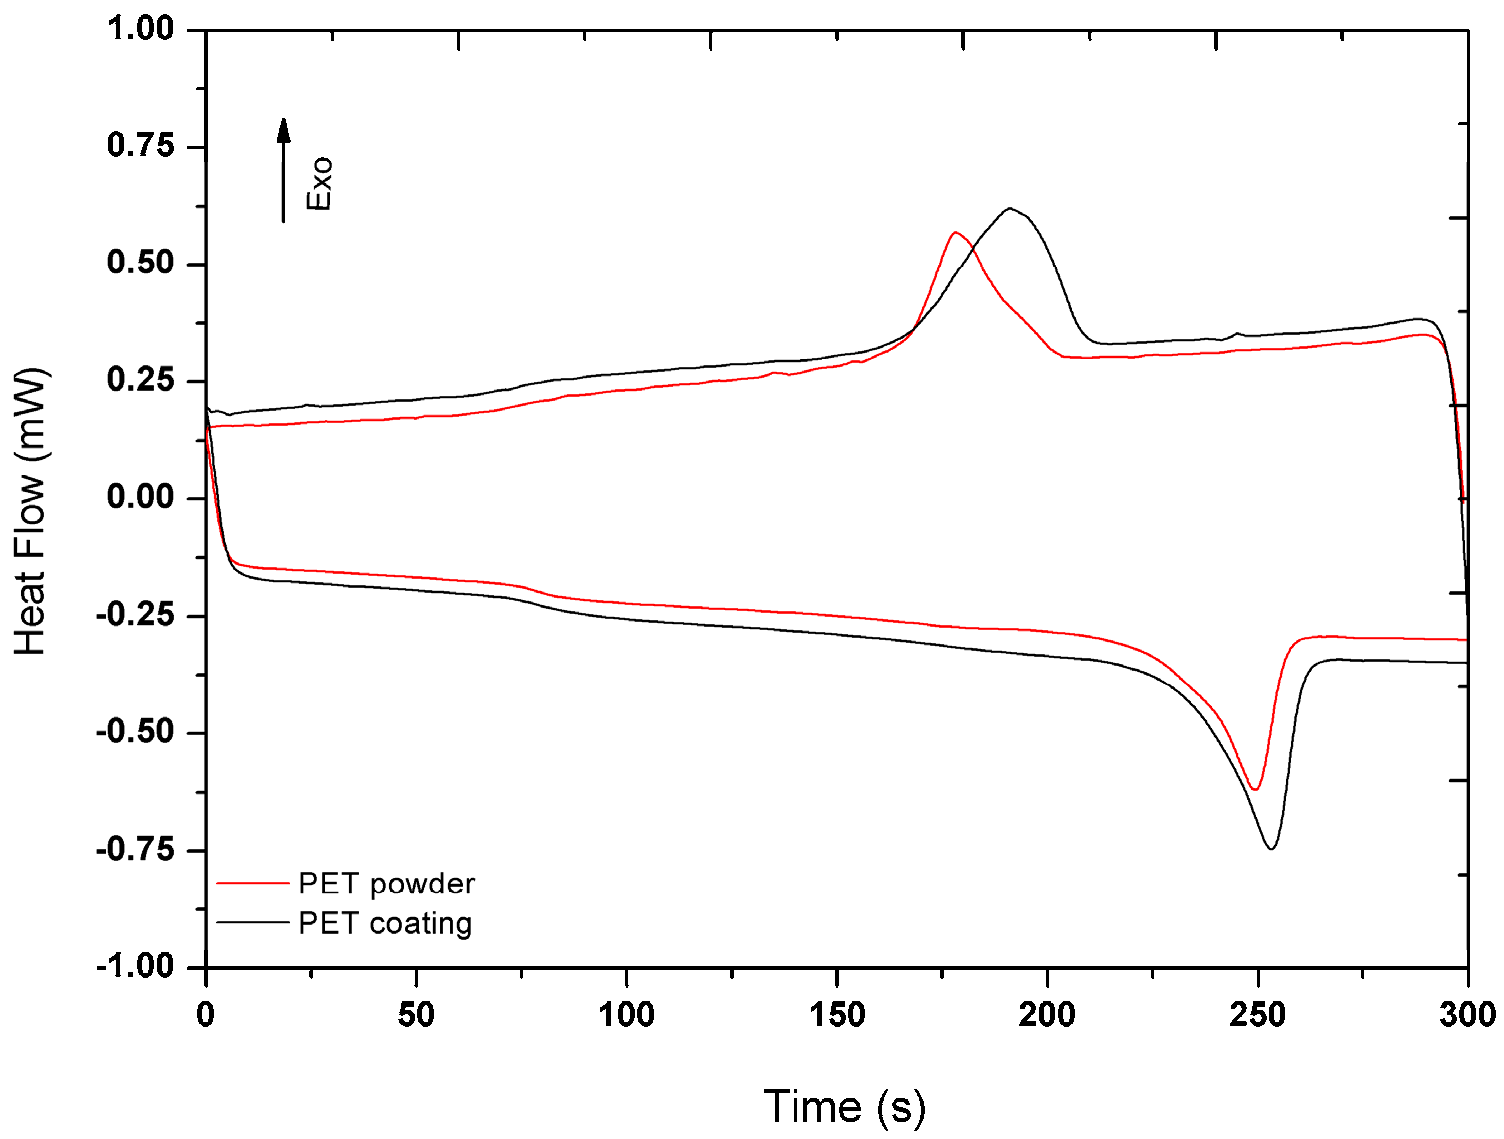
Figure 4 shows DSC results for PET powder and PET coating (removed from the mild steel substrate to carry out the analysis). Table 2 summarizes the thermal analysis results for PET powder and coating. Analyzing the Tg values, the onset values for PET powder and PET coating are very close being 73.8 and 72.8 °C, respectively, within the margin of error of the measurement that is 2 °C. The glass transition temperature is the temperature at which the carbon–carbon bonds become more flexible. The PET coating is rigid at room temperature, since it is below Tg.
The similar Tg values of powder and coating do not indicate significant damage in the reorganization of the polymer chain of the coating during deposition. As far as thermally sprayed PET on mild steels are concerned, Duarte et al. [9] reported that the Tg of coating was lower than that of the powder, which indicated a thermal degradation of the PET during the thermal deposition, decreasing its molar mass. In [9], the Tg value for the PET powder was 79 °C, about 5 °C above the value obtained in this work. The glass transition temperature depends on the heating rate which is the same in this work and in reference [8]. In the case of the thermal spray technique, the polymer is subjected to high temperatures above 1000 °C, above the degradation temperature of the PET which is about 450 °C. Demirel [23] studied mound surface temperature in injection stretch blow molding (ISBM) of polyethylene terephthalate (PET) bottles for carbonated soft drinks (CSD) storage. The cited author reported the effect of mound surface temperature on Tg of PET bottles which varied between 58.3 and 59.4 °C.
The crystallization temperature of the coating showed an increase of 6.7% in relation to the powder, as seen in Figure 4 and Table 1. This phenomenon may have occurred due to the PET melting at 260 °C for application on the steel, and due to the slow cooling process, which provides time to recrystallization of part of the material. The χc values also confirm the crystallinity increase, being 25.5% for the powder and 31.7% for the coating. Takeshita et al. [24] studied the influence of cooling time on the physical properties of the polyester powder coating. They concluded that the cooling time influences the crystallinity values of the polymer and that the ratio between the cooling time and the degree of crystallinity is almost linear. In this sense, the increase in crystallinity of the PET coating was due to the cooling process of the coating deposition. Demirel [23] showed values of crystallinity of PET bottles similar to that found in this work, in the range from 21% up to 29%. Melting temperatures for PET powder and coating were similar (233 and 235 °C, respectively). Literature reports values of PET melting temperature in the range of 242–260 °C [22,25].
PET degradation occurred at temperatures of 454.7 and 455.0 °C for powder and coating, respectively. As the PET reached 260 °C in the deposition process, degradation did not occur. Duarte et al. [9] reported degradation temperatures of 444 °C for PET powder and 437–446 °C for thermally sprayed PET coating.
Dry adhesion test was carried out by means of pull-off test. The detachment of the dolly occurred at the interface between the glue and the coating, at about 5 MPa. Based on these findings, we can assume that the adhesion strength is greater than 5 MPa. The value found for PET coating was compared with literature values for polyester powder coatings. As a result, we can observe in Table 3 that the adhesion values for the polyester family is very close to the value found in this work.
3.2. Corrosion Resistance of PET Coated Steel
3.2.1. Results of Exposure of the Coating on Scratched Samples after 480 h in Salt Spray Chamber
Salt spray results are shown in Figure 5 for up to 480 h of exposure in chamber.
The salt spray tests showed a reduced extent of coating delamination resulting from the scratch. No blisters where observed during the 480 h of immersion. As the test time increased, a marked increase in the corrosion of the carbon steel in the scratch area was observed. However, the cathodic front did not advance underneath the coating. No coating detachment was observed during exposure time of up to 480 h.
3.2.2. Electrochemical Impedance Spectroscopy (EIS)
Figure 6 shows Bode diagram for PET coated steel in an aqueous solution of NaCl for immersion up to 576 h. The phase angle curves are sometimes scattered, in particular between 10 and 100 Hz and around 0.1 Hz, probably due to the relatively high impedance of the coating during immersion time. According to the impedance modulus diagrams (Figure 6a) the impedance values in the low frequency range (at about 0.01 Hz, |Z|0.01) was high and almost stable as it ranged from 1 × 10¹⁰ to 3 × 10¹⁰ Ω cm2 throughout immersion time. A straight line with the slope close to −1 was observed in the Bode diagram, thus suggesting an almost capacitive behavior over a wide range of frequencies. A single time relaxation process was observed in the middle frequency range.
After 360 h of immersion, a decrease in impedance in the low frequency domain was observed, however, there is a trend for stabilization (Figure 7). The low frequency impedance was in the order of 1 × 10¹⁰–3 × 10¹⁰ Ω cm2 during all immersion time, thus suggesting that the PET applied coating provided steel corrosion protection. The PET coating seems to be able to retard the direct contact between the corrosive medium and metal substrate. To better investigate the properties of the recycled PET coating, EIS data were fitted employing the equivalent circuit shown in Figure 7. According to [28,29], a Re(QcRp) was employed to fit the experimental spectra. Re is the electrolyte resistance. The constant phase element, Qc, and the resistance, Rp, where attributed to the dielectric properties and the pore resistance of the PET coating, respectively.
Considering the results reported in Table 4, as the values of the ‘n’ exponent is about 0.98 during the whole immersion time, the pre-factor of the CPE named Qc can be assumed as the coating capacitance. For this reason, from now on, the pre-exponential factors of the CPE will be considered throughout the paper as an acceptable approximation of the capacitance values during immersion time. Figure 8 shows the evolution of the normalized coating capacitance (respect to the initial capacitance value, Ct = x/Ct = 0) during the first 24 h of immersion. Initially, a sharp increase in the normalized capacitance was observed, probably due to micropores formed in the coating which facilitated water permeation. After the first hours of immersion, the capacitance reached a sort of saturation, remaining stable at a value 1.12/1.14 times the initial capacitance. As far as the pore resistance is concerned, from Table 4 it is possible to observe that it decreased from 1.82 × 10¹⁰ to 0.81 × 10¹⁰ Ω cm2 after 576 h due to continuous immersion in the electrolyte, thus suggesting that the recycled PET coatings have excellent barrier properties.
In fact, the pore resistance Rp values of the investigated coatings are comparable or, in particular cases, highly compared to previously reported literature data (Table 5) related to polyester-based paints (derived from pristine materials).
Relative permittivity of dry coating εd and fraction of water volume Ø were calculated by Equations (2) and (3). The value of εd for PET coating was 5.0: this value is in accordance with relative permittivity reported in the literature to dry coating 3–8 [29,32,33]. The coating to be considered protective and water resistant must show the value of Ø between 2.0% and 15.98%, approximately [29,34]. The value of fraction of water volume estimated for the PET coating was 3.2% after 24 h of immersion in 3.0 wt % NaCl solution.
4. Conclusions
The DSC results indicated no significant damage to the polymer produced by the mechanical deposition (press recycled).
The PET organic coating with a thin layer of 65 µm presented good adhesion to the substrate, superior to 5 MPa, evaluated by using the pull-off test, as well as a high corrosion protection for carbon steel during long immersion times in the NaCl 3.0 wt % electrolyte; both of which are important characteristics for an anticorrosive organic coating. The polarization resistance of PET coated steel in a saline solution was 8.1 × 10⁹ Ω cm2 after 576 h of immersion. The value of fraction of water volume absorbed was 3.2% indicating the excellent protective action of coating.
The PET organic coatings can be considered as an alternative, both for the PET recycling and for a new anticorrosive coating.
Wear evaluation of PET coating will be performed in further investigation.
Author Contributions
Conceptualization, E.S., V.L., F.D. and M.F.; Methodology, E.S.; Validation, E.S., F.D., M.F. and F.C.; Formal Analysis, E.S., M.F. and F.C.; Investigation, E.S. and M.F.; Writing–Original Draft Preparation, E.S. and V.L.; Writing–Review & Editing, E.S., M.F., F.D., F.C. and V.L.; Supervision, E.S.; Project Administration, E.S., F.D. and M.F.
Funding
This research was funded by Foundation CAPES (Coordination for higher Education Staff Development) (No. 88881.135023/2016-01).
Acknowledgments
The authors would like to sincerely thank the polymers laboratory of University of Trento.
Conflicts of Interest
The authors declare no conflict of interest.
References
- Lins, V.F.C.; Branco, J.R.T.; Diniz, F.R.C.; Brogan, J.C.; Berndt, C.C. Erosion behavior of thermal sprayed, recycled polymer and ethylene–methacrylic acid composite coatings. Wear 2007, 262, 274–281. [Google Scholar] [CrossRef]
- Le, L.; Mojtaba, M.; Chun, Q.L.; Dilan, R. Effect of corrosion and hydrogen embrittlement on microstructure and mechanical properties of mild steel. Constr. Build. Mater. 2018, 170, 78–90. [Google Scholar] [CrossRef]
- Sienkiewicz, M.; Janik, H.; Borzędowska-Labuda, K.; Kucińska-Lipka, J. Environmentally friendly polymer-rubber composites obtained from waste tyres: A review. J. Clean. Prod. 2017, 147, 560–571. [Google Scholar] [CrossRef]
- Çınar, M.E.; Kar, F. Characterization of composite produced from waste PET and marble dust. Constr. Build. Mater. 2018, 163, 734–741. [Google Scholar] [CrossRef]
- Ramachandra, T.V.; Bharath, H.A.; Kulkarni, G.; Han, S.S. Municipal solid waste: Generation, composition and GHG emissions in Bangalore, India Review article. Renew. Sustain. Energy Rev. 2018, 82, 1122–1136. [Google Scholar] [CrossRef]
- Plastics Europe. Available online: https://www.plasticseurope.org/application/files/5715/1717/4180/Plastics_the_facts_2017_FINAL_for_website_one_page.pdf (accessed on 9 August 2018).
- Shen, L.; Worrell, E.; Patel, M.K. Open-loop recycling: A LCA case study of PET bottle-to-fibre recycling. Resour. Conserv. Recycl. 2010, 55, 34–52. [Google Scholar] [CrossRef]
- Awaja, F.; Pavel, D. Recycling of PET. Eur. Polym. J. 2005, 41, 1453–1477. [Google Scholar] [CrossRef]
- Duarte, L.T.; Paula, E.M.; Branco, J.R.T.; Lins, V.F.C. Production and characterization of thermally sprayed polyethylene terephthalate coatings. Surf. Coat. Technol. 2004, 182, 261–267. [Google Scholar] [CrossRef]
- Phetphaisit, C.W.; Namahoot, J.; Saengkiettiyut, K.; Ruamcharoen, J.; Ruamcharoen, P. Green metal organic coating from recycled PETs and modified natural rubber for the automobile industry. Prog. Org. Coat. 2015, 86, 181–189. [Google Scholar] [CrossRef]
- Sanaee, Z.; Mohajerzadeh, S.; Zand, K.; Gard, F.S.; Pajouhi, H. Minimizing permeability of PET substrates using oxygen plasma treatment. Appl. Surf. Sci. 2011, 257, 2218–2225. [Google Scholar] [CrossRef]
- ASTM B117 Standard Practice for Standard Practice for Operating Salt Spray (Fog) Apparatus; ASTM International: West Conshohocken, PA, USA, 2012.
- ISO 9227-2017 Corrosion Tests In Artificial Atmospheres—Salt Spray Tests; ISO: Geneva, Switzerland, 2017.
- Jayakannan, M.; Ramakrishnan, S. Effect of branching on the crystallization kinetics of poly(ethylene terephthalate). J. Appl. Polym. Sci. 1999, 74, 59–66. [Google Scholar] [CrossRef]
- ASTM D4541 Standard Test Method for Pull-Off Strength of Coatings Using Portable Adhesion Testers; ASTM International: West Conshohocken, PA, USA, 2017.
- Deflorian, F.; Fedrizz, L.; Rossi, S.; Bonora, P.L. Organic coating capacitance measurement by EIS: Ideal and actual trends. Electrochim. Acta 1999, 44, 4243–4249. [Google Scholar] [CrossRef]
- Bacon, R.C.; Smith, J.J.; Rugg, F.M. Electrolytic resistance in evaluating protective merit of coatings on metals. Ind. Eng. Chem. 1948, 40, 161–168. [Google Scholar] [CrossRef]
- Zhang, J.; Hu, J.; Zhang, J.; Cao, C. Studies of impedance models and water transport behaviors of polypropylene coated metals in NaCl solution. Prog. Org. Coat. 2004, 49, 293–301. [Google Scholar] [CrossRef]
- Wang, H.; Zhou, Q. Evaluation and failure analysis of linseed oil encapsulated self healing anticorrosive coating. Prog. Org. Coat. 2018, 118, 108–115. [Google Scholar] [CrossRef]
- Chen, Z.; Hay, J.N.; Jenkins, M.J. FTIR spectroscopic analysis of poly(ethylene terephthalate) on crystallization. Eur. Polym. J. 2012, 48, 1586–1610. [Google Scholar] [CrossRef]
- Chen, Z.; Hay, J.N.; Jenkins, M.J. The thermal analysis of poly(ethylene terephthalate) by FTIR spectroscopy. Thermochim. Acta 2013, 552, 123–130. [Google Scholar] [CrossRef]
- Parvinzadeh, M.; Moradian, S.; Rashidi, A.; Yazdanshenas, M.E. Surface characterization of polyethylene terephthalate/silica nanocomposites. Appl. Surf. Sci. 2010, 256, 2792–2802. [Google Scholar] [CrossRef]
- Demirel, B. Optimisation of mould surface temperature and bottle residence time in mould for the carbonated soft drink PET containers. Polym. Test 2017, 60, 220–228. [Google Scholar] [CrossRef]
- Takeshitaa, Y.; Sawadaa, T.; Handaa, T.; Watanuki, Y.; Kudo, T. Influence of air-cooling time on physical properties of thermoplastic polyester powder coatings. Prog. Org. Coat. 2012, 75, 584–589. [Google Scholar] [CrossRef]
- Guçlu, G.; Orbay, M. Alkyd resins synthesized from postconsumer PET bottles. Prog. Org. Coat. 2009, 65, 362–365. [Google Scholar] [CrossRef]
- Mirabedini, S.M.; Kiamaneshb, A.A. The effect of micro and nano-sized particles on mechanical and adhesion properties of a clear polyester powder coating. Prog. Org. Coat. 2013, 76, 1625–1632. [Google Scholar] [CrossRef]
- Puiga, M.; Cabedoa, L.; Graceneaa, J.J.; Jiménez-Morales, A.; Gámez-Pérez, J.; Suay, J.J. Adhesion enhancement of powder coatings on galvanised steel by addition of organo-modified silica particles. Prog. Org. Coat. 2014, 77, 1309–1315. [Google Scholar] [CrossRef] [Green Version]
- Jegdić, B.V.; Bajat, J.B.; Popić, J.P.; Stevanović, S.I.; Mišković-Stanković, V.B. The EIS investigation of powder polyester coatings on phosphated low carbon steel: The effect of NaNO2 in the phosphating bath. Corros. Sci. 2011, 53, 2872–2880. [Google Scholar] [CrossRef]
- Ding, R.; Jiang, J.; Gui, T. Study of impedance model and water transport behavior of modified solvent-free epoxy anticorrosion coating by EIS. J. Coat. Technol. Res. 2016, 13, 501–515. [Google Scholar] [CrossRef]
- Mafi, R.; Mirabedini, S.M.; Naderi, R.; Attar, M.M. Effect of curing characterization on the corrosion performance of polyester and polyester/epoxy powder coatings. Corros. Sci. 2008, 50, 3280–3286. [Google Scholar] [CrossRef]
- Ismail, L.; Ramesh, K.; Mat Nor, N.A.; Jamari, S.K.M.; Vengadaesvaran, B.; Arof, A.K. Performance of polyester/epoxy binder coating system—Studies on coating resistance, adhesion and differential scanning calorimetry. Pigment Resin Technol. 2016, 45, 158–163. [Google Scholar] [CrossRef]
- Moreno, C.C.; Hernández, S.; Santana, J.J.; González-Guzmán, J.; Souto, R.M.; González, S. Characterization of water uptake by organic coatings used for the corrosion protection of steel as determined from capacitance measurements. Int. J. Electrochem. Sci. 2012, 7, 7390–7403. [Google Scholar]
- Shreepathi, S.; Naik, S.M.; Vattipalli, M.R. Water transportation through organic coatings: Correlation between electrochemical impedance measurements, gravimetry, and water vapor permeability. J. Coat. Technol. Res. 2012, 9, 411–422. [Google Scholar] [CrossRef]
- Fredj, N.; Cohendoz, S.; Mallarino, S.; Feaugas, X.; Touzain, S. Evidencing antagonist effects of water uptake and leaching processes in marine organic coatings by gravimetry and EIS. Prog. Org. Coat. 2010, 67, 287–295. [Google Scholar] [CrossRef]
Figure 1.
PET powder granulometric distribution.

Figure 2.
Cross-sectional view of PET coating.
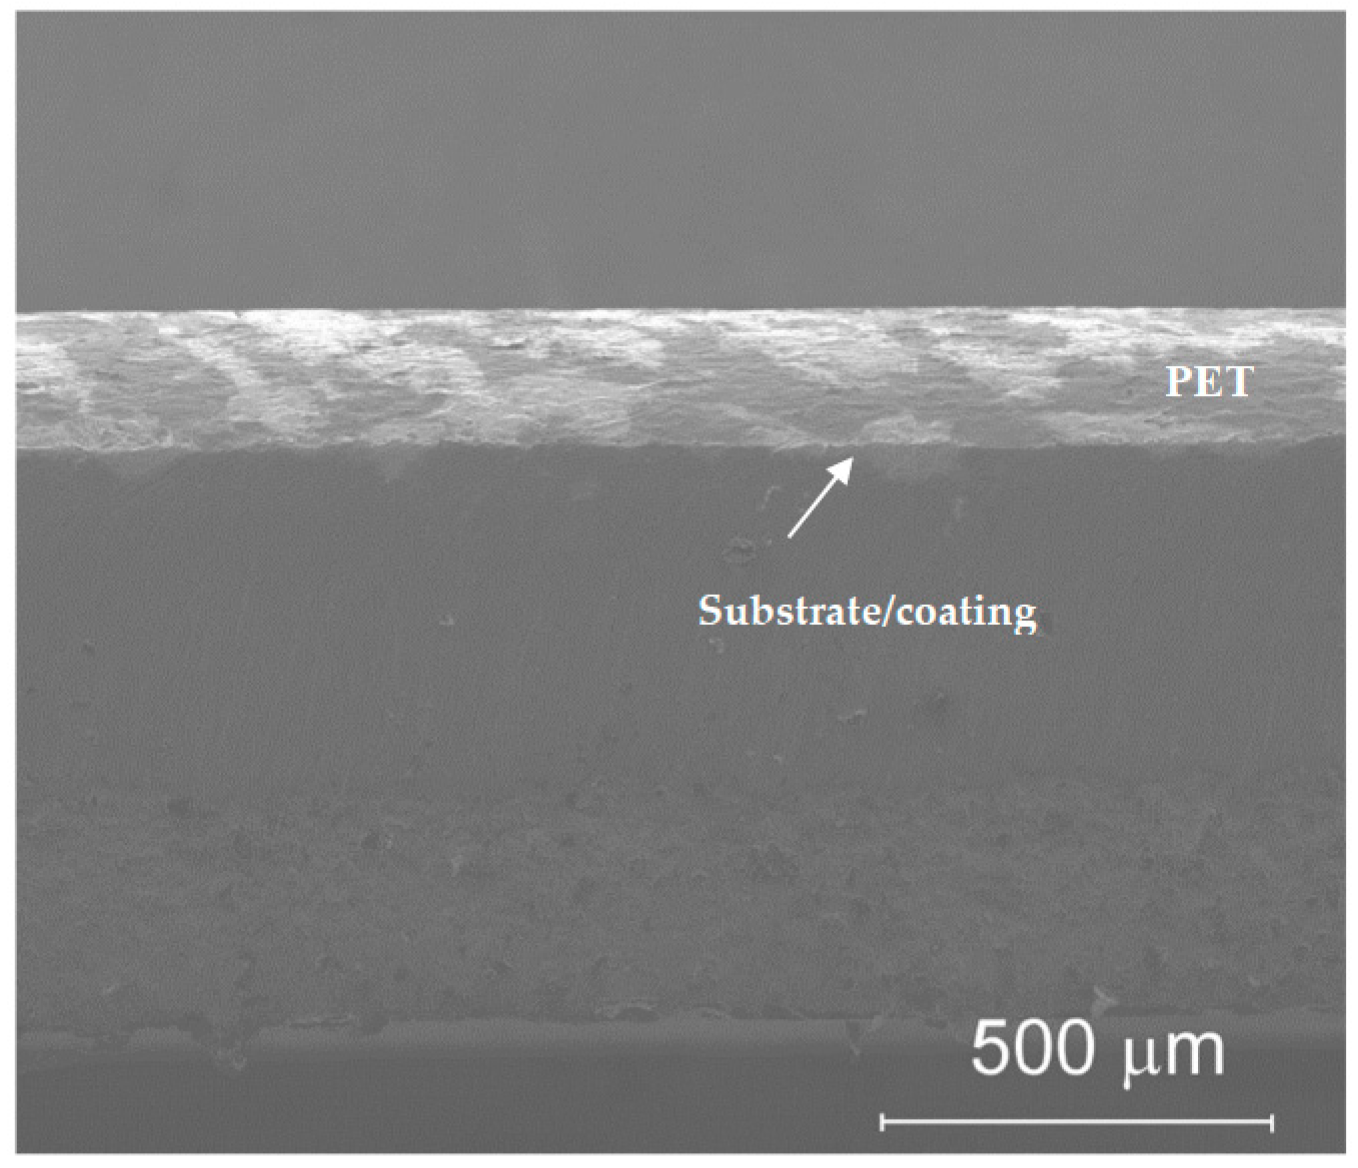
Figure 3.
FTIR spectra of PET powder and PET coating.

Figure 4.
DSC results of PET powder and PET coating on mild steel.

Figure 5.
Photographs of PET coated steel after exposure for (a) 72, (b) 240, and (c) 480 h in a salt spray chamber.
Figure 5.
Photographs of PET coated steel after exposure for (a) 72, (b) 240, and (c) 480 h in a salt spray chamber.
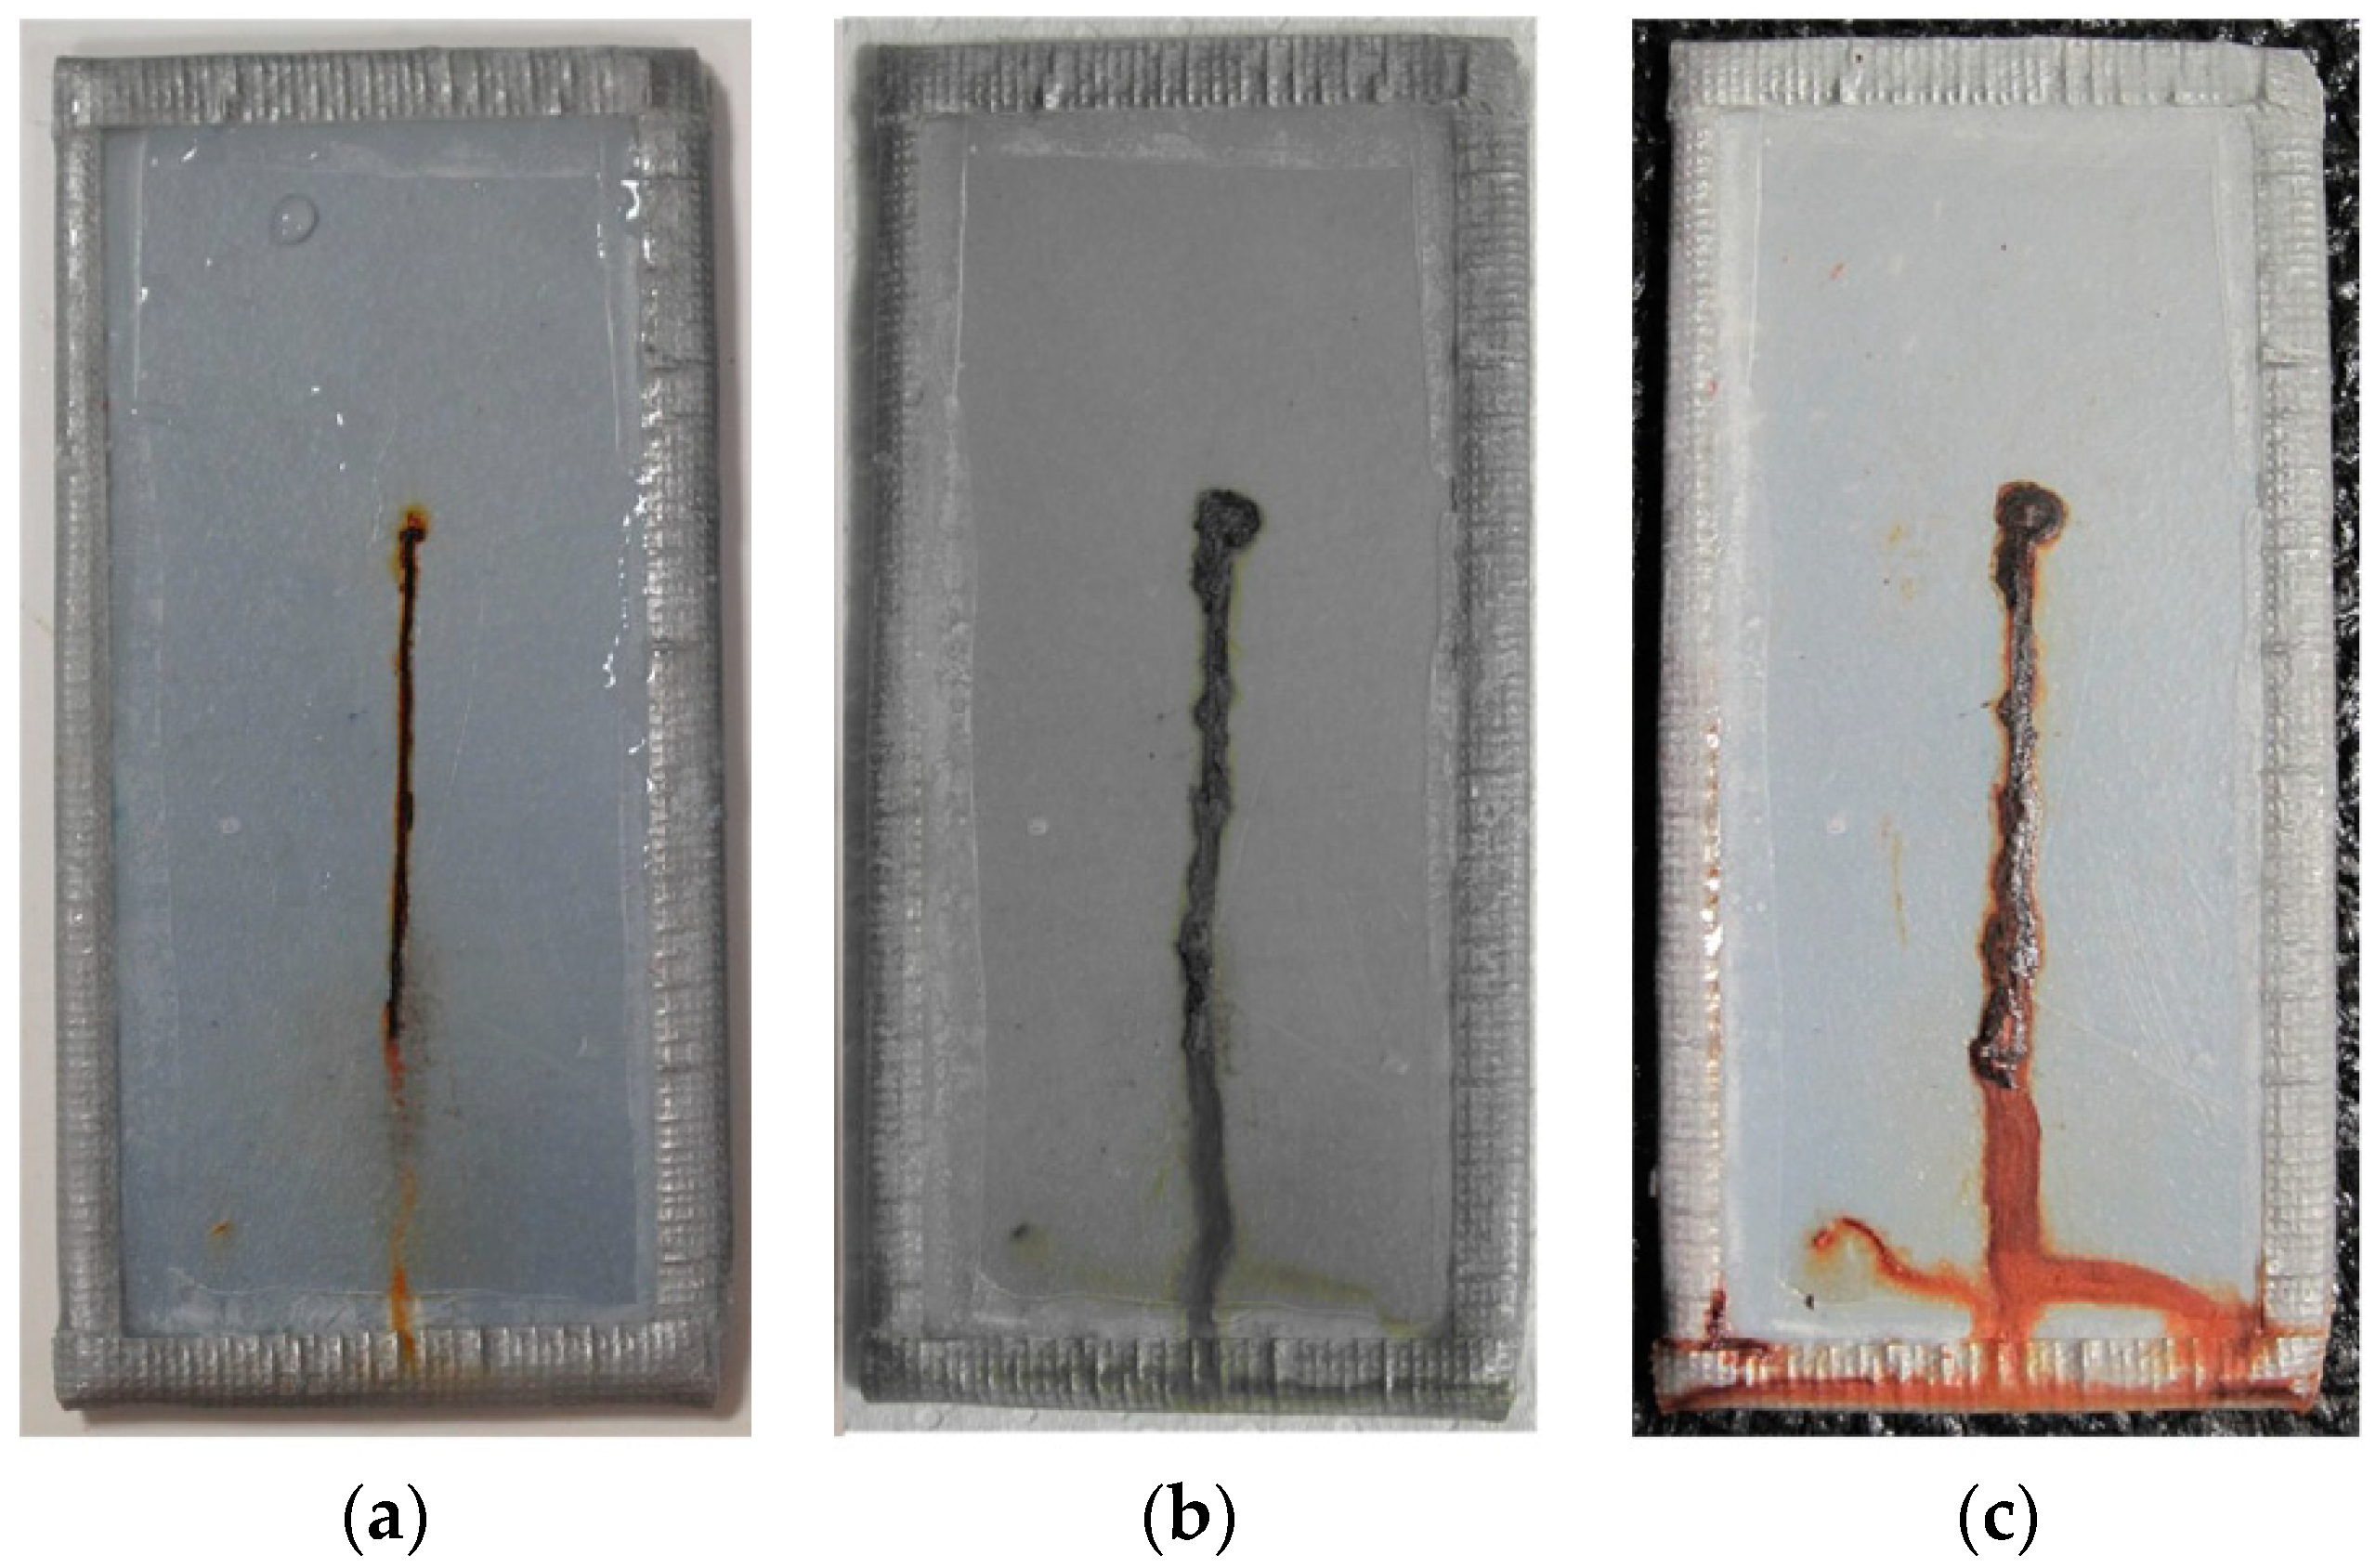
Figure 6.
(a) Bode diagram of impedance modulus versus frequency for the PET coated steel in a saline environment for 1, 24, 192, 360, 480, and 576 h, with amplification of low frequency region; (b) Bode diagram of phase angle versus frequency for the PET coated steel in a saline environment for 1, 24, 192, 360, 480, and 576 h.
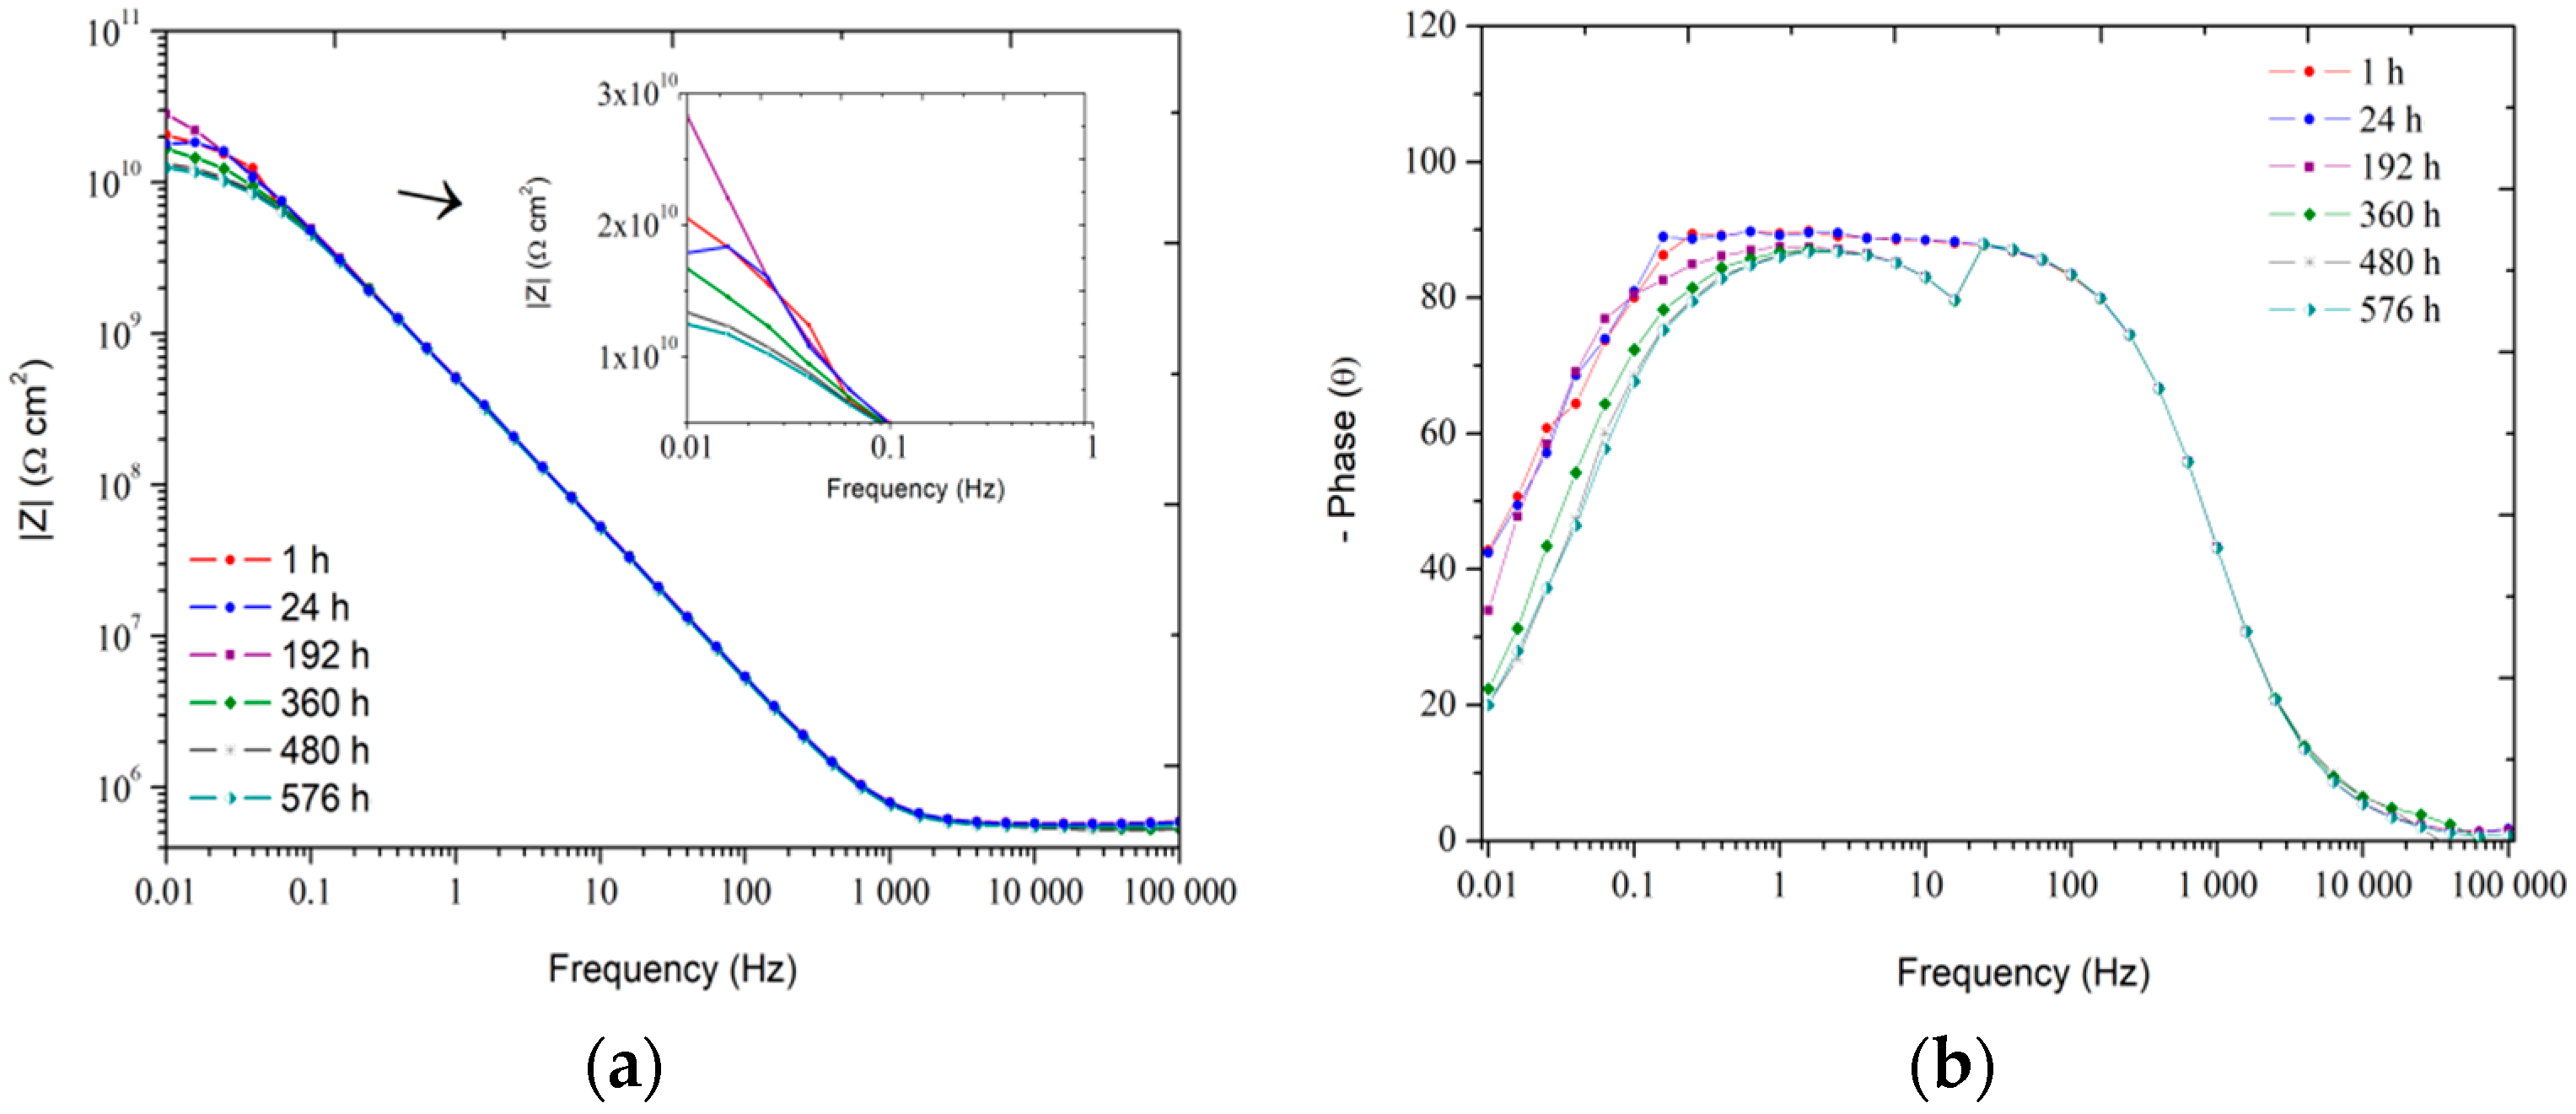
Figure 7.
Equivalent circuit for EIS data of PET coated steel in NaCl solution.
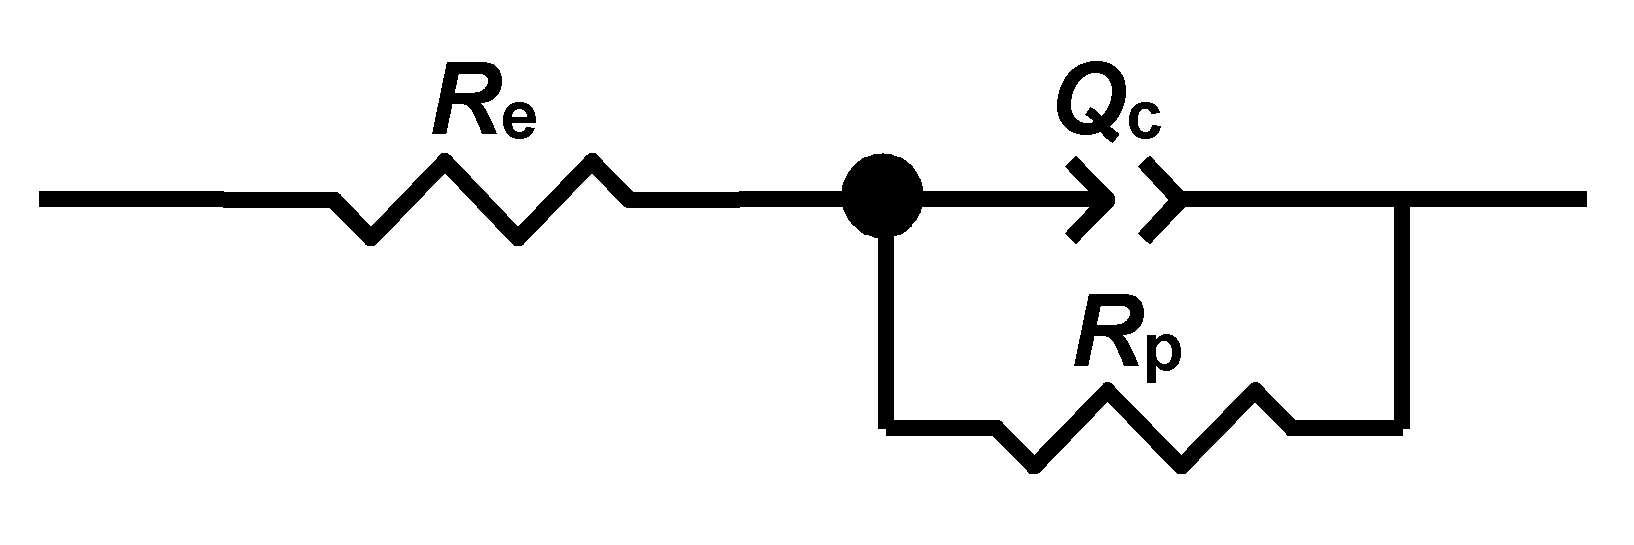
Figure 8.
Capacitance versus immersion time of PET coated steel.


Table 1.
Characteristic absorptions of functional groups present in PET powder and PET coating.
| Wavenumber (cm−1) | Functional Groups |
|---|---|
| 3200–3600 | O–H |
| 2850–3000 | C–H aliphatic |
| 1715–1740 | stretch C=O unconjugated ketone, ester and carboxylic acid group |
| 1600–1690 | stretch C=O aromatic ketone and conjugated aldehydes |
| 1407, 1018, 1465 | CH2– |
| 1270–1097 | ester group vibration |
| 1043–972 | stretching of ether group C–O–C |
| 871, 724 | Vibration =C–H benzene ring off plan |
Table 2.
Glass transition and melting temperatures, and crystallinity of PET powder and PET coatings.
Table 2.
Glass transition and melting temperatures, and crystallinity of PET powder and PET coatings.
| Sample | Glass Transition Temperature (Tg) (°C) | Crystallization Temperature (Tc) (°C) | ΔHc (J g−1) | Melting Temperature (Tm) (°C) | ΔHm (J g−1) | χc (%) | Decomposition Temperature (Td) (°C) | |
|---|---|---|---|---|---|---|---|---|
| Onset | Midpoint | |||||||
| PET powder | 73.8 | 78.6 | 195.0 | 35.6 | 233.0 | 35.7 | 25.5 | 454.7 |
| PET coating | 72.8 | 80.0 | 209.0 | 46.8 | 235.0 | 44.4 | 31.7 | 455.0 |
Table 3.
Thickness and adhesion for polyester and polyethylene terephtahalate.
| Samples | Thickness (µm) | Adhesion (MPa) | Reference |
|---|---|---|---|
| Polyester | 291–294 | 4.8–6.2 | [24] |
| Carboxylate polyester resin (URALAC) | 50.0 ± 5 | 1.7–3.0 | [26] |
| Saturated carboxylated polyester resin | 90.0 ± 10 | 4–6.8 | [27] |
| Post-consumer polyethylene terephthalate | 65 ± 5 | >5 | This work |
Table 4.
Electrochemical parameters for PET coated steel in a saline medium.
| Time (h) | Rp 1010 (Ω cm2) | Error (%) | Pre-Factor of Qc 10−11 (S sn cm−2) | Error (%) | n |
|---|---|---|---|---|---|
| 1 | 1.82 | 5.2 | 5.30 | 1.11 | 0.98 |
| 24 | 1.78 | 3.77 | 5.25 | 1.35 | 0.98 |
| 192 | 2.10 | 2.10 | 5.14 | 0.72 | 0.98 |
| 360 | 1.09 | 1.69 | 5.25 | 0.83 | 0.98 |
| 480 | 0.86 | 1.62 | 5.30 | 0.89 | 0.98 |
| 576 | 0.81 | 1.62 | 5.34 | 0.90 | 0.98 |
Table 5.
Rp values for polyester from the literature in electrolytes of 3.0–3.5 wt % of NaCl.
| Samples | Thickness (µm) | Time (h) | Rp (Ω cm2) | Reference |
|---|---|---|---|---|
| Polyester powder coating | 90 ± 10 | 0–500 | ≈108 → 105 | [27] |
| Polyester powder coating | 30 ± 2 | 24–1368 | ≈1010 → 107 | [28] |
| Polyester powder coating | 45 ± 3 | 168–1200 | ≈107 → 104 | [30] |
| Polyester/epoxy powder coating | 45 ± 3 | 168–1200 | ≈108 → 105 | [30] |
| Polyester resin | 30–40 | 0–720 | ≈107 → 104 | [31] |
© 2019 by the authors. Licensee MDPI, Basel, Switzerland. This article is an open access article distributed under the terms and conditions of the Creative Commons Attribution (CC BY) license (http://creativecommons.org/licenses/by/4.0/).
Share and Cite
MDPI and ACS Style
Silva, E.; Fedel, M.; Deflorian, F.; Cotting, F.; Lins, V. Properties of Post-Consumer Polyethylene Terephthalate Coating Mechanically Deposited on Mild Steels. Coatings 2019, 9, 28. https://doi.org/10.3390/coatings9010028
AMA Style
Silva E, Fedel M, Deflorian F, Cotting F, Lins V. Properties of Post-Consumer Polyethylene Terephthalate Coating Mechanically Deposited on Mild Steels. Coatings. 2019; 9(1):28. https://doi.org/10.3390/coatings9010028
Chicago/Turabian StyleSilva, Elisângela, Michele Fedel, Flavio Deflorian, Fernando Cotting, and Vanessa Lins. 2019. "Properties of Post-Consumer Polyethylene Terephthalate Coating Mechanically Deposited on Mild Steels" Coatings 9, no. 1: 28. https://doi.org/10.3390/coatings9010028
Note that from the first issue of 2016, this journal uses article numbers instead of page numbers. See further details here.