Influence of the Geometric Parameters on the Deposition Mode in Spatial Atomic Layer Deposition: A Novel Approach to Area-Selective Deposition

 ,
,  and
and 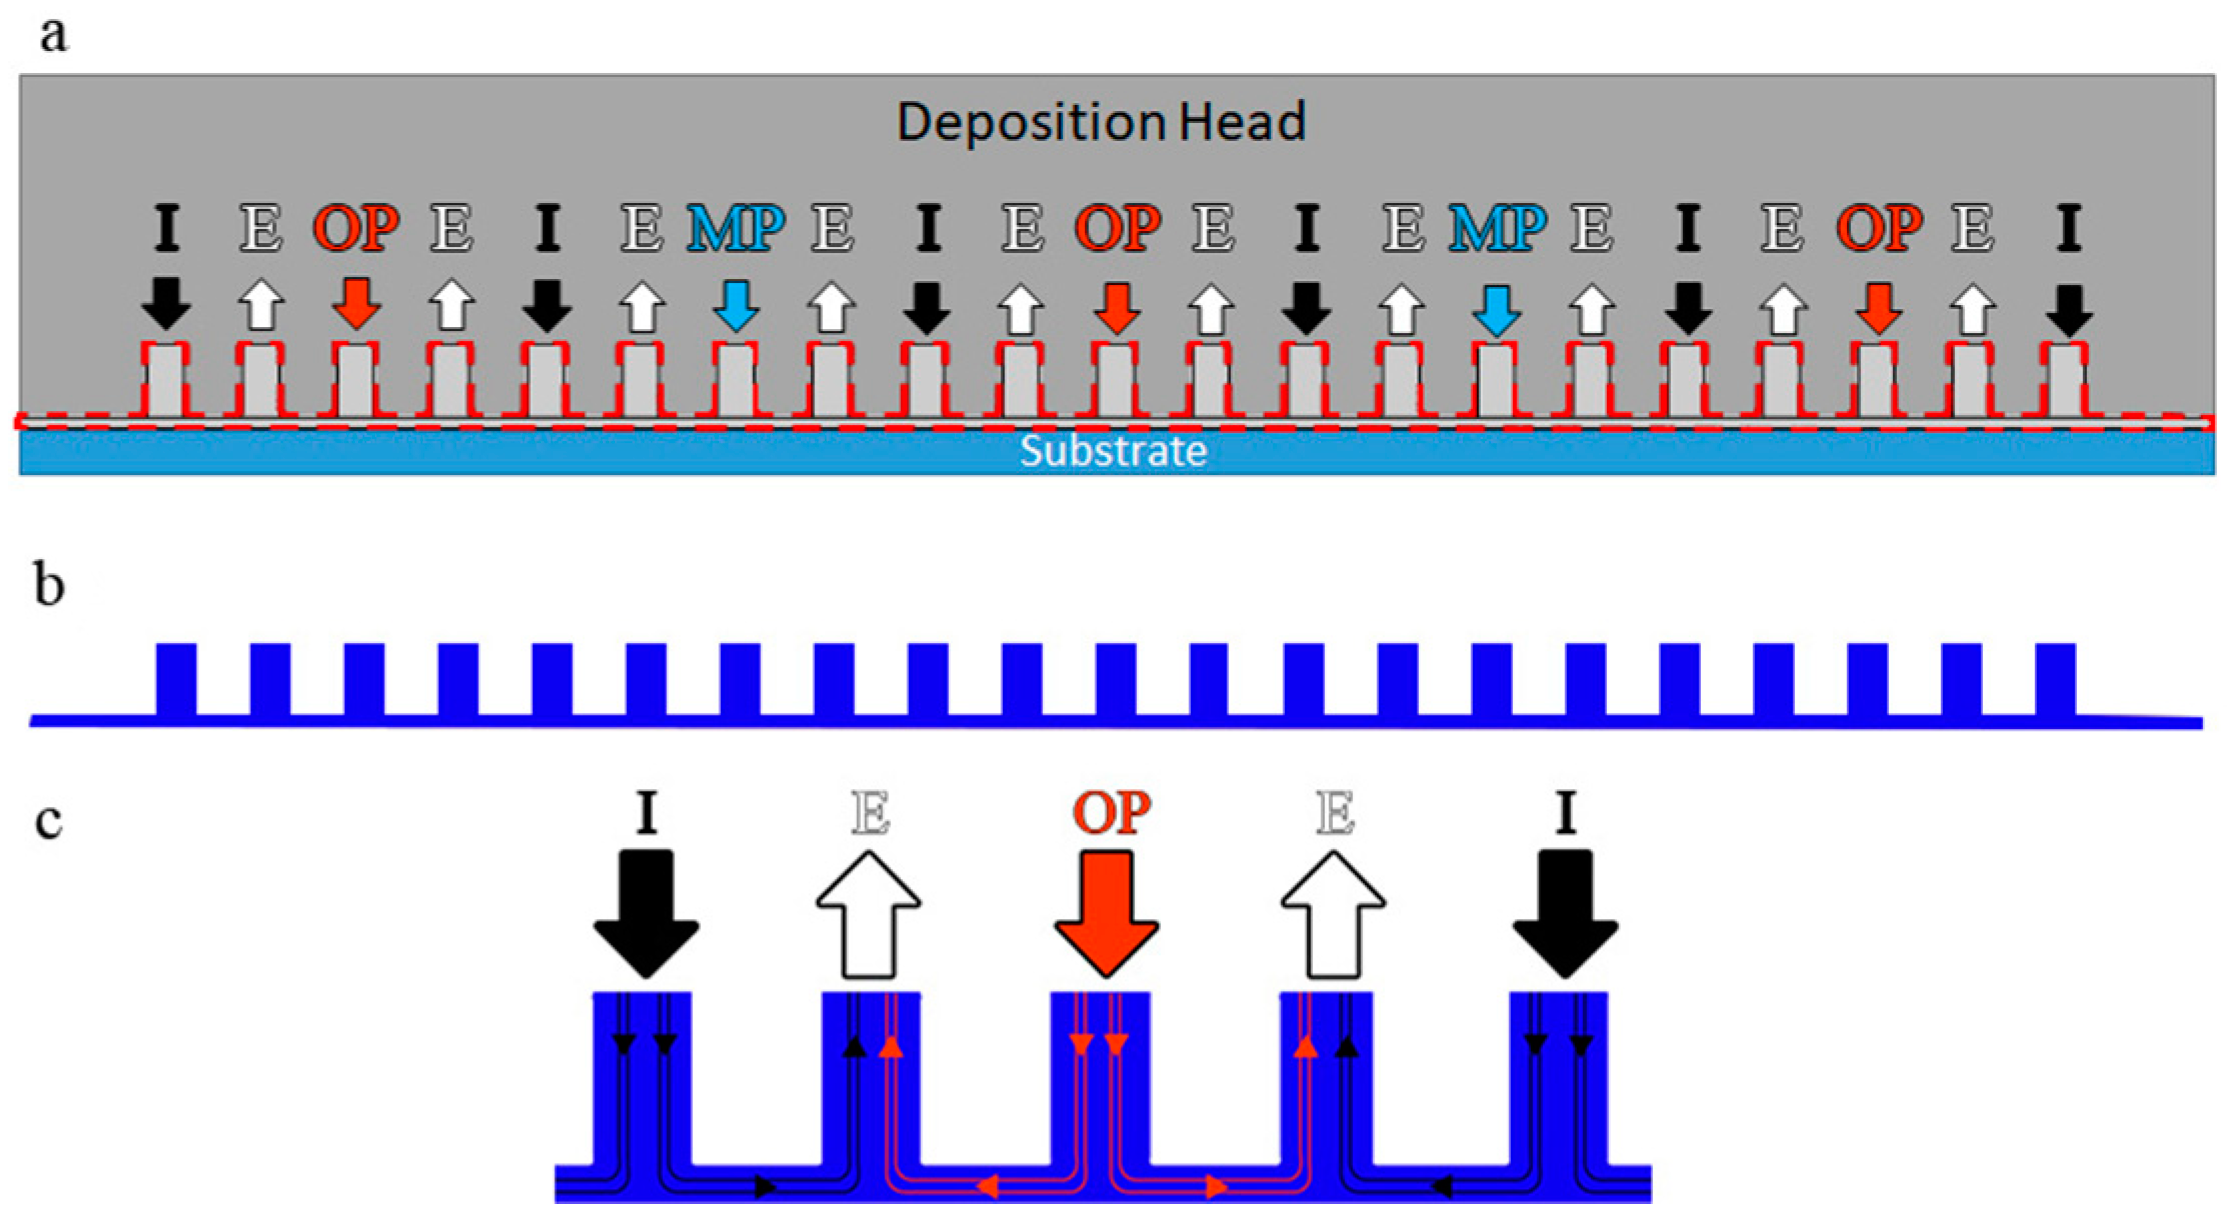
Abstract
:1. Introduction
2. Methods and Processes
3. Results and Discussion
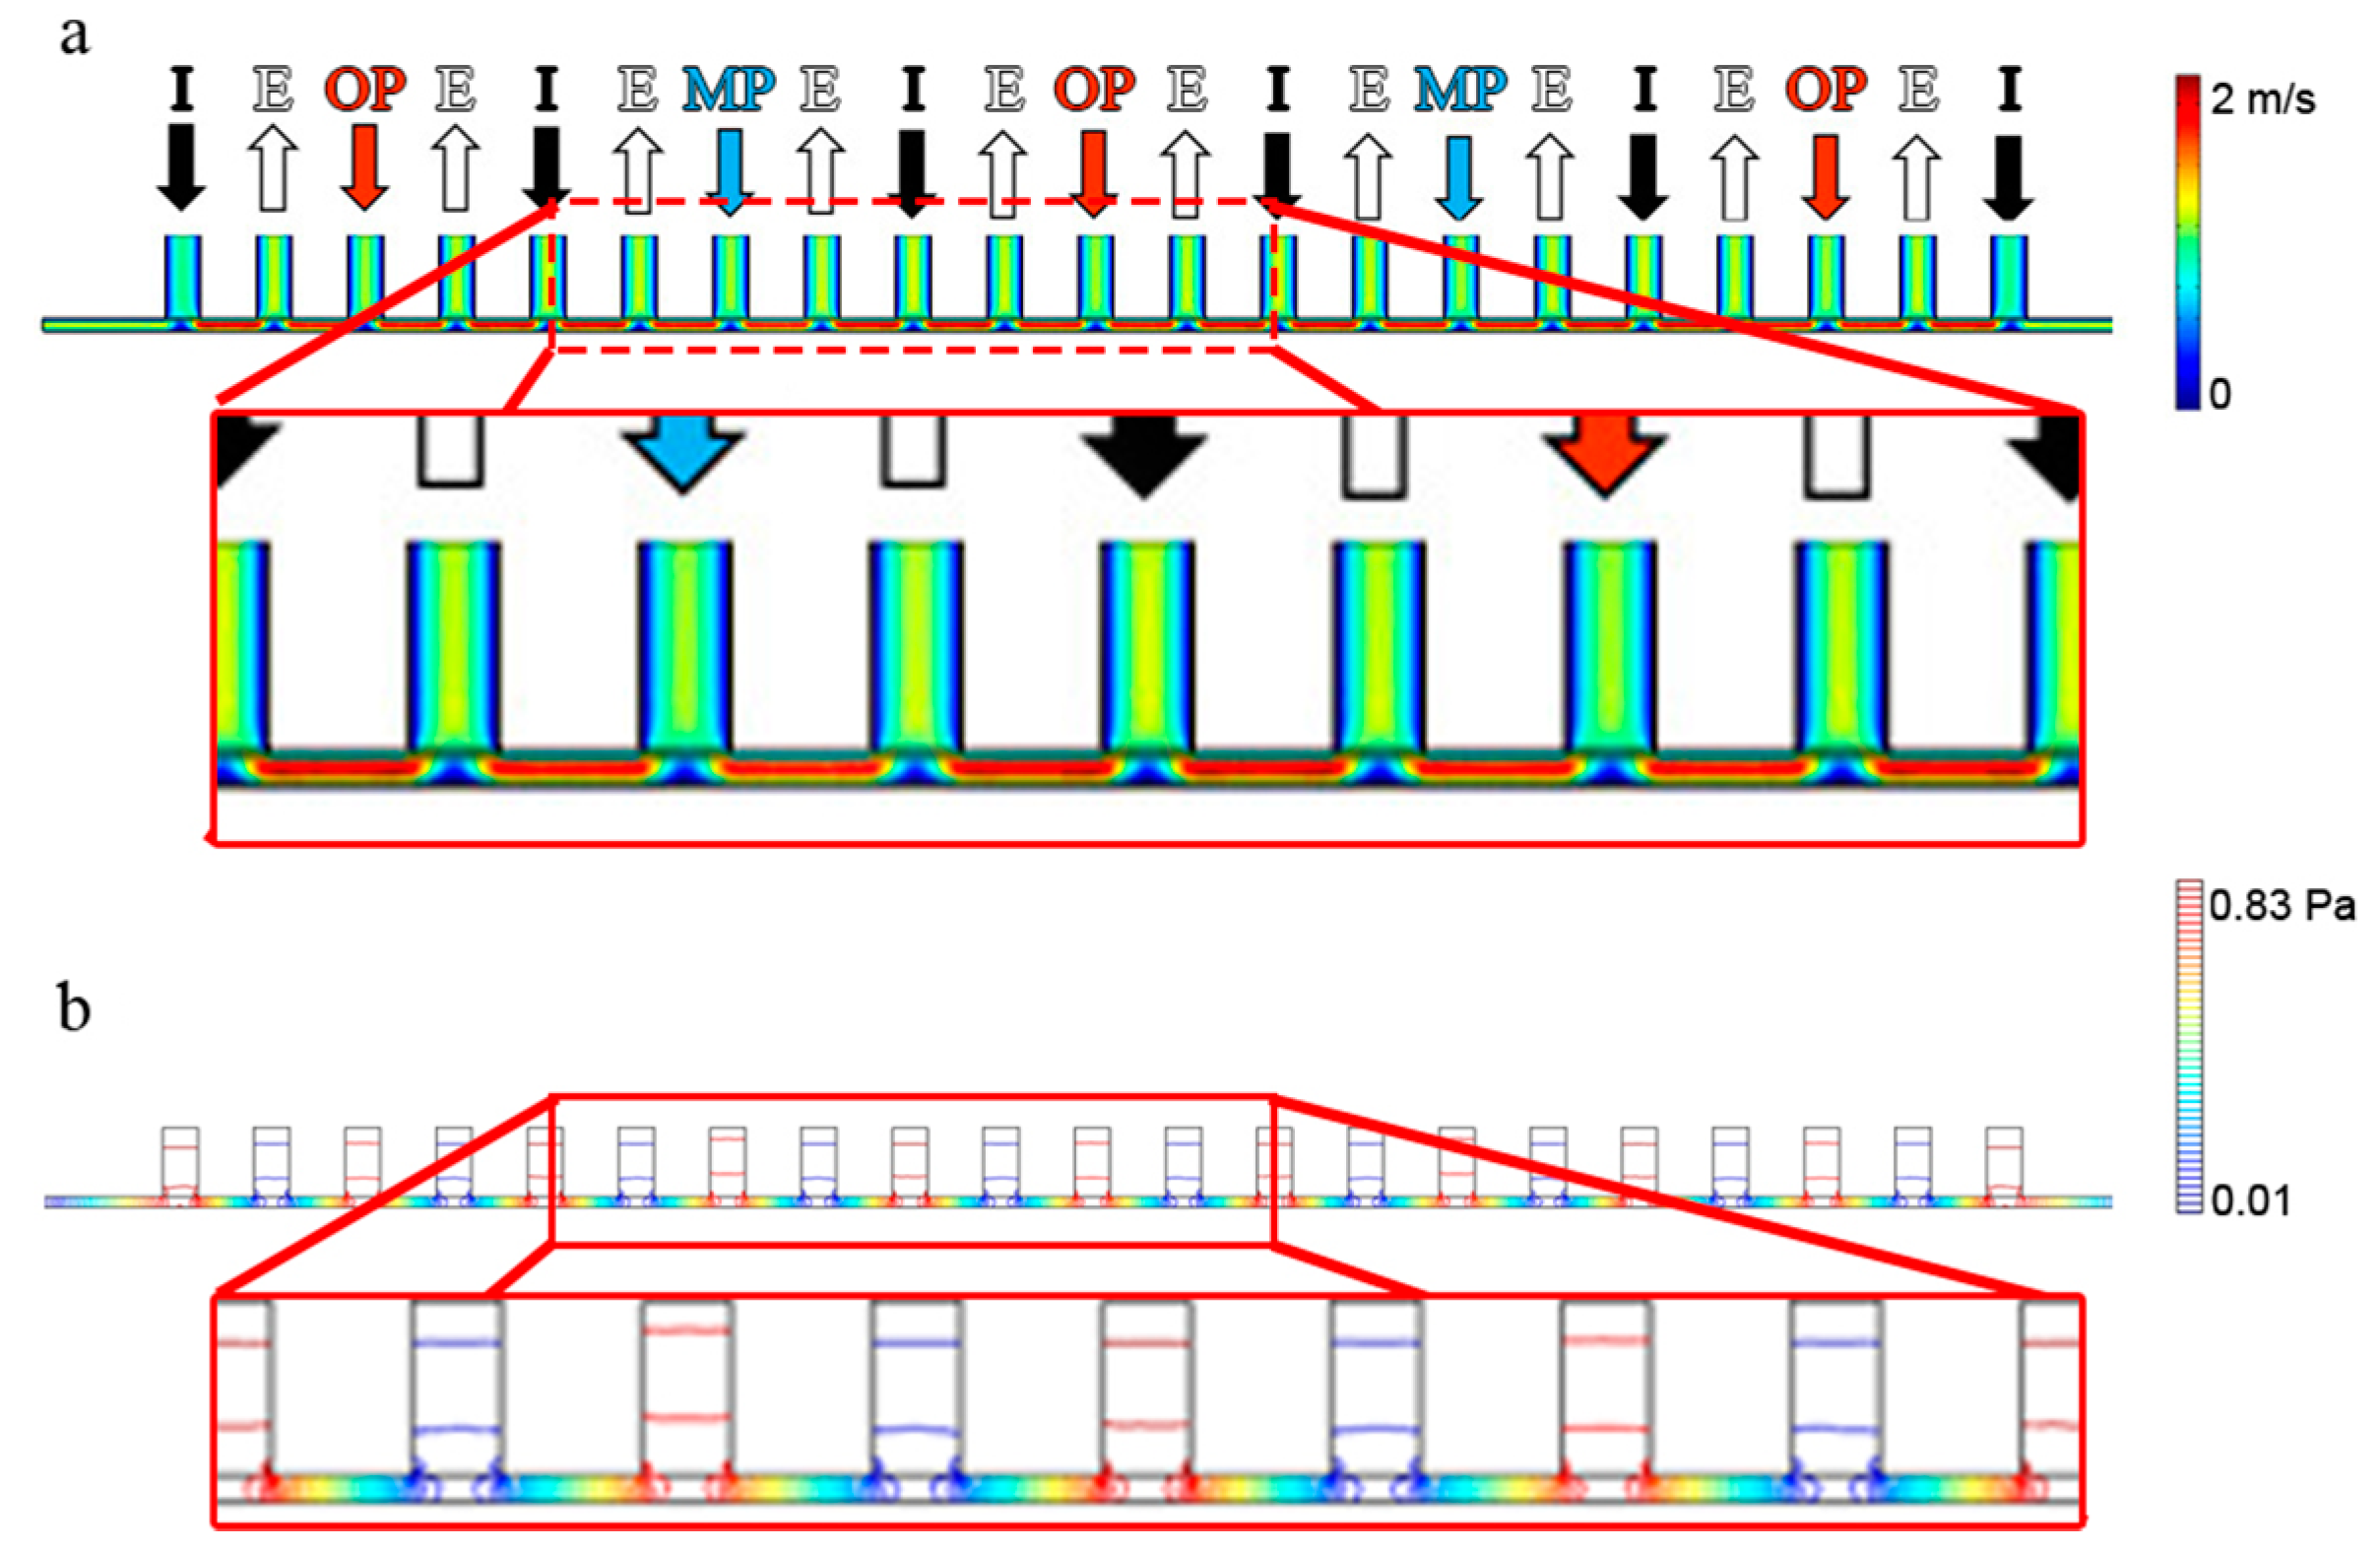
3.1. Evaluation of the Velocity Profile and Pressure in the Head-Substrate Gap
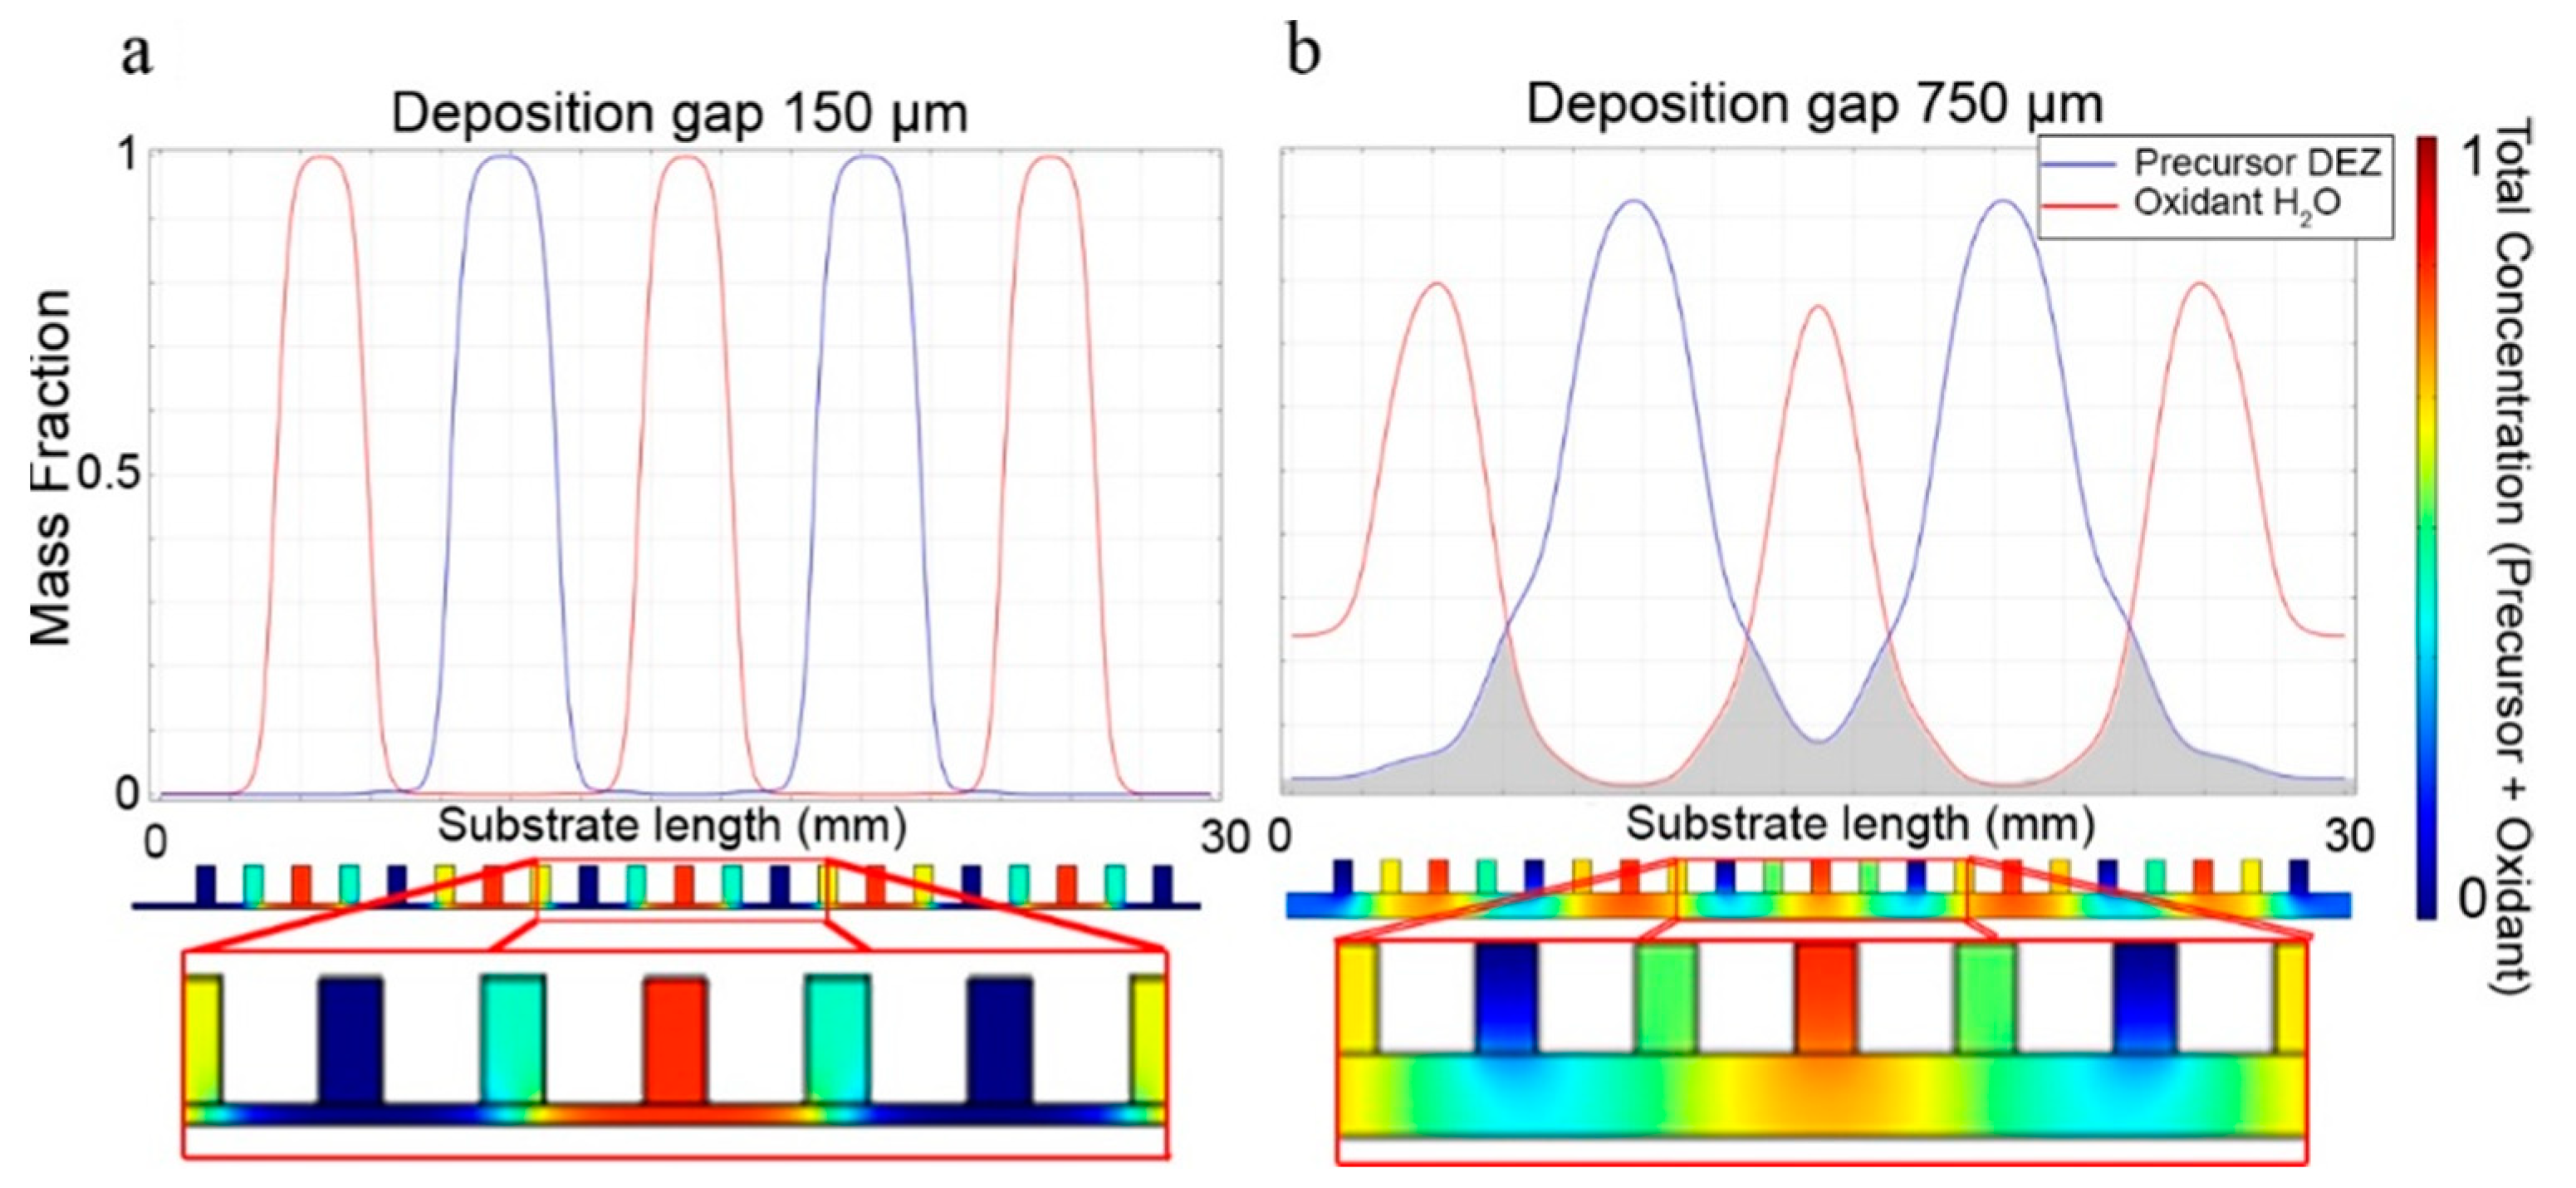
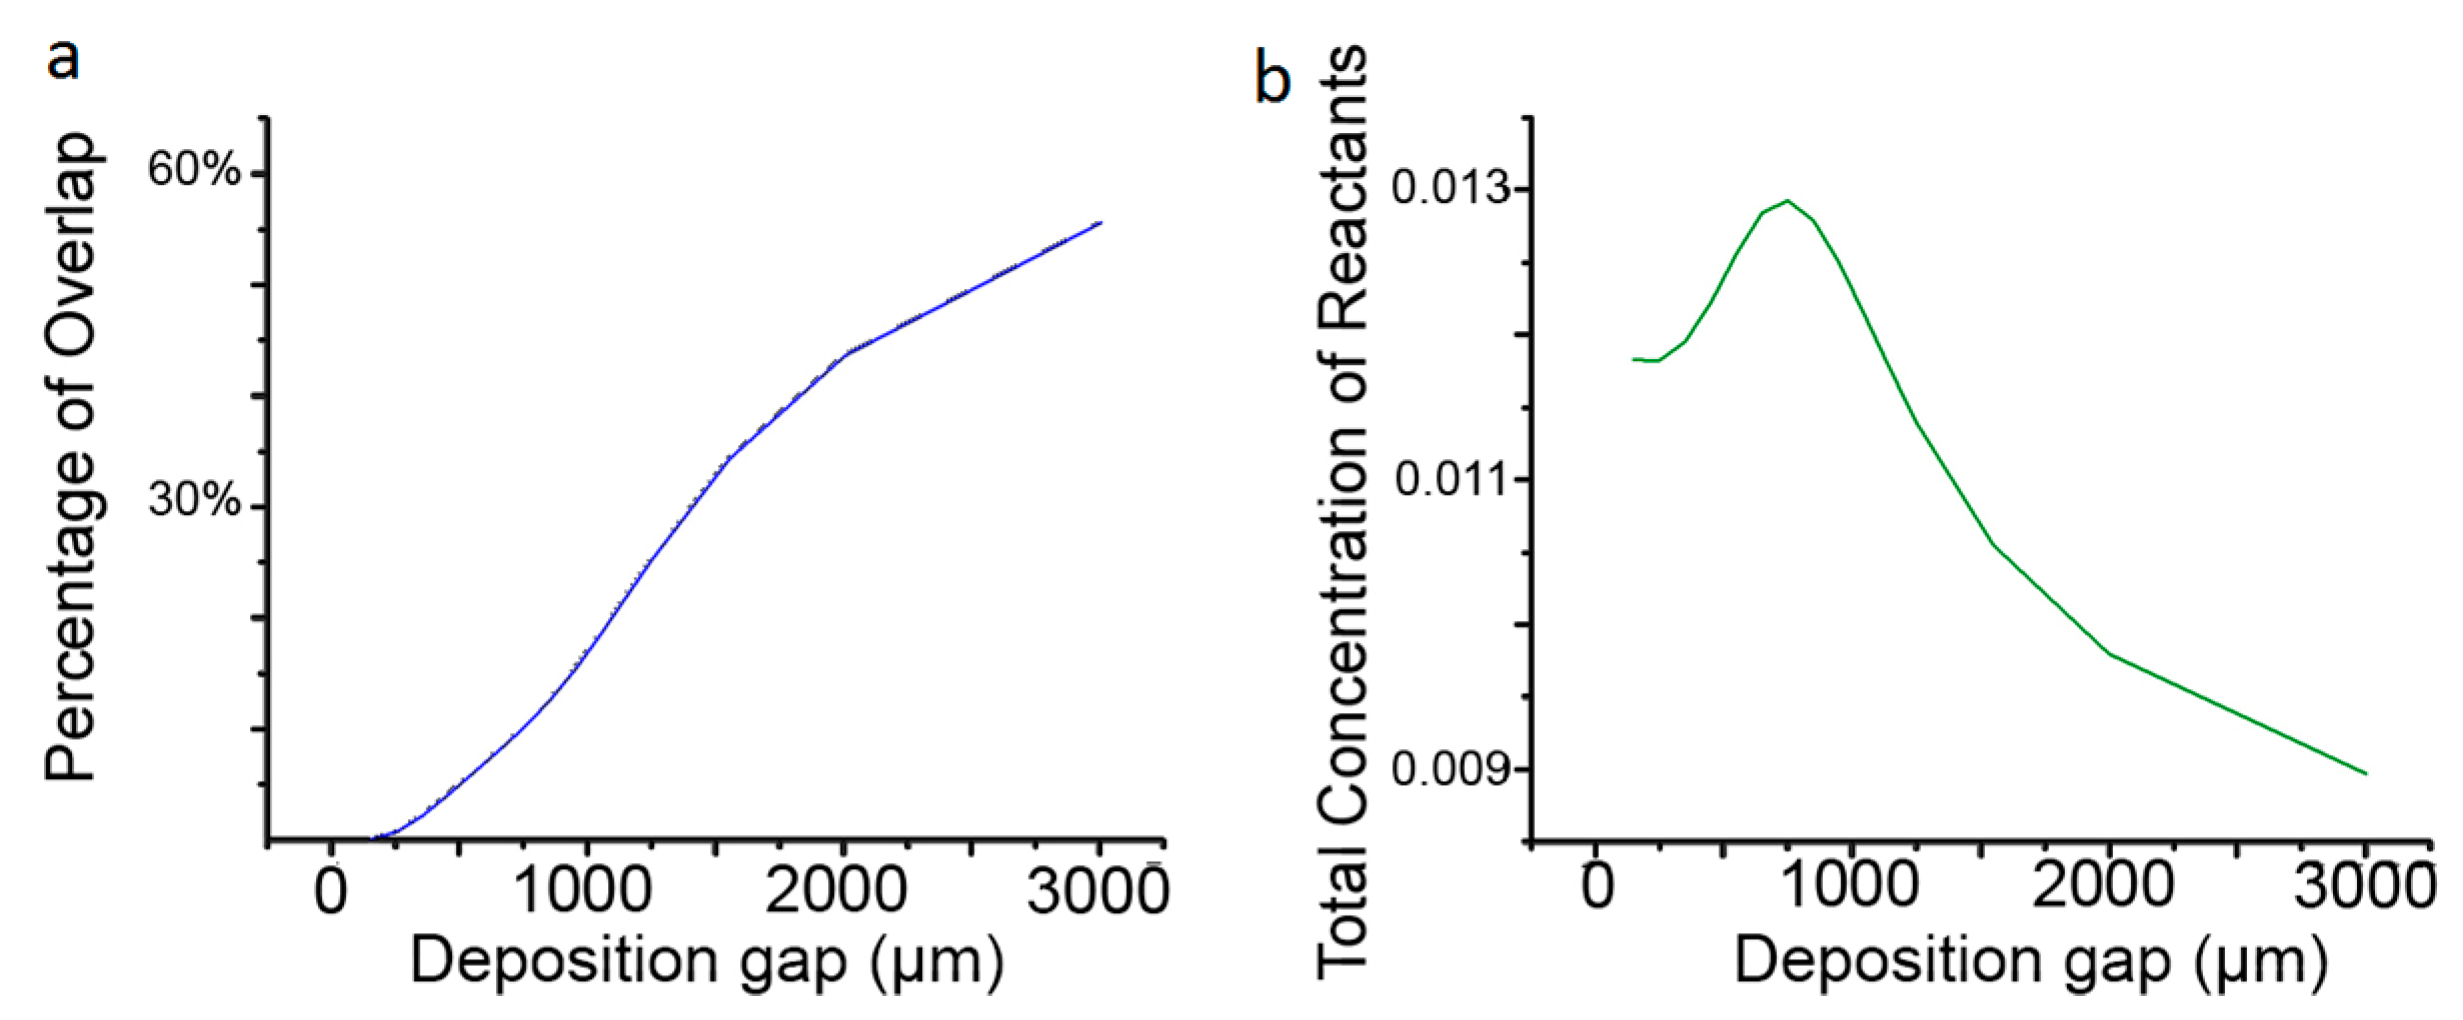
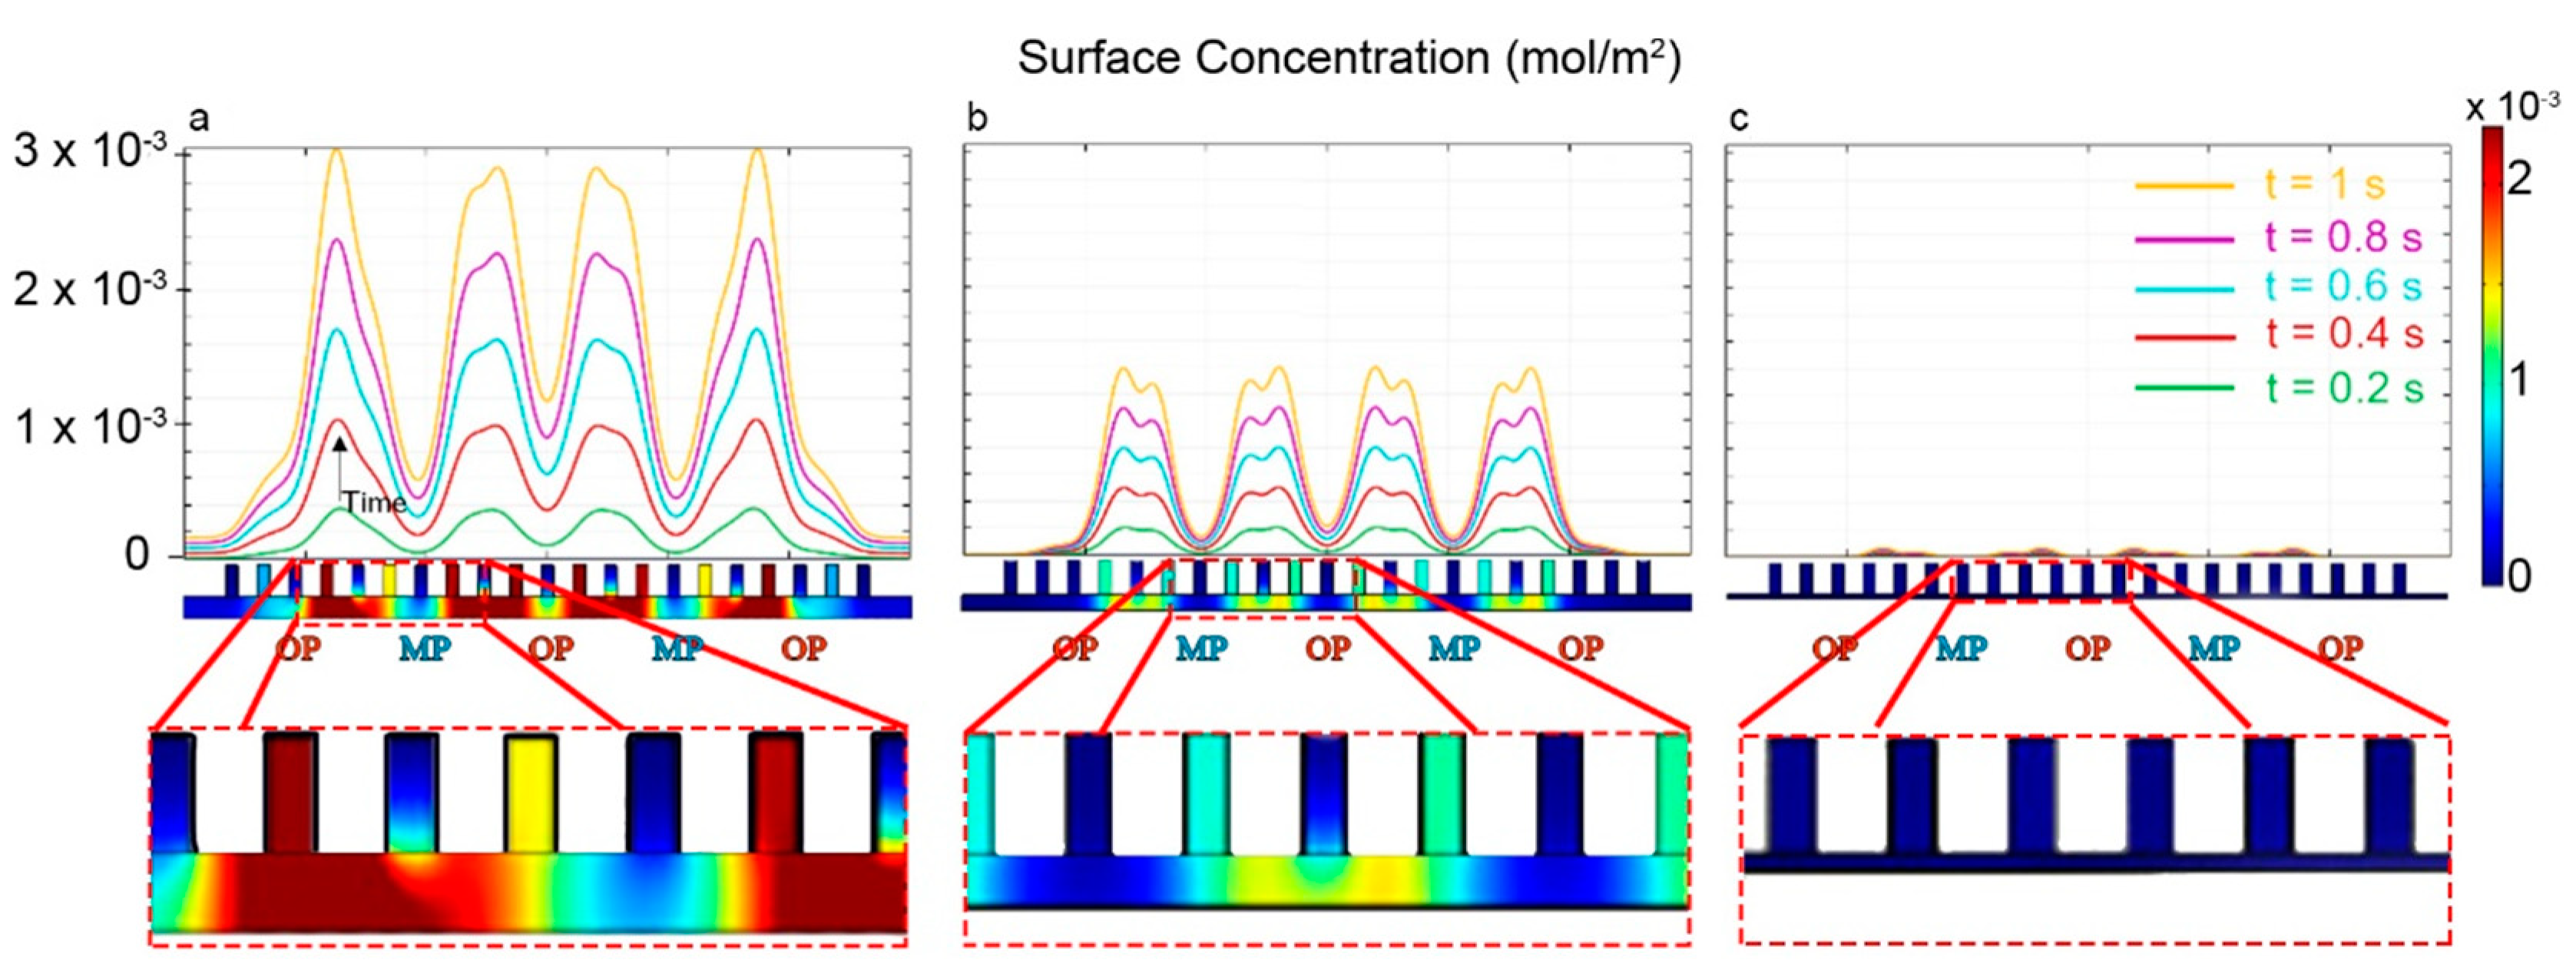
3.2. Study of the Effect of the Head-Substrate Deposition Gap on the Deposition Mode
Study of the CVD Mode as a Consequence of Precursor Crosstalk
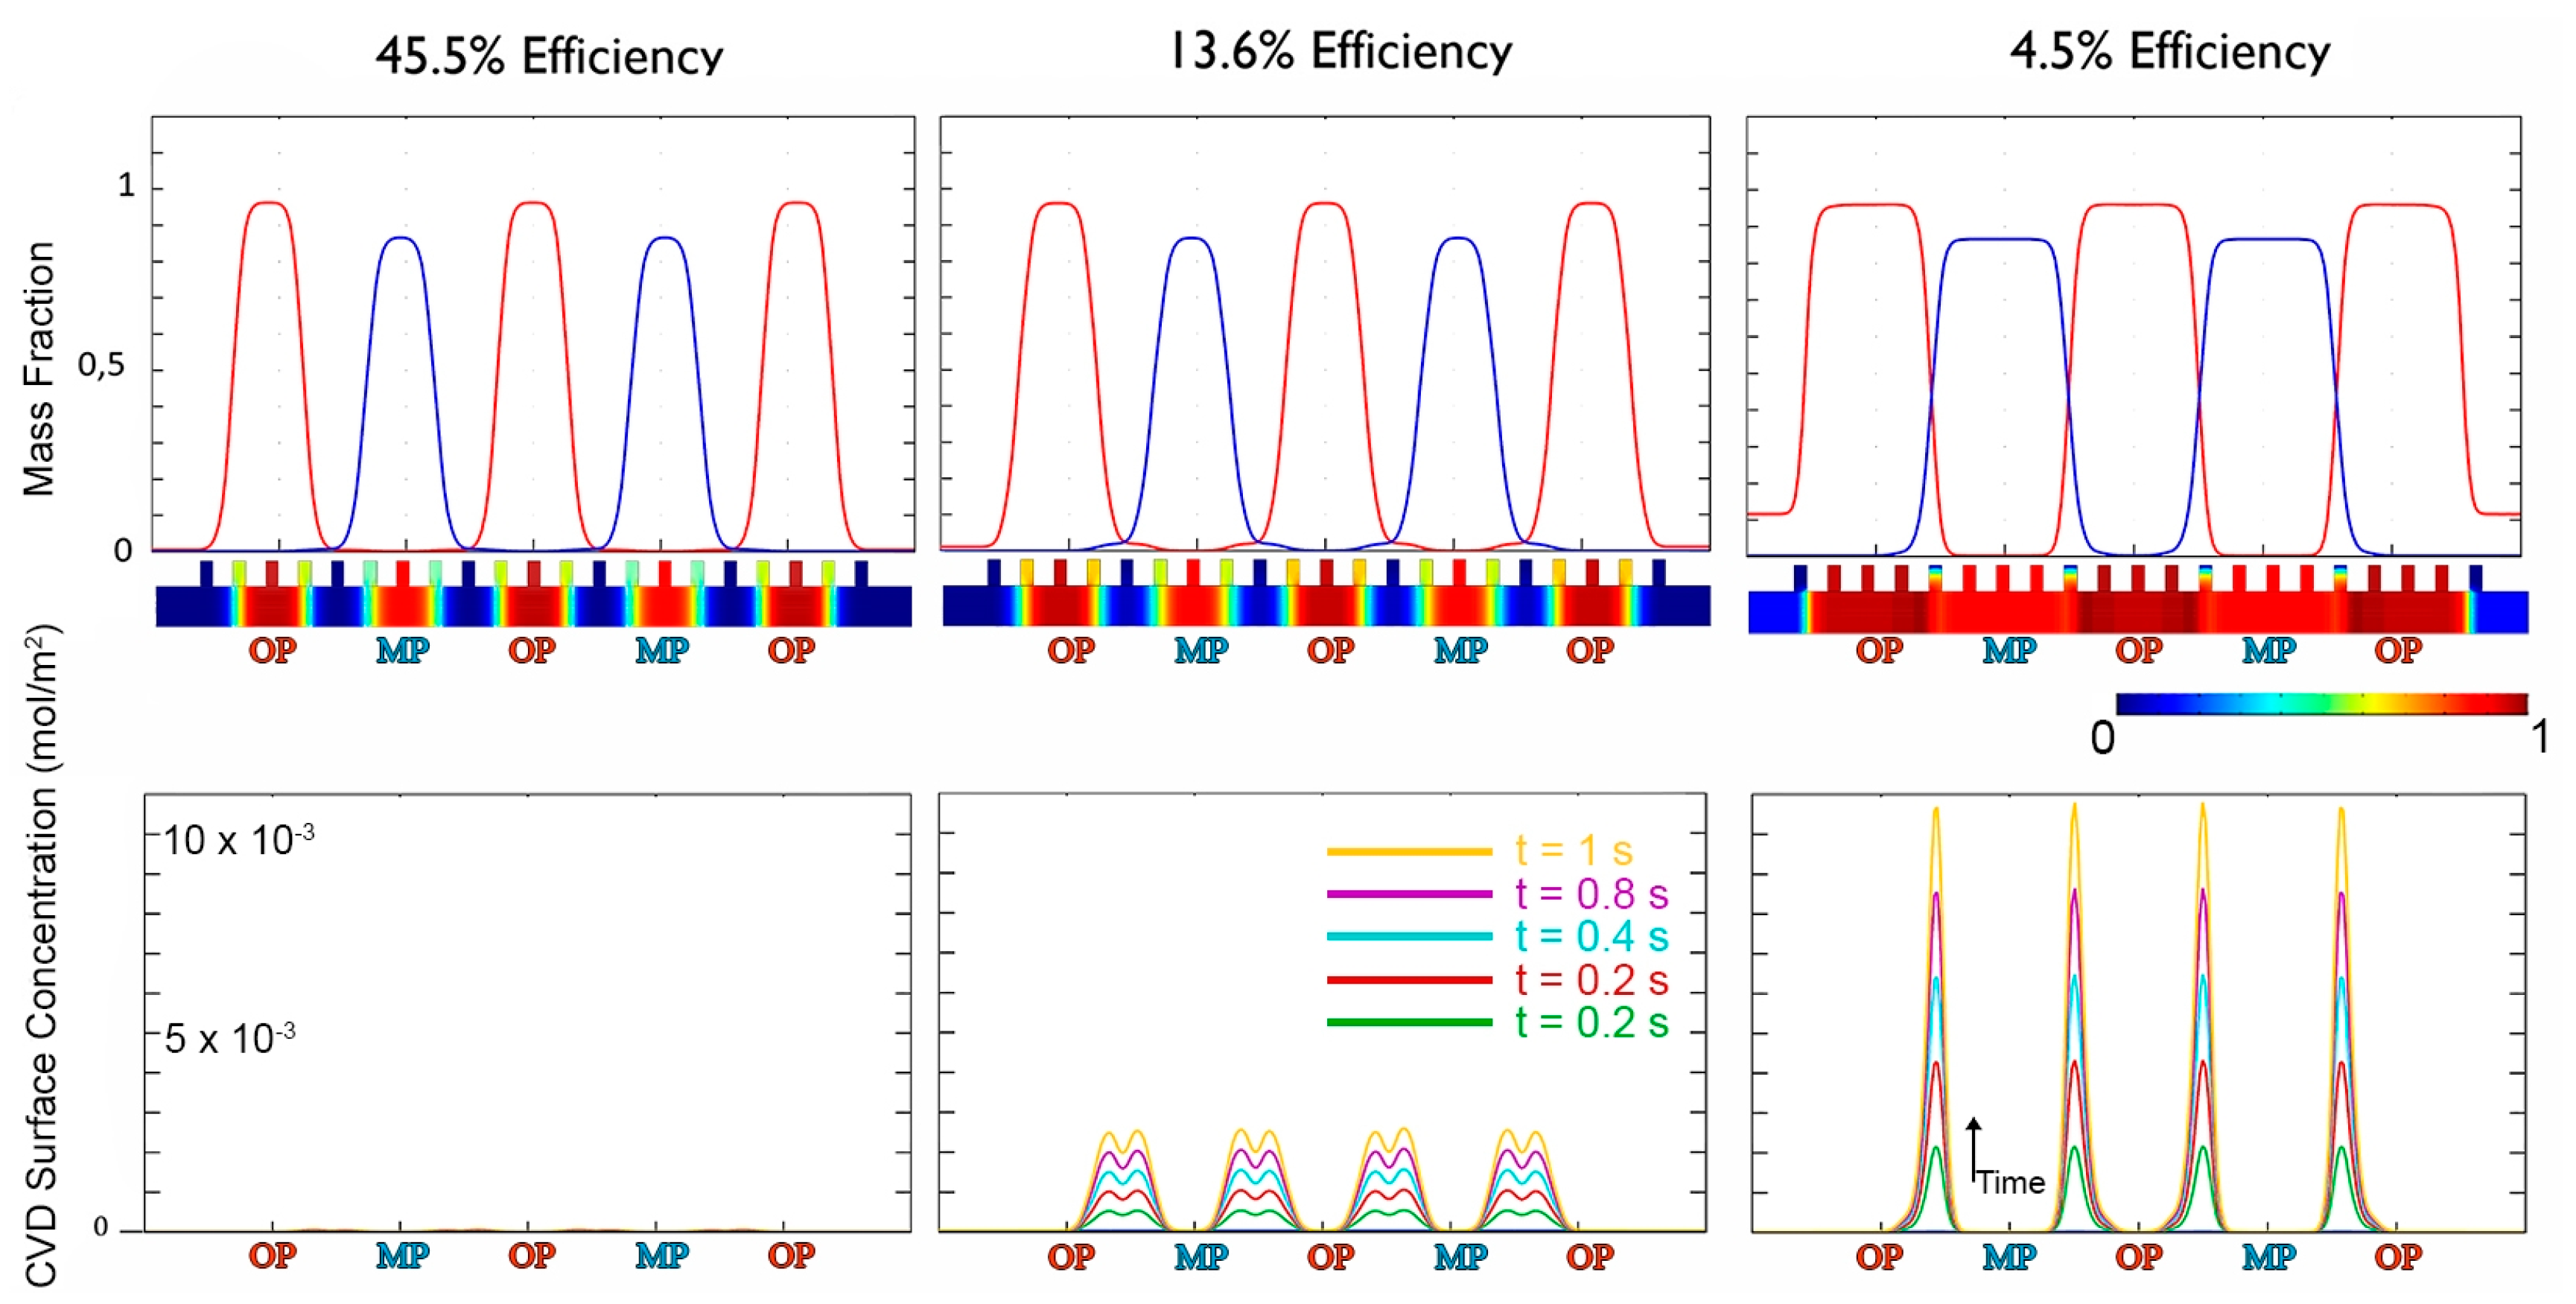
3.3. Efficiency of the Deposition System Exhaust
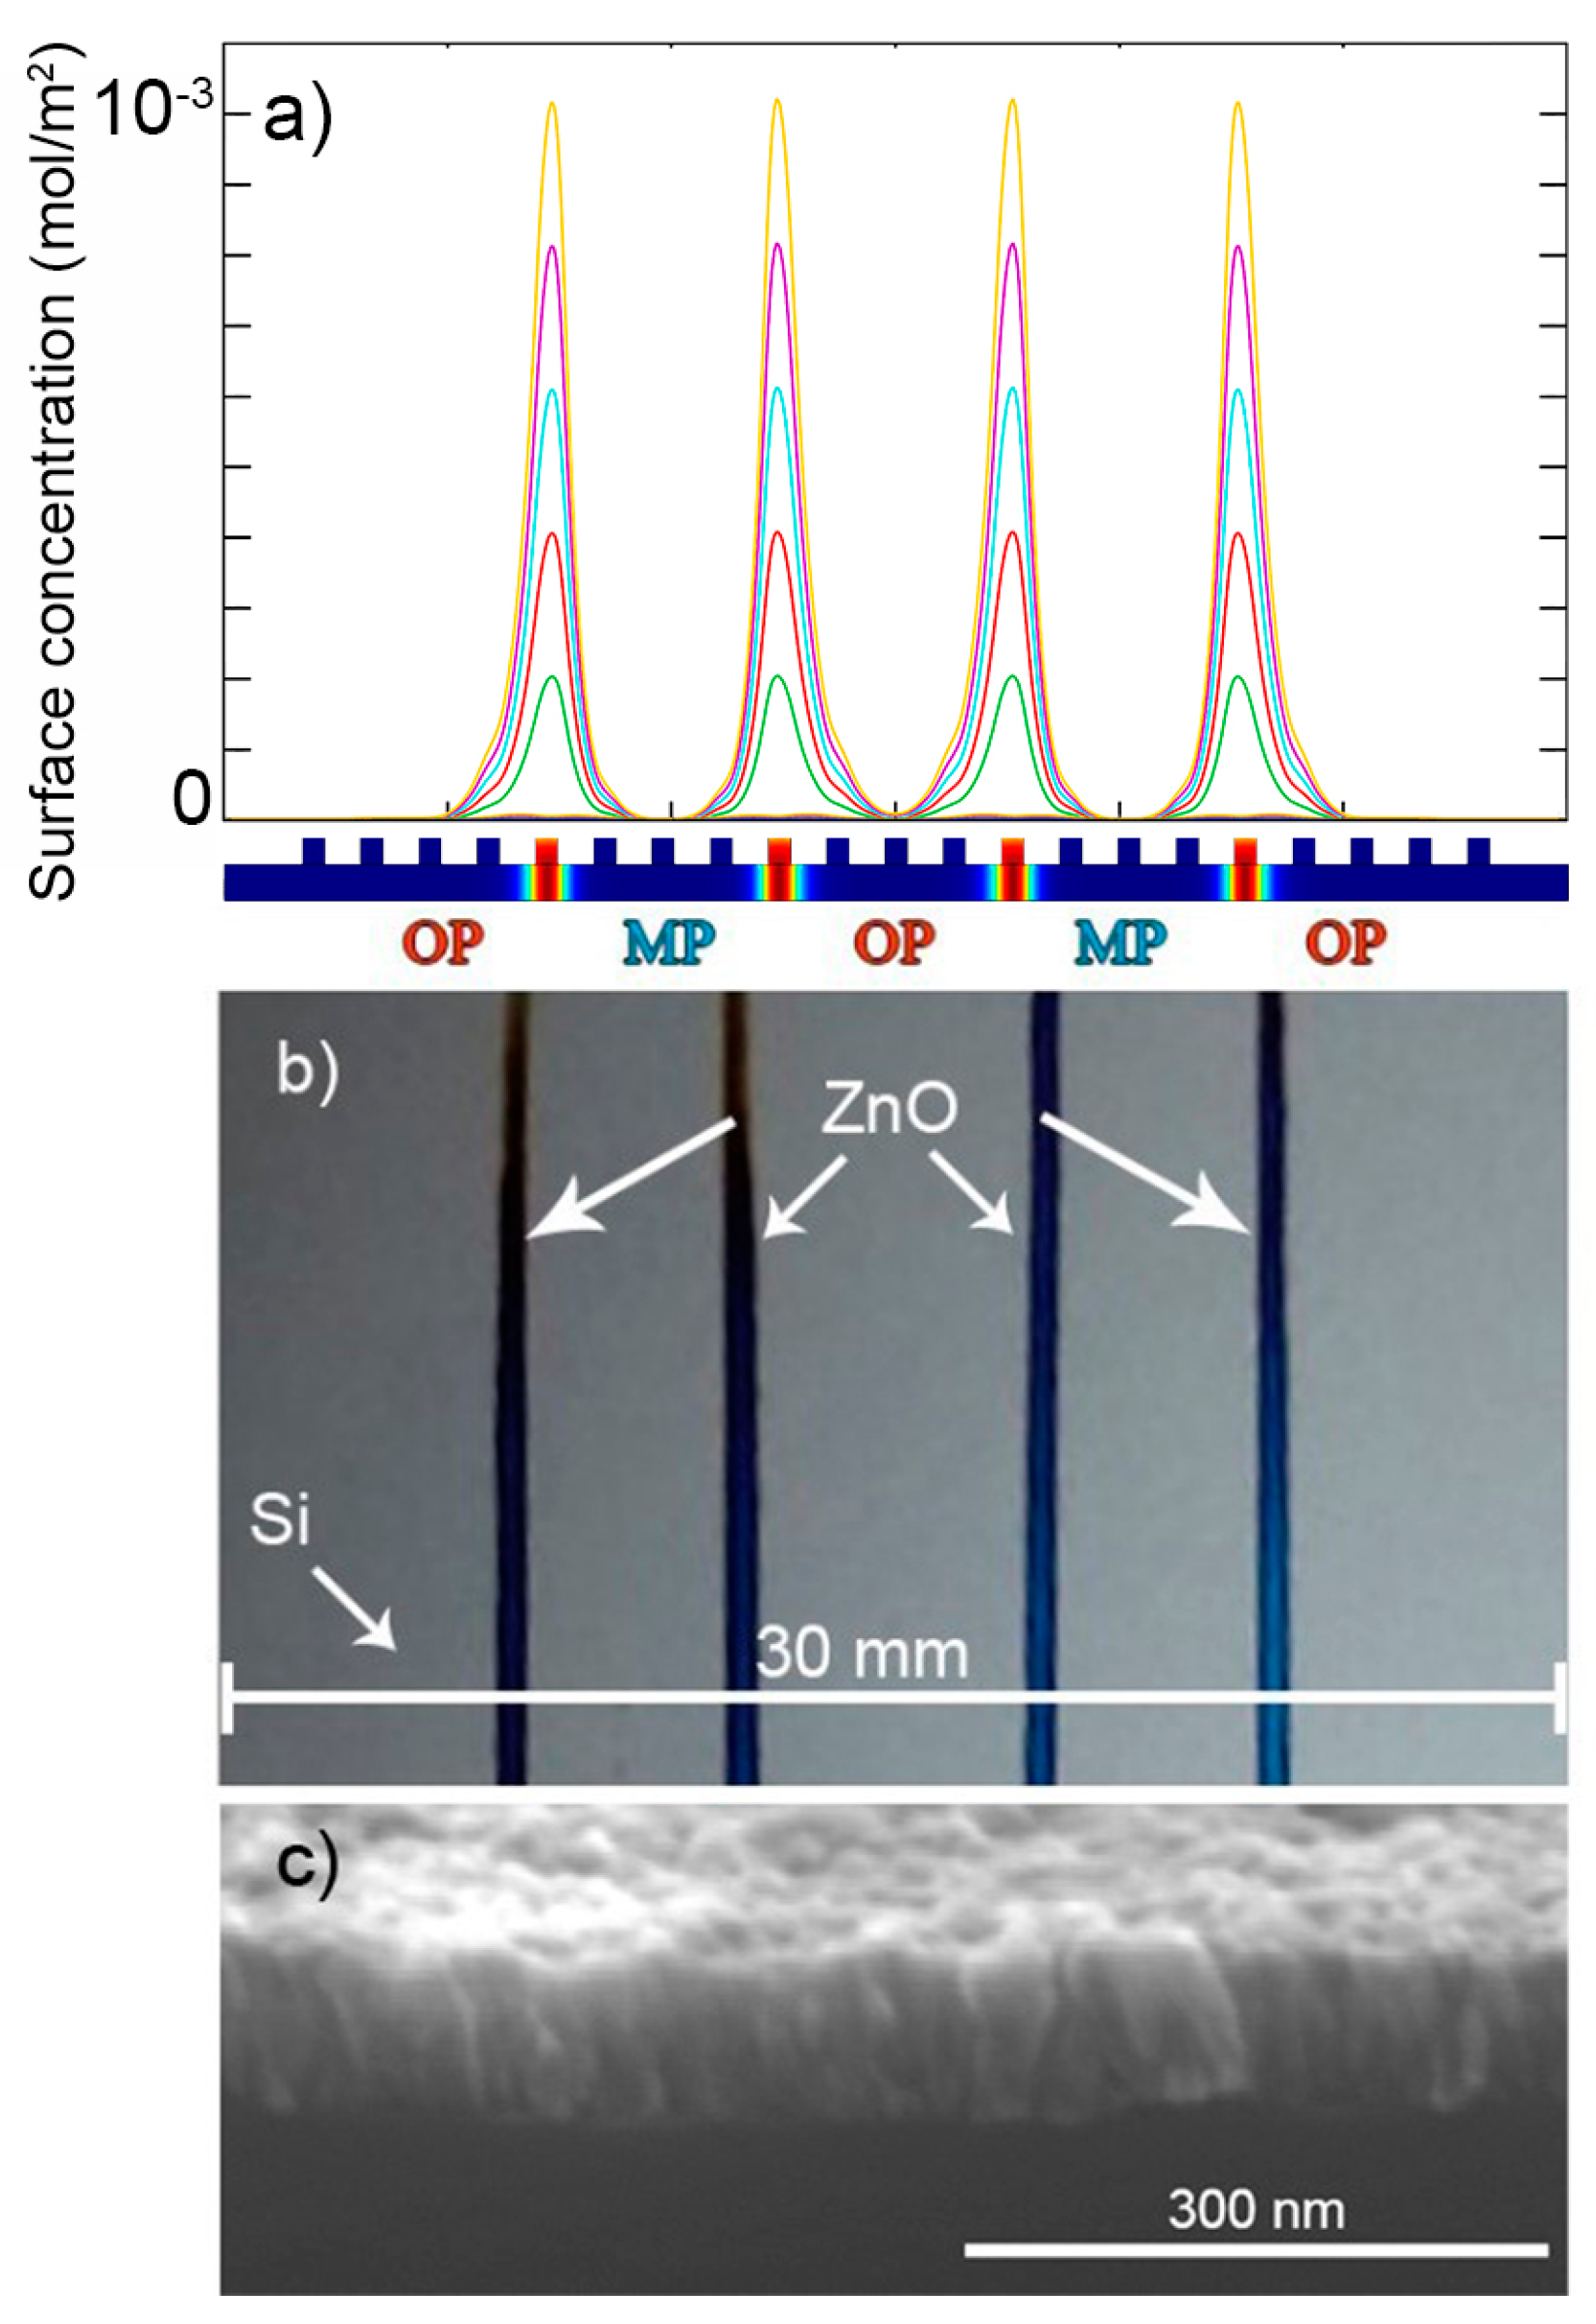
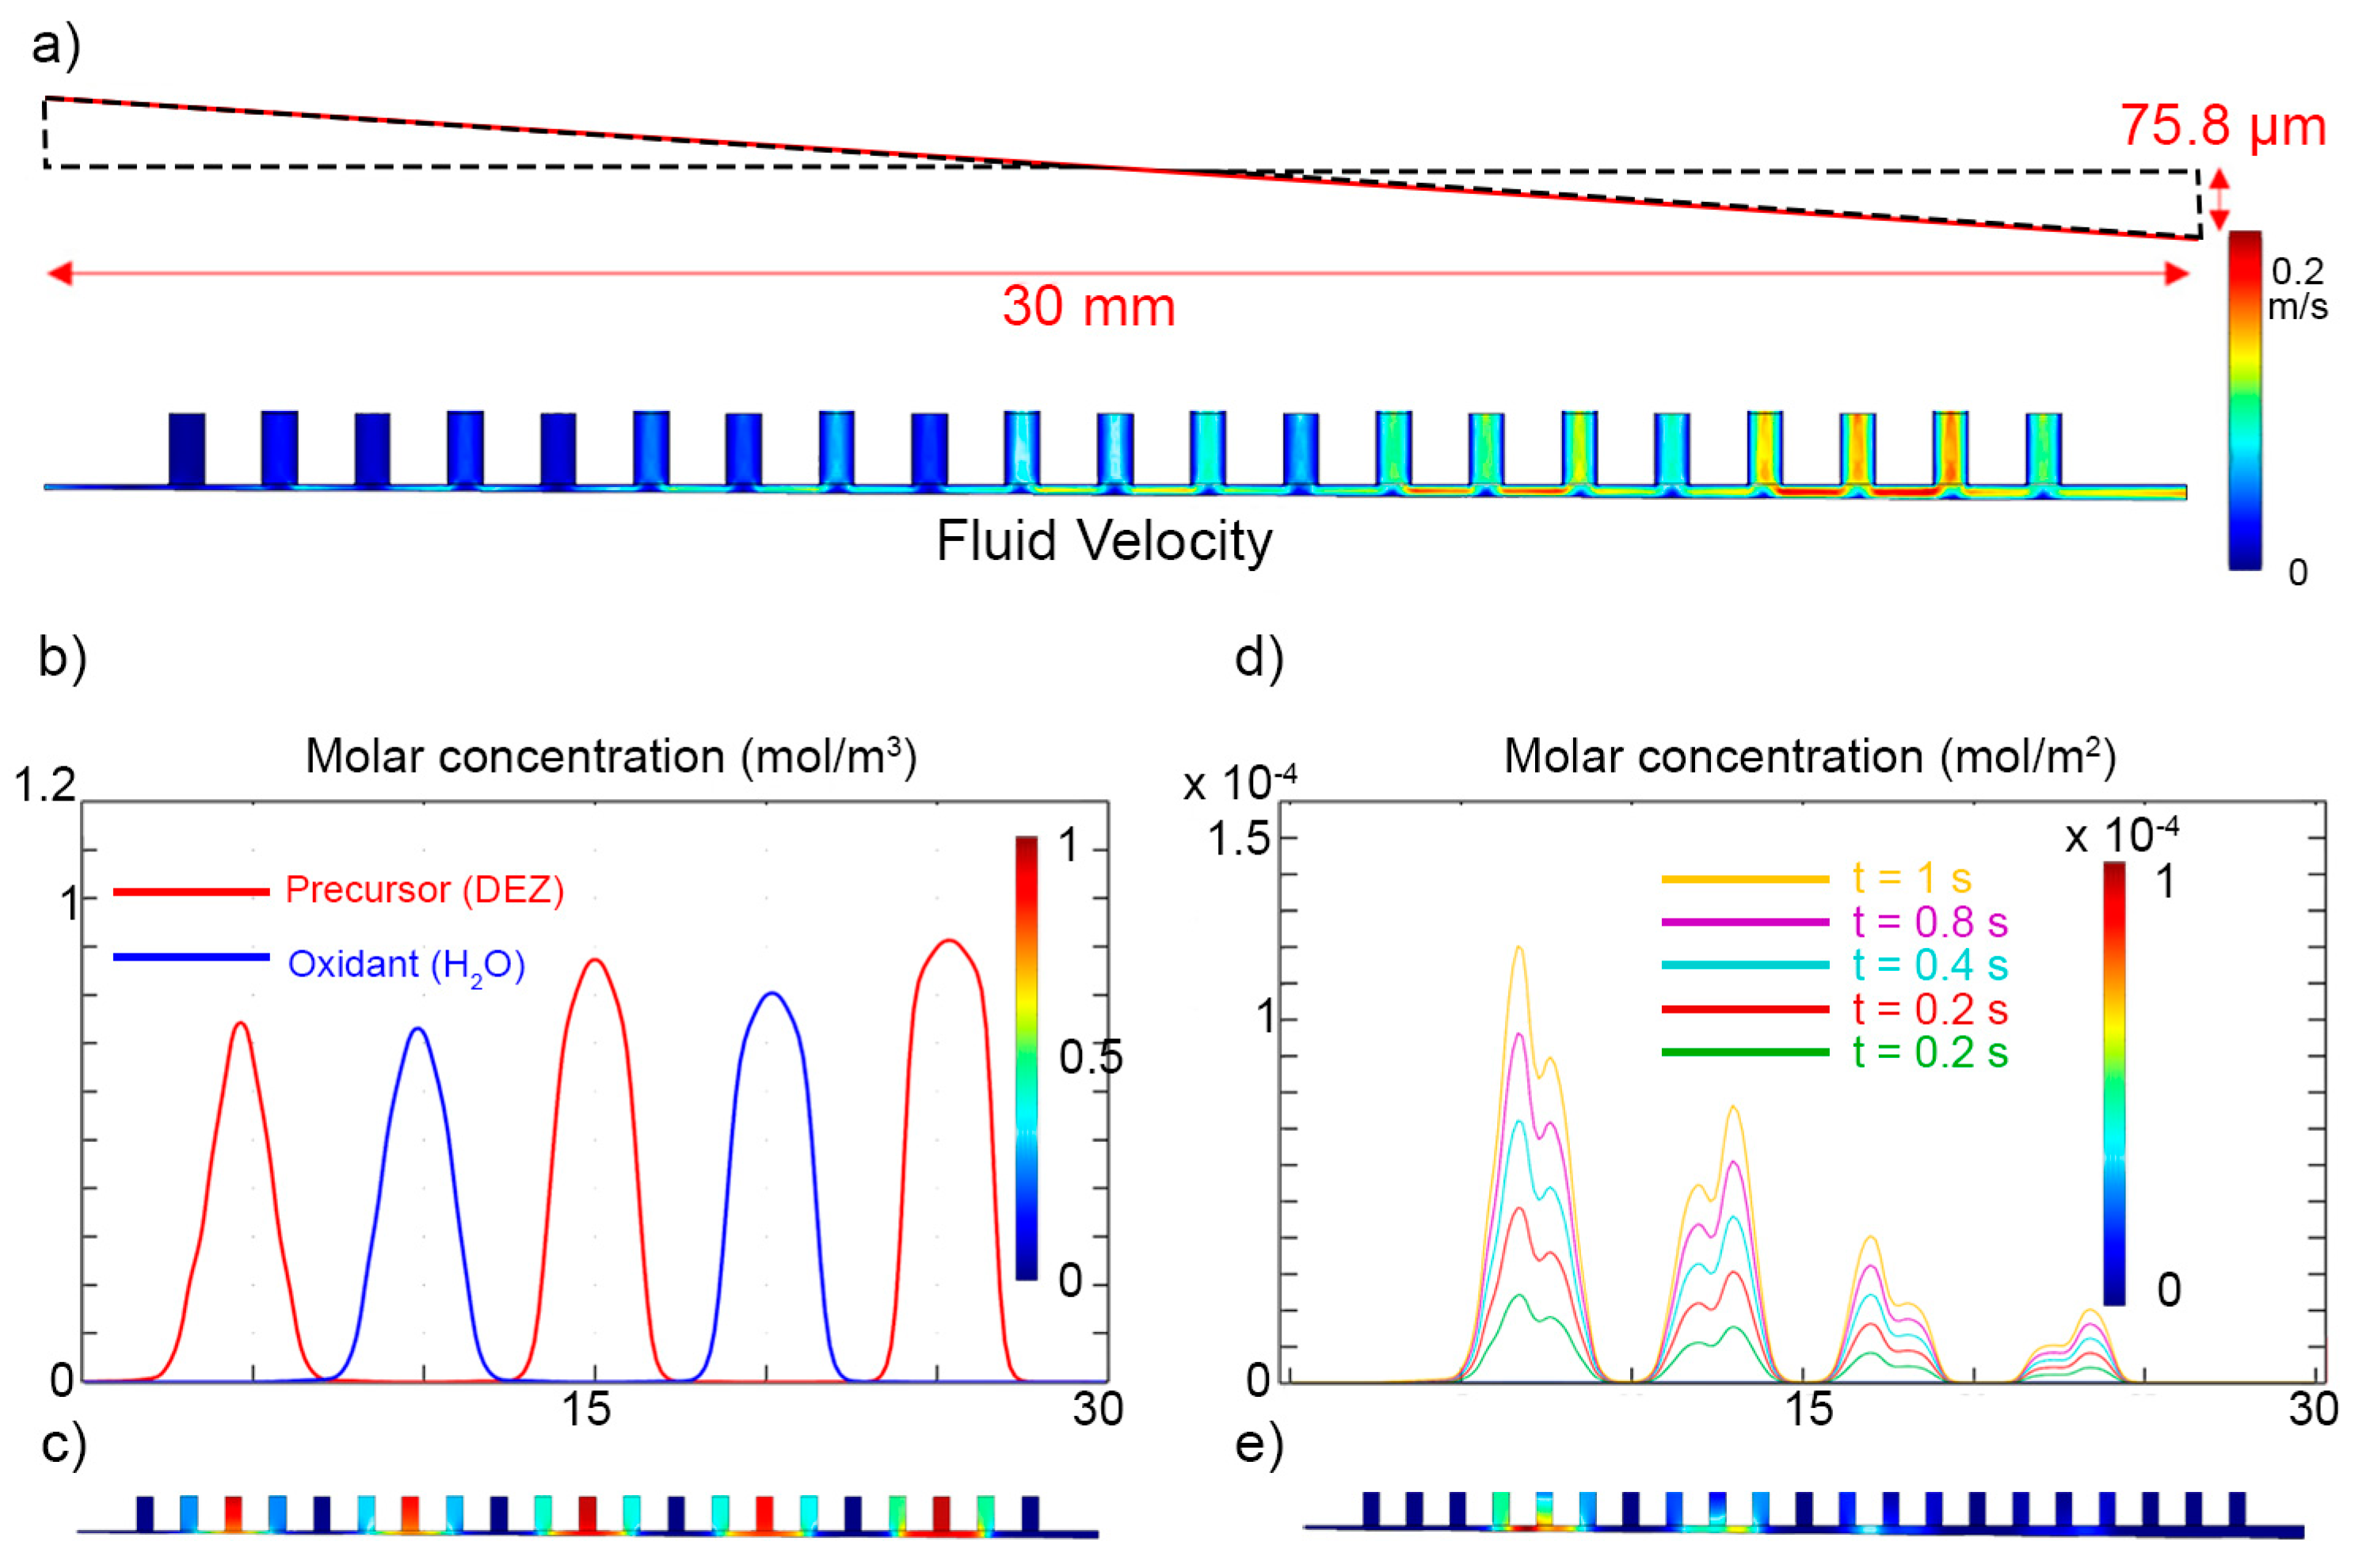
3.4. CVD Regime Influenced by a Tilt in the Deposition Gap
4. Conclusions
Author Contributions
Funding
Acknowledgments
Conflicts of Interest
References
- Johnson, R.W.; Hultqvist, A.; Bent, S.F. A brief review of atomic layer deposition: From fundamentals to applications. Mater. Today 2014, 17, 236–246. [Google Scholar] [CrossRef]
- Ahvenniemi, E.; Akbashev, A.R.; Ali, S.; Bechelany, M.; Berdova, M.; Boyadjiev, S.; Cameron, D.C.; Chen, R.; Chubarov, M.; Cremers, V.; et al. Review Article: Recommended reading list of early publications on atomic layer deposition—Outcome of the “Virtual Project on the History of ALD”. J. Vac. Sci. Technol. A 2017, 35, 010801. [Google Scholar] [CrossRef] [Green Version]
- Muñoz-Rojas, D.; MacManus-Driscoll, J. Spatial atmospheric atomic layer deposition: A new laboratory and industrial tool for low-cost photovoltaics. Mater. Horiz. 2014, 1, 314–320. [Google Scholar] [CrossRef]
- Muñoz-Rojas, D.; Nguyen, V.H.; de la Huerta, C.M.; Aghazadehchors, S.; Jiménez, C.; Bellet, D. Spatial atomic layer deposition (SALD), an emerging tool for energy materials. Application to new-generation photovoltaic devices and transparent conductive materials. Comptes Rendus Phys. 2017, 18, 391–400. [Google Scholar] [CrossRef]
- Levy, D.H.; Freeman, D.; Nelson, S.F.; Cowdery-Corvan, P.J.; Irving, L.M. Stable ZnO thin film transistors by fast open air atomic layer deposition. Appl. Phys. Lett. 2008, 92, 192101. [Google Scholar] [CrossRef]
- Nelson, S.F.; Ellinger, C.R.; Levy, D.H. Improving yield and performance in ZnO thin-film transistors made using selective area deposition. ACS Appl. Mater. Interfaces 2015, 7, 2754–2759. [Google Scholar] [CrossRef] [PubMed]
- Nguyen, V.H.; Gottlieb, U.; Valla, A.; Muñoz, D.; Bellet, D.; Muñoz-Rojas, D. Electron tunneling through grain boundaries in transparent conductive oxides and implications for electrical conductivity: The case of ZnO:Al thin films. Mater. Horiz. 2018, 5, 715–726. [Google Scholar] [CrossRef]
- Choi, H.; Shin, S.; Jeon, H.; Choi, Y.; Kim, J.; Kim, S.; Chung, S.C.; Oh, K. Fast spatial atomic layer deposition of Al2O3 at low temperature (<100 °C) as a gas permeation barrier for flexible organic light-emitting diode displays. J. Vac. Sci. Technol. A 2016, 34, 01A121. [Google Scholar] [CrossRef]
- Poodt, P.; Lankhorst, A.; Roozeboom, F.; Spee, K.; Maas, D.; Vermeer, A. High-speed spatial atomic-layer deposition of aluminum oxide layers for solar cell passivation. Adv. Mater. 2010, 22, 3564–3567. [Google Scholar] [CrossRef] [PubMed]
- Franke, S.; Baumkötter, M.; Monka, C.; Raabe, S.; Caspary, R.; Johannes, H.H.; Kowalsky, W.; Beck, S.; Pucci, A.; Gargouri, H. Alumina films as gas barrier layers grown by spatial atomic layer deposition with trimethylaluminum and different oxygen sources. J. Vac. Sci. Technol. A 2016, 35, 01B117. [Google Scholar] [CrossRef]
- Muñoz-Rojas, D.; Jordan, M.; Yeoh, C.; Marin, A.T.; Kursumovic, A.; Dunlop, L.; Iza, D.C.; Chen, A.; Wang, H.; MacManus-driscoll, J.L. Growth of ∼5 cm2 V−1 s−1 mobility, p-type Copper (I) oxide (Cu2O) films by fast atmospheric atomic layer deposition (AALD) at 225 °C and below. AIP Adv. 2012, 2, 042179. [Google Scholar] [CrossRef]
- Poodt, P.; Knaapen, R.; Illiberi, A.; Roozeboom, F.; van Asten, A. Low temperature and roll-to-roll spatial atomic layer deposition for flexible electronics. J. Vac. Sci. Technol. A 2012, 30, 01A142. [Google Scholar] [CrossRef]
- Levy, D.H. Process for Atomic Layer Deposition. US Patent 7,413,982 B2, 19 August 2008. [Google Scholar]
- Hoye, R.L.; Muñoz-Rojas, D.; Musselman, K.P.; Vaynzof, Y.; MacManus-Driscoll, J.L. Synthesis and modeling of uniform complex metal oxides by close-proximity atmospheric pressure chemical vapor deposition. ACS Appl. Mater. Interfaces 2015, 7, 10684–10694. [Google Scholar] [CrossRef] [PubMed]
- Deng, Z.; He, W.; Duan, C.; Chen, R.; Shan, B. Mechanistic modeling study on process optimization and precursor utilization with atmospheric spatial atomic layer deposition. J. Vac. Sci. Technol. A 2015, 34, 01A108. [Google Scholar] [CrossRef]
- Van Deelen, J.; Illiberi, A.; Kniknie, B.; Steijvers, H.; Lankhorst, A.; Simons, P. APCVD of ZnO:Al, insight and control by modeling. Surf. Coat. Technol. 2013, 230, 239–244. [Google Scholar] [CrossRef] [Green Version]
- Pan, D.; Jen, T.C.; Yuan, C. Effects of gap size, temperature and pumping pressure on the fluid dynamics and chemical kinetics of in-line spatial atomic layer deposition of Al2O3. Int. J. Heat Mass Transf. 2016, 96, 189–198. [Google Scholar] [CrossRef]
- Dobkin, D.M.; Zuraw, M.K. Principles of Chemical Vapor Deposition, 1st ed.; Springer Science & Business Media: Dordrecht, The Netherlands, 2013. [Google Scholar]
- Yanguas-Gil, A. Growth and Transport in Nanostructured Materials: Reactive Transport in PVD, CVD, and ALD; Springer International Publishing: Cham, Switzerland, 2017. [Google Scholar]
- Lim, J.; Lee, C. Effects of substrate temperature on the microstructure and photoluminescence properties of ZnO thin films prepared by atomic layer deposition. Thin Solid Films 2007, 515, 3335–3338. [Google Scholar] [CrossRef]
- Pal, D.; Mathur, A.; Singh, A.; Singhal, J.; Chattopadhyay, S. Photoluminescence of atomic layer deposition grown ZnO nanostructures. Mater. Today Proc. 2018, 5, 9965–9971. [Google Scholar] [CrossRef]
- Rauwel, E.; Nilsen, O.; Rauwel, P.; Walmsley, J.C.; Frogner, H.B.; Rytter, E.; Fjellvåg, H. Oxide coating of alumina nanoporous structure using ALD to produce highly porous spinel. Chem. Vap. Depos. 2012, 18, 315–325. [Google Scholar] [CrossRef]


© 2018 by the authors. Licensee MDPI, Basel, Switzerland. This article is an open access article distributed under the terms and conditions of the Creative Commons Attribution (CC BY) license (http://creativecommons.org/licenses/by/4.0/).
Share and Cite
Masse de la Huerta, C.; Nguyen, V.H.; Dedulle, J.-M.; Bellet, D.; Jiménez, C.; Muñoz-Rojas, D. Influence of the Geometric Parameters on the Deposition Mode in Spatial Atomic Layer Deposition: A Novel Approach to Area-Selective Deposition. Coatings 2019, 9, 5. https://doi.org/10.3390/coatings9010005
Masse de la Huerta C, Nguyen VH, Dedulle J-M, Bellet D, Jiménez C, Muñoz-Rojas D. Influence of the Geometric Parameters on the Deposition Mode in Spatial Atomic Layer Deposition: A Novel Approach to Area-Selective Deposition. Coatings. 2019; 9(1):5. https://doi.org/10.3390/coatings9010005
Chicago/Turabian StyleMasse de la Huerta, César, Viet Huong Nguyen, Jean-Marc Dedulle, Daniel Bellet, Carmen Jiménez, and David Muñoz-Rojas. 2019. "Influence of the Geometric Parameters on the Deposition Mode in Spatial Atomic Layer Deposition: A Novel Approach to Area-Selective Deposition" Coatings 9, no. 1: 5. https://doi.org/10.3390/coatings9010005