Article

Unevenness of Thin Liquid Layer by Contact Angle Variation of Substrate during Coating Process

Department of Mechanical Engineering, Chonnam National University, 77 Yongbong-ro, Buk-gu, Gwangju 61186, Korea
*
Author to whom correspondence should be addressed.
Coatings 2019, 9(3), 162; https://doi.org/10.3390/coatings9030162
Submission received: 8 January 2019 / Revised: 31 January 2019 / Accepted: 15 February 2019 / Published: 1 March 2019

Abstract

:
During a thin film application, the surface of the coating liquid applied to the substrate becomes uneven because of the geometry of the substrate, viscosity of the coating liquid, surface tension, and its contact angle with the substrate. The surface is particularly uneven at the edge corner portion of the substrate and is thicker than the average coating thickness. This study used the volume-of-fluid (VOF) method to examine the surface unevenness of the coating liquid in terms of the contact angle of the substrate surface and sides. After the coating liquid was evenly applied to the substrate, the maximum height of the uneven region of the coating liquid at the edge of the substrate increased as time passed. The point of maximum height moved away from the edge corner portion of the substrate. The coating liquid applied to the substrate with a contact angle less than 90° exhibited a pinning effect in which the contact point was fixed at the edge. The surface unevenness was more pronounced in the absence of the pinning effect than in its presence, due to the effects of the viscosity of the coating fluid and the surface energy of the substrate.

1. Introduction

During a thin film application, the surface of a substrate is treated with inorganic or organic material in the form of a thin film to endow the substrate surface with high functionality, such as conductivity, magnetic properties, light reflectivity, and anti-corrosion property [1,2]. There are many coating techniques such as spray processes, dip coating, sol-gel, CVD, PVD, micro-arc oxidation, and anodization [3,4,5,6,7,8,9,10,11,12,13,14,15]. This coating technology is employed for special-purpose lenses, automobile and ship painting, and roll-to-roll printing [16,17,18,19,20,21,22,23,24,25,26]. Following thin film application, the surface of the coating fluid at the edge of the substrate becomes uneven because of the effects of the viscosity of the coating fluid, surface tension, and surface contact angle with the substrate [27]. During photoresist application in lithography processes, the surface at the ends of the wafers (edge bead) is uneven, causing problems that could lead to material failure [28]. In the case of an unevenly coated lens surface, optical signals cannot be received accurately, and signal processing errors can occur [29]. To resolve this problem, the uneven parts on a coated surface can be removed using chemical or mechanical removal technologies [30,31,32]. However, these methods need to be performed as an additional process after the coating, and they are time-consuming and expensive. Experimental studies have shown that a uniform thin film can be attained without any additional removal processes by adjusting the ultraviolet or plasma exposure time [32,33]. However, because the unevenness of a coating fluid is affected by many factors such as its viscosity, surface tension, and surface contact angle with the substrate, it is necessary to study the various physical phenomena and the variables involved.
The effects of certain physical parameters, such as the wetting properties between the ink and the surface (hydrophilic or hydrophobic), can be studied more conveniently and economically through numerical simulations than through experiments. Numerical simulations can be used to quantitatively examine the unevenness of a coating fluid at the microsecond (μs) scale, which is otherwise difficult through experiments. Despite the potential advantages of numerical simulation, it has been thus far performed only on simple surfaces, coated using the spray method [34,35].
The motion of the free surface between a fluid and the surrounding air can be simulated based on the Navier–Stokes equations, via two main methods: The moving-grid method and the volume-of-fluid (VOF) method [36,37,38]. The moving grid method is a Lagrangian finite element method in which a grid is created to represent the free surface so that the position of the boundary surface of the moving fluid can be expressed geometrically. However, to achieve this, excessively large grid and structure remeshing (at each time step) is required [39,40]. The other approach, i.e., the VOF, is a Eulerian finite element method and can be used to express complex fluid motion in terms of the change in the fraction of volume a fluid occupies in a given volume over time. This study uses the VOF method to analyze the coating fluid behavior and surface unevenness at the edge portion of a coated surface, based on the changes in the contact angle of the substrate surface, which is an important factor influencing the surface unevenness.

2. Numerical Simulation

2.1. Volume of Fluid

Numerical simulations were performed to analyze the unevenness of the coating fluid in terms of the surface contact angle of the substrate, using the VOF mode in CFD-ACE+ (ESI group) software 2017.0. In computational fluid analyses, the VOF method was used to numerically simulate abnormal flow models and to model free surfaces. It uses the fraction of the fluid volume occupied by liquids or gases in a grid to calculate the position and movement of the free surfaces, which are the boundary surfaces between the two fluids. Current numerical models include both liquid and gas phases. Therefore, the integral equation form is used to describe the motion of fluids. The mass and momentum conservation equations are as follows, respectively:
t V ρ d V + S ρ u n d S = 0
t V ρ u d V + S ρ u u n d S = S τ n d S + V ( ρ g + f ) d V
where ρ is the density (kg/m3), t is time (s), u is the velocity vector (m/s), n is the unit normal vector, g is the acceleration due to gravity (m/s2), f is the surface tension force (N), τ is the stress tensor (N/m2), S is the closed surface (m2), and V is the control volume (m3). ϕ is defined as the volume fraction of the liquid for the VOF model. If ϕ is 0, the grid interior is filled with gas; if ϕ is 1, the grid interior is filled with liquid. If 0 < ϕ < 1, the value of ϕ in the grid specifies the liquid-to-gas ratio.
ϕ = { 1 ,   inside the liquid phase ; > 0 , < 1   at the free surface ; 0 ,   inside the gas phase .
The position of the free surface was determined using the following passive transport equation:
ϕ t + u ϕ = 0
The shape of the free surface was recreated using the second-order piecewise linear interface construction (PLIC). For the grid including the free surface, the density ρ and the dynamic viscosity µ (kg/(m·s)) are based on the volume fraction ϕ and can be calculated as follows:
ρ = ϕ ρ l + ( 1 ϕ ) ρ g
μ = ϕ μ l + ( 1 ϕ ) μ g
where ρl and ρg are the densities of the liquid and gas, respectively, and µl and µg are the dynamic viscosities of the liquid and gas, respectively. The surface tension force can be expressed as follows:
f = σ κ n s , n s = ϕ / | ϕ | , κ = ( s n s )
where σ is the surface tension coefficient (N/m), κ is the local free surface curvature (m−1), and ns is the unit normal vector to the free surface. ∇s denotes the gradient operator applied along the direction tangent to the surface [41].

2.2. Simulation Model and Conditions

To perform computational fluid analysis on the unevenness of the coating fluid in terms of the surface contact angle of the substrate, a computational domain was set up, as shown in Figure 1. Due to the axisymmetric condition of the numerical model, the simulation was conducted in 2D. The substrate height was set to 50 µm and its length to 1000 µm. A wall condition and a no-slip condition were applied to the substrate surface. An axis symmetric condition from the substrate centerline was set up. The static contact angle between the substrate and the coating fluid was set to wetting (15°, 30°, 45°, 60°, 75°, and 90°) conditions, i.e., the shape of the coating fluid front was only driven by surface tension without any additional dynamic flow effects. The coating fluid, which had an initial height of 30 µm, was set to be applied to the entire area of the substrate surface, and the form of a thin film was assumed. The coating fluid was set as a Newtonian fluid, with constant liquid viscosity. The coating fluid had a density of 997 kg/m3, a dynamic viscosity of 0.0012 kg/ms, and a surface tension of 0.0236 N/m. It was assumed that the coating fluid and substrate were surrounded by gas (air) at room temperature (25 °C) and ambient pressure (101,325 Pa). The gas density was set to 1.1614 kg/m3, and its dynamic viscosity was set to 1.846 × 10⁻⁵ kg/ms. The gravitational acceleration was set to −9.81 m/s2 in the y-direction. Any evaporation, which might have influenced viscosity and surface tension, was ignored during the thin film application process. For the numerical simulation, the time step was 0.1 µs and the structured grid was used. The grid independence and convergence test [42] was carried out, as shown in Figure S1.

3. Results

3.1. Validation of the Numerical Model

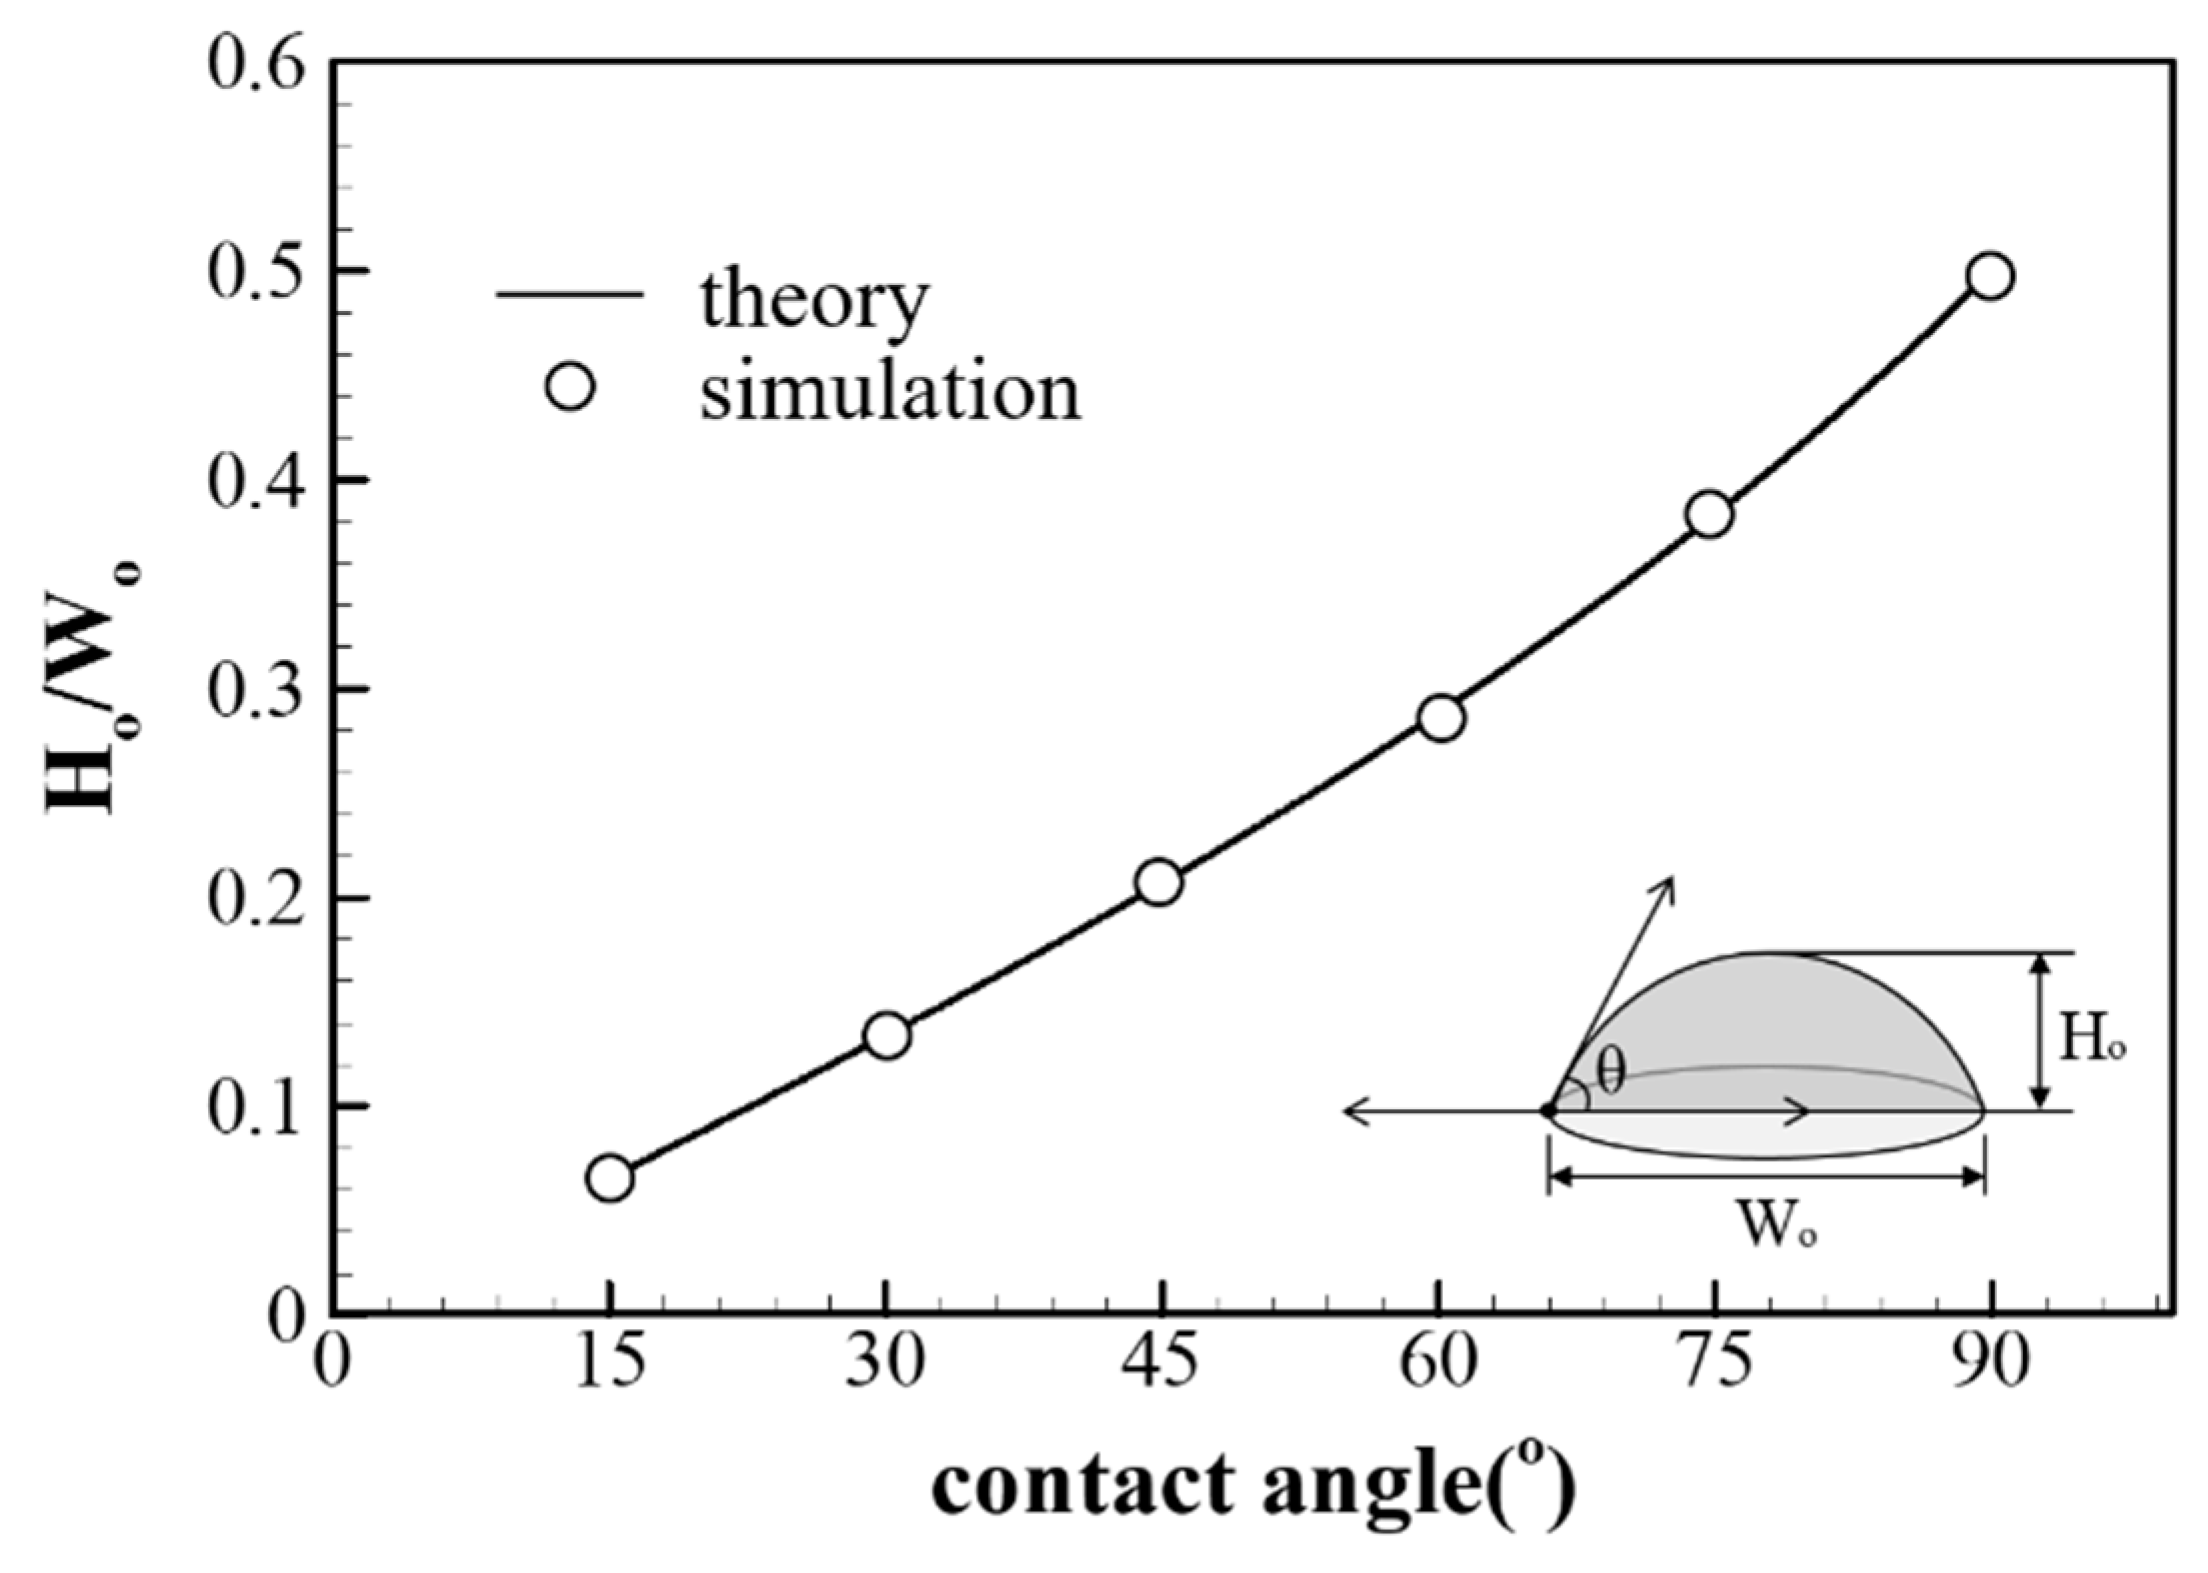
To validate the numerical model, the results of the surface contact angle simulation were compared with theoretical data. The theoretical data can be analyzed from the standpoint of thermodynamic equilibrium, which is attained when a liquid is placed on a solid surface. A theoretical curve was plotted through the geometrical aspect ratio (Ho/Wo), where Wo and Ho are the width and height of the liquid drops, respectively, based on the changes in the substrate contact angle [43]. Figure 2 shows the theoretical curve plotted with respect to the geometric aspect ratio of the liquid drops obtained from the simulation. The results show that the simulation is in reasonable agreement with the theoretical data. In addition, validation was conducted experimentally using the contact angle data on a silicon wafer as shown in Figure S2. Therefore, our numerical model is considered accurate enough to examine the coating fluid surface in terms of the substrate contact angle.

3.2. Same Wetting Condition

After the thin film is applied, the coating fluid surface becomes uneven at the edge portion of the substrate due to the effects of the viscosity of the coating liquid, surface tension, and contact angle with the substrate. Because the surface is uneven at the edge of the substrate, the wetting of the substrate sides is an important variable affecting the formation of a uniform thin film. If the substrate has undergone preprocessing, such as a sputter process or dip coating, the substrate surface and sides will be under the same wetting conditions. Accordingly, the behavior of the coating fluid was analyzed over time by assuming that the substrate surface and sides had the same contact angle (same wetting condition). Table 1 lists the conditions (cases) for performing the computation analysis.
Figure 3a shows the analysis results of the coating fluid surface over time when the contact angle of the substrate surface is equal to that of the sides, i.e., 15°. Figure 3b shows a quantitative analysis of the surface profile of the coating fluid. As time passes, the maximum height and length of the uneven region increase, and the point of maximum height moves away from the edge corner portion (edges). With the application of the coating fluid, the surface becomes uneven at the substrate edges with the passage of time, and the fluid tends to reach an energy equilibrium state because of the effects of the surface tension and the surface energy of the substrate. The coating fluid even covers the sides of the substrate because of its hydrophilic properties. The surface shape changes while the contact point is fixed at the edge corner portion of the substrate.
This phenomenon is called the pinning effect. In this phenomenon, even when the volume of a droplet attached to a solid surface (sessile droplet) is reduced, the parallel contact line of the droplet remains fixed. The computational analysis results show that the coated surface exhibits a pinning effect for contact angles ranging from 30° to 75° because of its hydrophilic properties. Moreover, the coating fluid covered the sides of the substrate. Figures S3–S6 show the results of the computational analysis for contact angles ranging from 30° to 75°.
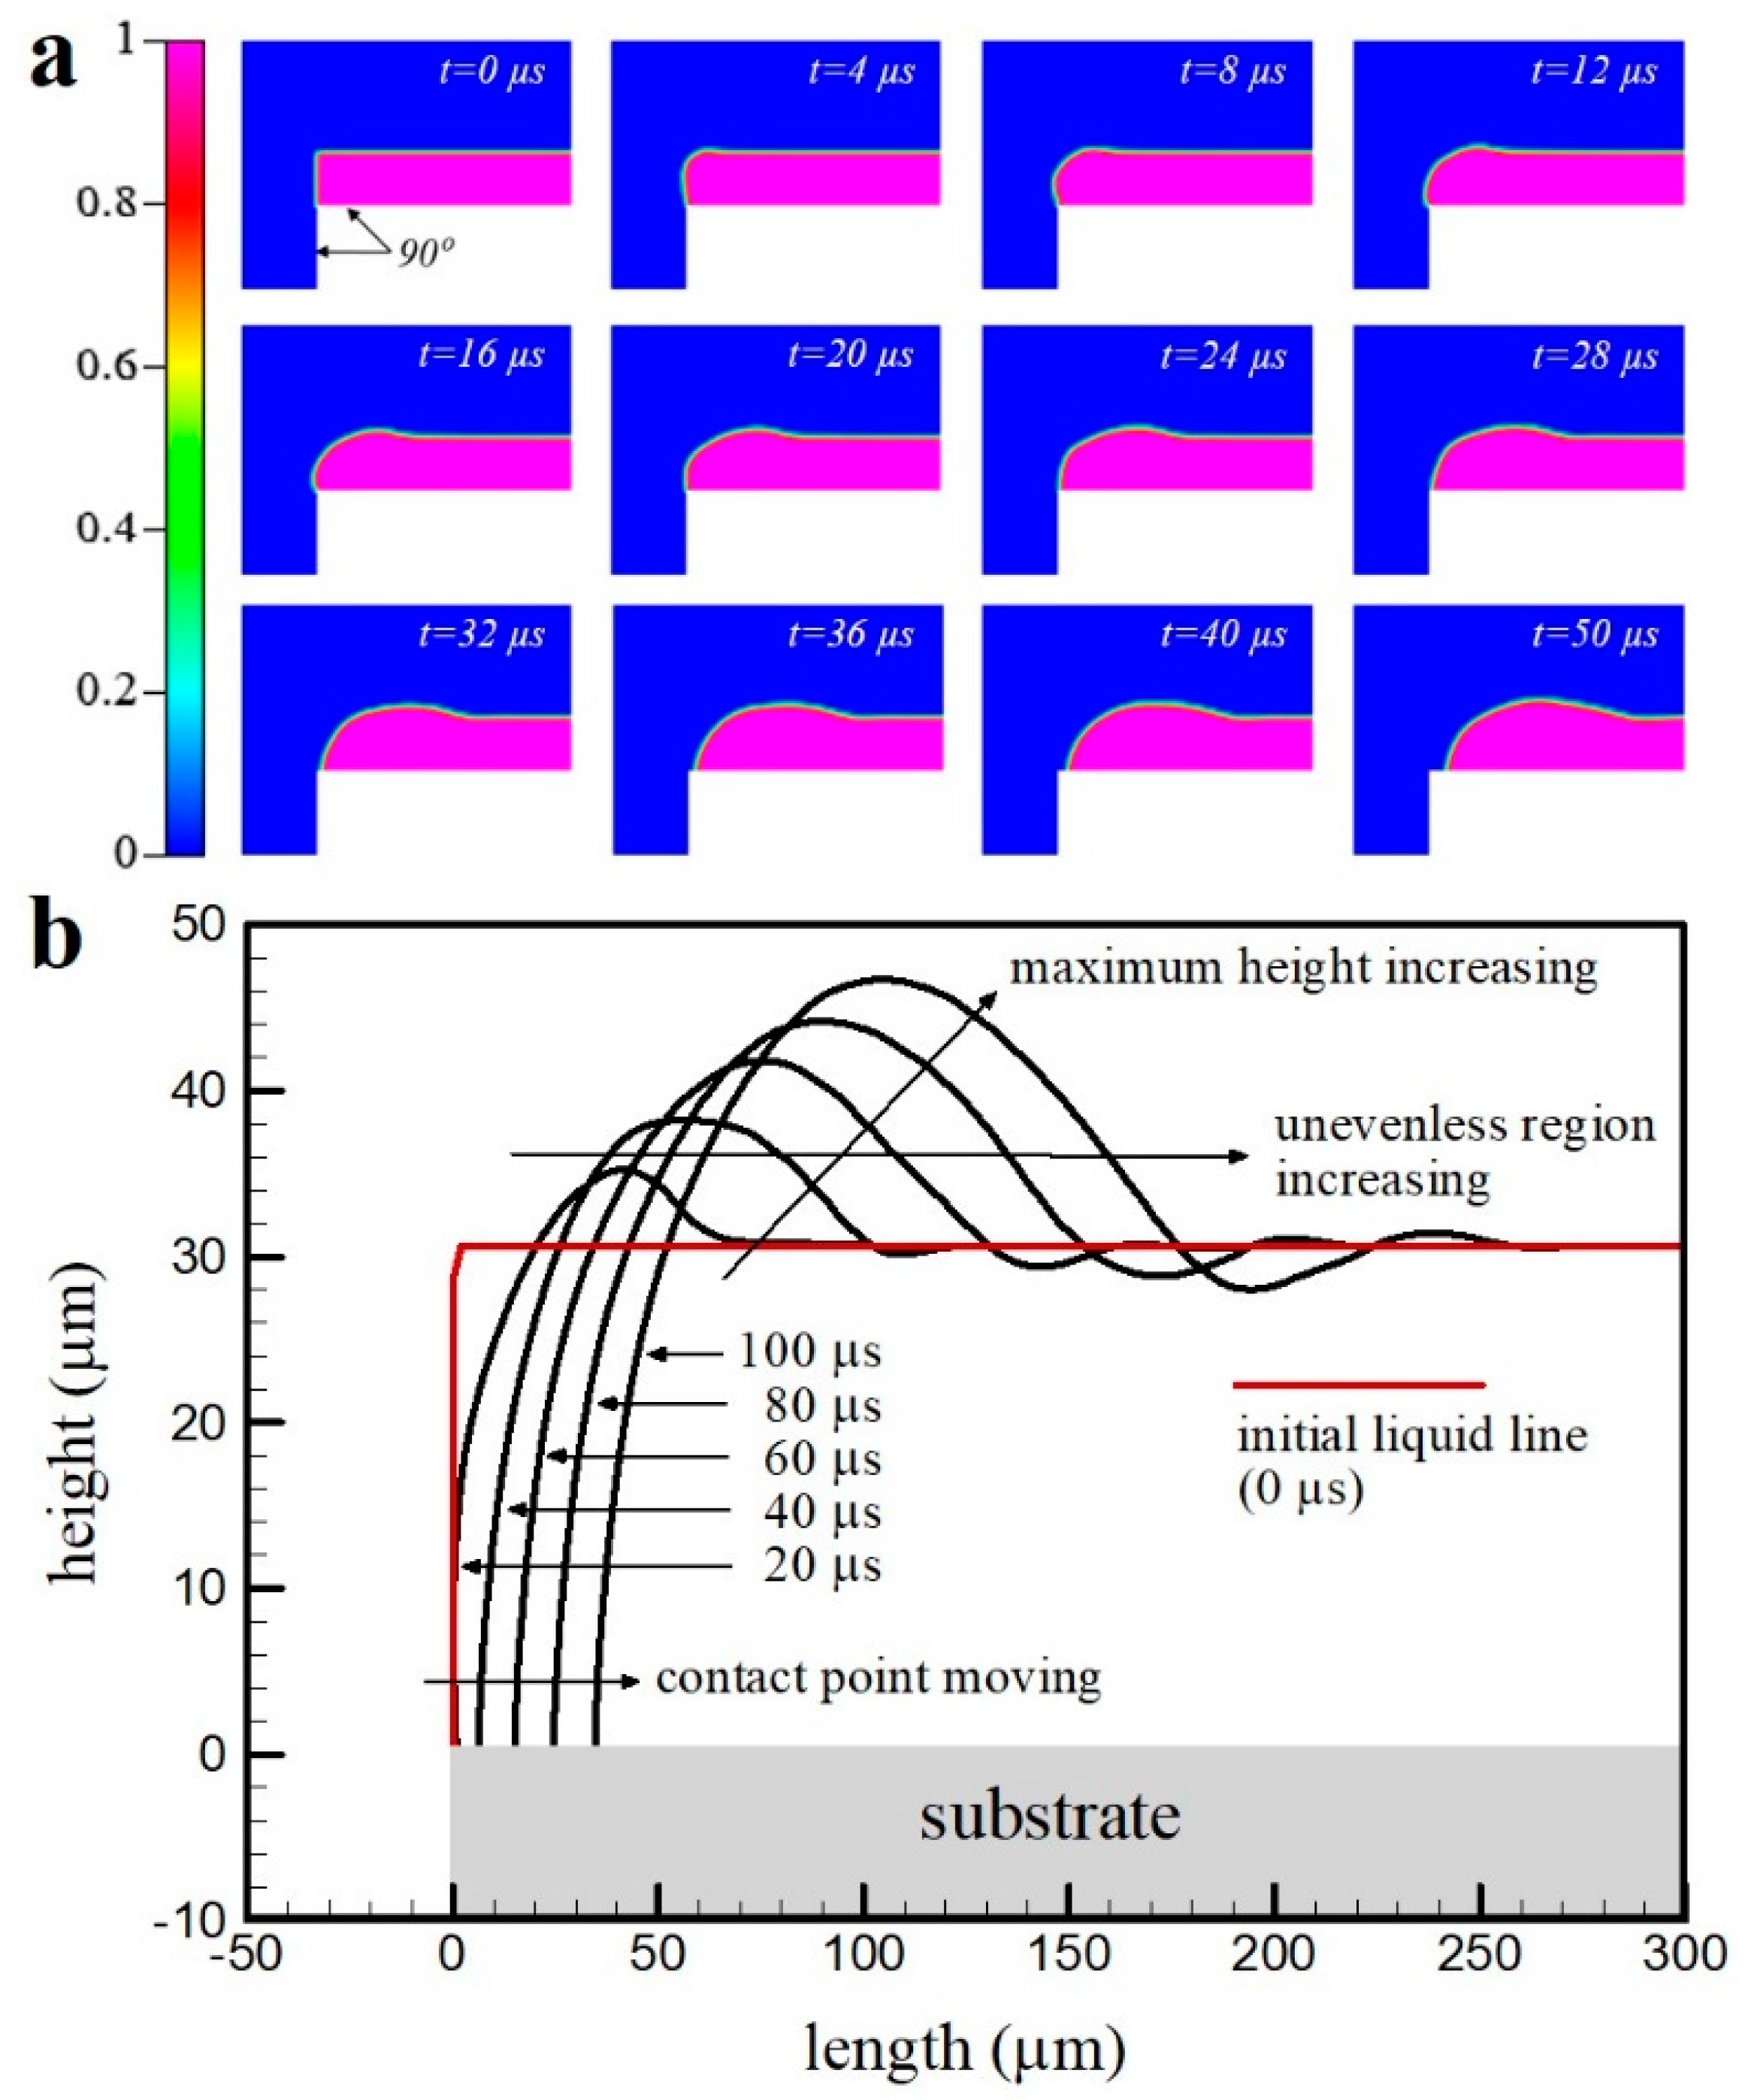
Figure 4a shows the analysis results of the behavior of the coating fluid over time when the contact angle of the substrate surface is equal to that of the sides, i.e., 90°. Figure 4b shows a quantitative analysis of the surface profile of the coating fluid. As in the case of the hydrophilic surface, the maximum height and length of the uneven region increase as time passes. However, unlike the substrate surface with a small contact angle, the contact point moves away from the corner portion (edge) over time, and the coating does not cover the edge surface of the substrate. This is because the applied fluid tends to reduce its contact area with the substrate, and the surface shape changes while the contact line is not fixed because of the large contact angle between the coating fluid and the substrate.
To perform a quantitative analysis of the degree of unevenness on the coated surface and the behavior of the applied contact surface fluid in terms of the changes in the substrate surface energy, the maximum height (h), x-direction position of the maximum height of the surface unevenness (xh), and uneven region (luneven) were measured. Each measured value was divided by the initial height of the coating fluid (ho) to express the values as dimensionless variables. Figure 5a shows the analysis results of the maximum height of the surface unevenness based on the contact angle between the substrate and the coating fluid. The deformation during the initial 30 μs shows similar trends in all the analysis cases, and a higher level of deformation is seen after 30 μs because of the increase in the contact angle. With the increase in the surface contact angle, the maximum height increases because the coating liquid tends to reduce the contact area with the substrate surface due to the low surface energy. Because of these results, the surface unevenness was more severe in the absence of the pinning effect than in its presence. Figure 5b shows the analysis results of the x-direction position of the maximum height of the surface unevenness. The deformation during the initial 30 μs shows similar trends in all the cases, and the x-direction position of the maximum height is close to the substrate edge with the increase in the contact angle. This is because the applied coating fluid at the substrate corner edge tends to reduce the contact area with the substrate, and the shape of the surface changes, while the contact line is not fixed. Figure 5c shows the analysis results of the uneven region. In all the cases, the deformation of the coating fluid during the initial 20 μs is more rapid, showing similar trends. The deformation from 20 to 30 μs is gradual, following which the amount of change in the uneven region rapidly increases again.

3.3. Different Wetting Condition

Like silicon wafers, the sides of the substrate are sometimes not processed during substrate processing. Assuming this is the case, the behavior of the coating fluid over time was analyzed for different contact angles of the substrate surface and sides (different wetting conditions). Table 2 lists the conditions under which the computational analysis was executed.
Figure 6a shows the analysis results of the coating fluid surface over time for a substrate surface contact angle of 15° and a side contact angle of 180°. When the coating fluid is applied to the substrate, at 8 µs, satellite droplets are formed, which deviate away from the surface of the coating fluid at the edge portion of the substrate. Satellite droplets are created due to the high fluid inertia force that can break the surface tension force. These satellite droplets have average diameters of 5 μm and velocity magnitudes of 1.86 m/s. The satellite droplets move to the outside of the liquid film and fall down due to gravity. Figure 6b shows a quantitative analysis of the surface profile of the coating fluid over time. The pinning effect, in which the contact point is fixed due to the hydrophilic properties of the substrate, is induced at the edge corner portion, as shown in Figure 5b. However, unlike the results shown in Figure 5b, in which the coating fluid even covers the sides of the substrate, Figure 6b shows that the sides are not covered owing to their non-wetting properties. When the substrate surface contact angle ranges from 30° to 75°, the pinning effect and satellite droplets occur in all the analysis cases. The substrate’s sides are not covered because of its hydrophilic properties, similar to that observed when the angle is 15°. In addition, the satellite droplets are also formed with similar average diameters of 5 μm and velocity magnitudes of 1.75 m/s to that observed when the angle is 15°. Figures S7–S10 show the computational analysis results for contact angles ranging from 30° to 75°.
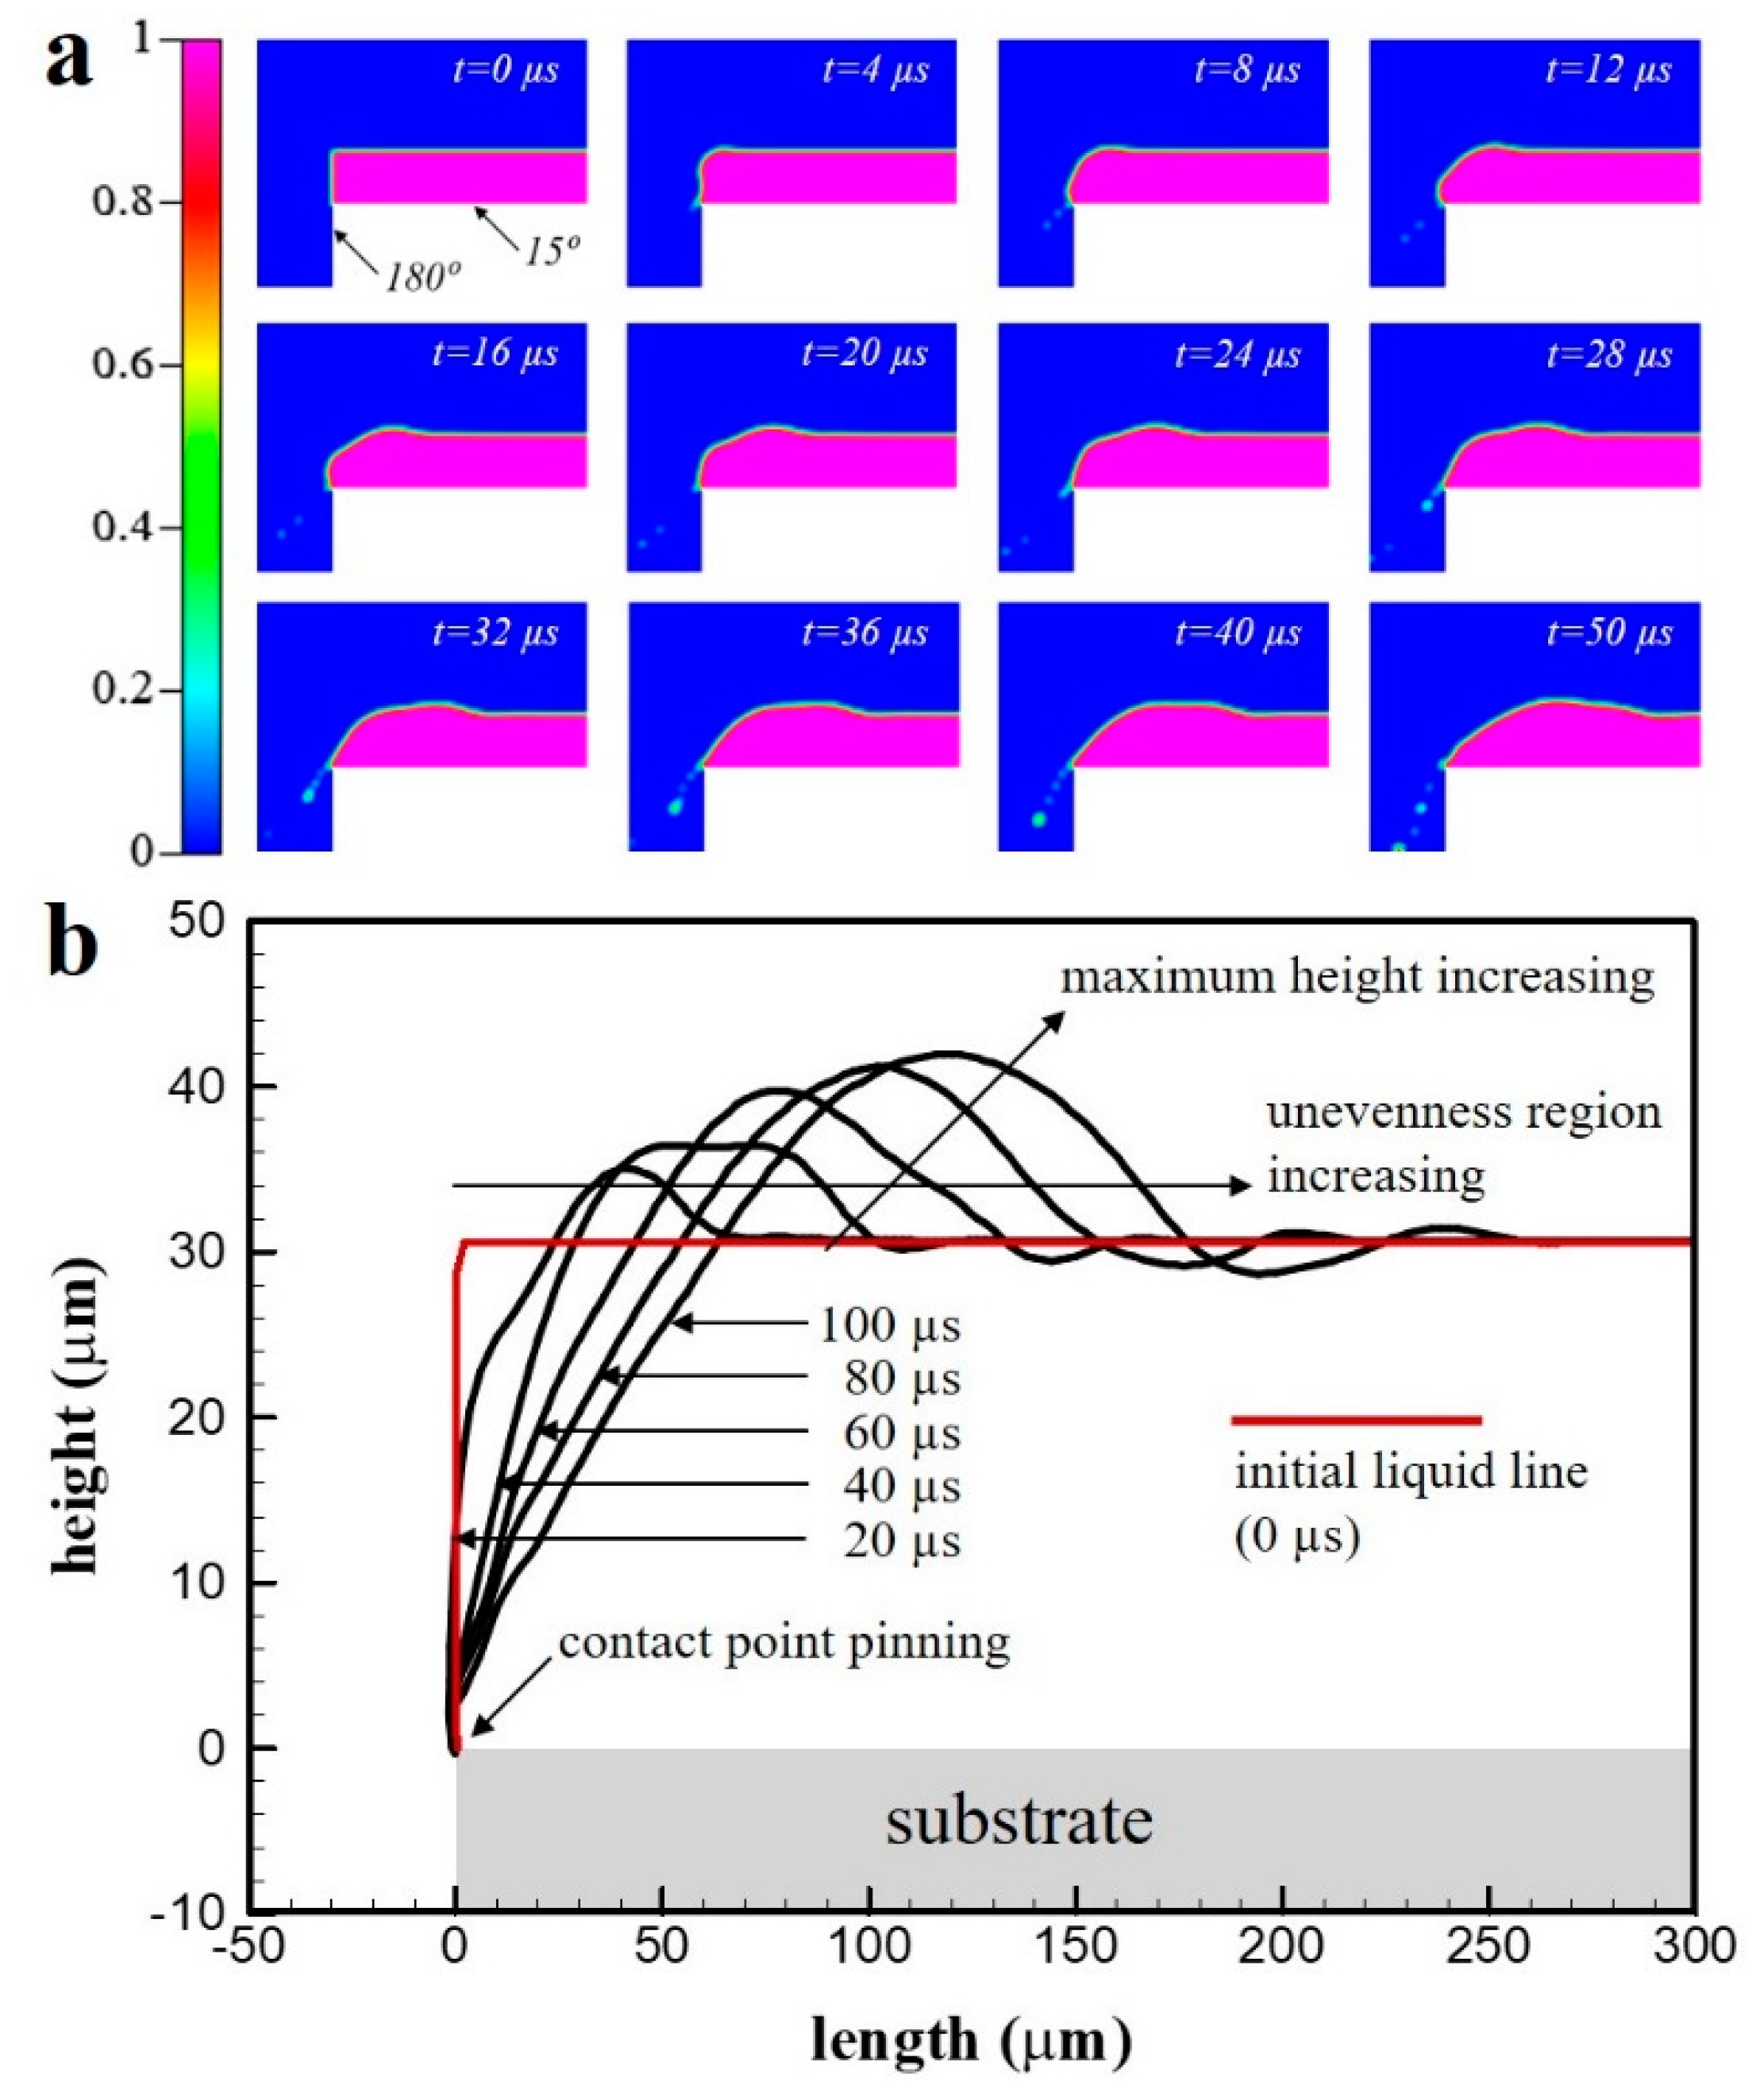
Figure 7a shows the analysis results of the coating fluid surface over time for a substrate surface contact angle of 90° and a side contact angle of 180°. With the increase in the substrate surface contact angle, the size of the satellite droplets increases. These satellite droplets have average diameters of 16 μm and velocity magnitudes of 1.55 m/s. The satellite droplets are 5.3 times larger in diameter and 1.2 times lower in velocity than the satellite droplet formed at the low contact angles (15°–75°). At 50 µs, the substrate edge is not coated because of the movement of the contact point. Figure 7b shows a quantitative analysis of the surface profile of the coating fluid over time. In the coating fluid surface profile, the maximum height and length of the uneven region increase as time passes, similar to that shown in Figure 4b. However, the loss of coating fluid is due to the effect of the satellite droplets, and the maximum height of the surface unevenness is lower than that shown in Figure 4b.
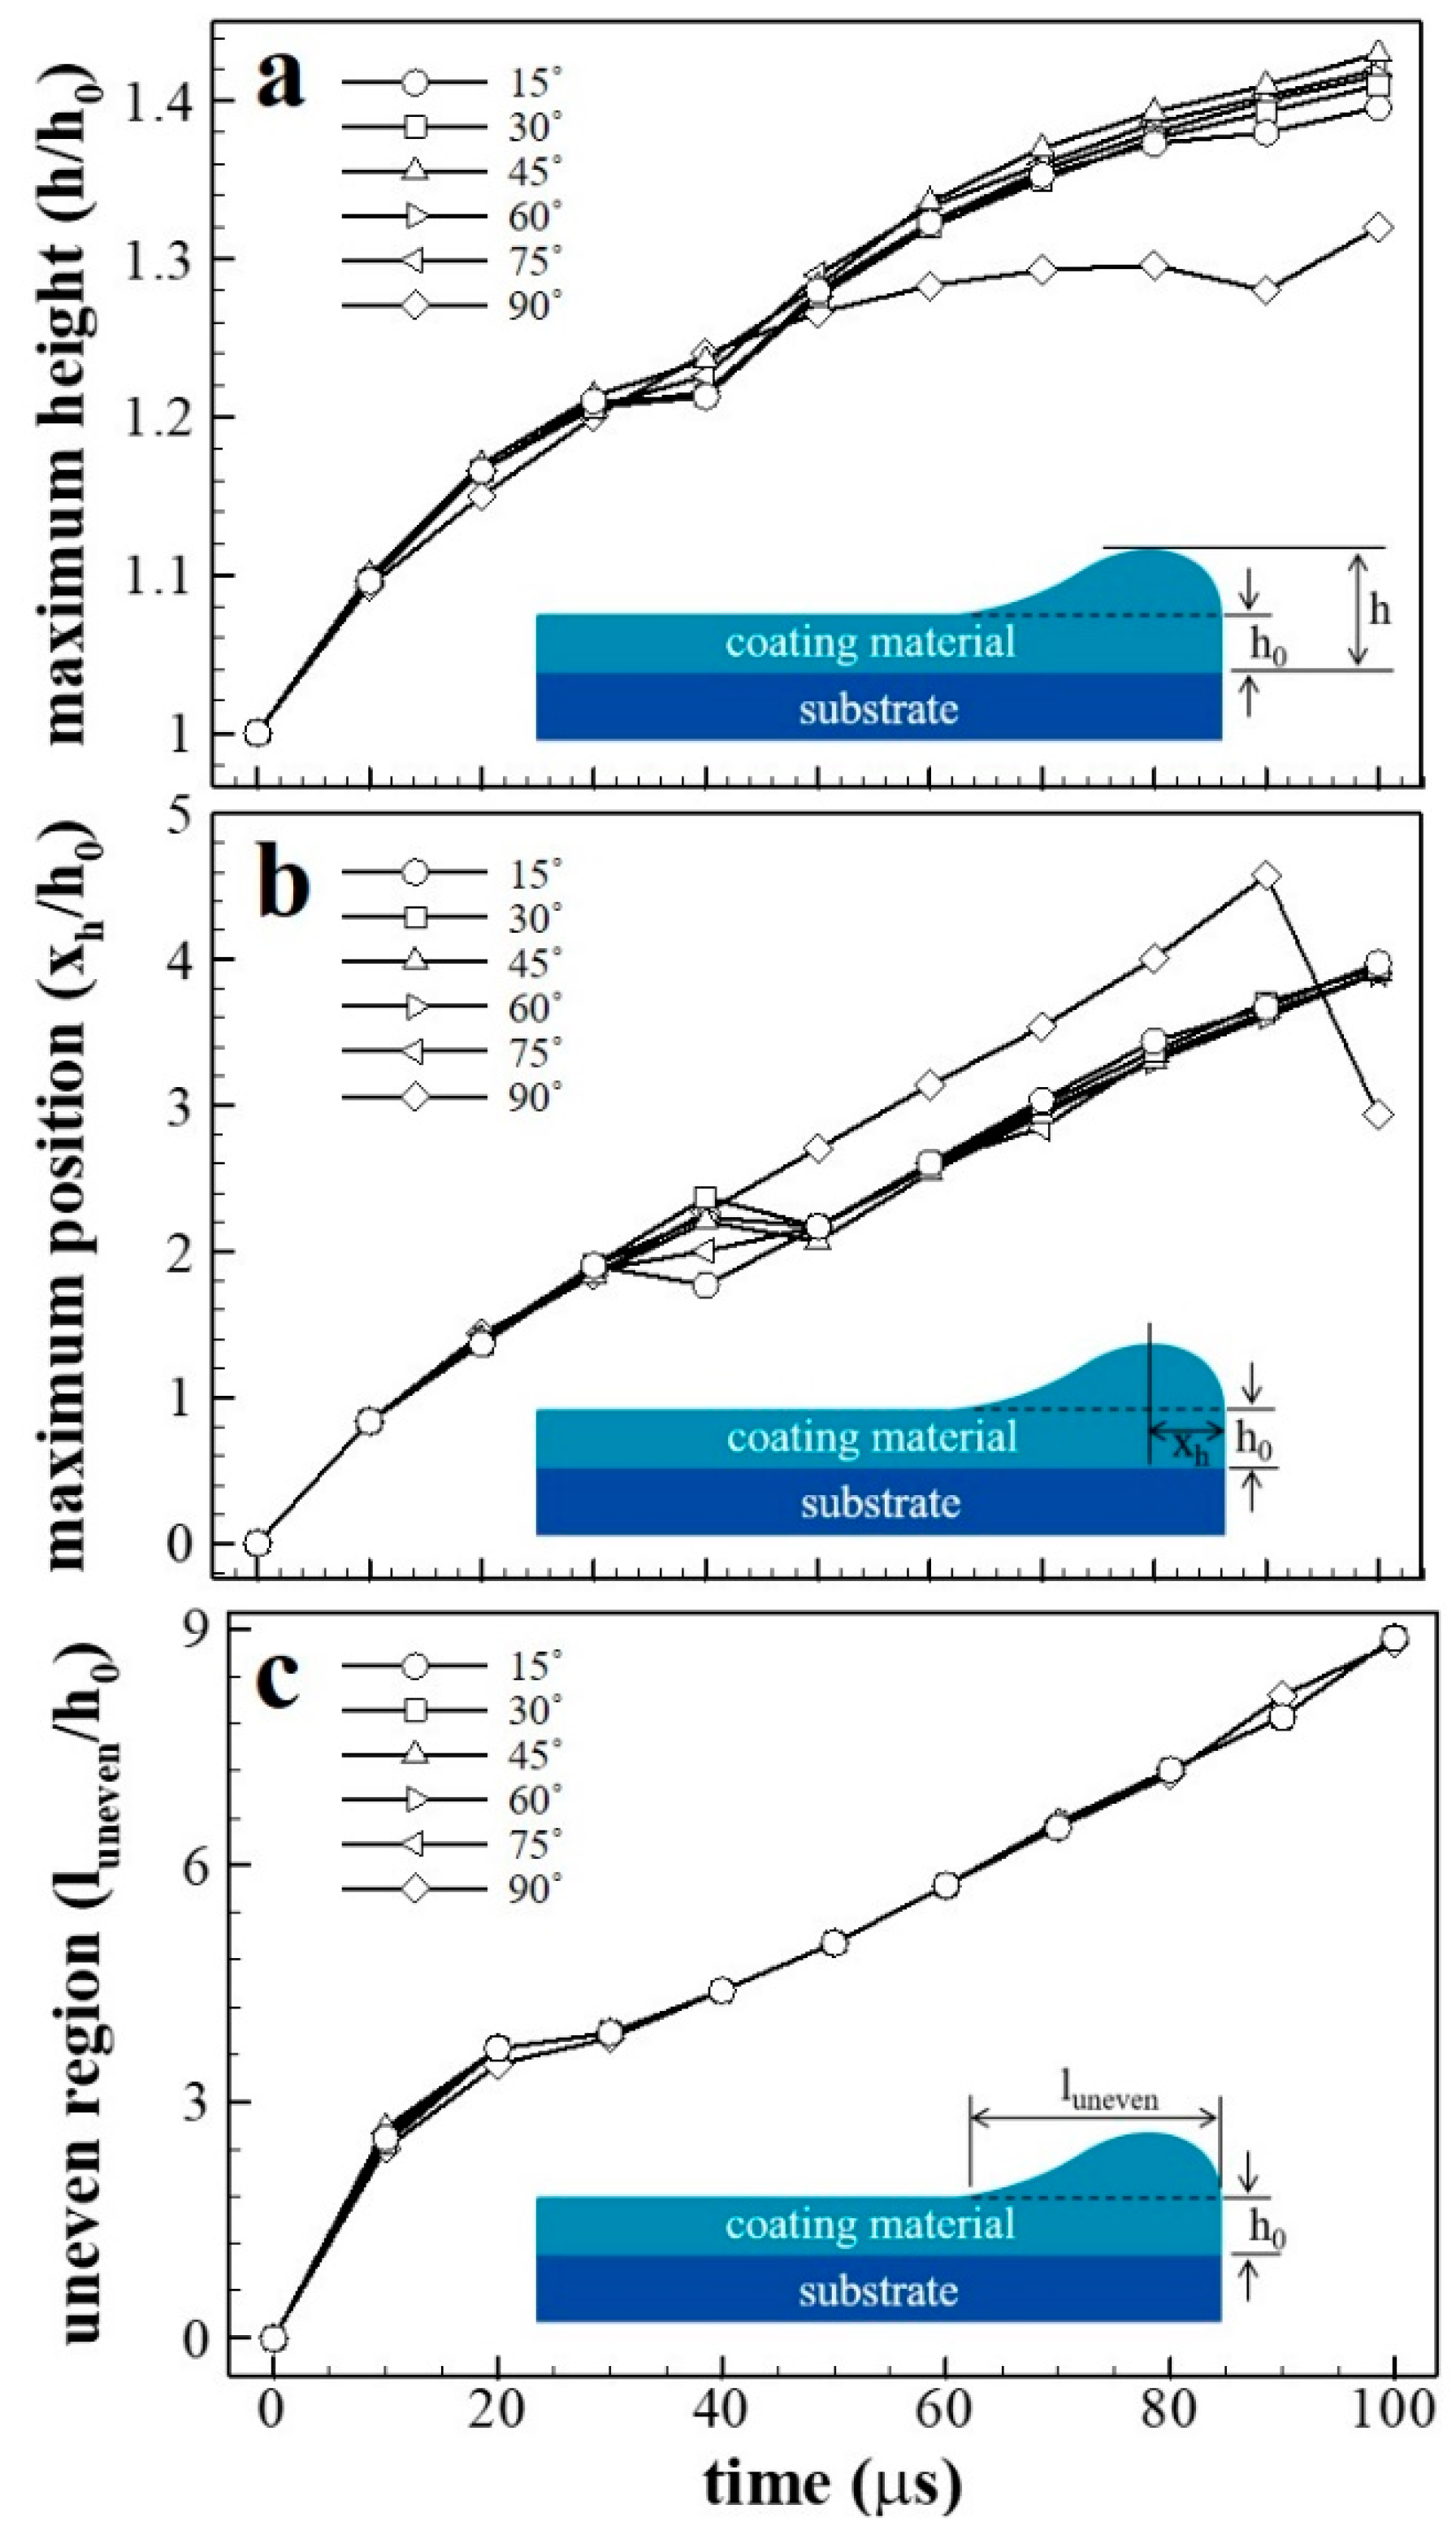
To perform a quantitative analysis of the unevenness of the coating fluid surface and the behavior of the applied fluid, the maximum height (h) of the surface unevenness, the x-direction position of the maximum height (xh), and the region with surface unevenness (luneven) were measured. Each of the measured values were divided by the initial height of the coating fluid (hₒ) of the coating liquid to express them as dimensionless variables. Figure 8a shows the analysis results of the maximum height of the surface unevenness in terms of the contact angle between the substrate and the coating fluid. With the increase in the contact angle from 15° to 75°, the maximum height of the surface unevenness increases. When the substrate surface contact angle is 90°, the height is lower than that when the contact angle ranges from 15° to 75°. This is because of the formation of large satellite droplets and the loss of applied coating fluid, unlike that when the surface had a low contact angle with the coating fluid applied to the substrate edge corner portion. Figure 8b shows the analysis results of the x-direction position of the maximum height of the surface unevenness. The deformation during the initial 30 μs shows a similar trend in all the cases, and the x-direction position of the maximum height becomes closer to the edge of the substrate with the increase in the contact angle, except when the contact angle is 90°. When the contact angle is 90°, the substrate surface fluctuates because of the contact point movement at the edge and the formation of satellite droplets. Because of the surface fluctuation, the x-direction position of the maximum height moves closer to the substrate edge, as observed at 100 μs. Figure 8c shows the analysis results of the uneven region. During the initial 20 s, the coating fluid deforms rapidly, showing similar trends in all the cases. The deformation is gradual from 20 to 30 μs, following which the change in the uneven region increases rapidly again. The formation of the uneven region can be attributed to the small difference in the contact angles.

4. Conclusions

This study examined coating fluid behavior and surface unevenness in terms of the surface energy of the substrate surface and sides during a thin film coating process. The VOF method was used to simulate the free surface between the coating liquid and the surrounding air and to describe the surface unevenness formation at the microsecond scale.
  • When the contact angle of the substrate surface was equal to that of the sides, the length and height of the uneven region increased with the increase in the contact angle and passage of time. When the substrate contact angle ranged from 15° to 75°, a pinning effect was induced, with fixed parallel contact lines of the droplets on the substrate edge corner portion, and the coating fluid covered the sides of the substrate. Consequently, the substrate sides were also coated.
  • When the substrate contact angle was 90°, the substrate edge surface was not coated, because the applied fluid tended to reduce the contact area with the substrate. Moreover, the surface shape changed while the contact line at the corner portion was not fixed, as the contact angle between the coating fluid and the substrate was high. Because of this, the coating fluid on the substrate in the absence of the pinning effect experienced more severe unevenness than in its presence.
  • When the contact angles of the substrate surface and sides were different, the formation of satellite droplets and the loss of application solution were observed in all the analysis cases. The satellite droplets could have led to problems in the coating process. They formed as they escaped from the cohesiveness of the coating fluid due to the difference in the fluid inertia, which created energy equilibrium, and the surface energy of the substrate side (non-wetting conditions).
  • When the contact angles ranged from 15° to 75°, the pinning effect was generated at the edge corner portion, similar to that observed when the contact angle of the substrate contact surface was equal to that of the sides. However, the results were promising in cases where the substrate sides were not covered because of their high surface contact angle. Therefore, to reduce surface unevenness, it is necessary to actively control not only the wetting of the substrate surface but also of the side surface. The sides of the substrate must have a contact angle greater than 90°, and the substrate surface must have a surface contact angle lower than 90°.

Supplementary Materials

The following are available online at https://www.mdpi.com/2079-6412/9/3/162/s1: Figure S1. Variation of the maximum height of the surface unevenness with the grid number; Figure S2: Comparison between the (a) static contact angle of the silicon wafer and (b) the simulation result of the contact angle; Figure S3: (a) Coating fluid behavior over time at the edge of the substrate under the same wetting condition of 30°, (b) surface profile under the same wetting condition of 30°, (c) maximum height, (d) maximum position, and (e) uneven region analysis of the surface unevenness at the edge of the substrate under the same wetting condition of 30°; Figure S4: (a) Coating fluid behavior over time at the edge of the substrate under the same wetting condition of 45°, (b) surface profile under the same wetting condition of 45°, (c) maximum height, (d) maximum position, and (e) uneven region analysis of the surface unevenness at the edge of the substrate under the same wetting condition of 45°; Figure S5: (a) Coating fluid behavior over time at the edge of the substrate under the same wetting condition of 60°, (b) surface profile under the same wetting condition of 60°, (c) maximum height, (d) maximum position, and (e) uneven region analysis of the surface unevenness at the edge of the substrate under the same wetting condition of 60°; Figure S6: (a) Coating fluid behavior over time at the edge of the substrate under the same wetting condition of 75°, (b) surface profile under the same wetting condition of 75°, (c) maximum height, (d) maximum position, and (e) uneven region analysis of the surface unevenness at the edge of the substrate under the same wetting condition of 75°; Figure S7: (a) Coating fluid behavior over time at the edge of the substrate under a substrate surface contact angle of 30° and a side contact angle of 180°, (b) surface profile under different wetting conditions, (c) maximum height, (d) maximum position, and (e) uneven region analysis of the surface unevenness at the edge of the substrate under different wetting conditions; Figure S8: (a) Coating fluid behavior over time at the edge of the substrate under a substrate surface contact angle of 45° and a side contact angle of 180°, (b) surface profile under different wetting conditions, (c) maximum height, (d) maximum position, and (e) uneven region analysis of the surface unevenness at the edge of the substrate under different wetting conditions; Figure S9: (a) Coating fluid behavior over time at the edge of the substrate under a substrate surface contact angle of 60° and a side contact angle of 180°, (b) surface profile under different wetting conditions, (c) maximum height, (d) maximum position, and (e) uneven region analysis of the surface unevenness at the edge of the substrate under different wetting conditions; Figure S10: (a) Coating fluid behavior over time at the edge of the substrate under a substrate surface contact angle of 75° and a side contact angle of 180°, (b) surface profile under different wetting conditions, (c) maximum height, (d) maximum position, and (e) uneven region analysis of surface unevenness at the edge of the substrate under different wetting conditions.

Author Contributions

Conceptualization, N.K.K.; Methodology, N.K.K. and H.W.K.; Software, N.K.K. and D.H.K.; Validation, N.K.K.; Formal analysis, N.K.K.; Investigation, N.K.K., D.H.K., and H.W.K.; Data curation, N.K.K., D.H.K., and H.W.K.; Writing—original draft preparation, N.K.K.; Writing—review and editing, N.K.K., D.H.K., and H.W.K.; Visualization, N.K.K.; Supervision, H.W.K.

Funding

This research was supported by Basic Science Research Program through the National Research Foundation of Korea (NRF) funded by the Ministry of Science, ICT & Future Planning (NRF-2016R1C1B2012136).

Conflicts of Interest

The authors declare no conflict of interest.

References

  1. Cui, H.; Zayat, M.; Parejo, P.G.; Levy, D. Highly efficient inorganic transparent UV-protective thin-film coating by low temperature sol-gel procedure for application on heat-sensitive substrates. Adv. Mater. 2008, 20, 65–68. [Google Scholar] [CrossRef]
  2. Yuan, Y.; Giri, G.; Ayzner, A.L.; Zoombelt, A.P.; Mannsfeld, S.C.; Chen, J.; Nordlund, D.; Toney, M.F.; Hunag, J.; Bao, Z. Ultra-high mobility transparent organic thin film transistors grown by an off-centre spin-coating method. Nat. Commun. 2014, 5, 3005. [Google Scholar] [CrossRef] [PubMed] [Green Version]
  3. Galeano, B.; Korff, E.; Nicholson, W.L. Inactivation of vegetative cells, but not spores, of Bacillus anthracis, B. cereus, and B. subtilis on stainless steel surfaces coated with an antimicrobial silver- and zinc-containing zeolite. Appl. Environ. Microbiol. 2003, 69, 4329–4331. [Google Scholar] [CrossRef] [PubMed]
  4. Kendig, M.; Scully, J. Basic aspects of electrochemical impedance application for the life prediction of organic coatings on metals. Corrosion 1990, 46, 22–29. [Google Scholar] [CrossRef]
  5. Feuerstein, A.; Knapp, J.; Taylor, T.; Ashary, A.; Bolcavage, A.; Hitchman, N. Technical and economical aspects of current thermal barrier coating systems for gas turbine engines by thermal spray and EBPVD: A review. J. Therm. Spray Technol. 2008, 17, 199–213. [Google Scholar] [CrossRef]
  6. Pham, V.H.; Cuong, T.V.; Hur, S.H.; Shin, E.W.; Kim, J.S.; Chung, J.S.; Kim, E.J. Fast and simple fabrication of a large transparent chemically-converted graphene film by spray-coating. Carbon 2010, 48, 1945–1951. [Google Scholar] [CrossRef]
  7. Li, J.; Wu, R.; Jing, Z.; Yan, L.; Zha, F.; Lei, Z. One-step spray-coating process for the fabrication of colorful superhydrophobic coatings with excellent corrosion resistance. Langmuir 2015, 31, 10702–10707. [Google Scholar] [CrossRef] [PubMed]
  8. Barrows, A.T.; Pearson, A.J.; Kwak, C.K.; Dunbar, A.D.; Buckley, A.R.; Lidzey, D.G. Efficient planar heterojunction mixed-halide perovskite solar cells deposited via spray-deposition. Energy Environ. Sci. 2014, 7, 2944–2950. [Google Scholar] [CrossRef]
  9. Chen, L.M.; Hong, Z.; Kwan, W.L.; Lu, C.H.; Lai, Y.F.; Lei, B.; Liu, C.P.; Yang, Y. Multi-source/component spray coating for polymer solar cells. ACS Nano 2010, 4, 4744–4752. [Google Scholar] [CrossRef] [PubMed]
  10. Galagan, Y.; de Vries, I.G.; Langen, A.P.; Andriessen, R.; Verhees, W.J.; Veenstra, S.C.; Kroon, J.M. Technology development for roll-to-roll production of organic photovoltaics. Chem. Eng. Process. 2011, 50, 454–461. [Google Scholar] [CrossRef]
  11. Lu, Y.; Ganguli, R.; Drewien, C.A.; Anderson, M.T.; Brinker, C.J.; Gong, W.; Guo, Y.; Soyez, H.; Dunn, B.; Huang, M.H.; et al. Continuous formation of supported cubic and hexagonal mesoporous films by sol–gel dip-coating. Nature 1997, 389, 364–368. [Google Scholar] [CrossRef]
  12. Brinker, C.J.; Frye, G.C.; Hurd, A.J.; Ashley, C.S. Fundamentals of sol-gel dip coating. Thin Solid Films 1991, 201, 97–108. [Google Scholar] [CrossRef]
  13. Kim, D.J.; Hahn, S.H.; Oh, S.H.; Kim, E.J. Influence of calcination temperature on structural and optical properties of TiO2 thin films prepared by sol–gel dip coating. Mater. Lett. 2002, 57, 355–360. [Google Scholar] [CrossRef]
  14. Asri, R.I.M.; Harun, W.S.W.; Hassan, M.A.; Ghani, S.A.C.; Buyong, Z. A review of hydroxyapatite-based coating techniques: Sol–gel and electrochemical depositions on biocompatible metals. J. Mech. Behav. Biomed. Mater. 2016, 57, 95–108. [Google Scholar] [CrossRef] [PubMed] [Green Version]
  15. Dehghanghadikolaei, A.; Ansary, J.; Ghoreishi, R. Sol-gel process applications: A mini-review. Proc. Nat. Res. Soc. 2018, 2, 02008. [Google Scholar] [CrossRef]
  16. Mehta, P.; Al-Kinani, A.A.; Haj-Ahmad, R.; Arshad, M.S.; Chang, M.W.; Alany, R.G.; Ahmad, Z. Electrically atomised formulations of timolol maleate for direct and on-demand ocular lens coatings. Eur. J. Pharm. Biopharm. 2017, 119, 170–184. [Google Scholar] [CrossRef] [PubMed] [Green Version]
  17. Sedransk, K.L.; Tenhaeff, W.E.; Gleason, K.K. Grafting CVD of poly(vinyl pyrrolidone) for durable scleral lens coatings. Chem. Vapor Depos. 2010, 16, 23–28. [Google Scholar] [CrossRef]
  18. Li, B.; Blaschke, H.; Ristau, D. Combined laser calorimetry and photothermal technique for absorption measurement of optical coatings. Appl. Opt. 2006, 45, 5827–5831. [Google Scholar] [CrossRef] [PubMed]
  19. Malherbe, L.; Mandin, C. VOC emissions during outdoor ship painting and health-risk assessment. Atmos. Environ. 2007, 41, 6322–6330. [Google Scholar] [CrossRef]
  20. Dik, J.; Janssens, K.; Van Der Snickt, G.; van der Loeff, L.; Rickers, K.; Cotte, M. Visualization of a lost painting by Vincent van Gogh using synchrotron radiation based X-ray fluorescence elemental mapping. Anal. Chem. 2008, 80, 6436–6442. [Google Scholar] [CrossRef] [PubMed]
  21. Osticioli, I.; Zoppi, A.; Castellucci, E.M. Fluorescence and Raman spectra on painting materials: Reconstruction of spectra with mathematical methods. J. Raman Spectrosc. 2006, 37, 974–980. [Google Scholar] [CrossRef]
  22. Celebi, U.B.; Vardar, N. Investigation of VOC emissions from indoor and outdoor painting processes in shipyards. Atmos. Environ. 2008, 42, 5685–5695. [Google Scholar] [CrossRef]
  23. Krebs, F.C.; Fyenbo, J.; Jørgensen, M. Product integration of compact roll-to-roll processed polymer solar cell modules: methods and manufacture using flexographic printing, slot-die coating and rotary screen printing. J. Mater. Chem. 2010, 20, 8994–9001. [Google Scholar] [CrossRef]
  24. Krebs, F.C. Polymer solar cell modules prepared using roll-to-roll methods: knife-over-edge coating, slot-die coating and screen printing. Sol. Energy Mater. Sol. Cells 2009, 93, 465–475. [Google Scholar] [CrossRef]
  25. Ahn, S.H.; Guo, L.J. High-speed roll-to-roll nanoimprint lithography on flexible plastic substrates. Adv. Mater. 2008, 20, 2044–2049. [Google Scholar] [CrossRef]
  26. Sonawane, R.S.; Kale, B.B.; Dongare, M.K. Preparation and photo-catalytic activity of Fe–TiO2 thin films prepared by sol–gel dip coating. Mater. Chem. Phys. 2004, 85, 52–57. [Google Scholar] [CrossRef]
  27. Smith, S.; Stolle, D. Nonisothermal two-dimensional film casting of a viscous polymer. Polym. Eng. Sci. 2000, 40, 1870–1877. [Google Scholar] [CrossRef]
  28. Pollentier, I.; Somanchi, A.; Burkeen, F.; Vedula, S. Influence of immersion lithography on wafer edge defectivity. Solid State Technol. 2008, 51, 38–42. [Google Scholar]
  29. Zhang, X.; Li, B. Calibration optimization of laser-induced deflection signal for measuring absorptance of laser components. Appl. Opt. 2015, 54, 1861–1869. [Google Scholar] [CrossRef] [PubMed]
  30. Lee, H.; Lee, K.; Ahn, B.; Xu, J.; Xu, L.; Oh, K.W. A new fabrication process for uniform SU-8 thick photoresist structures by simultaneously removing edge bead and air bubbles. J. Micromech. Microeng. 2011, 21, 125006. [Google Scholar] [CrossRef]
  31. Park, H.W.; Kim, H.J.; Roh, J.H.; Choi, J.K.; Cha, K.R. Simple and cost-effective method for edge bead removal by using a taping method. J. Korean Phys. Soc. 2018, 73, 1473–1478. [Google Scholar] [CrossRef]
  32. Uddin, M.A.; Chan, H.P.; Chow, C.K.; Chan, Y.C. Effect of spin coating on the curing rate of epoxy adhesive for the fabrication of a polymer optical waveguide. J. Electron. Mater. 2004, 33, 224–228. [Google Scholar] [CrossRef]
  33. Sharma, A.; Verheijen, M.A.; Wu, L.; Karwal, S.; Vandalon, V.; Knoops, H.C.; Sundaram, R.S.; Hofmann, J.P.; Kessels, W.M.M.; Bol, A.A. Low-temperature plasma-enhanced atomic layer deposition of 2-D MoS2: large area, thickness control and tuneable morphology. Nanoscale 2018, 10, 8615–8627. [Google Scholar] [CrossRef] [PubMed]
  34. Ye, Q.; Pulli, K. Numerical and experimental investigation on the spray coating process using a pneumatic atomizer: influences of operating conditions and target geometries. Coatings 2017, 7, 13. [Google Scholar] [CrossRef]
  35. Joshi, A.; James, S. Molecular dynamics simulation study of cold spray process. J. Manuf. Process. 2018, 33, 136–143. [Google Scholar] [CrossRef]
  36. de Lamotte, A.; Delafosse, A.; Calvo, S.; Toye, D. Identifying dominant spatial and time characteristics of flow dynamics within free-surface baffled stirred-tanks from CFD simulations. Chem. Eng. Sci. 2018, 192, 128–142. [Google Scholar] [CrossRef]
  37. Wu, L.; Gong, M.; Wang, J. Development of a DEM–VOF model for the turbulent free-surface flows with particles and its application to stirred mixing system. Ind. Eng. Chem. Res. 2018, 57, 1714–1725. [Google Scholar] [CrossRef]
  38. Li, L.; Liu, Z.; Cao, M.; Li, B. Large eddy simulation of bubbly flow and slag layer behavior in ladle with discrete phase model (DPM)–Volume of fluid (VOF) coupled model. JOM 2015, 67, 1459–1467. [Google Scholar] [CrossRef]
  39. Muzaferija, S.; Peri´ c, M. Computation of free-surface flows using the finite-volume method and moving grids. Numer. Heat Transf. Part B 1997, 32, 369–384. [Google Scholar] [CrossRef]
  40. Laadhari, A.; Székely, G. Fully implicit finite element method for the modeling of free surface flows with surface tension effect. Int. J. Numer. Methods Eng. 2017, 111, 1047–1074. [Google Scholar] [CrossRef]
  41. Brackbill, J.U.; Kothe, D.B.; Zemach, C. A continuum method for modeling surface tension. J. Comput. Phys. 1992, 100, 335–354. [Google Scholar] [CrossRef]
  42. Hirsch, C. Consistency, stability and error analysis of numerical schemes. In Numerical Computation of Internal and External Flows, 2nd ed.; John Wiley & Sons: Oxford, UK, 2007; pp. 291–292. [Google Scholar]
  43. Kang, H.W.; Sung, H.J.; Lee, T.M.; Kim, D.S.; Kim, C.J. Liquid transfer between two separating plates for micro-gravure-offset printing. J. Micromech. Microeng. 2008, 19, 015025. [Google Scholar] [CrossRef]
Figure 1. Schematic of the computational domain and boundary conditions of the coating fluid.
Coatings 09 00162 g001
Figure 2. Comparison between the simulation results and theoretical curve plotted using the geometric aspect ratio of the liquid drop.
Coatings 09 00162 g002
Figure 3. (a) Coating fluid behavior over time at the edge of the substrate under the same wetting condition of 15°. (b) Surface profile under the same wetting condition of 15°.
Coatings 09 00162 g003
Figure 4. (a) Coating fluid behavior over time at the edge of the substrate under the same wetting condition of 90°. (b) Surface profile under the same wetting condition of 90°.
Coatings 09 00162 g004
Figure 5. (a) Maximum height, (b) maximum position, and (c) uneven region analysis of the surface unevenness at the edge of the substrate with the same wetting conditions.
Coatings 09 00162 g005
Figure 6. (a) Coating fluid behavior over time at the edge of the substrate under a substrate surface contact angle of 15° and a side contact angle of 180°. (b) Surface profile under different wetting conditions.
Coatings 09 00162 g006
Figure 7. (a) Coating fluid behavior over time at the edge of the substrate under a substrate surface contact angle of 90° and a side contact angle of 180°. (b) Surface profile under different wetting conditions.
Coatings 09 00162 g007
Figure 8. (a) Maximum height, (b) maximum position, and (c) uneven region analysis of the surface unevenness at the edge of the substrate with different wetting conditions.
Coatings 09 00162 g008
Table 1. Parameters used in the simulation cases under the same wetting conditions.
CaseContact Angle of Substrate (°)Contact Angle of Side Wall (°)Liquid Properties
same_15°1515ρ = 997 kg/m3
σ = 0.0236 N/m
same_30°3030
same_45°4545
same_60°6060
same_75°7575
same_90°9090
Table 2. Parameters used in the simulation cases under different wetting conditions.
CaseContact Angle of Substrate (°)Contact Angle of Side Wall (°)Liquid Properties
diff_15°15180ρ = 997 kg/m3
σ = 0.0236 N/m
diff_30°30180
diff_45°45180
diff_60°60180
diff_75°75180
diff_90°90180