2. Related Work
Generally, the Internet of Things (IoT) system architecture has two different design approaches, top-down and bottom-up ideas [
1]. The top-down approach focuses on Internet applications that are based on service-oriented architectures (SOA), which emphasize the provisioning of services, while the bottom-up approach focuses on physical architecture, path of connection, and relationships between objects. The two approaches have the same main components, i.e., embedded devices, network protocols, the Internet, cloud services, and real-time operating systems (RTOS) [
2]. Embedded devices are based on microcontrollers that run software. Network protocols such as MQTT, Transmission Control Protocol (TCP)/Internet Protocol (IP), and Web sockets are used to exchange information. The cloud provides computing resources and space for storing data.
York et al. propose a system for measuring, monitoring, and controlling washroom dispensers and products [
3]. When a toilet paper dispenser or soap dispenser reaches a low level, janitors are alerted to refill the dispenser. A PC, data communication unit, and washroom monitoring system are included in the system. Speed et al. propose an instrumented toilet roll holder [
4]. The toilet roll holder records how much toilet paper is on the roll in use and sends the data to an online database. The authors constructed the toilet roll holder using the Electric Imp cloud service and an embedded hardware and software platform featuring an infrared sensor to detect the amount of paper on the roll. However, these authors do not optimize the power consumption of the system. Similarly, [
5,
6,
7] created IoT-based hygiene monitoring systems for public toilets using various types of sensors. However, none of these researchers have explored power consumption. The Kloala Team [
8] propose a real-time monitoring IoT gadget called Kloala that provides statistics and information about toilet paper usage. The main feature of this project is a real-time monitoring function that allows users to use a smartphone to check how much toilet paper is still on the roll. The Kloala device is placed above a toilet paper roll with different attachments and measures the distance to the roll using a laser distance sensor. The smartphone app displays the actual toilet paper level, allowing the user to monitor storage and order new rolls. Paper supply data are displayed in graphical form, giving an overview of the users’ behavior. The system uses an ESP8266, the MQTT service, and laser distance sensors. Man et al. [
9] propose a system called the intelligent tissue dispenser system (ITDS) that reduces labor costs to refill a tissue dispenser and increases users’ satisfaction. The ITDS consists of three main components, a power source, a microcontroller, and a sensor. The authors describe the infrastructure, the data integration model, the data visualization approach, and an ITDS commercialization model. The authors chose the ESP8266 microcontroller and use an ultrasonic sensor to measure the actual distance of the object from sensor. The US-015 is chosen instead of the HC-SR04 because it can operate at 3.3 V. The reading level status can be set at three levels, i.e., low, medium, and high. The main limitation of all the systems described [
3,
4,
8,
9] is that they require replacing the existing infrastructure (paper dispenser) and mounting a completely new set of devices.
Stralin et al. [
10] propose a product-level sensor for a product dispenser. It comprises an ultrasonic-level sensor for determining the level of the sheet product contained in the dispenser. It includes product-level sensors for rectangular tissue boxes and circular dispensers. However, the sensor size is too large for public toilets. The performance of ultrasonic and laser distance sensors is compared in two papers [
11,
12]. The first group of authors [
11] chose HC-SR04, a popular ultrasonic sensor. The second group [
12] chose the VL53LOX Time-of-Flight (ToF) laser-ranging sensor. Light sensors provide high light intensity, enabling very accurate measurement for both positioning and detection, and they can be made very small and waterproof, so that they are suitable to use in high- moisture places. Another advantage is measurement speed, which is very high due to the use of light as a medium. VL53LOX can utilize a 3.3 V while HC-SR04 can only be used with 5 V. Both sensors perform well in the 10–50 cm range. Ultrasonic sensor readings above 50 cm are often erroneous, however. B. Mustapha et al. [
13] compare IR sensors with ultrasonic sensors. The authors tested multiple measurements for different materials and different colors. The resolution was 10 mm and above for both sensors. They concluded that IR sensor measurements showed nonlinear output while Ultrasonic sensor output was linear. The laser sensor performed well from 5 mm to 750 mm while providing a high data rate. The ultrasonic sensor and IR sensor are not effective at very small distances. In our work, we use laser sensors due to their close range, since the distance between a full tissue paper roll and an empty tissue roll is 35 mm to 107 mm.
In contrast to the above-mentioned work, our system uses a time of flight (ToF) distance sensor instead of an ultrasonic or infrared sensor. Compared to ultrasonic sensors, ToF distance sensors are smaller in size, although they are slightly more expensive. Furthermore, we use an ESP32 SoC that is small enough to install on any paper dispenser. Koo et al. [
14] present a holistic conceptual approach for IoT system development and implementation for bathroom safety enhancement. A typical sensor module consists of four main components—a power supply, sensors, actuators, and a communication port. The study demonstrates the tremendous potential of IoT and big data applications for improving user sustainability. Nevertheless, the authors do not discuss the durability of such a system or the power constraints to power up the system. Mendes et al. [
15] propose an IoT system to monitor the status of toilets and improve their maintenance in an airport. For the toilet paper dispenser, a Mini Ultra Pro, a VL53LOX sensor, and the LoRa protocol are used. A hole is created in the upper side of the dispenser to mount the sensor in that system. Damaging the original dispenser cover and mounting a custom device presents many problems. It is difficult to make the pinhole align with the sensor. In addition, LoRa network infrastructure is required in place of typical existing Wi-Fi network. Using existing paper dispensers without damaging them and using existing Wi-Fi network infrastructure would be a more cost-effective solution.
There have been a few studies on toilet hygiene systems using IoT. Kirithika et al. [
16] monitor a toilet using a PIC16F877A, a gas sensor, an ultrasonic sensor, a proximity sensor, and a GSM modem. P. Deshmukh et al. [
17] monitor a toilet using mainly a NodeMCU, a gas sensor, an ultrasonic sensor, and an infrared sensor. While these systems have merit, we focus exclusively on paper dispensers.
The growth of the Internet of thing (IoT) creates new challenges including network integration, scalability, energy efficiency, heterogeneity, and machine to machine (M2M) communication. This means that network architecture design becomes very important, as it can help reduce total deployment cost and power consumption. When an IoT device is in active mode, it consumes more power, causing battery life to decrease significantly. Saving power is a challenge for many authors [
17,
18,
19,
20]. Power-saving depends on specific deployment details, technologies, channel access mechanisms, network scale, and spatial coverage. Power-saving modes should be implemented and combined with device profiles, wake up capability, and power consumption. Ideally, IoT components should be turned off during sleep state, configuring a longer sleep time in a cycle and triggering criteria [
18]. Data require compression [
19] using symbolic aggregate approximation (SAX) techniques and piecewise aggregate approximation (PAA) to save transmission energy. Connecting to networks such as Wi-Fi direct, access points, or Internet gateway consumes more power [
20]. To reduce power consumption, developers should keep communication modules in sleep mode and buffer data. When many requests arrive at the gateway at the same time, the gateway can analyze multiple requests and combine them before sending them to the device. Sending data has its own pattern, which can be predicted by using machine learning algorithms, helping to further reduce power consumption. Hidden Markov models can also be used to associate states with battery status and the size of data received to optimize the frequency of wake-up intervals [
21]. The work just mentioned [
18,
19,
20,
21] analyzed only a few factors in their power saving analyses. In the application of low power devices, there are multiple factors affecting power consumption.
Nikoukar. A et al. [
22] compare the requirements of IP-support, mobility, availability, scalability, energy, and reliability of different available wireless technologies for a smart building. Among all other available wireless technologies, Wi-Fi has the highest IP support, mobility, and availability. Unfortunately, Wi-Fi is listed as having no support for energy saving compared to other wireless technologies.
As battery technologies are evolving rapidly, it is difficult to select an appropriate battery size and to determine the optimal replacement or recharging period. Low power device design always involves tradeoffs between system performance and battery life. Extending battery life requires optimizing average energy consumption through design aspects of the system while maintaining expected performance. Morin et al. [
23] compare the energy consumption of IEEE 802.15.4/e, Bluetooth low energy (BLE), IEEE 802.11 power saving mode, IEEE 802.11 ah, LoRa, and SIGFOX. The authors’ main contribution is to help designers select the MAC parameters to optimize energy consumption in an application. U. Raza et al. [
24] review design goals and techniques in different LPWA technologies. Researchers are continuously working on algorithms for optimizing battery life.
Hofer [
25] compares HTTP REST with MQTT, as an example, highlighting MQTT’s low power consumption. The authors conclude that lower overhead is paired with shorter processing time. Toldinas et al. [
26] compare QoS and power consumption and find that QoS = 0 is the most power efficient setting in the MQTT protocol. Al-Ali et al. [
27] find that QoS = 1 contributes to more packet drops due to the duplication of messages. Moreover, they find that latency and packet drop with QoS = 0 is lower than that of QoS = 1 when the number of clients increases to 10,000 nodes. Throughput remains lower with QoS = 0 compared to QoS = 1 up to 100 clients. The researchers excluded QoS = 2 because its overhead is higher. Network latency is another parameter related to network architecture. Thomas et al. [
28] prove that static IP addresses reduce network initialization time compared to DHCP, but DHCP offers flexibility when pairing with new network infrastructure. DHCP clients can stay connected to the network or reconnect when defined events occur. Longer latencies affect sleep time and ultimately contribute towards power consumption.
Until now, only a handful of researchers have focused on toilet or bathroom appliances, and even fewer have developed efficient power saving devices in this area. The existing work on IoT systems for bathroom and kitchen environments is inspiring; but as yet, it has not considered bathroom supply consumption, automation of supply ordering, power consumption, and integration with existing facilities. Therefore, in this paper, we propose an IoT-based tissue paper monitoring system that takes steps to fill those gaps. To the best of our knowledge, no researcher has investigated low power, cost effective IoT-based tissue paper monitoring systems that can be mounted on existing tissue dispensers. Our contribution is to propose a cost-effective, low power IoT-based tissue paper monitoring system that can be deployed beyond the laboratory scale. The system is designed using free and open-source software platforms. The application targets existing Wi-Fi network infrastructure. The current amount of tissue remaining and battery voltage levels are displayed on a Grafana dashboard. In addition, notification emails are sent to the user when the paper supply or battery voltage is low. We discuss simple methods for current measurement and practically verify them as applicable to many other low power applications. The application power profile and power budget are also modeled and practically verified. All the parameters presented in this work are application-oriented, and the limitations are meaningful compared to the standard protocols and technologies.
The rest of the paper is organized into
Section 3.
Section 4 provides our methodology, consisting of a system overview, hardware architecture, distance measurement methods, the software architecture, our adaptive power estimation, the network architecture, the system’s security features, and data storage and visualization. In addition, power consumption is also analyzed in detail.
Section 2 after that presents experimental results and provides discussion. Finally,
Section 5 draws conclusions and recapitulates the early stages of development for future work.
3. System Overview
The system comprises hardware components and a web-based paper supply monitoring dashboard as can be seen in
Figure 1.
3.1. Hardware Architecture
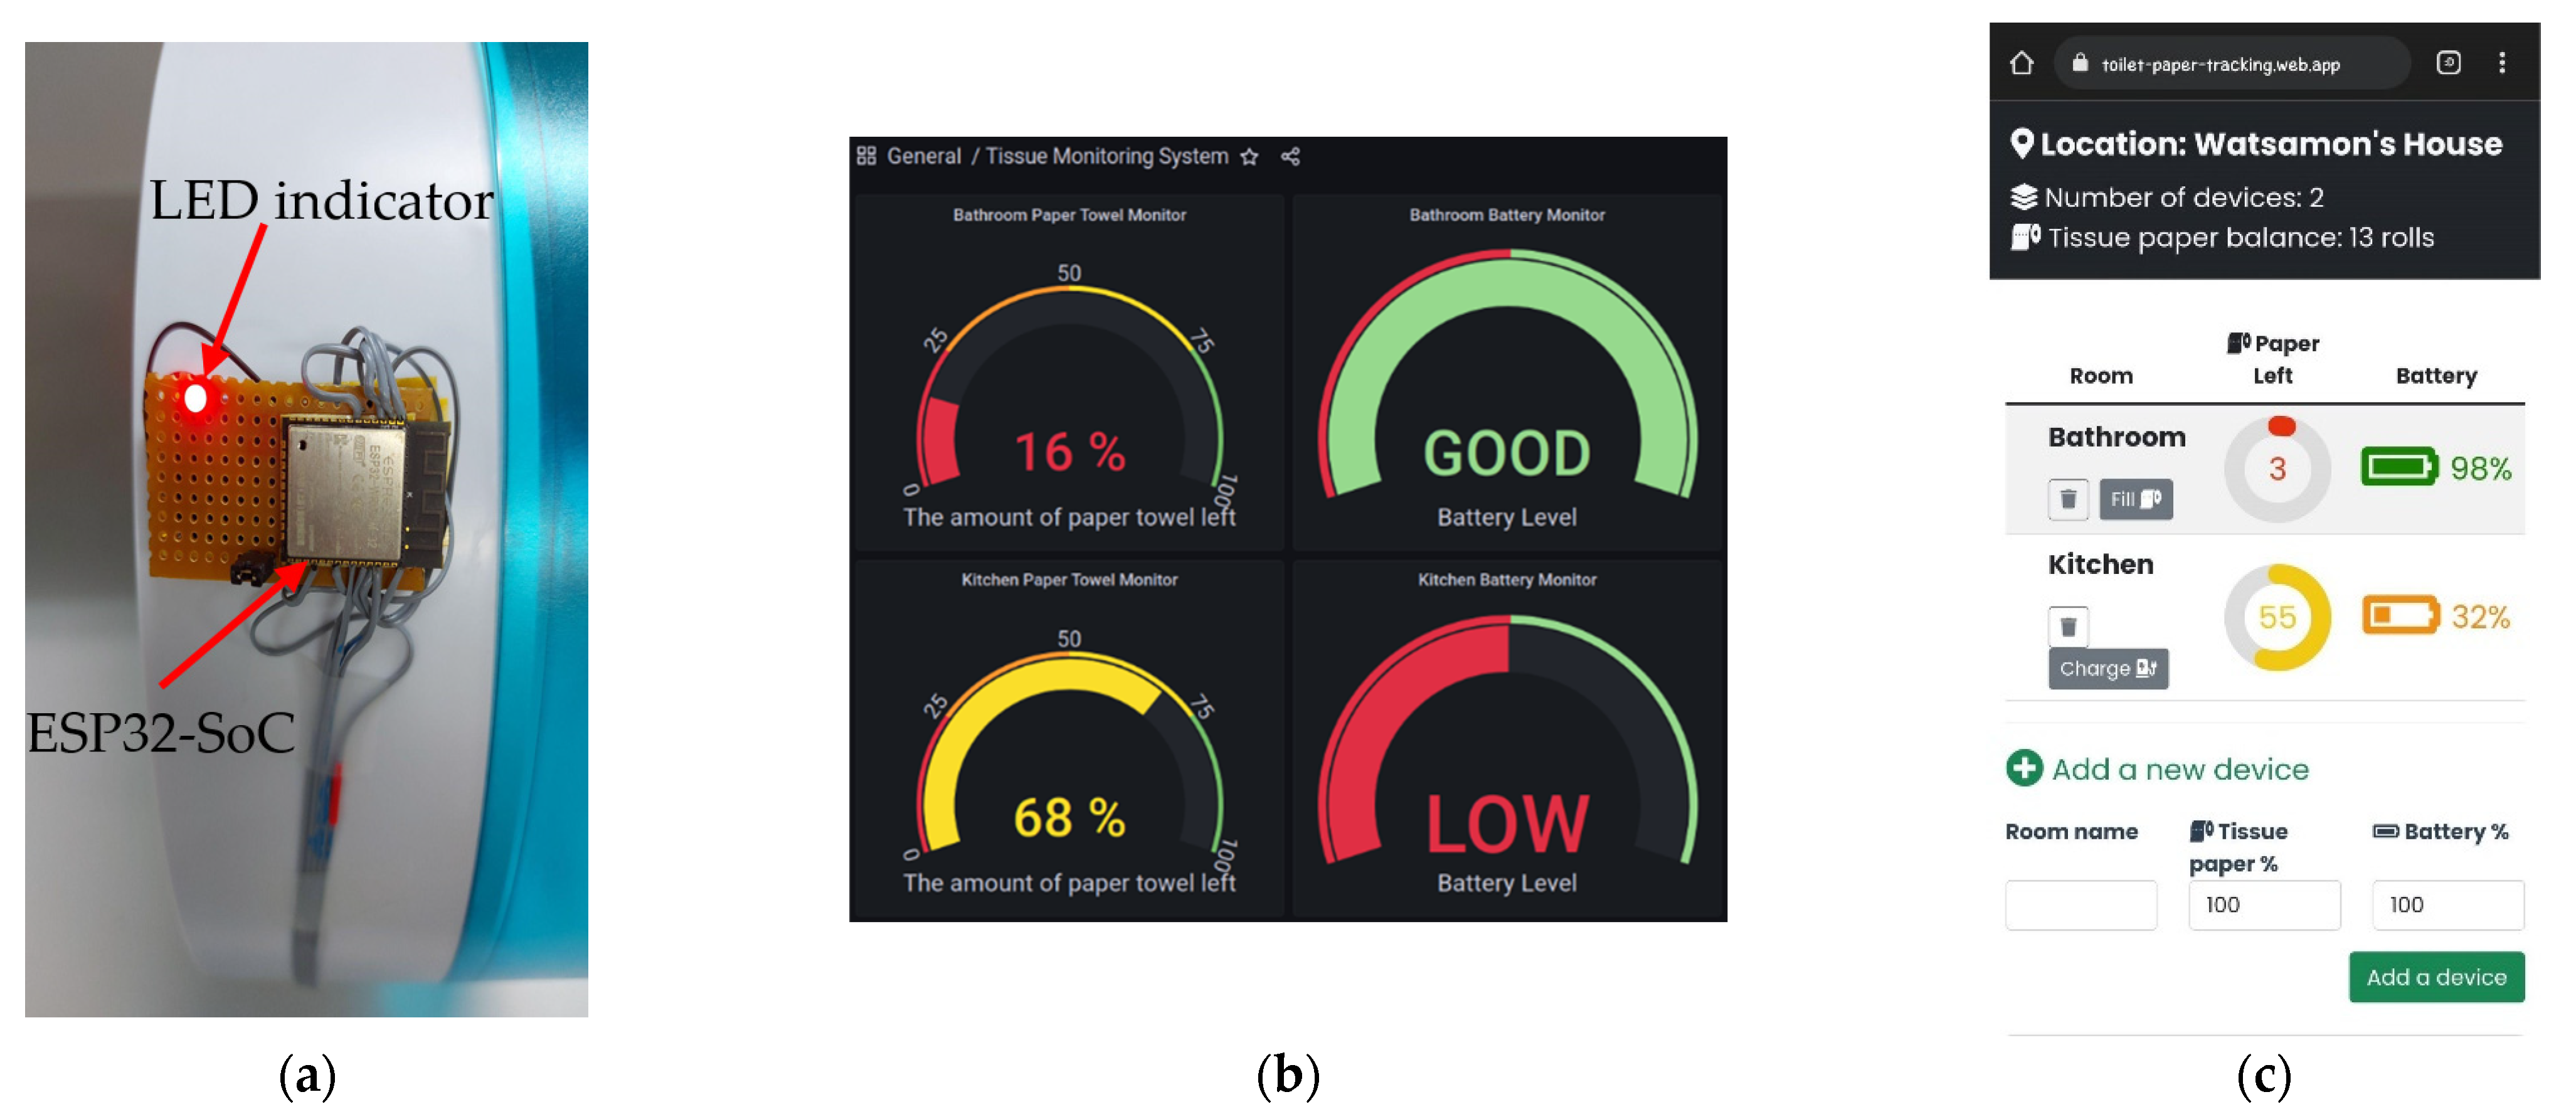
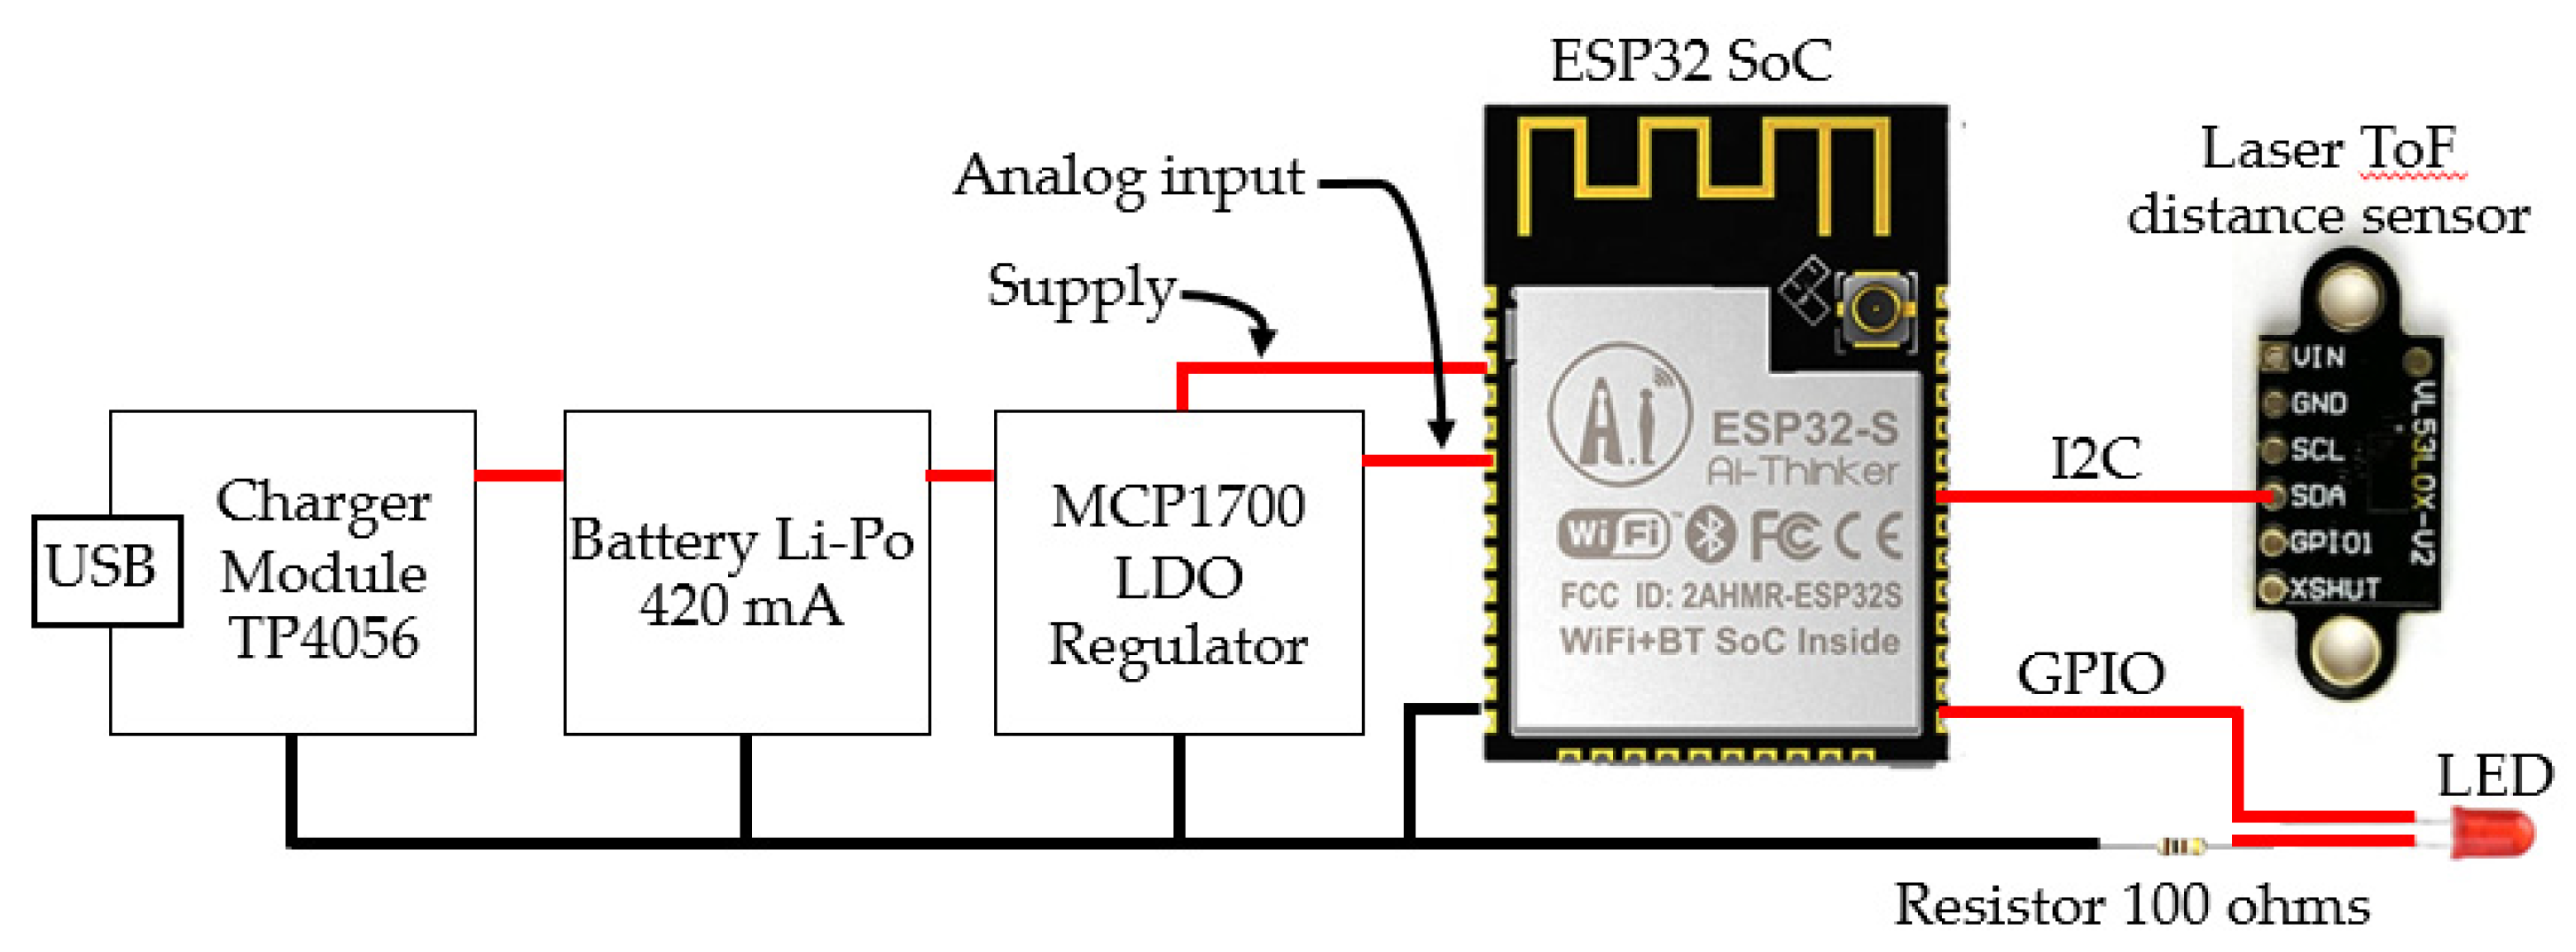
The hardware is based on six main components, including a laser ToF distance sensor, ESP32 SoC [
29], and light emitting diode (LED) indicator, as shown in
Figure 1a. A hardware block diagram is provided in
Figure 2. The ESP32 communicates with the distance sensors using the I2C protocol. The LDO regulator adjusts the voltage from the battery to be no more than 3.3 V, because a full 3.3 V battery outputs 4.2 V, which is more than the recommended supply for the ESP32 SoC. The LDO regulator’s output is connected both to the SoC power input and to its analog input pin in order to measure the battery voltage level over time. The charger module allows the system to operate continuously when the battery voltage drops below 3.1 V. The battery is connected to the charger module. The final component is the LED indicator. The LED shows the active status of the device. A list of all components and essential technical details is shown in
Table 1.
3.2. Sensor Calibration
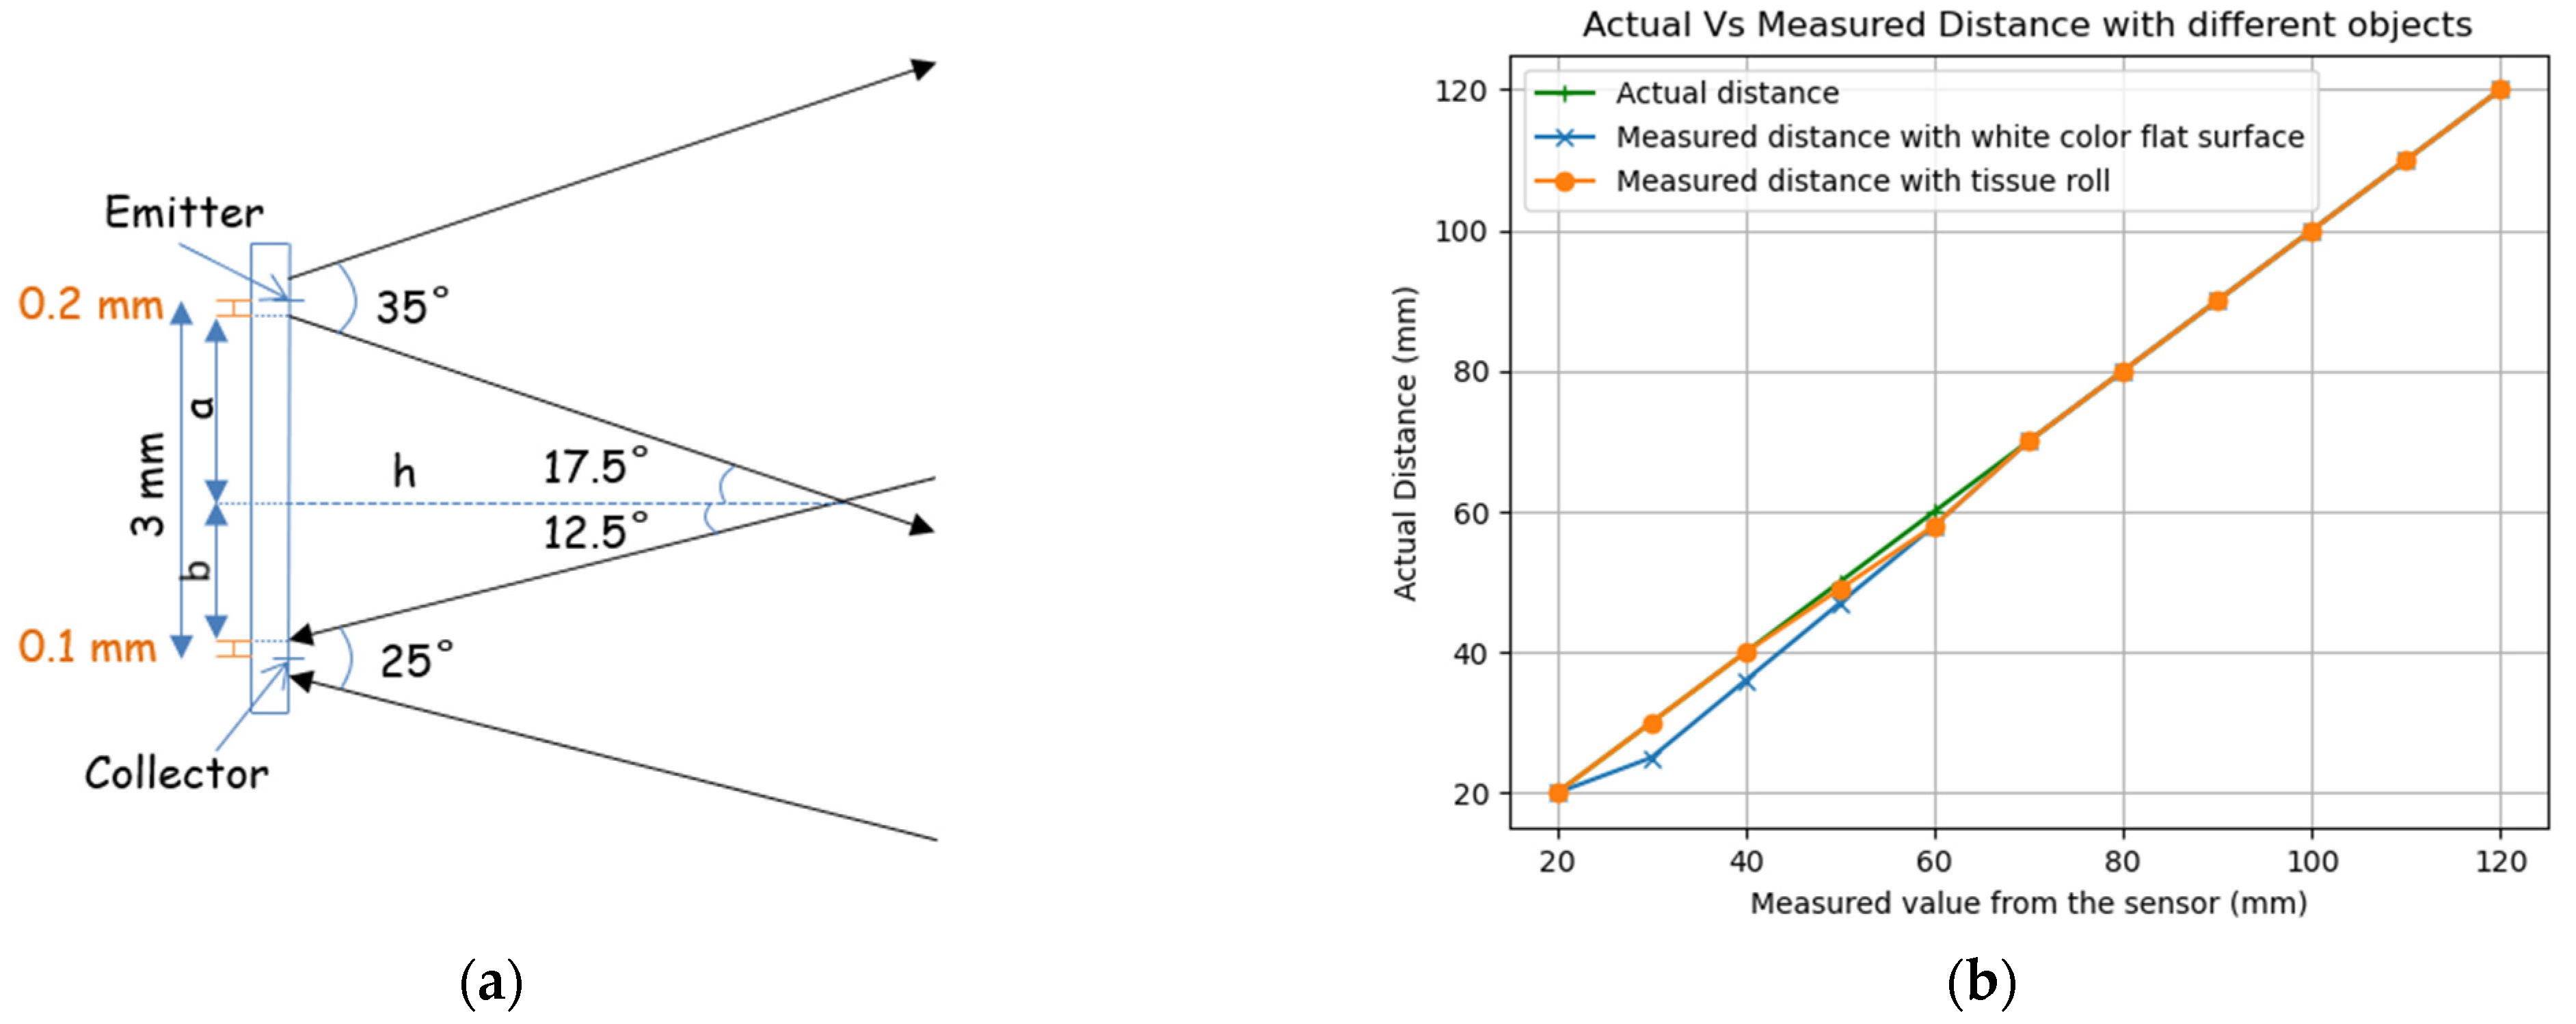
As shown in
Figure 3a, the emitter of the laser ToF sensor emits light, and the collector measures the reflected light. The shortest distance that the sensor can measure is calculated as
where
is the distance between the collector and the emitter (2.7 mm), and
is the distance from the sensor baseline to the intersection of the emitter’s light spread cone and the collector’s input cone.
The distance
calculated from Equation (1) is 5.03 mm. The offset calibration for our system is 10 mm. Thus, the actual offset calibration is 5.03 + 10 = 15.03 mm. The distance from the sensor to a full roll of paper is 15 mm in our proof of concept experiment. Thus, this sensor is suitable for our system. Actual distances between 20 mm and 120 mm were measured for different objects using the laser ToF sensor. We found a 1 to 2 mm error for short distances. A sensor calibration curve is shown in
Figure 3b.
3.3. Distance Measurement
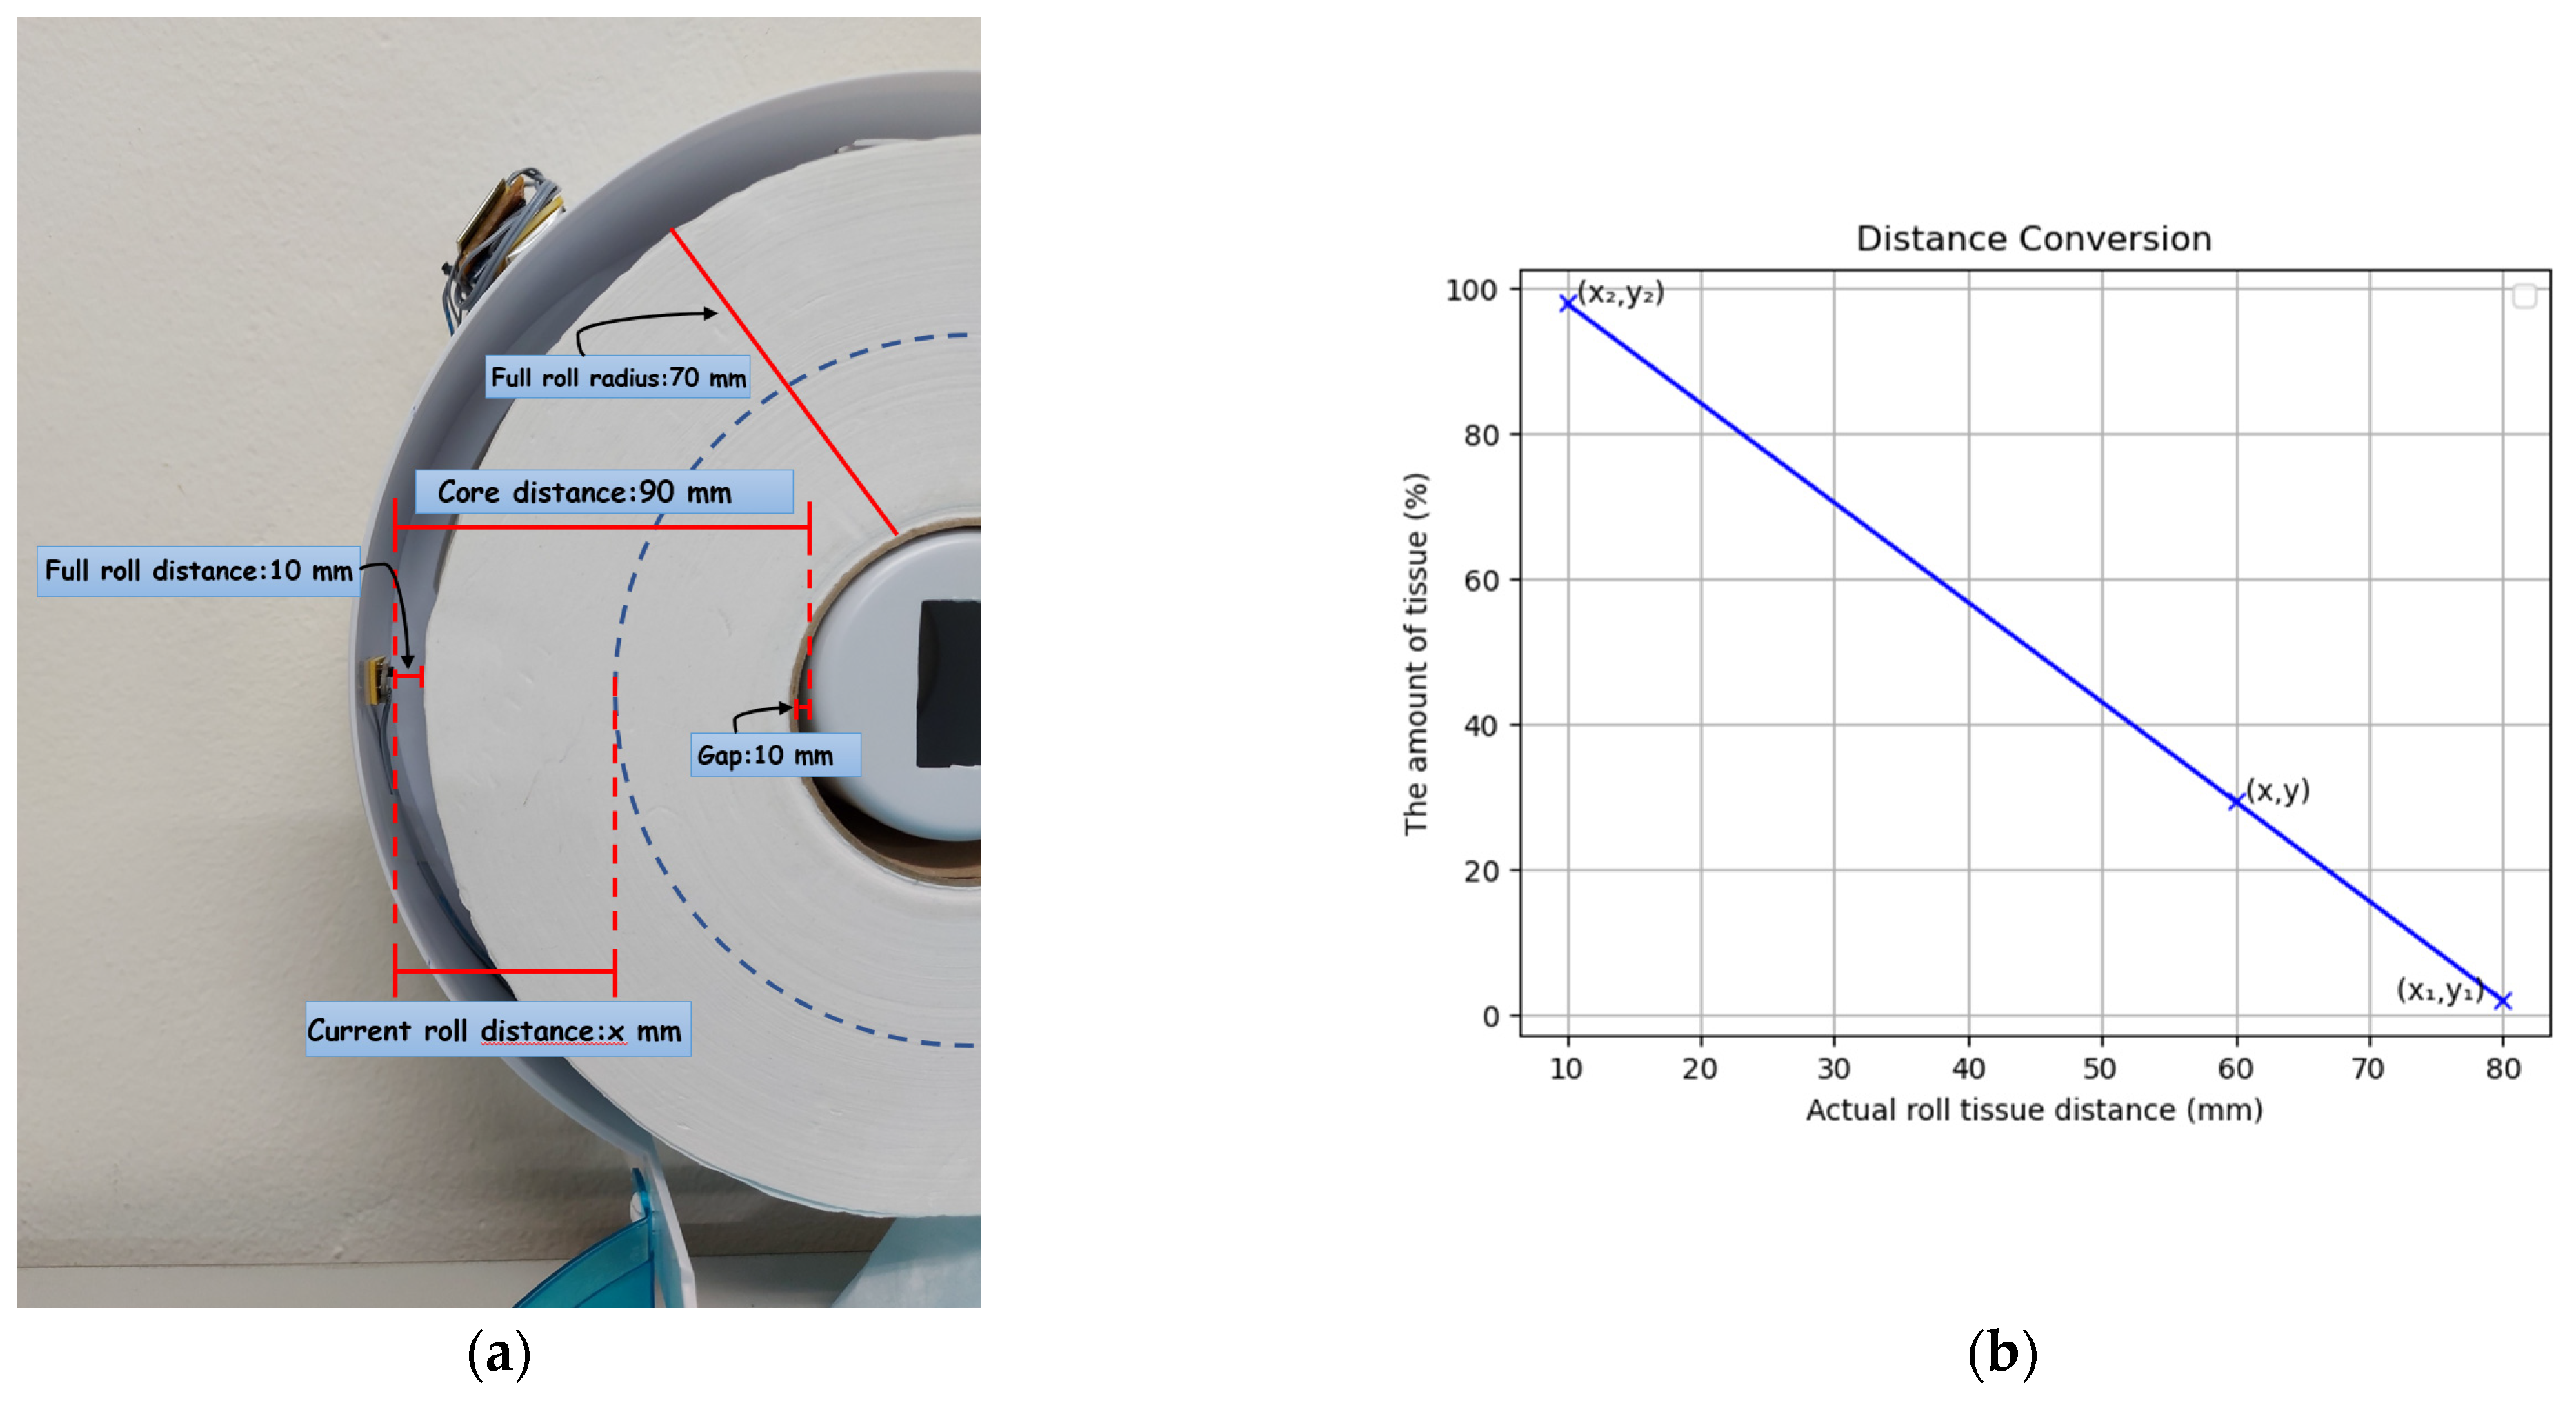
A tissue paper roll has a layered cylindrical shape, and the distances are measured as shown in
Figure 4a. The amount of tissue as a percentage
is calculated by
where
is actual roll–tissue distance (in mm),
is the slope of the linear relationship, and
and
are the coordinates. It can be seen in
Figure 4b. The numeric constant is based on the acceptable error and the maximum radius tissue. The system continuously measures the distance between the sensor and the object during full power mode.
3.4. Battery Voltage Measurement
The actual battery voltage level is computed as
The ESP32 analog input can measure voltage levels between 0 V and 3.3 V. The corresponding ADC reading range is from 0 to 4095. If the measured battery voltage is less than 3.1 V, the ESP32 publishes a “0” message to a MQTT topic, and the battery voltage status is shown as low on the Grafana dashboard. If the measured battery voltage is not less than 3.1 V, the ESP32 publishes a “1” message on the topic, and the battery voltage status is shown as good on the Grafana dashboard.
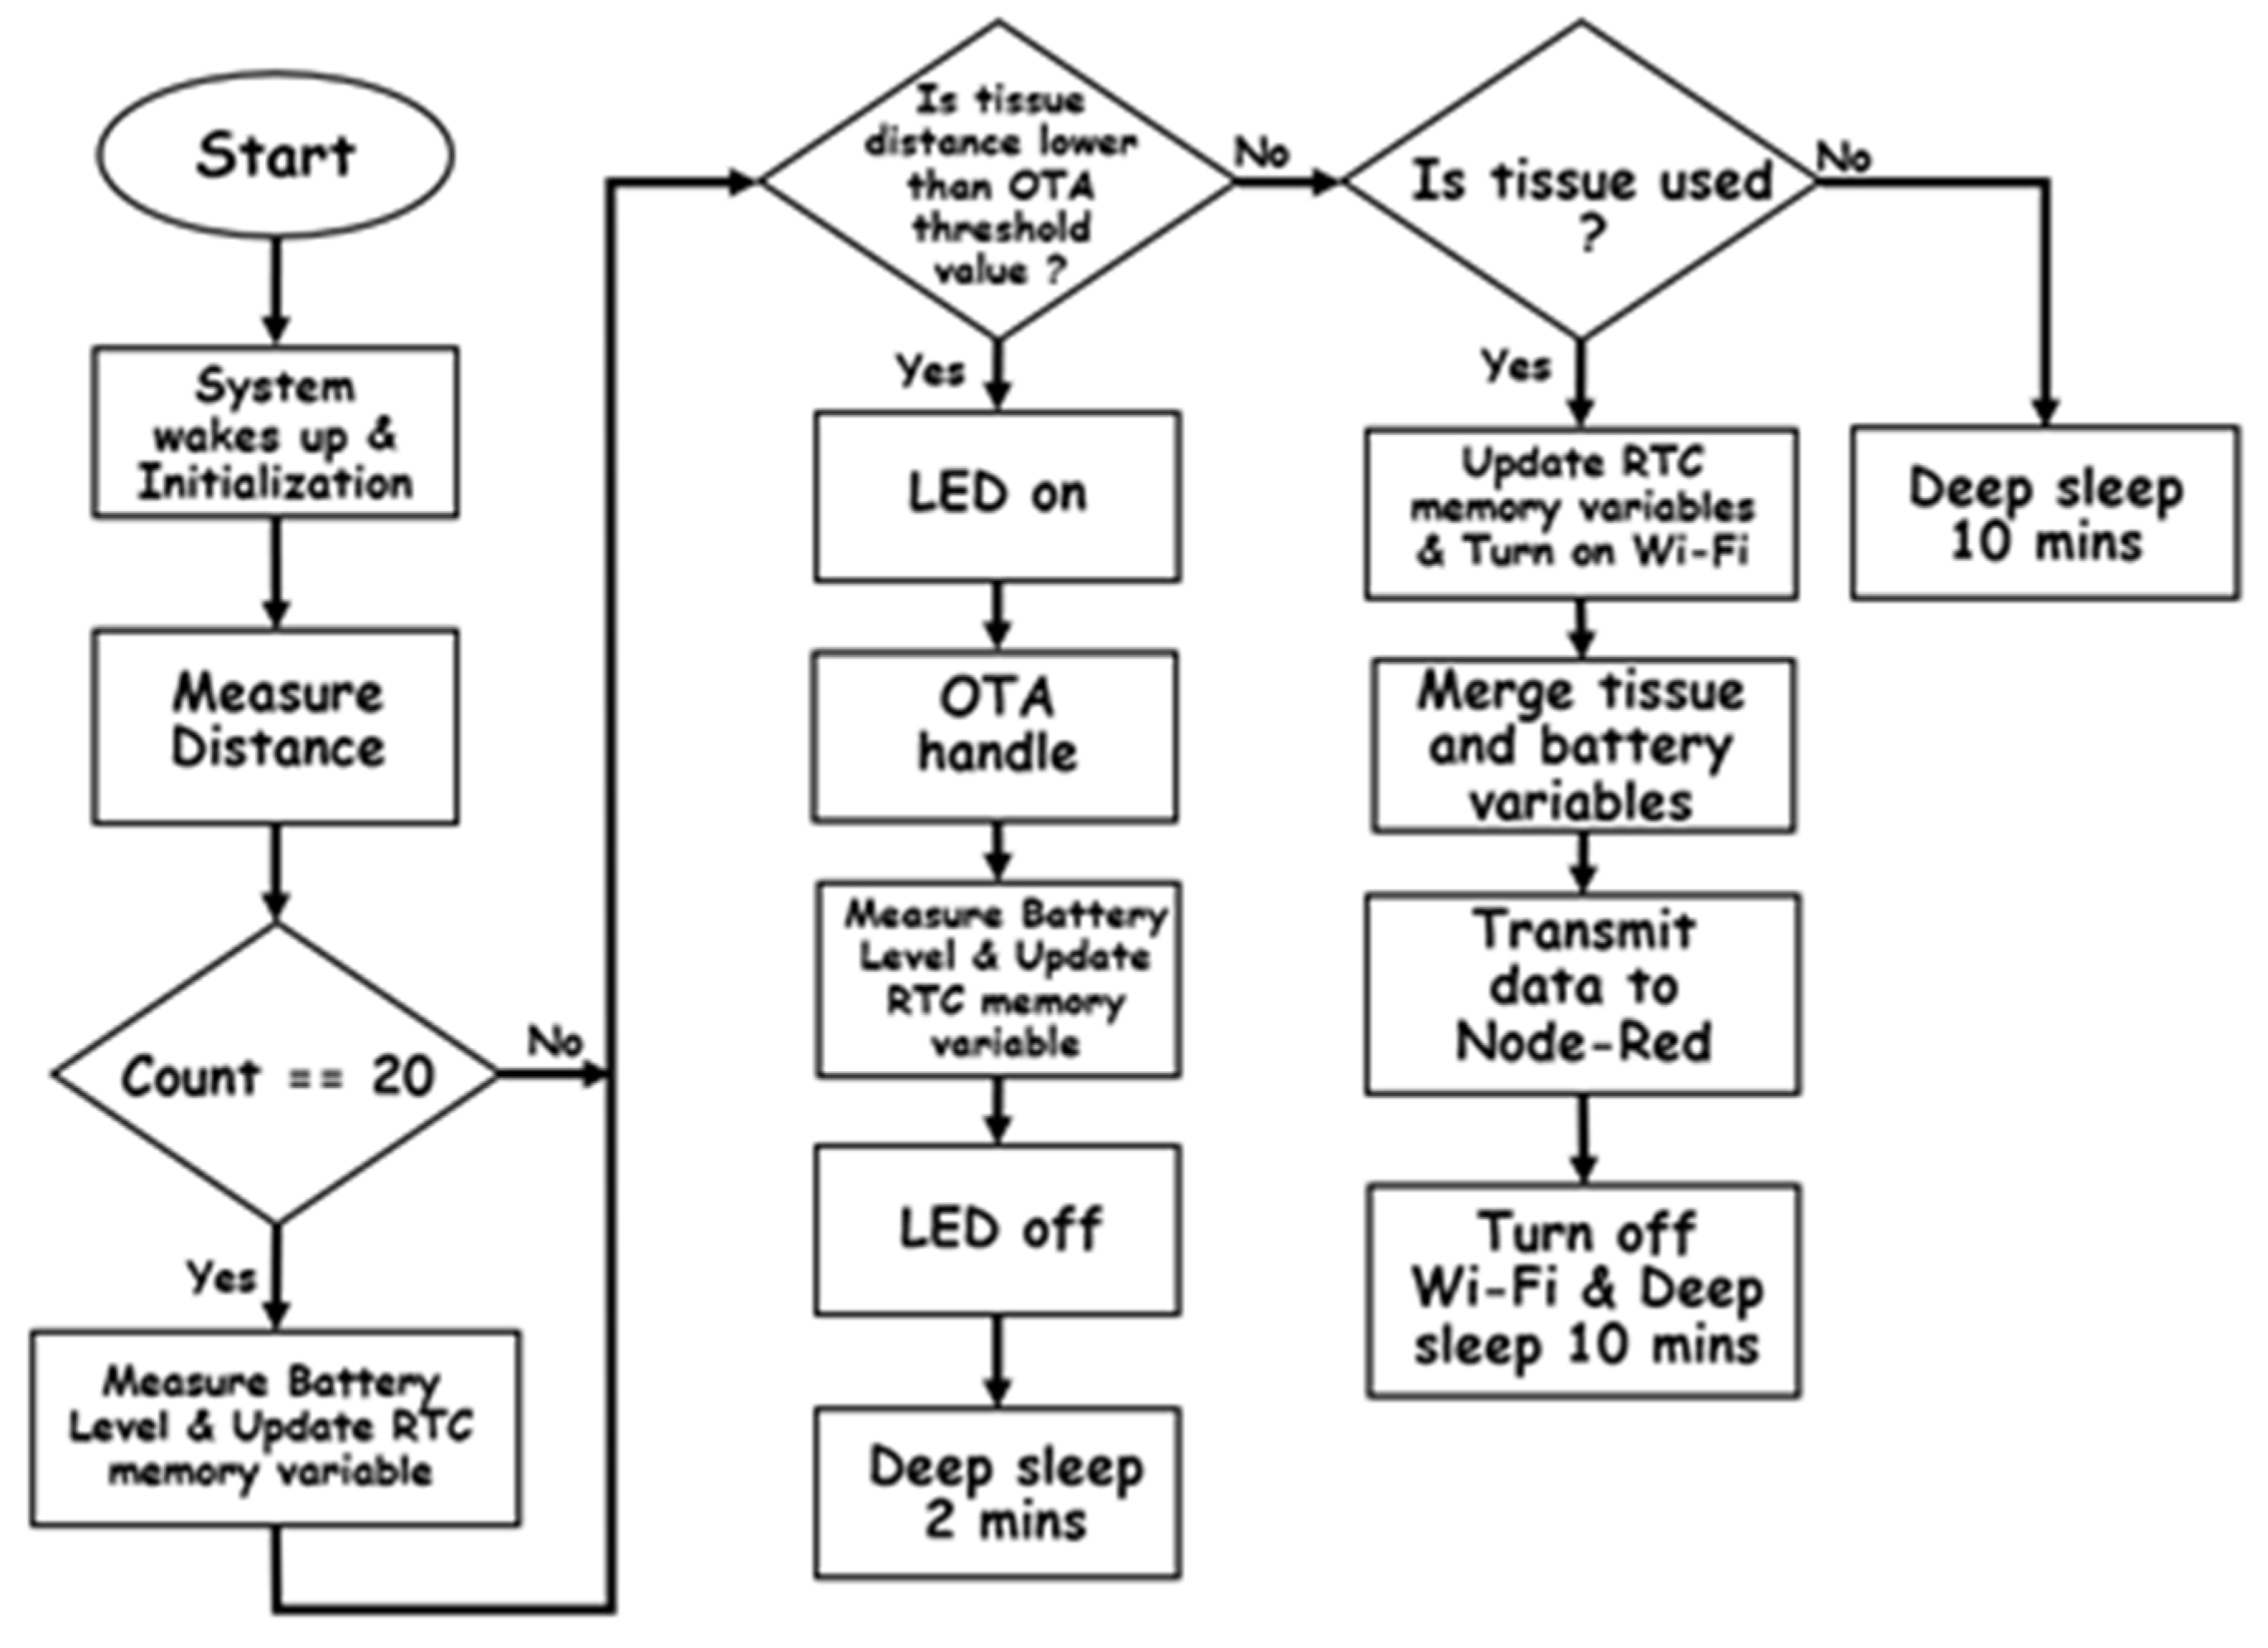
3.5. Software Architecture and Adaptive Power Algorithm
We developed C code, compiled it, and uploaded the resulting program to the ESP board using the Arduino IDE [
30]. There are three conditions used to save power in the tissue monitoring system as shown in
Figure 5.
First, the system has to declare global variables and verify I2C and ADC correctness at initialization time because the system uses the memory of the real-time clock (RTC) to save data. The system reduces the CPU frequency of the ESP32 SoC from 240 MHz to 80 MHz to reduce power consumption. The distance between the sensor installation point and a full roll of tissue is too short, so the sensor has to be set in high precision mode to minimize error. The distance sensor measures the distance between the sensor’s laser point and the paper. The distance is converted from mm units to a power supply percentage. However, the sensor wakes up and sleeps periodically to save power. At the same time, a LED blinks to indicate that the system is working. The battery level is only measured once per day, to further minimize power. Battery voltage level values are calculated and verified as either good or low. A good value is stored in RTC memory if the battery voltage is 3.1 V or above. On the other hand, if the voltage value is below 3.1 V, a low value is stored instead. The system uses the past distance compared with the current distance before going to the next step.
The first condition is used when an over-the-air (OTA) firmware upgrade is needed. In this condition, the distance must be below a pre-defined distance. The LED turns on in order to indicate that the system is ready to update through OTA. If the system does not receive the firmware through an OTA, the system measures only battery voltage level and saves its value to the RTC memory; then, the LED is turned off and sleeps for 2 min.
When the tissue status is the same as the last status, the system moves to the second condition. This state verifies that the current distance is equal to the past distance. In this condition, the device does not connect to Wi-Fi. It simply goes to sleep for 10 min.
In the last (third) condition, the CPU frequency changes to 160 MHz so that the ESP32 SoC can connect to Wi-Fi sufficiently quickly. After the system overwrites the current distance data in the RTC memory, the Wi-Fi turns on. The measured paper and battery level variables are aggregated into a single data buffer to minimize transmission power. The five-byte payload is sent to a Node-RED server, running locally or over the Internet using the local Wi-Fi network. Then the system returns to sleep mode for 10 min.
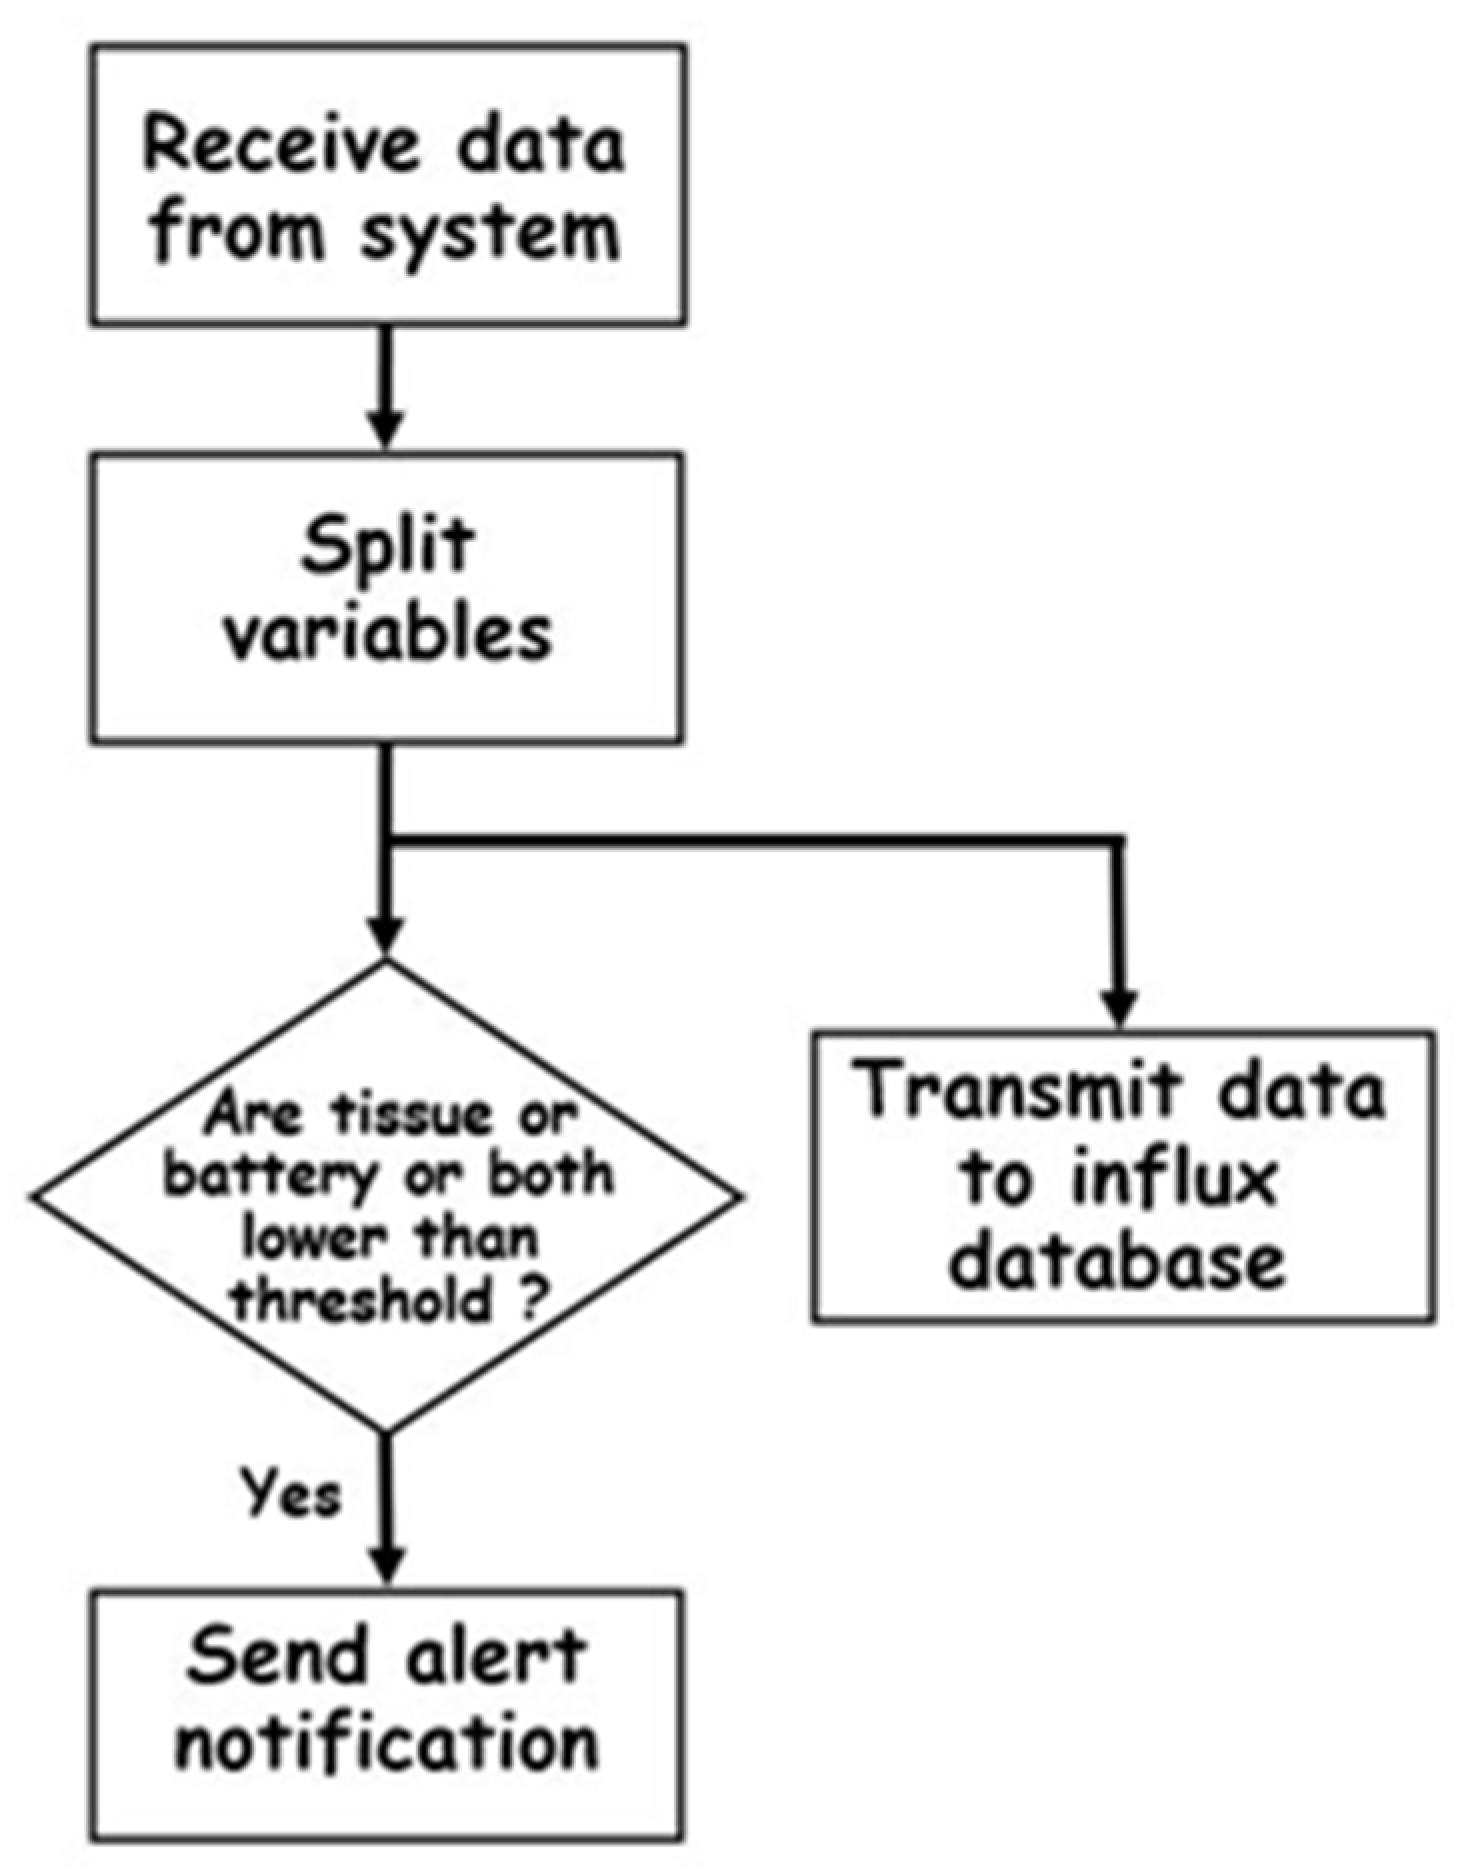
The five-byte payload is published via the MQTT server. The Node-RED server subscribes to the MQTT topic and receives the data from the TMS. The Node-RED server is connected to an Influx Database (DB). The data in the Influx DB are visualized on the Grafana dashboard. Node-RED receives the TMS payload and splits it into the two variables, as shown in
Figure 6 [
31]. The paper supply level and battery voltage are sent directly to the Influx DB. The Influx DB connects to the Grafana dashboard [
32], which can pull data directly from the database and show them on the dashboard. Alternatively, the amount of tissue and battery are verified as being below the threshold or as not using code deployed to Node-RED. The paper supply level threshold and battery level threshold are set separately, at 15% and 3.1 V, respectively. Users receive email notifications from the Node-RED service when the battery level or paper supply level are below the threshold. The email notification function can be set up with more recipients, and the topics and content can be adjusted according to the users’ needs.
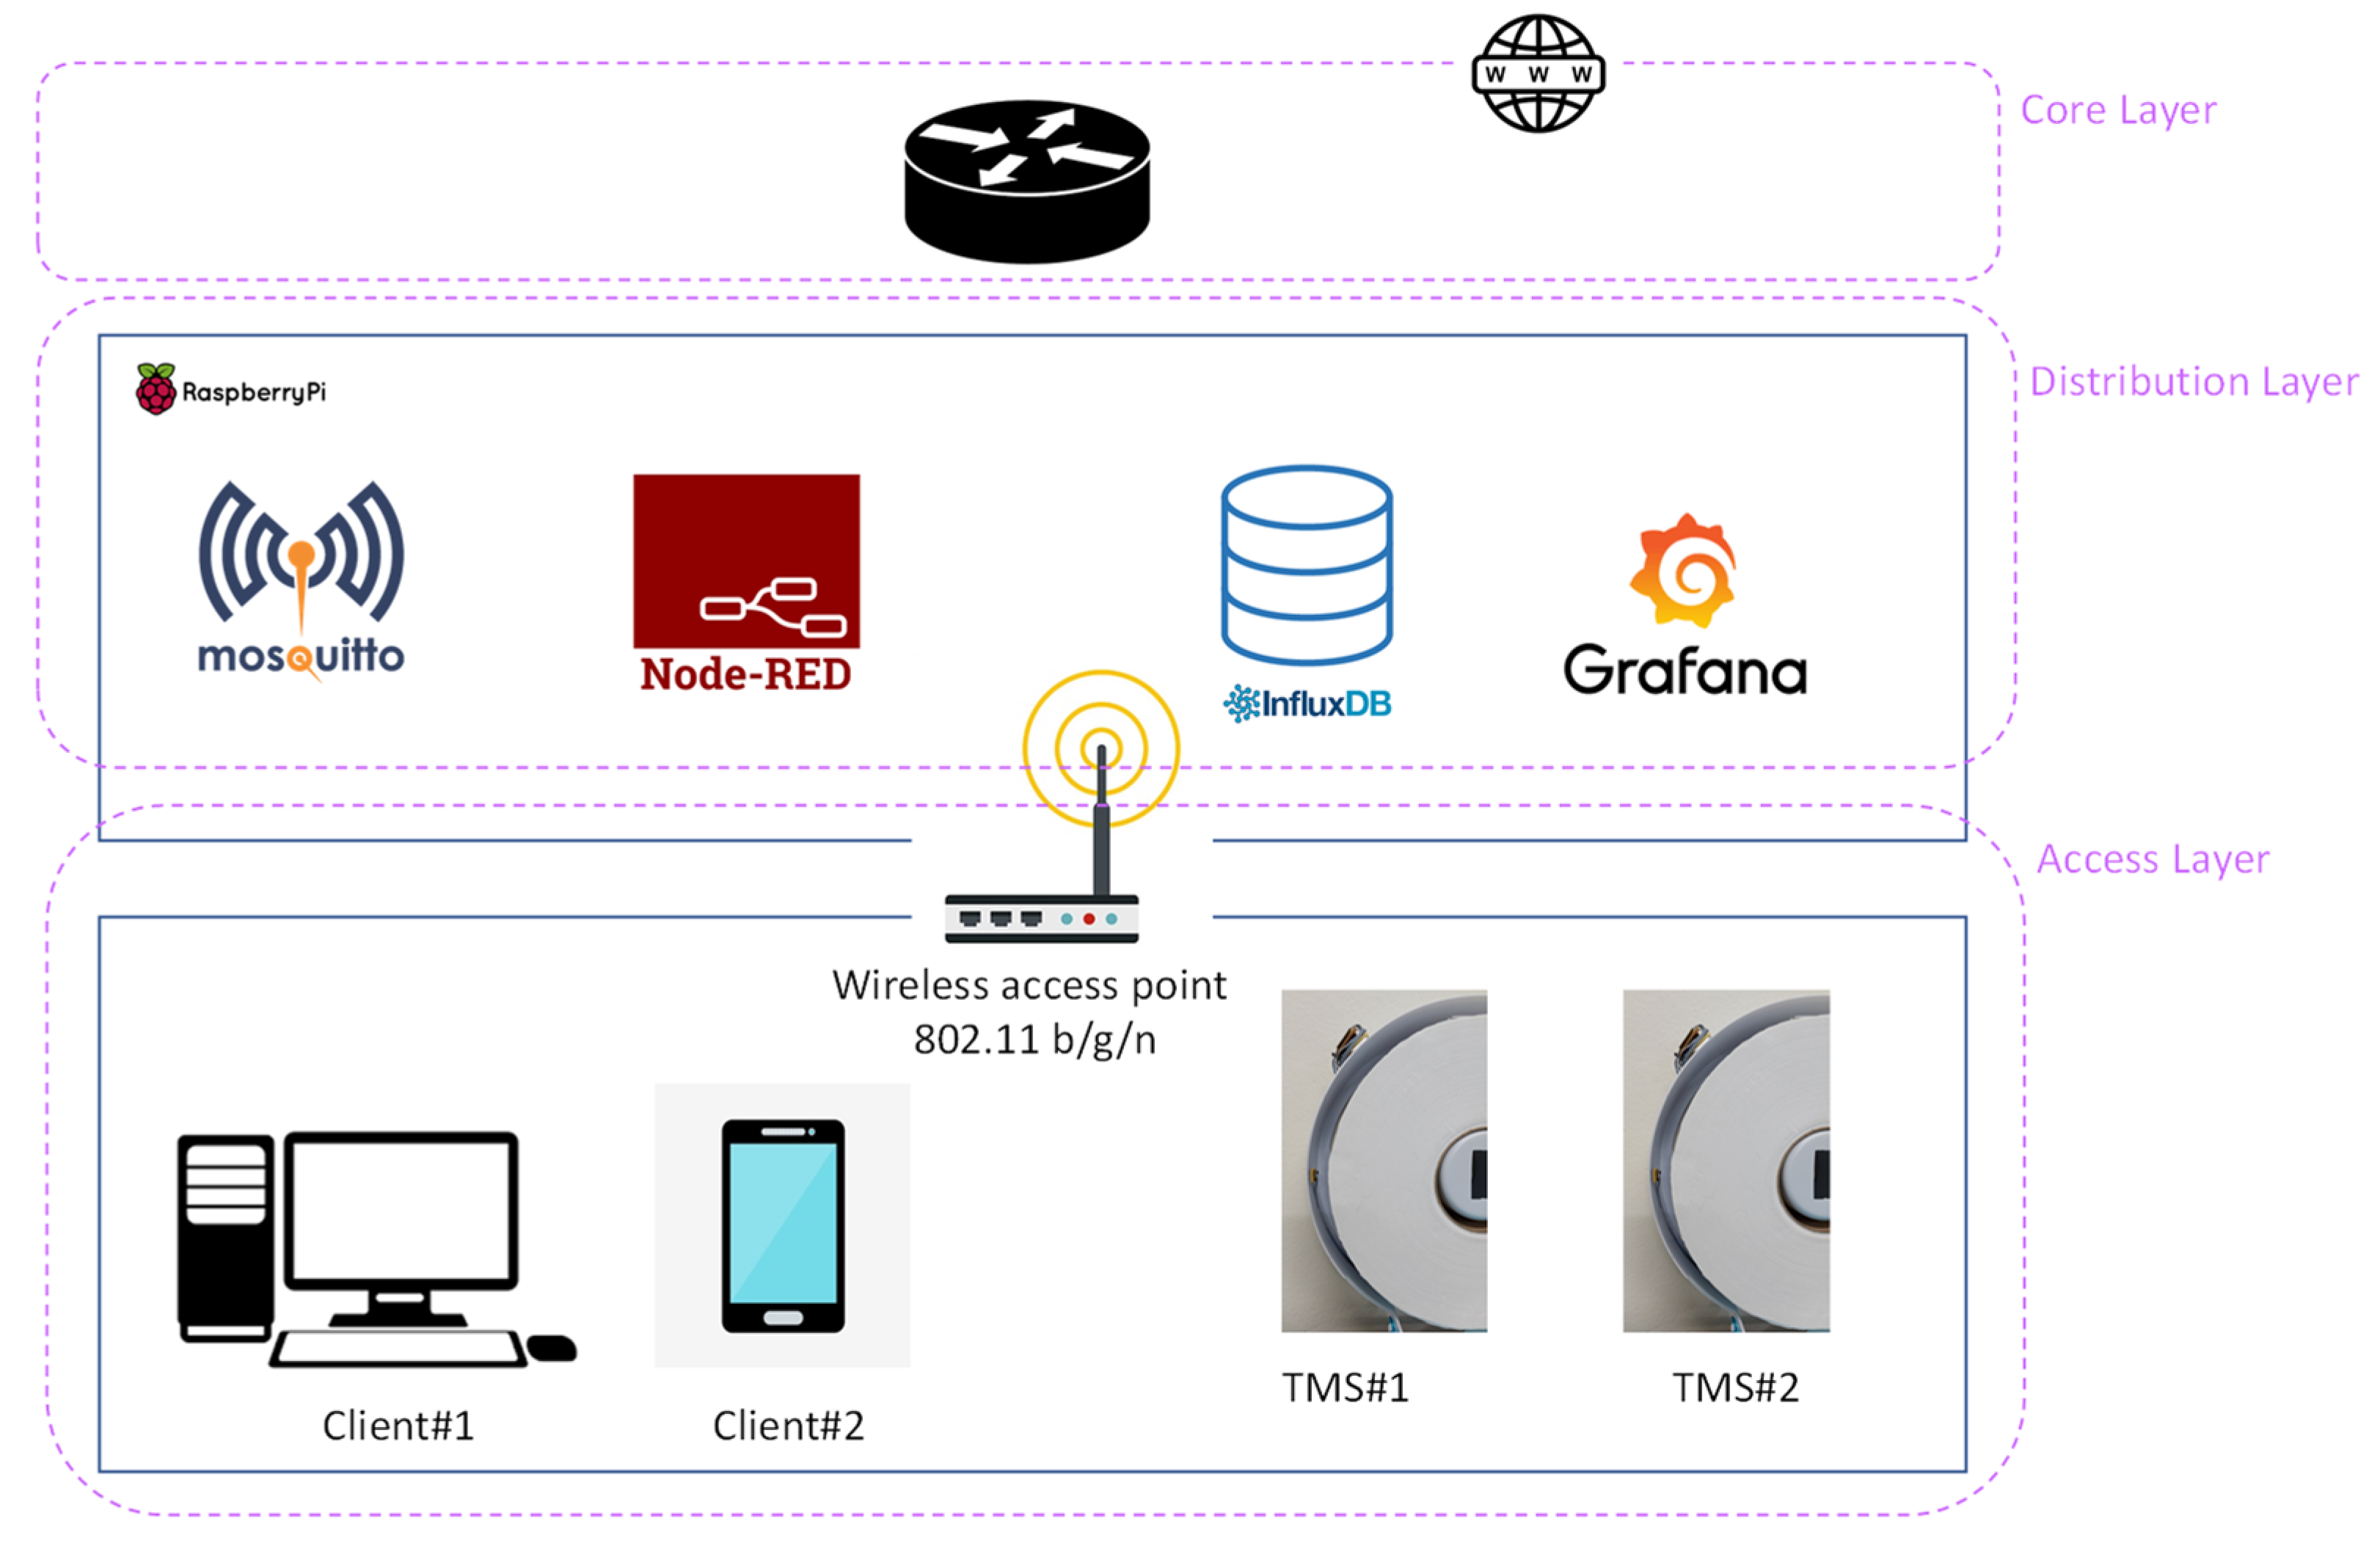
3.6. Network Architecture
We selected Wi-Fi communication based on its high availability, mobility, IP support, and leverage of low power architecture. The system is configured in a star topology. A high-level overview of the system is shown in
Figure 7.
3.7. Security Features
Our solution is based on a selection of the service set identifier (SSID), Wi-Fi security, and Grafana authentication. First, the SSID is the name of wireless service to be joined and has to be used with Wi-Fi protected access II (WPA2) and pre-shared key (PSK) configurations to authenticate and encrypt data. Next, Grafana login authentication is used to prevent anyone who is not the device owner from logging in and viewing. A demilitarized zone (DMZ) network architecture is used to secure the nodes. Port 3000 on the Raspberry Pi is forwarded to the Internet through the router firewall.
3.8. Data Storage and Visualization
Our solution uses the Influx DB platform as a database. Influx DB is a time series database (TSDB). The TSDB is used to store data that change over the time. This storage is easy to integrate with other components such as a Grafana or Prometheus dashboard. Users can retrieve data for later analysis. For the visualization, there are many open source and closed source dashboard tools. The key highlights of the Grafana dashboard are that it connects easily and flexibly to the databases, with many options to adjust the dashboard and configurable alert functions when values rise or fall beyond set points. Grafana runs on a default port of 3000. The two parameters, the amount of tissue and the battery voltage in the bathroom or kitchen, are monitored using the Grafana dashboard.
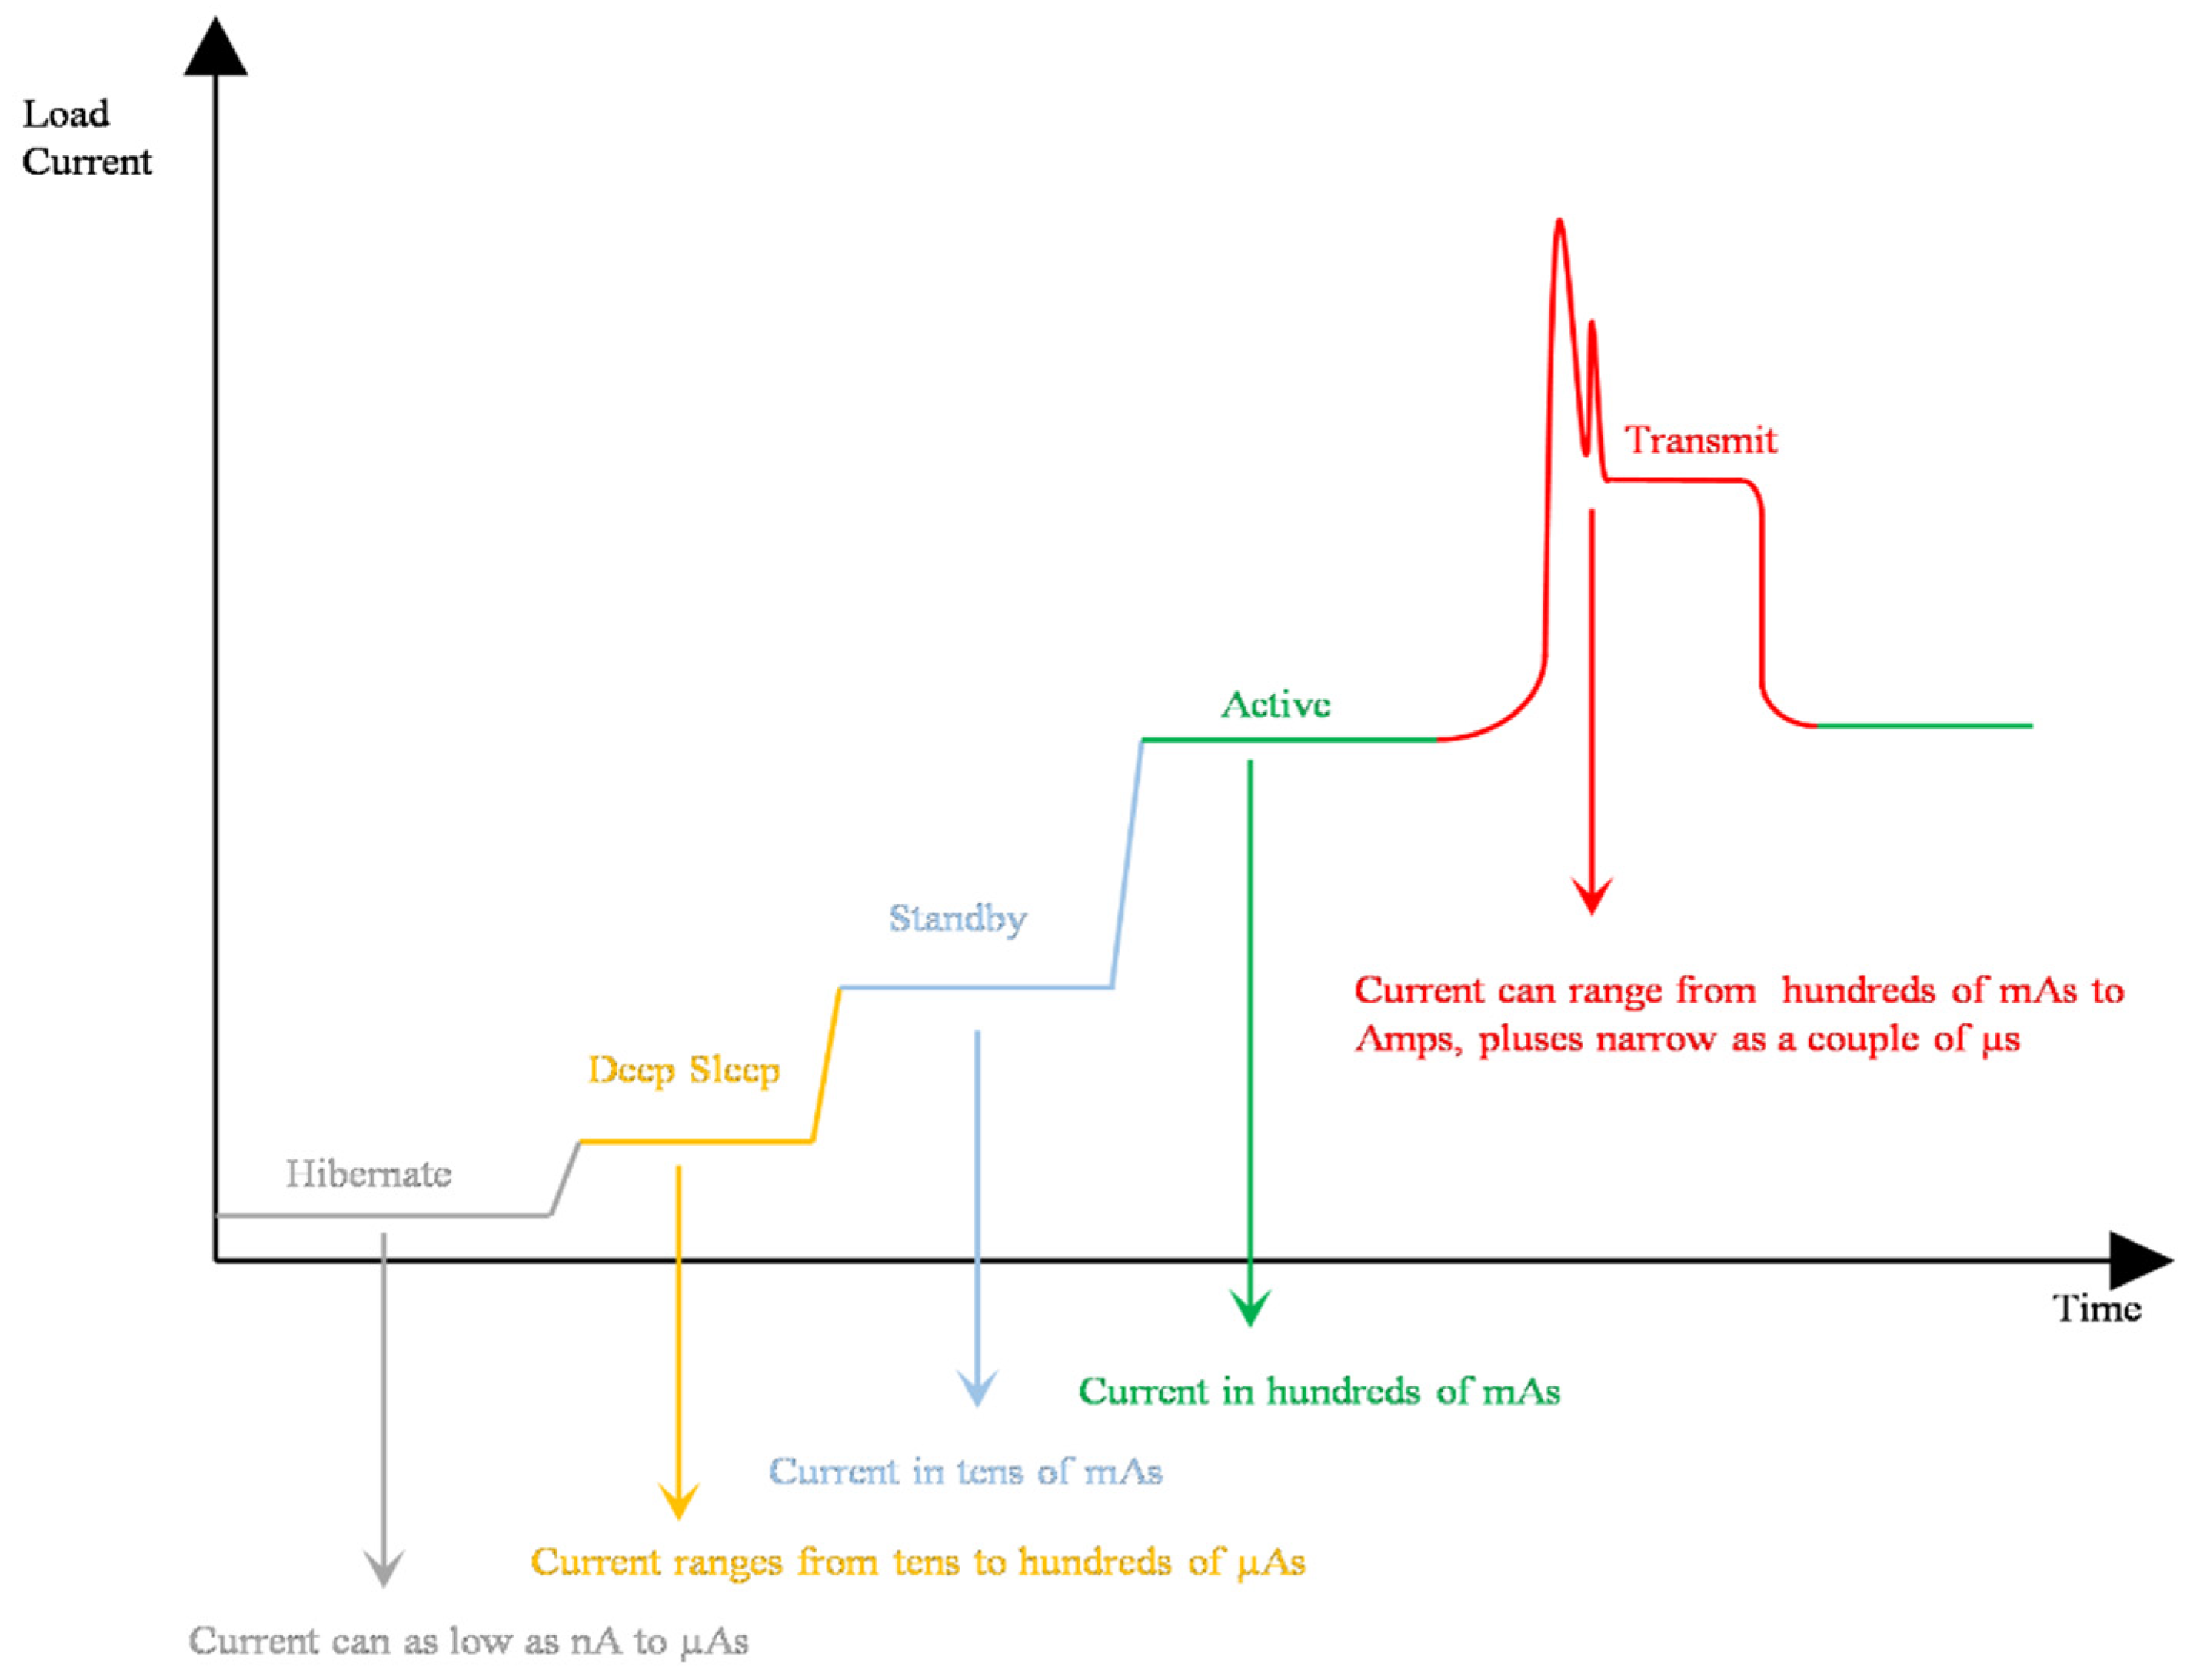
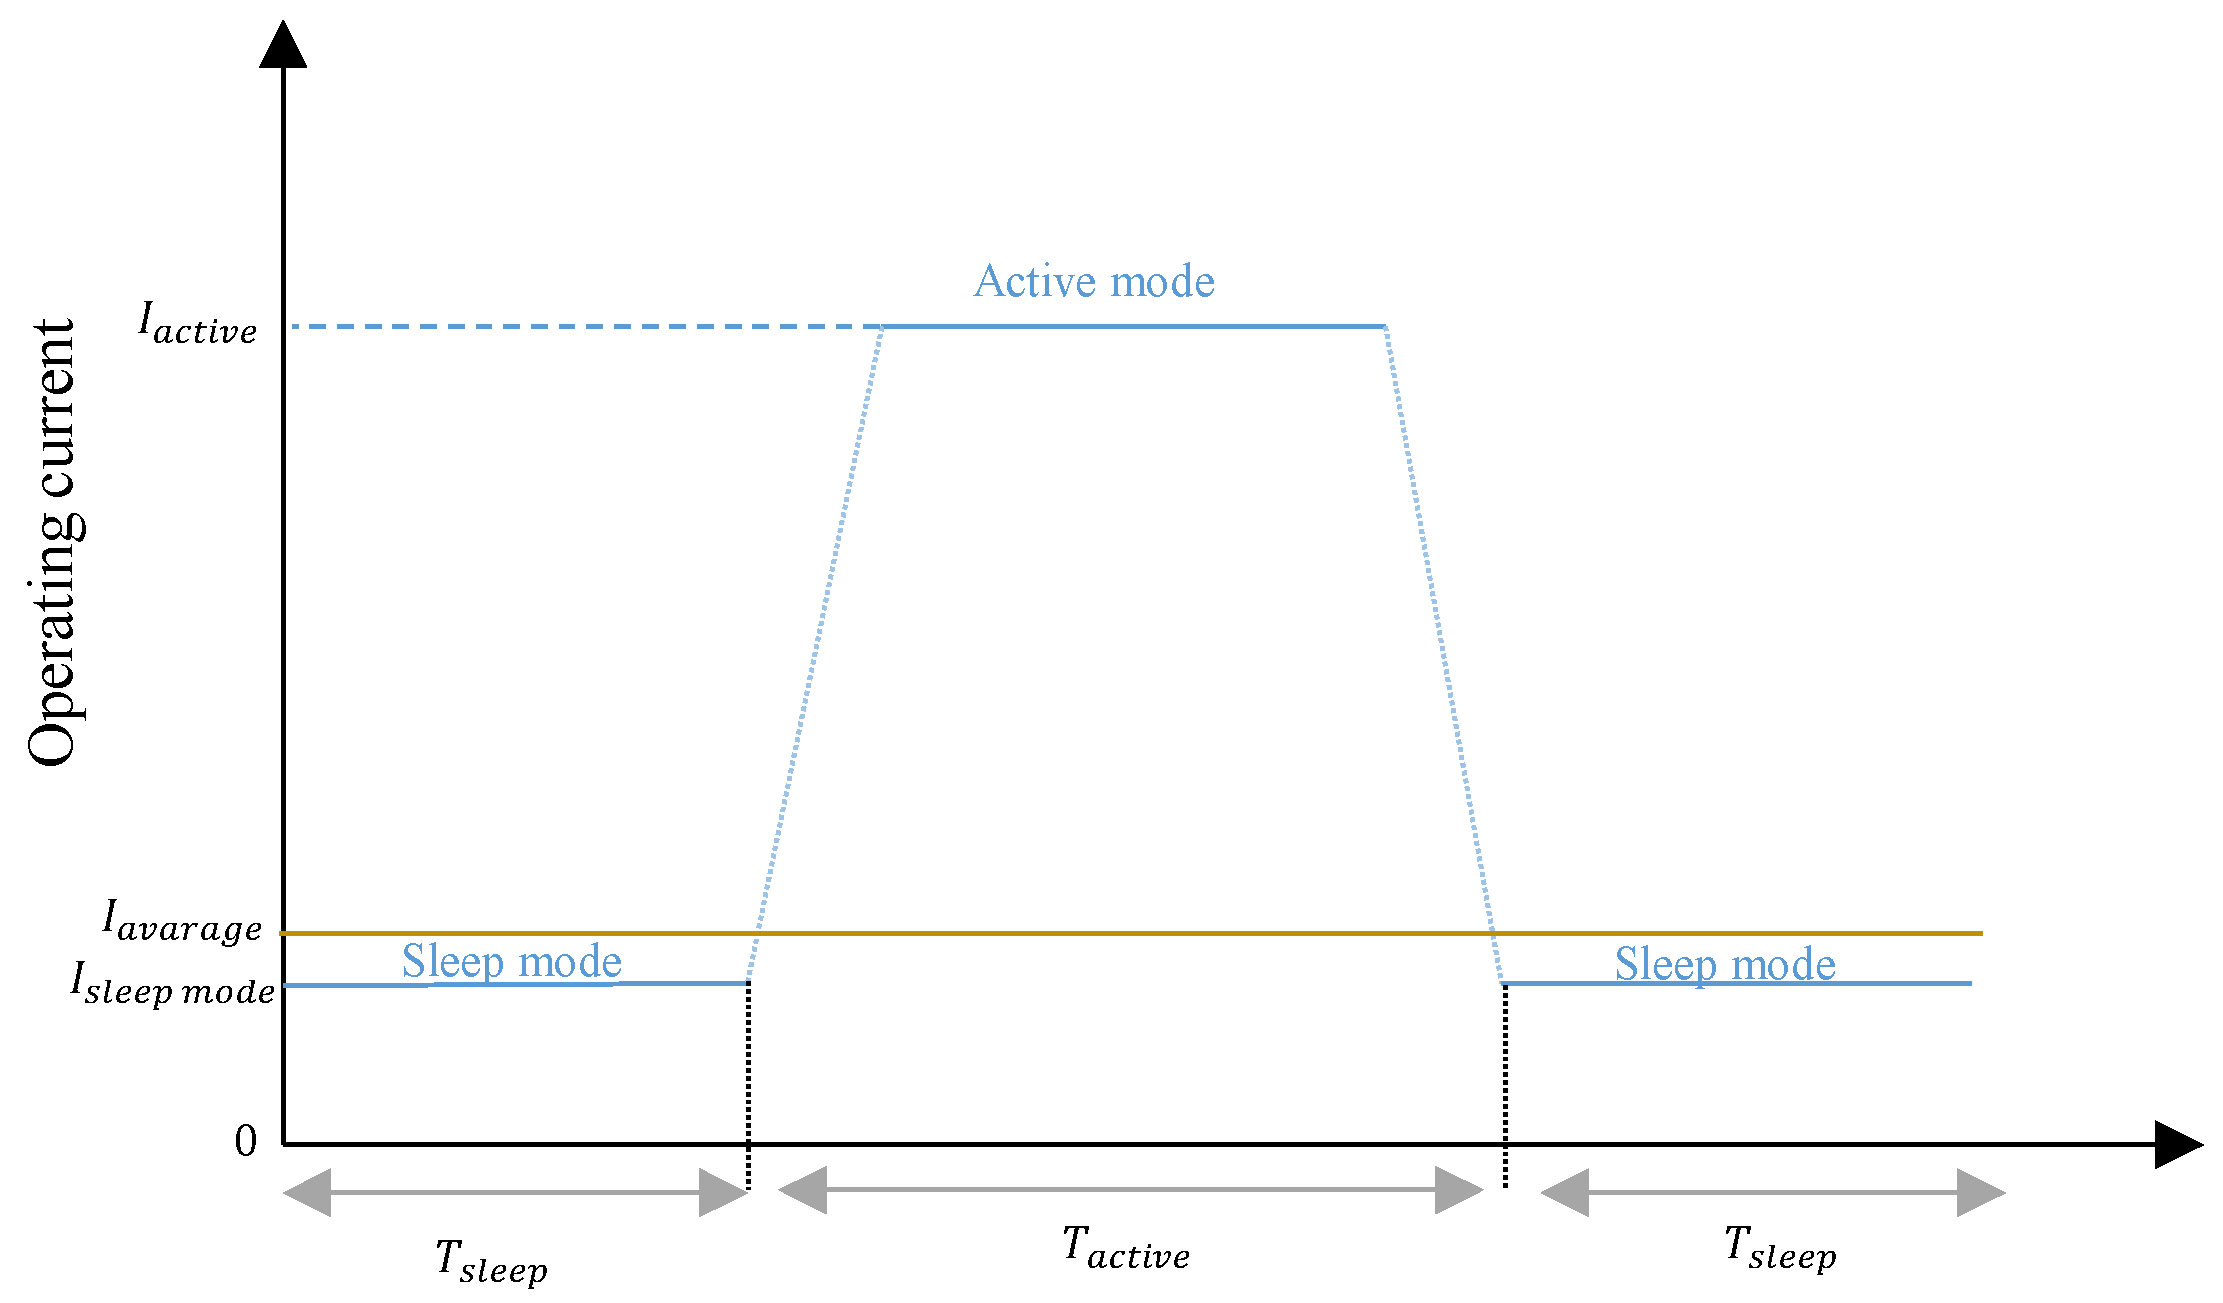
3.9. Power Consumption
Power consumption is very important, because the TMS has to be installed in a place without access to electricity mains. The system therefore relies entirely on a battery. Battery life determines the usefulness of the system. In addition, during the system modeling phase it is vital to select low power sensors and electronics components. Low powered components are selected for the design with minimal external components. In our work, the LDO regulator’s quiescent current is 1.6 µA, and the sensor’s sleep current is typically 5 µA.
The typical SoC has many power modes, including deep sleep mode, sleep mode, standby mode, and transmission mode. The simplified plot in
Figure 8 shows these different modes.
The maximum current consumption occurs during the transmission. There are dynamic variations in the current measurement, ranging from a few microamperes to hundreds of milliamperes. In addition, during the transmitting stage, a short current burst occurres, lasting between a microsecond and a millisecond. The battery life is estimated from the capture of the load current profile. However, in practice, the load current profile is not as simple as that shown in
Figure 8. An accurate evaluation of this type of current profile requires a measuring instrument that has acceptable sensitivity, dynamic range, sampling speed, and bandwidth. Still our method is a cost-effective alternative that is also helpful for identifying problems and transient currents in electronic components. Such problems, once identified, can be later addressed by hardware modifications or firmware modifications to reduce the power consumption. There is no standardization of terms used in describing the power modes. In this paper, terminology derived from that of the ESPRESSIF ESP32 family SoC. In this application, we use deep sleep mode and active mode programmed through the open source ARDUINO IDE. In deep sleep mode, Wi-Fi connection data are stored in RTC memory. The SoC needs full initialization to exit from this mode. The SoC’s active mode can turn on Wi-Fi and is able to transmit and receive data. This is the highest power consumption mode. The total energy consumption of the system including all the modes can be calculated as Equation (6), where
,
,
denote energy, supply voltage, number of power modes, and current consumption, respectively. The charge consumption of the battery in different modes can be denoted as in Equation (7) in amp-seconds. The battery can be selected based upon the system’s targeted operating lifetime and the charge consumption of the application.
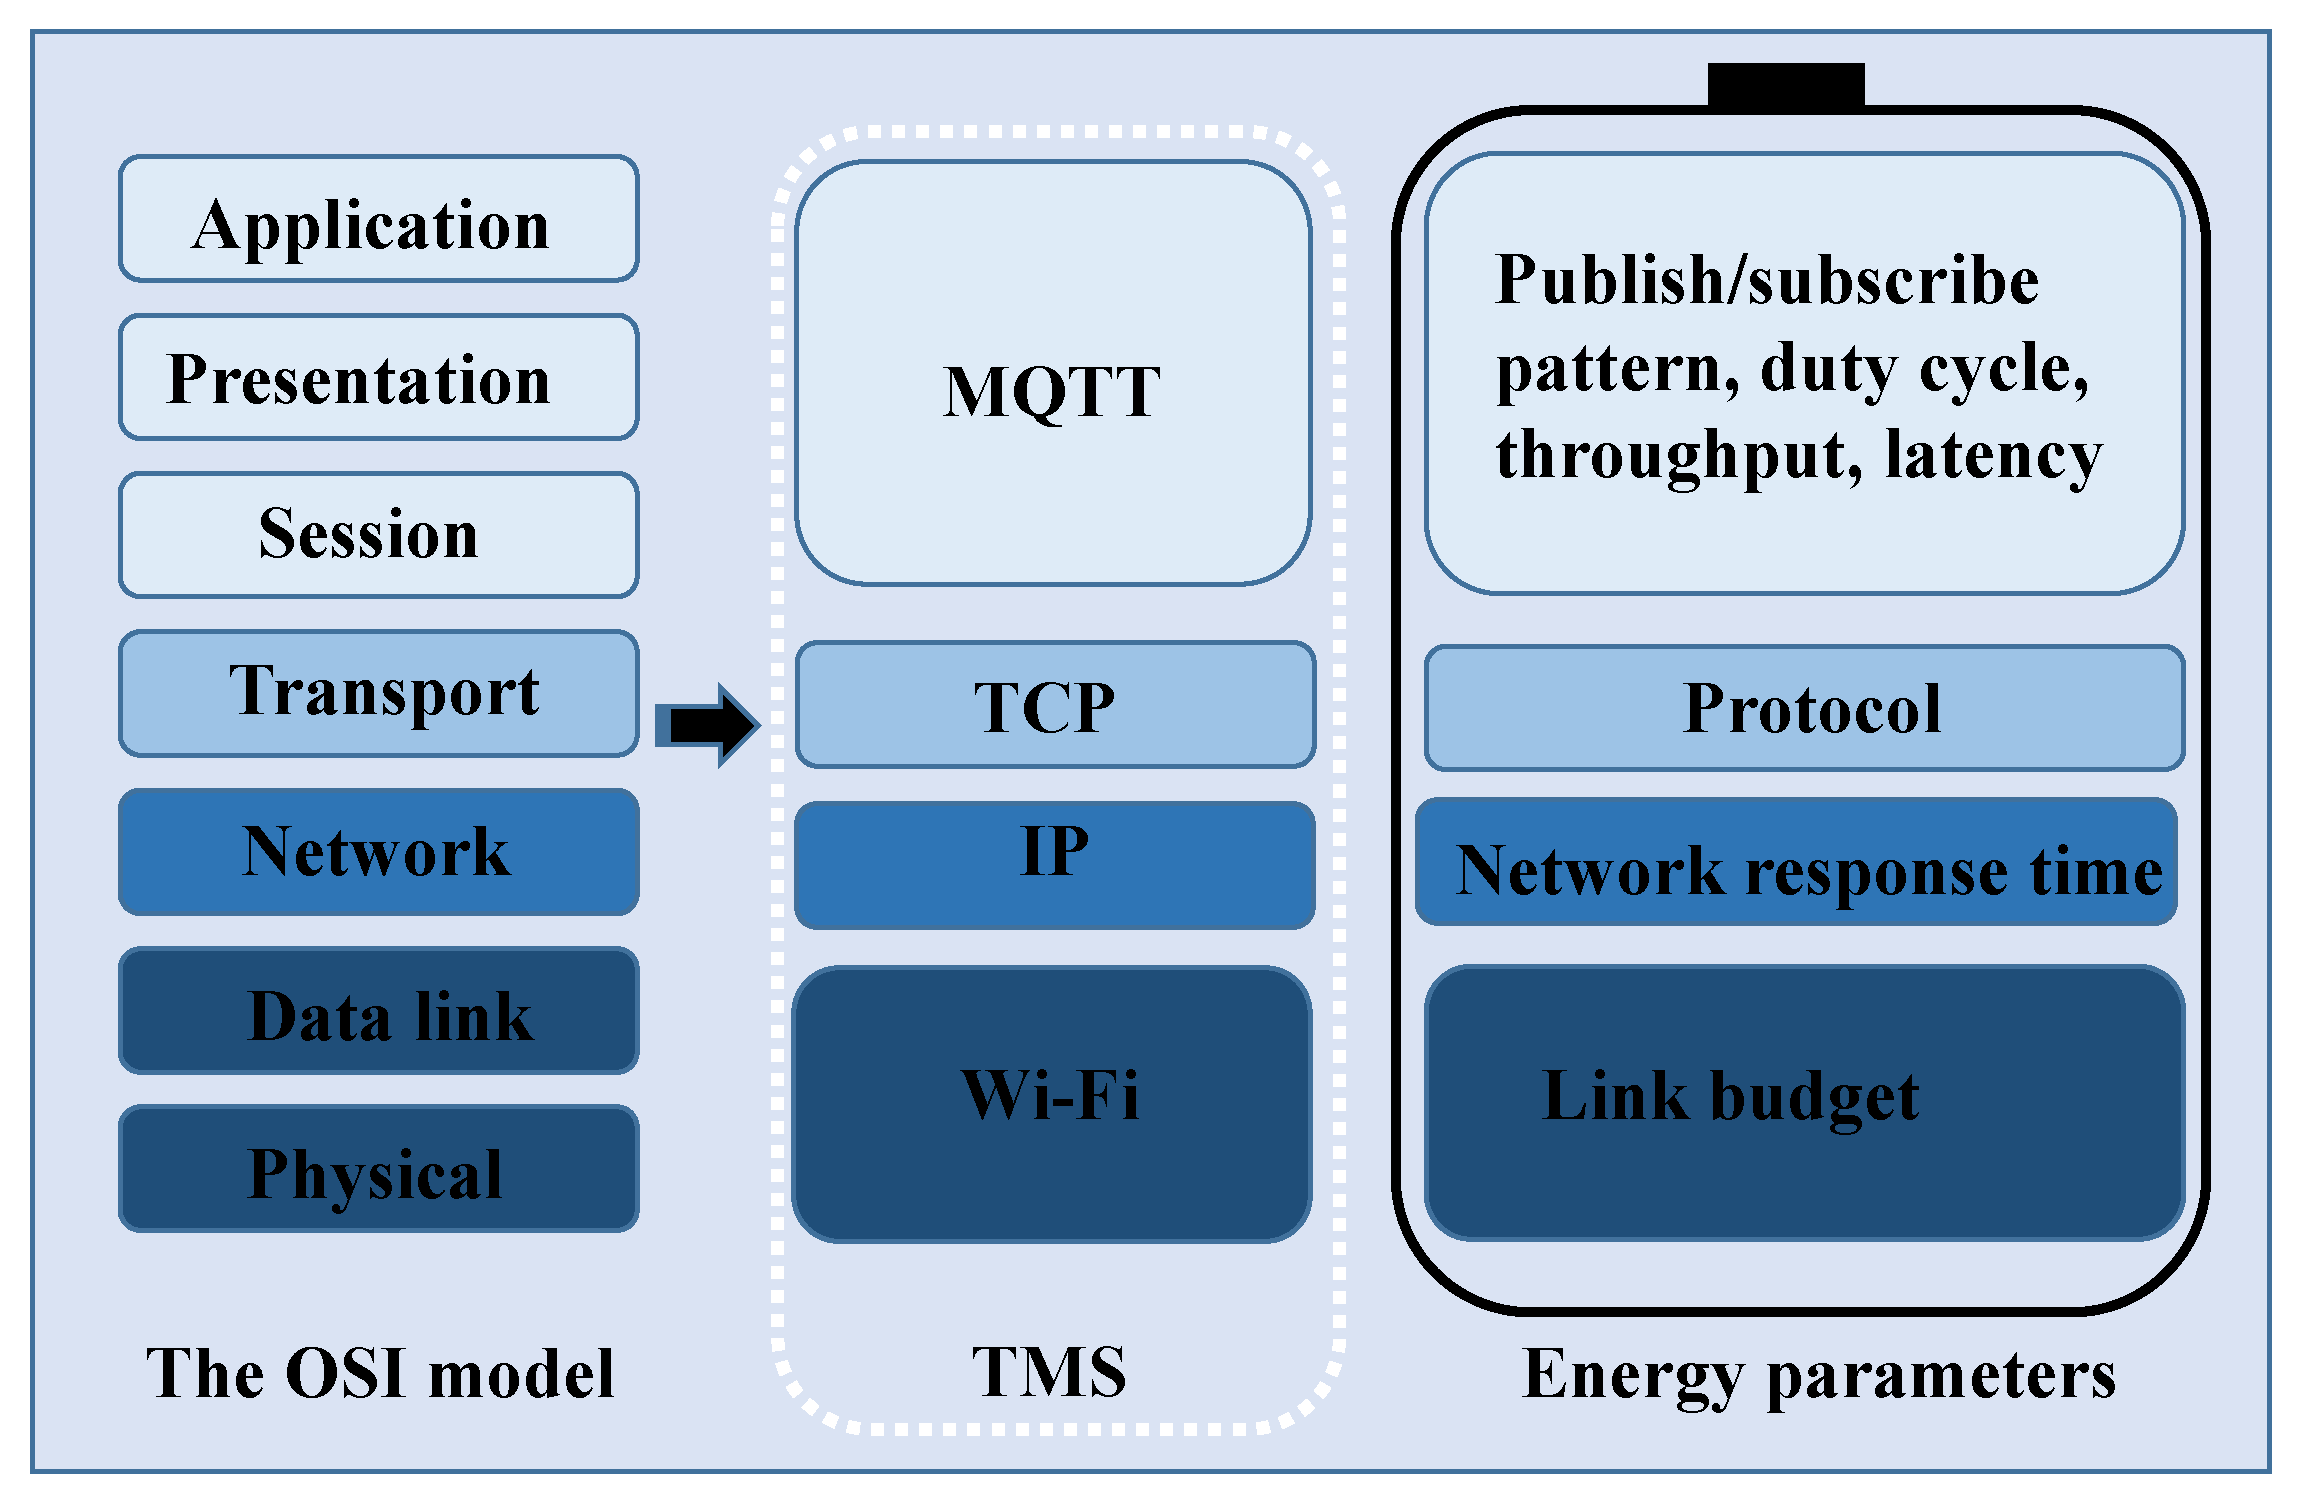
An IoT device’s use of standard network protocols mean each layer can affect the total energy consumption of the device.
Figure 9 shows the energy parameters mapped onto each layer related to our research. The energy consumption profile illustrates the power consumption of different modes and the transition energy between modes. Henkel et al. [
33] summarize the general power profile of low power IoT devices. The usual way of minimizing the application power is discussed. However, each system interfaces with at least one sensor with the SoC. In comparison with application-oriented research, it is necessary to consider the limitations of SoC boot up/wake up time, sensor boot up/wake up time and current, and communication power, depending on the application feature. The device programmer has no control over these factors since it is vendor specific. However, it is necessary to factor this into the power budget.
3.9.1. Energy Contribution for Parameters
Application Layer
MQTT was selected for our work for the application layer. QoS was set to zero to the achieve lowest possible power consumption. MQTT is based on the publish -subscribe architecture. The publish- subscribe pattern defines the device as either transmitting or receiving data. When receiving data, the IoT device needs to stay connected and ready to receive the data. This will consume more power, and a more complex algorithm is needed to sync the wake-up time of the device with the transmitter. However, when publishing the message, it can be programmed to reconnect with the network as needed.
The latency of the system is measured from the booting up of the SoC and the initializing of the distance sensor. The SoC takes a few milliseconds to boot, and then the sensor takes another few milliseconds to measure distance and send the value over the I2C bus. Then, according to the programmed logic in the SoC, data begins to be sent over the network.
The application duty cycle is the amount of time that the device is in active mode. It is a key fact that a device’s power consumption will change with the duty cycle. We created an adoptive duty cycle that helps to maintain a balance between real-time data monitoring and energy consumption of the device.
Protocol
Every packet has some overhead components. TCP overhead is higherthan UDP overhead due its packet format. Apart from that, TCP data acknowledgement consumes energy, but it guarantees reliable delivery. we use the more efficient protocol, considering and balancing the criteria of power consumption and reliable delivery.
The amount of data communicated over the network affects the duration of the device’s active and sleep periods. A constant data size has the advantage of allowing more accurate planning of the power budget. The data can be sent periodically or non-periodically. According to our adaptive algorithm, data sending is non periodic. Our tissue monitoring device sends the fixed quantity of payload data (5 bytes) through the network when the activity occurs according to our program. So, the application throughput is dependent on the amount of data exchanged through the network in a defined period of time.
Network Parameters
The application is deployed on existing network infrastructure. The network response time and link budget are not under the control of the application. However, network infrastructure does impact the energy consumption of the IoT system. Data packets take time to travel across the network from source to destination; this is known as network response time. Network response time is based on network load, capacity and link budget. MQTT is based on TCP/IP protocol. TCP/IP waits for the response as per its protocol rules. Network topology and network traffic mainly drive the response time in TCP/IP networks. Network traffic is affected by the network capacity and load. Reduction in network usage is the one best option to gain some control over these parameters. An IoT system’s data can be aggregated into one maximum packet size to reduce the number of transmissions. A higher Wi-Fi data rate can be used to reduce the transmission time, but data rates are dependent on radio technology and are not controllable through the application. Another option is to reduce the re-transmission rate to minimize the network traffic. This is directly related to the link budget. A good quality link can reduce the number of packet errors and maintain balance between energy consumption and data monitoring.
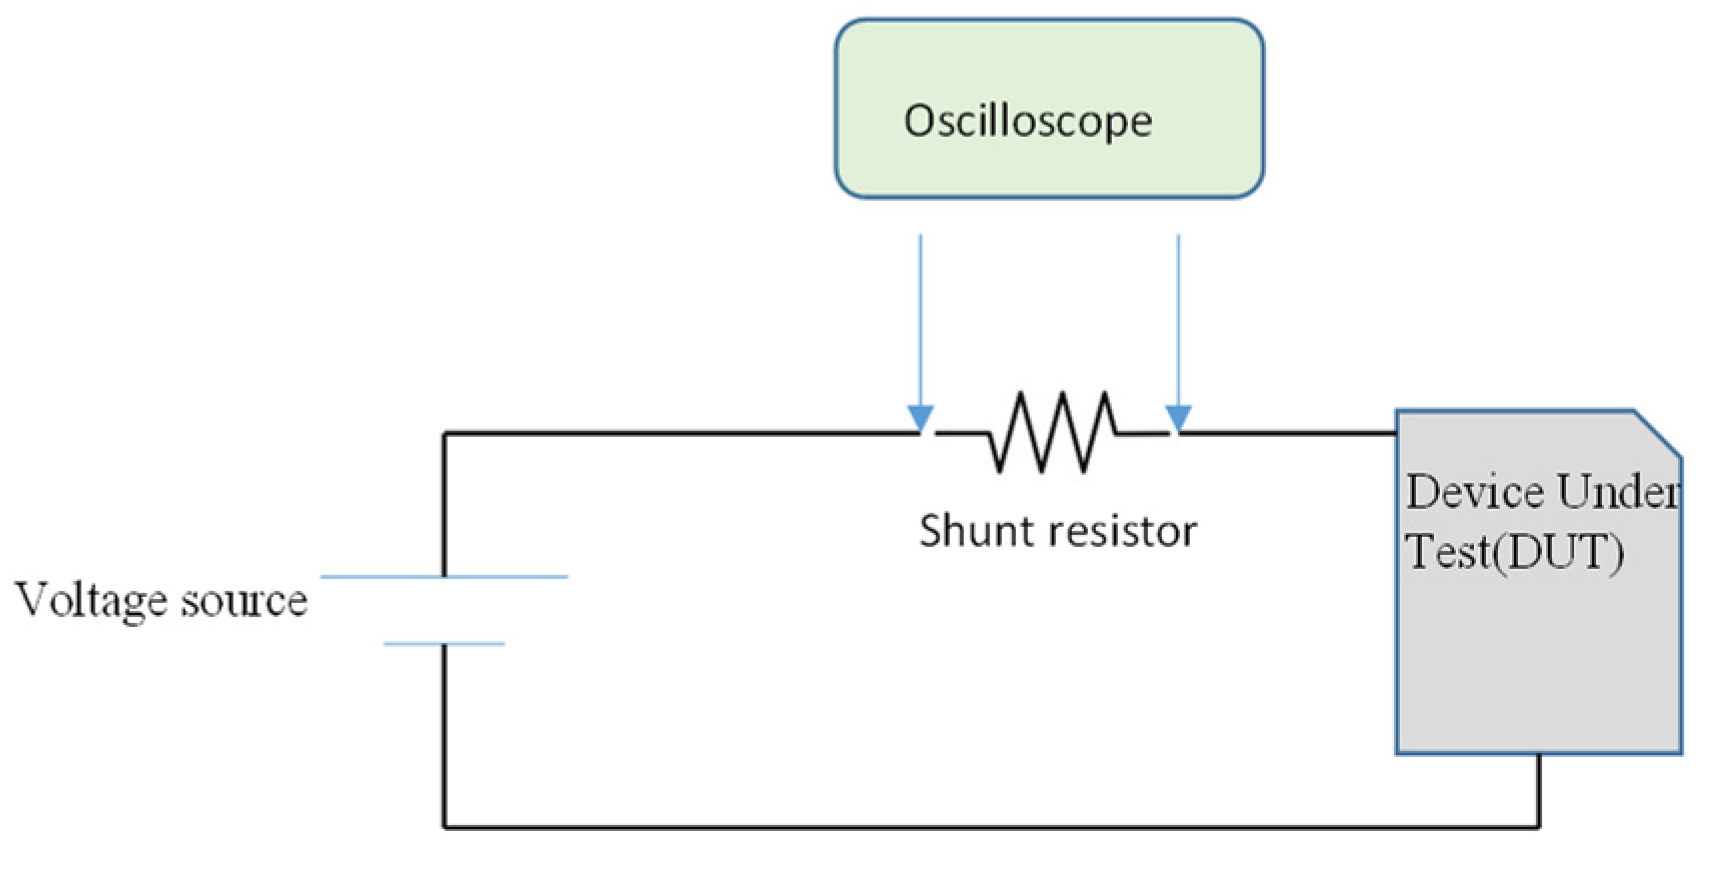
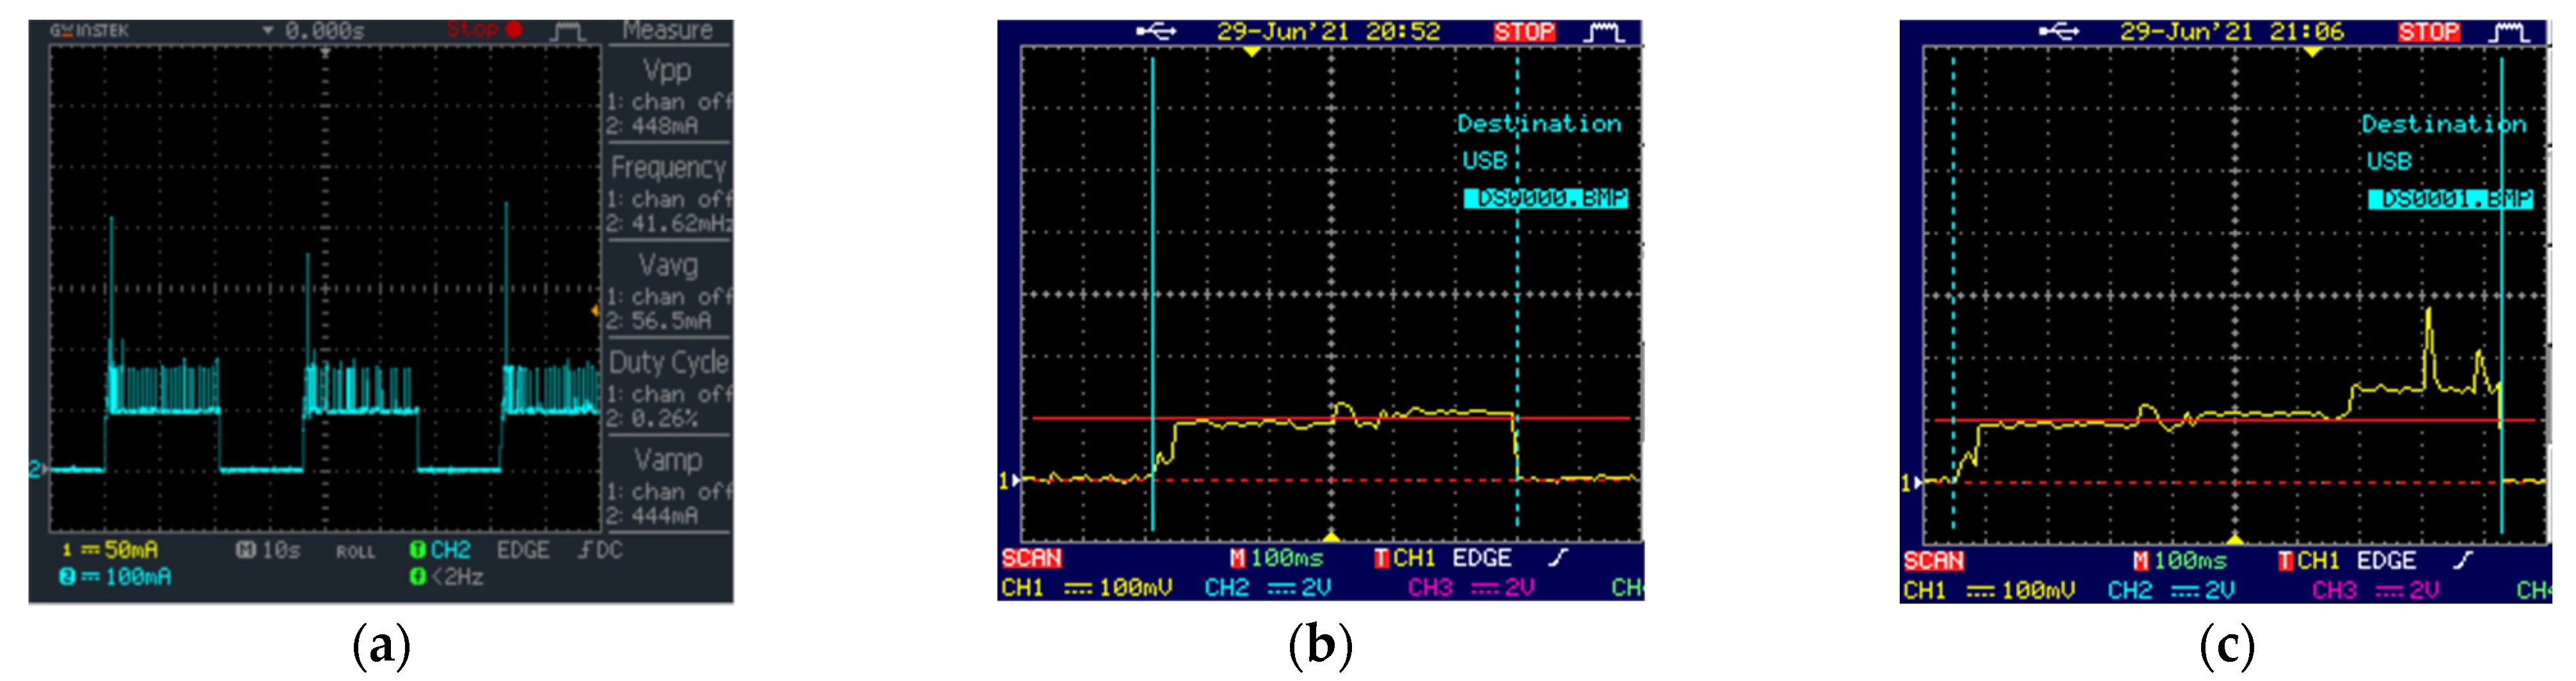
3.10. Current Measurement Topologies
Current measurement instruments use either a shunt ammeter or a feedback ammeter configuration. The Shunt ammeter topology uses a specific known resistor and takes into consideration the voltage difference between two sides of the resistor. The voltage drops across the resistor; this is called the burden voltage and is directly proportional to the load current profile in the device under testing. The shunt resistor value needs to create a large enough voltage drop to be read from the instrument. On the other hand, if it is too big, the burden voltage will be added to the circuit. The Shunt ammeter topology has an unlimited bandwidth measurement.
The feedback ammeter topology uses a voltage-to-current converter. The burden voltage is an extremely small value. There is a feedback resistor to control the gain. It creates high current sensitivity which is ideal to measure the low current profile. The bandwidth is the only limitation of this method. It is good for using low frequency current measuring devices.
Apart from those two topologies, an oscilloscope with the current probe can be used to measure the device’s current profile. Hall effect-based current probes eliminate the need to break the circuit. There is a challenge is in detecting the sleep mode current because of inadequate sensitivity; probes can only detect down to the mA level. These current probes will cost hundreds of dollars as well, depending on the sensitivity.
The combination of an oscilloscope with a shunt resistor is a cheaper current measurement method for low power IoT systems.
Figure 10 shows such an experiment set up. Almost all laboratories are equipped with basic function oscilloscopes. The shunt resistor value needs to be selected within the proper range. This eliminates the high value of burden voltage from the system. On the other hand, to measure the low current states, the basic oscilloscope cannot be used. Since deep sleep current is a constant value, a microammeter or other method can be used to detect the sleep mode’s current value.
There is another frustrating element of oscilloscope probing. The probe’s ground is connected to the power ground in the electrical system. If the voltage source is not a ground isolated power supply or a battery, there will be a ground loop. In this situation another current path is created due to the potential ground difference. To address this particular challenge, differential measurement can be used. It is best to use differential probing, yet it is an expensive solution. This solution eliminates the ground looping and other challenges associated with ground potential difference. The other alternative solutions are to design a differential op-amp circuit or an instrumental op-amp circuit that is sensitive enough to detect the difference of a few microvolts (μV). Again, there are a lot of design challenges associated with such a design with offset calibration and the bandwidth.
There are sensitive current digital multimeters that can measure at microamp levels. These multimeters typically use a shunt ammeter configuration that can cause a low voltage burden in the microamp region. There is an advantage in measuring the deep sleep current with such a meter, since it is a constant value. However, those meters cannot measure short current bursts due to their slow measurement rate and limited triggering options. Additionally, the displays are numerical or small graphical displays.
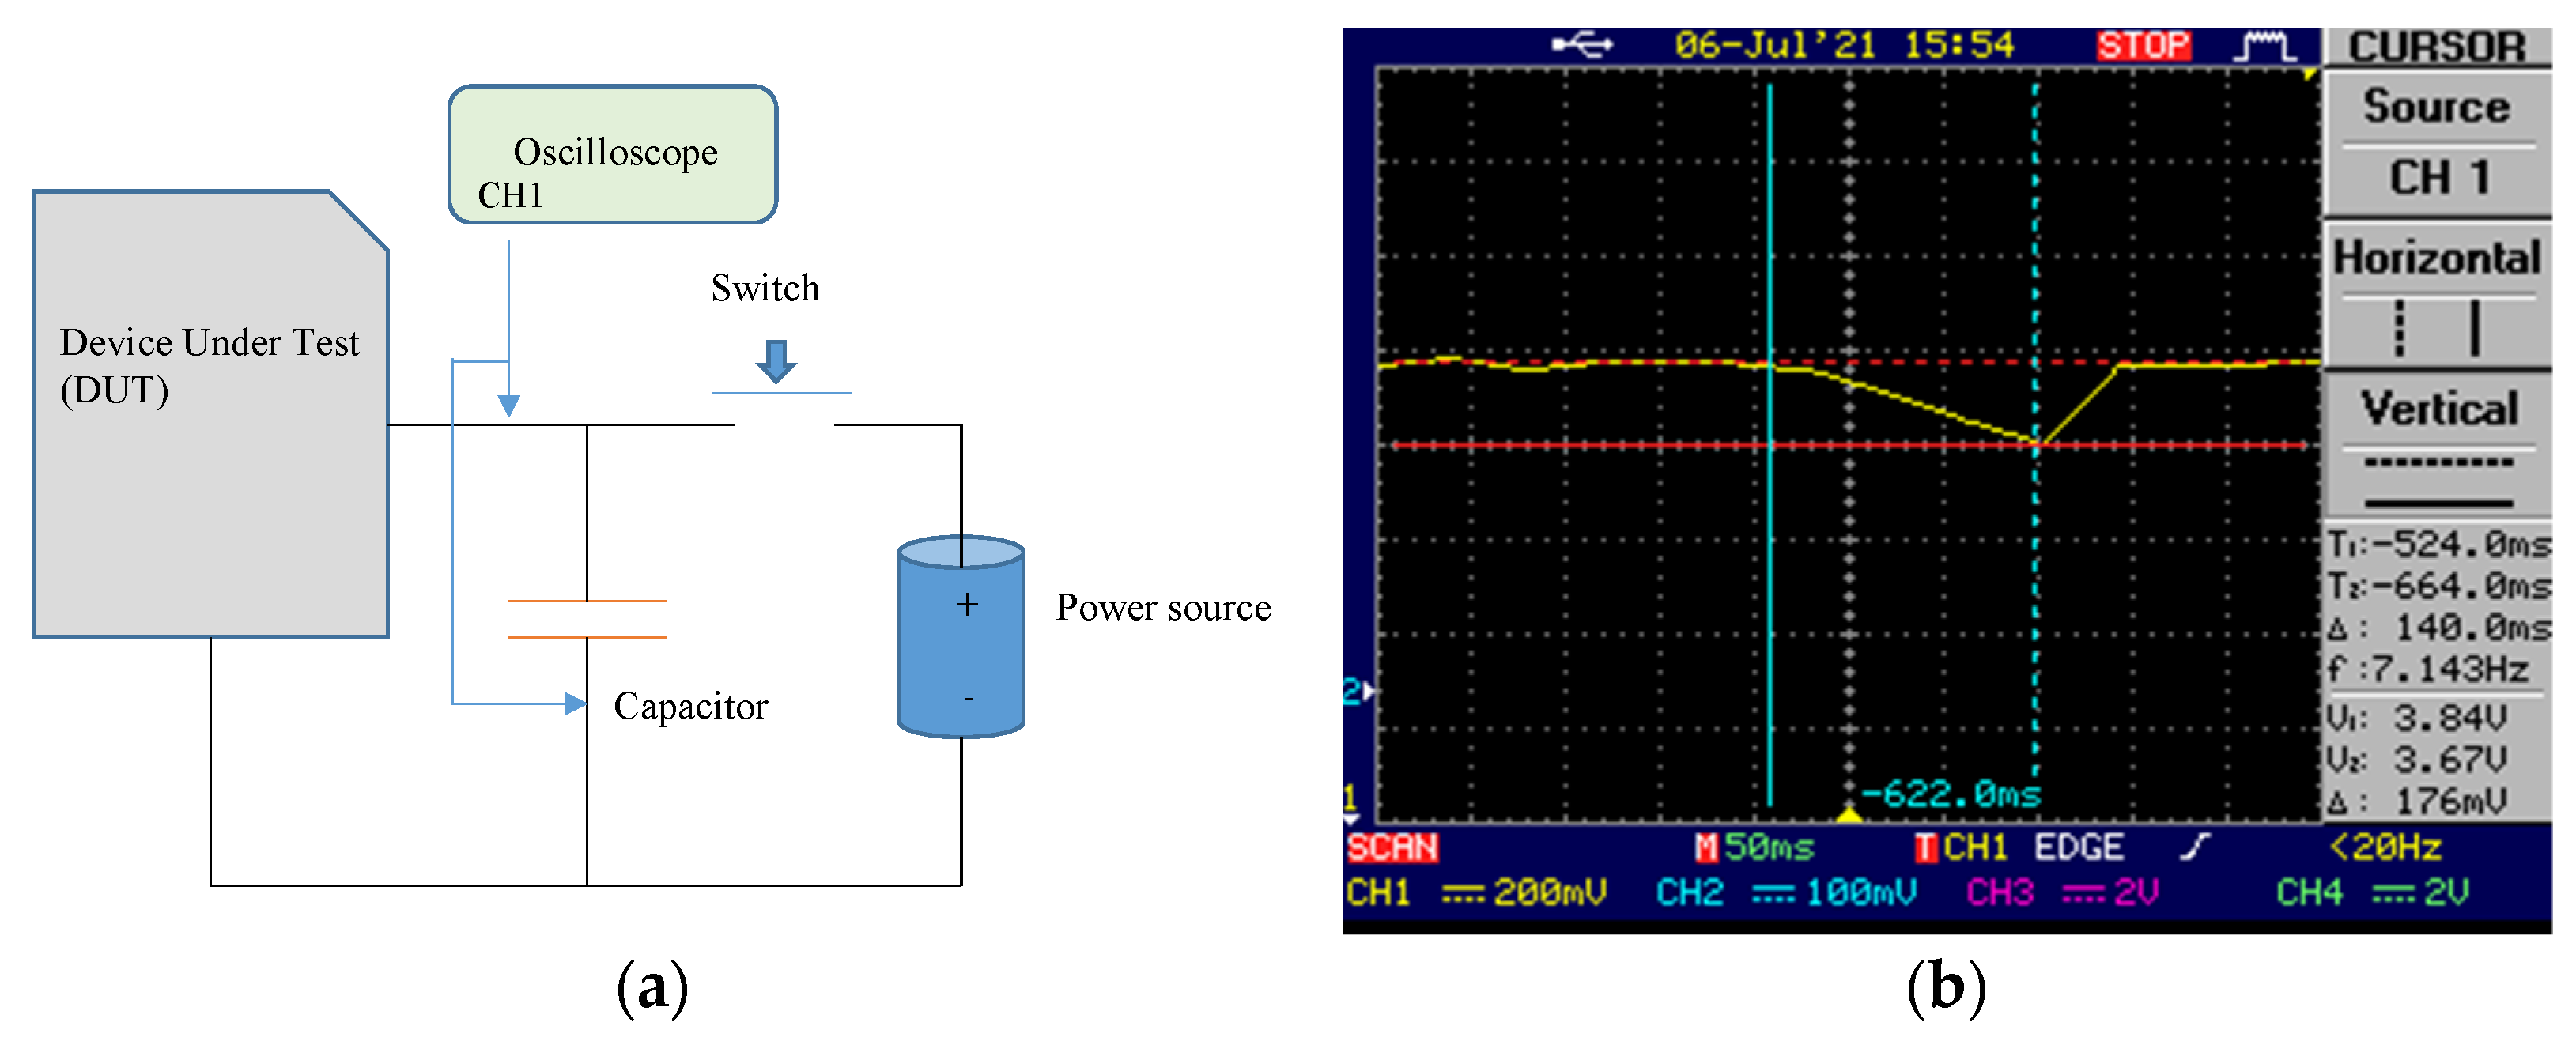
If micro- or nano-measurements are not available in the ammeter, there is another alternative method to measure the static deep sleep current [
34]. Lvey et al. [
34] mention the multimeter as basic instrumentation. In our experiment setup, we used a basic oscilloscope as the measuring instrument.
Figure 11a shows the basic hardware connection related to our measurement setup. We proposed a simpler hardware setup based on the concept of capacitor charging and discharging.
Once hardware connections were created, the switch connection was closed, and the capacitor was allowed to charge to power source voltage. Once we were sure that DUT had entered sleep mode, the switch was released and the capacitor was discharged, while DUT was powered by the capacitor. The discharge time had to be long enough to measure the voltage drop. Caution had to be taken so that the capacitor voltage did not fall below the normal DUT operating voltage level. The DUT’s current can be computed using Equation (8) where
denote DUT’s current, capacitance, voltage drop, and time duration, respectively. The constant current discharge of a capacitor can be estimated using
Figure 11b shows oscilloscope readings that led to the result of Equation (9). When it was necessary to take into account the leakage current of the capacitor, then we repeated the experiment without DUT and measured the voltage drop within the same time. The result value can be added to Equation (8) as compensation for leakage current.
In this research both an oscilloscope with a shunt resistor and a sensitive current digital multimeter was used to obtain the power profile. The Tektronix DMM916 multimeter was used to verify the deep sleep current measurement from the Equation (9). The multimeter reading was 19.5 for the deep sleep mode of the device. In our work we considered 20 as the deep sleep current for the rest of the calculation.
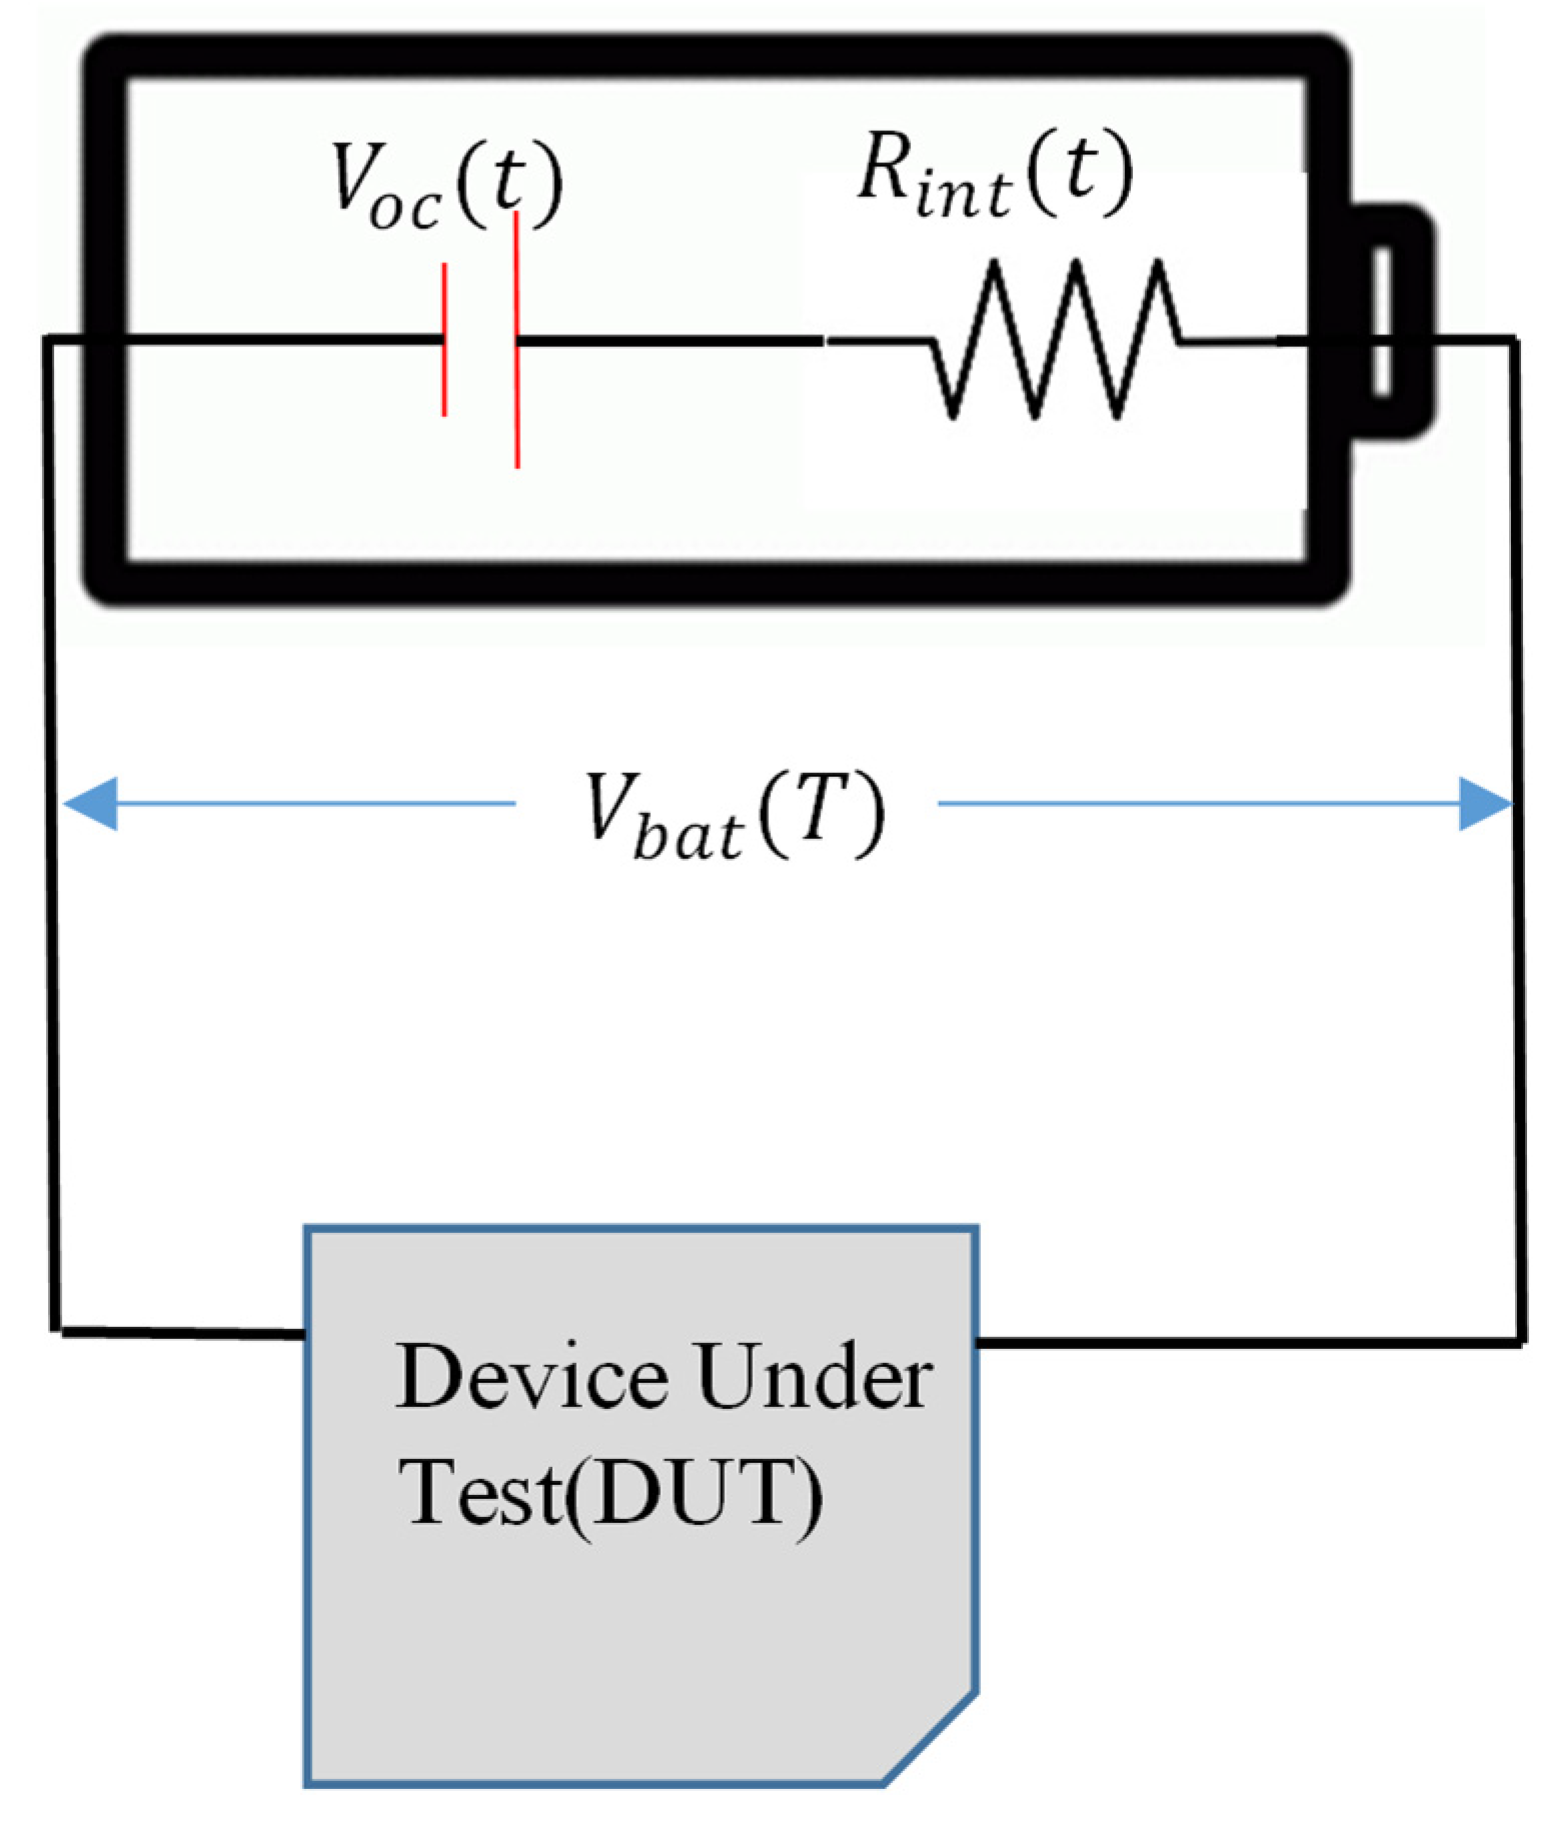
3.11. Battery Characteristics
Typically, an IoT device’s battery is selected based upon its capacity. Often, designers forget the criterion that a battery is not a constant voltage source. Internal resistance changes over the voltage drop when the battery discharges. Thus, it is important to design and test the IoT device, including the battery characteristics, under more realistic conditions.
The rate of battery discharge is dependent on the current drawn. Typically, this can be obtained from the battery discharge curve. When the battery discharges, battery internal resistance rises. The maximum current drawn by the DUT leads to a drop in the battery voltage. Internal resistance is equal to the current drawn. The battery model is shown in
Figure 12. In a given time, battery voltage
is computed by Equation (10) where
denote battery open circuit voltage, internal resistance, and the drawn current, respectively.
There are battery simulating instruments that plot the curves, and those instruments are expensive. However, the device’s shutdown voltage can be selected when running through the battery simulated model using such an expensive device. These devices can be used to simulate the custom low current profile in order to obtain the battery discharge curve. The battery life can be estimated based on time to discharge the battery to a selected low battery voltage threshold using such an instrument’s results. It can save a lot of the time which would otherwise be needed to complete the work.
Unfortunately, not every researcher has access to those high-end devices. In that scenario, researchers have to estimate the battery life using Equation (11). We used Equation (11) as the high-end instrumentation supports were not available.
The average current is illustrated in
Figure 13 and is calculated as
In our experiment, we used a 1 Ohm resistor as the shunt resistor. During the testing, the battery voltage was kept at 4.0 V and up. In the case of high current draw states, it lost a maximum voltage of 450 mV as the burden voltage. We had to make sure to operate the device without undervoltage. The dominant factors contributing to energy consumption are explored in the following results chapters in this paper.
3.12. Dimension
The tissue monitoring device has two parts—a main board and a sensor module. The sensor module is attached to the main board with a flexible wire. The main board has a length of 5 cm and a width of 2.5 cm. The prototype is developed on a breadboard with through-hole components. The device size and weight can be further reduced with a custom PCB design and SMD components. The device can be placed on the tissue box with double sided adhesive tape.
3.13. Estimated Prices
The laser ToF distance sensor cost around USD 5.00, the ESP32 SoC cost around USD 6.00, the LDO regulator cost around USD 0.50, the battery 420 mA.h cost around USD 4.00, the battery charger module cost around USD 1.00, and the other accessories cost around USD 1.00. Therefore, the total price was USD 17.50 as shown in
Table 2.
4. Results and Discussion
Current was measured with a basic function oscilloscope and a shunt resistor while the system was operating. OTA’s power consumption was not calculated to estimate total power consumption. The power consumption was calculated based on four conditions: tissue is used, and the value is transmitted; tissue is not used; battery voltage measurement; and the deep sleep. When the tissue is not used, the system would sleep for 10 min. When tissue is used, the system would go to sleep for 10 min after changing or updating the data on the dashboard. In the sleep mode, 20
was consumed. The current profiles of some cases are shown in
Figure 14.
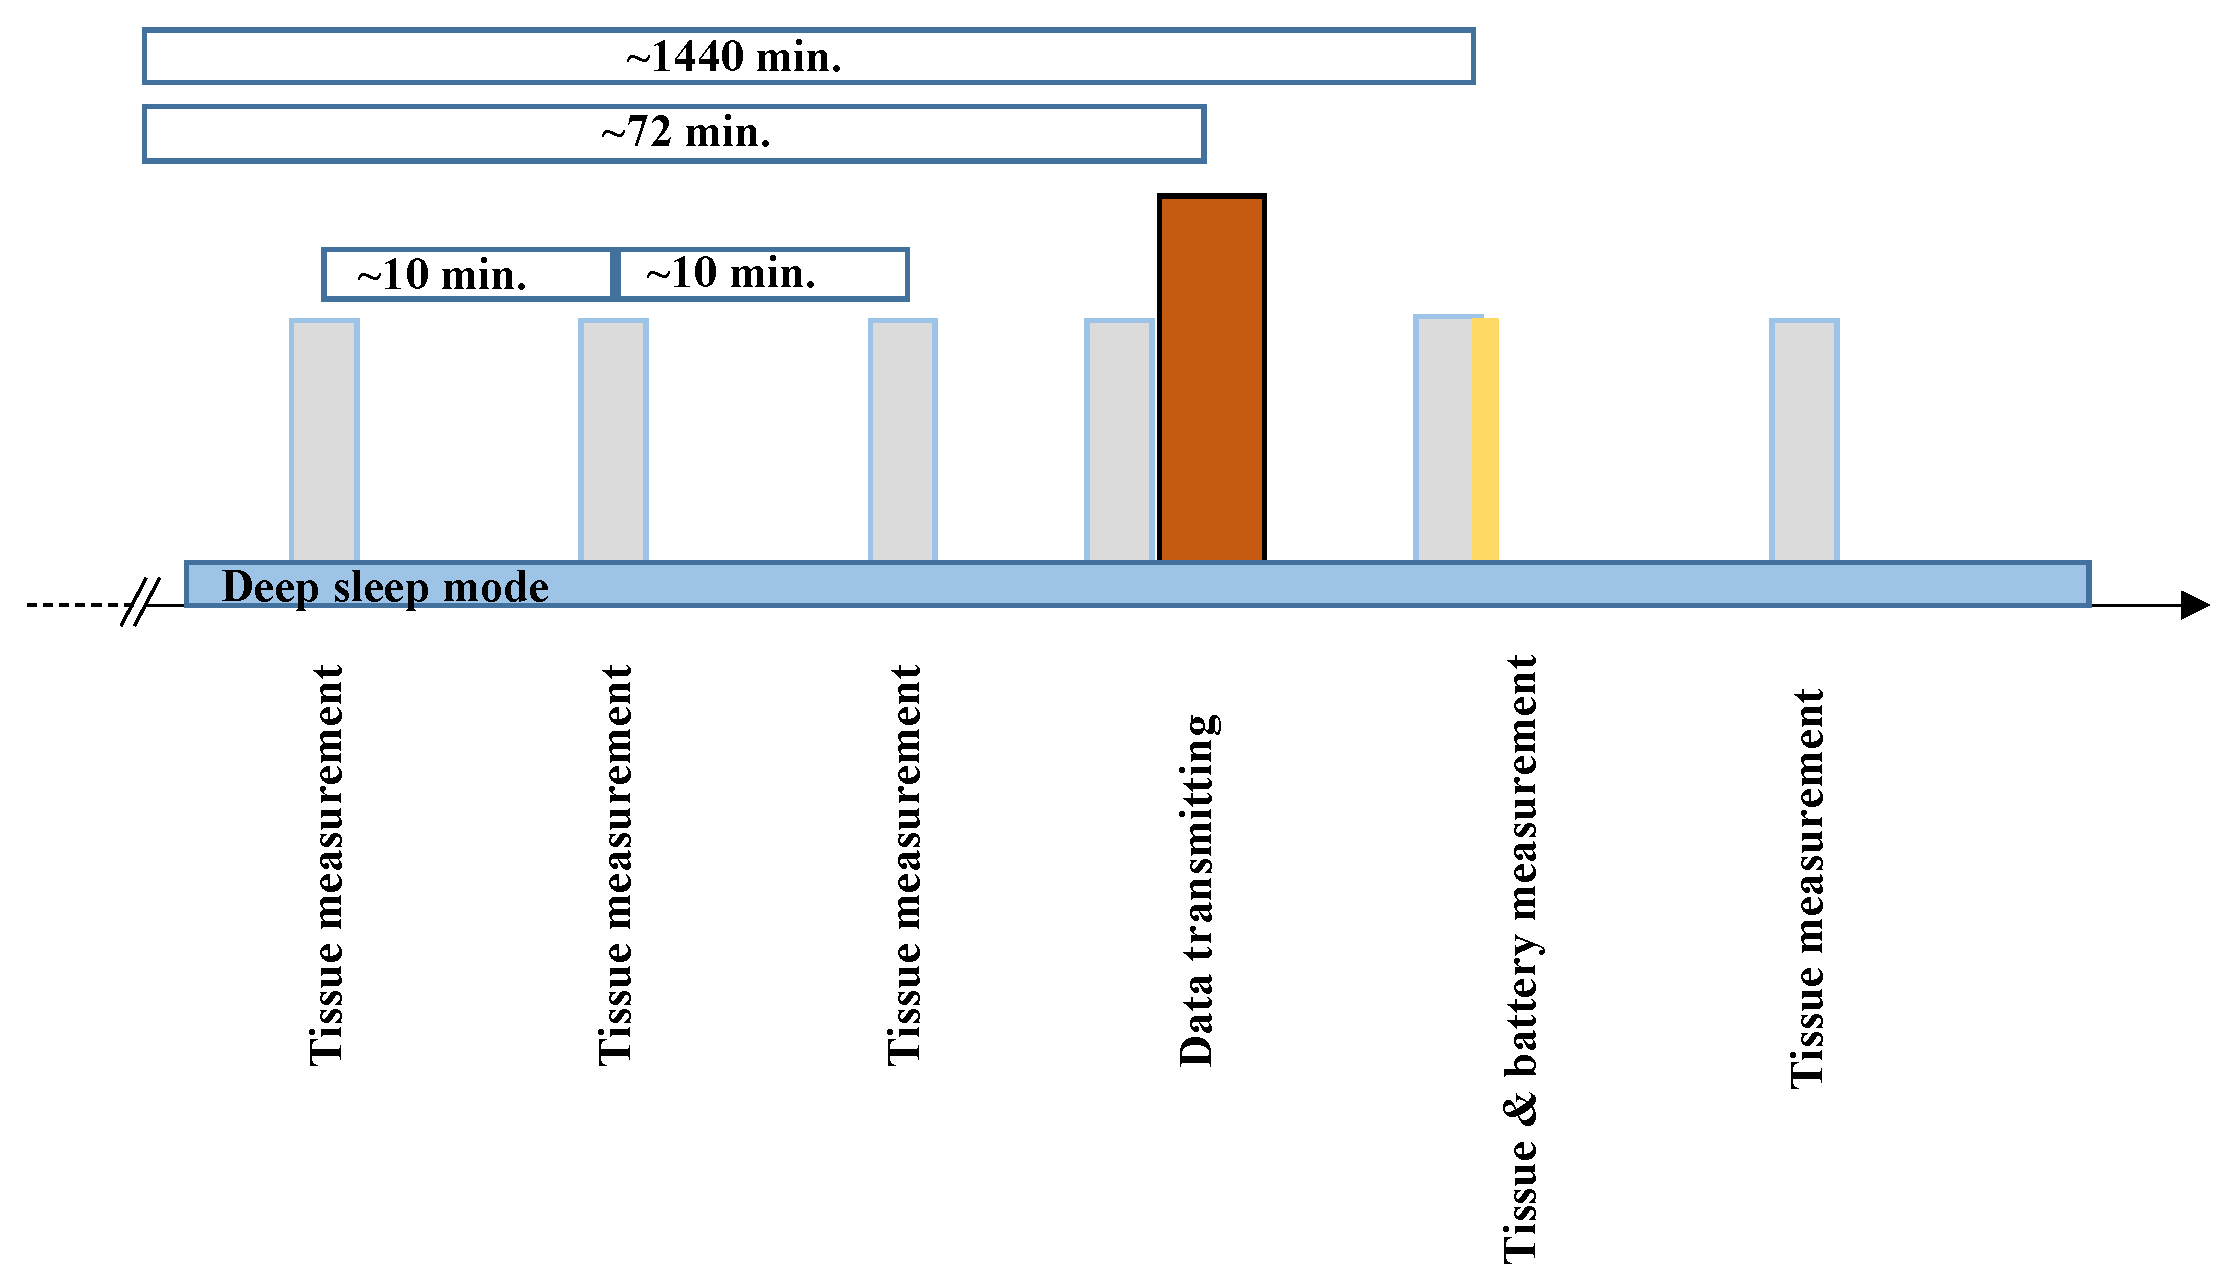
We illustrate the performance of the system when installed in a bathroom in a house that has four people. Based on our survey, a family with four members spends a week to use up all their tissue (80 cm radius). Each member uses tissue five times per day, on average. In a day, the system has to be updated on the dashboard 20 times, and it checks the amount of tissue 144 times. The device’s power profile is shown in
Figure 15. The different colors represent the different cases.
In
Table 3,
is the average current consumption for measuring the tissue value and transmitting,
is the average current consumption for measuring the tissue value,
is the average current consumption for measuring the tissue value and ADC reading for battery voltage, and
is the average deep sleep current. The battery deterioration factor needs to be taken into consideration, because the battery is self-discharging over time. In this work, we selected a deterioration factor of 0.8 per year from the battery datasheet [
35].
In this model, sleep time is 10 min, and battery life is calculated, as can be seen in
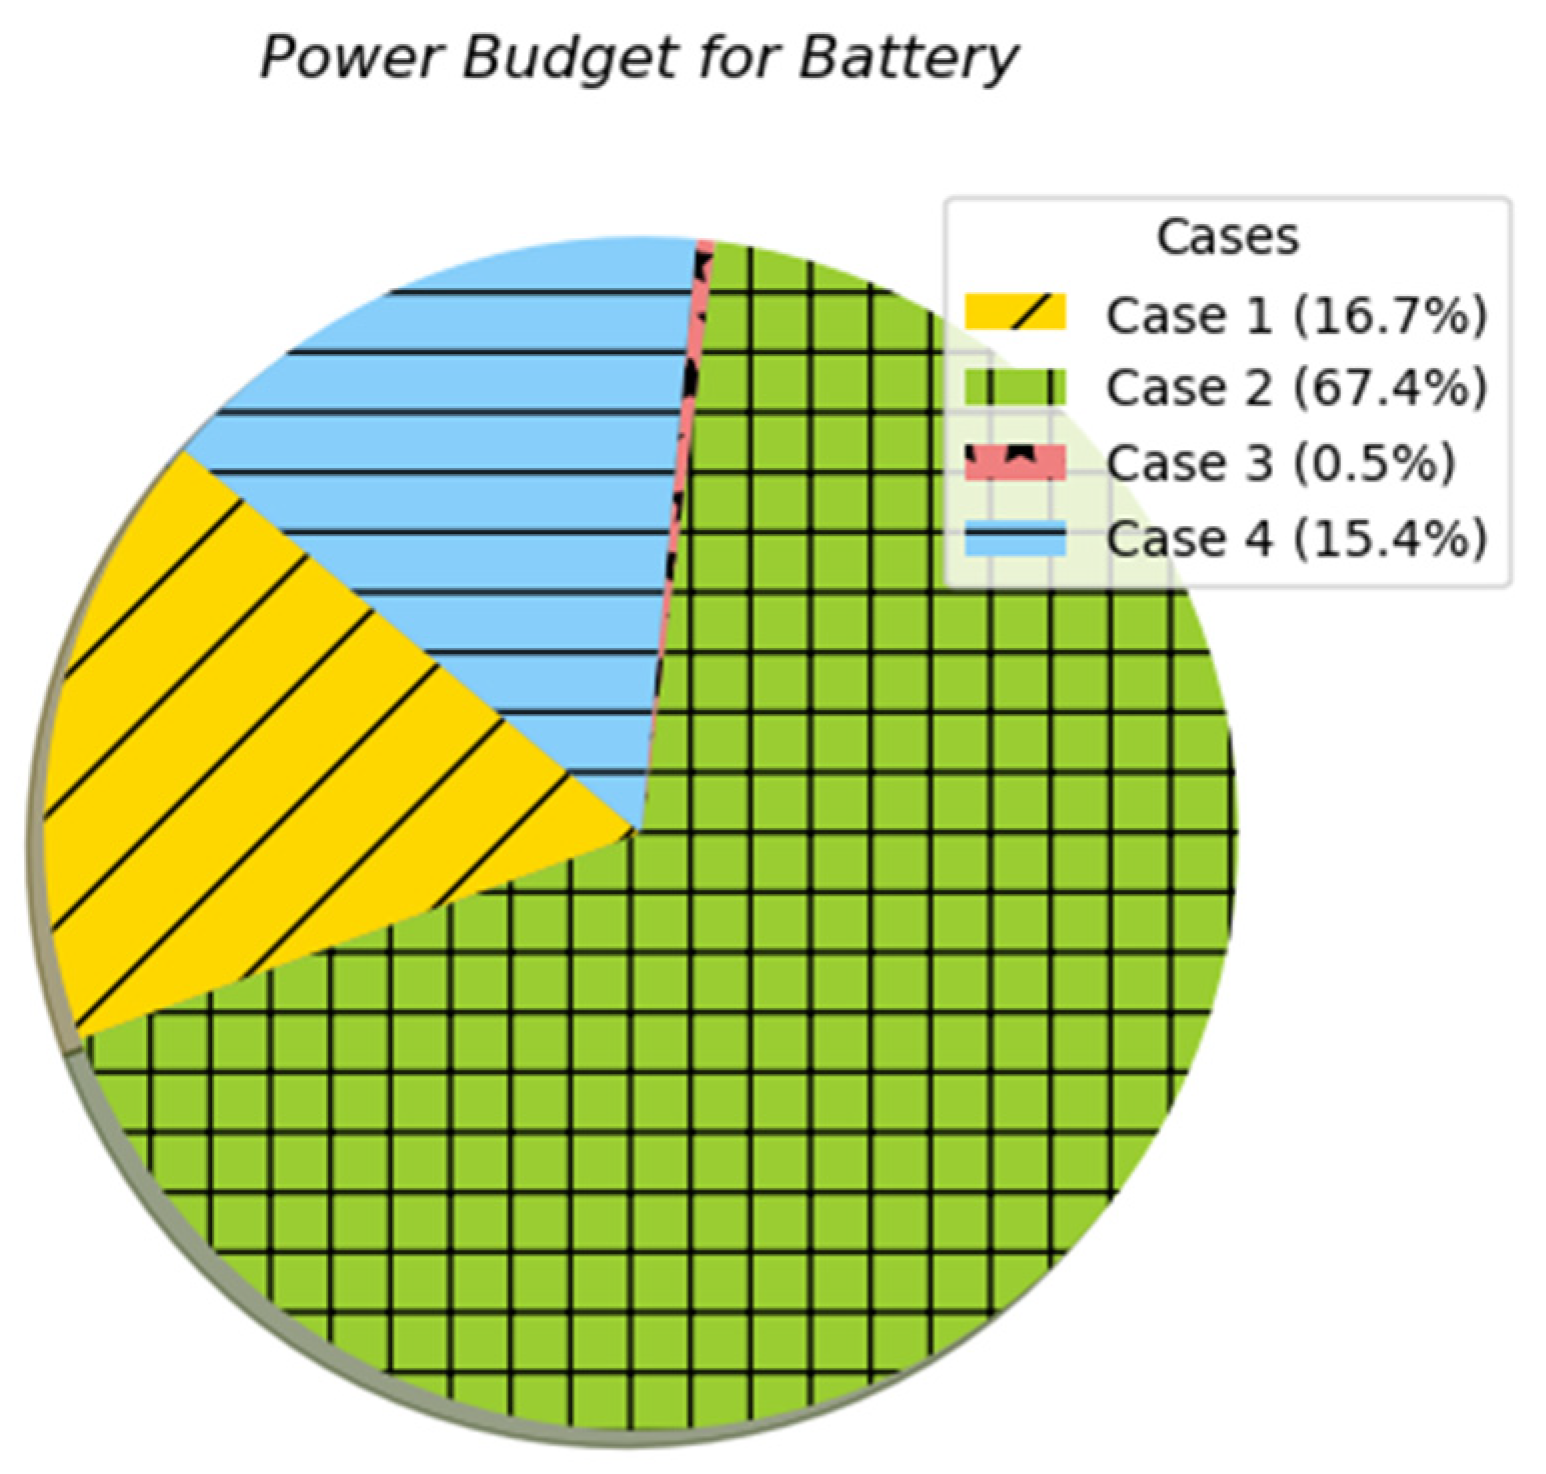
Table 3. The battery will last around 120 days. Power budget for the tissue monitoring application is calculated from
Table 4 and shows in
Figure 16. The battery can be fully recharged within an hour.
For battery testing conditions, the system is set to a sleep duration of 15 s. In one day, the system is triggered 5760 times. The system transmits data, on average, 69 times per day (C1), measures battery level (C3), measures the actual amount of tissue an average of 5691 times (C2), and spends the rest of time in deep sleep mode (C4). The estimated battery life is calculated according to Equations (6) and (11) as shown in
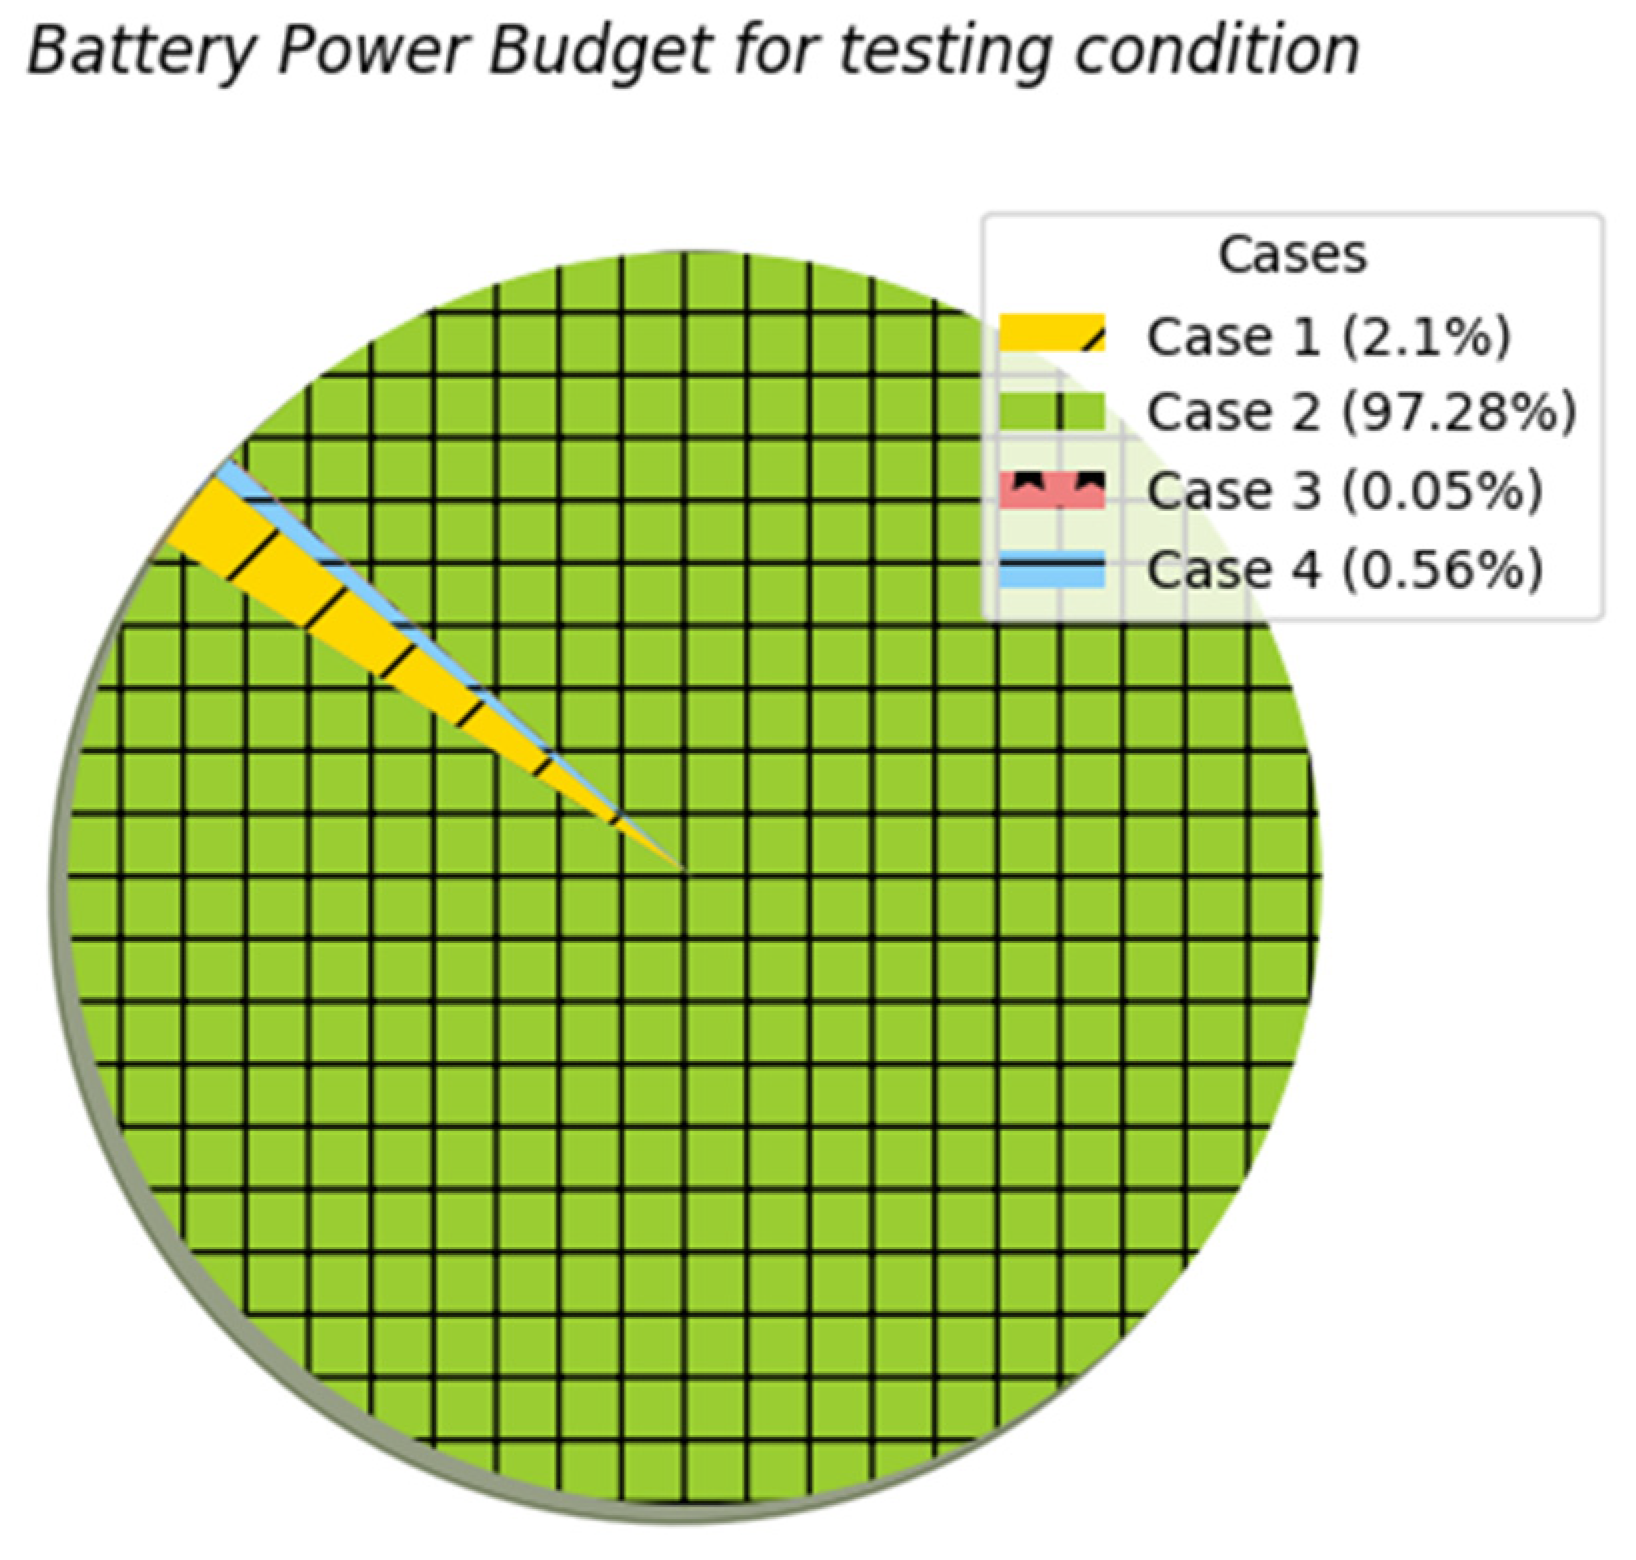
Table 5. The power budget for testing conditions is calculated in
Table 6 and shown in
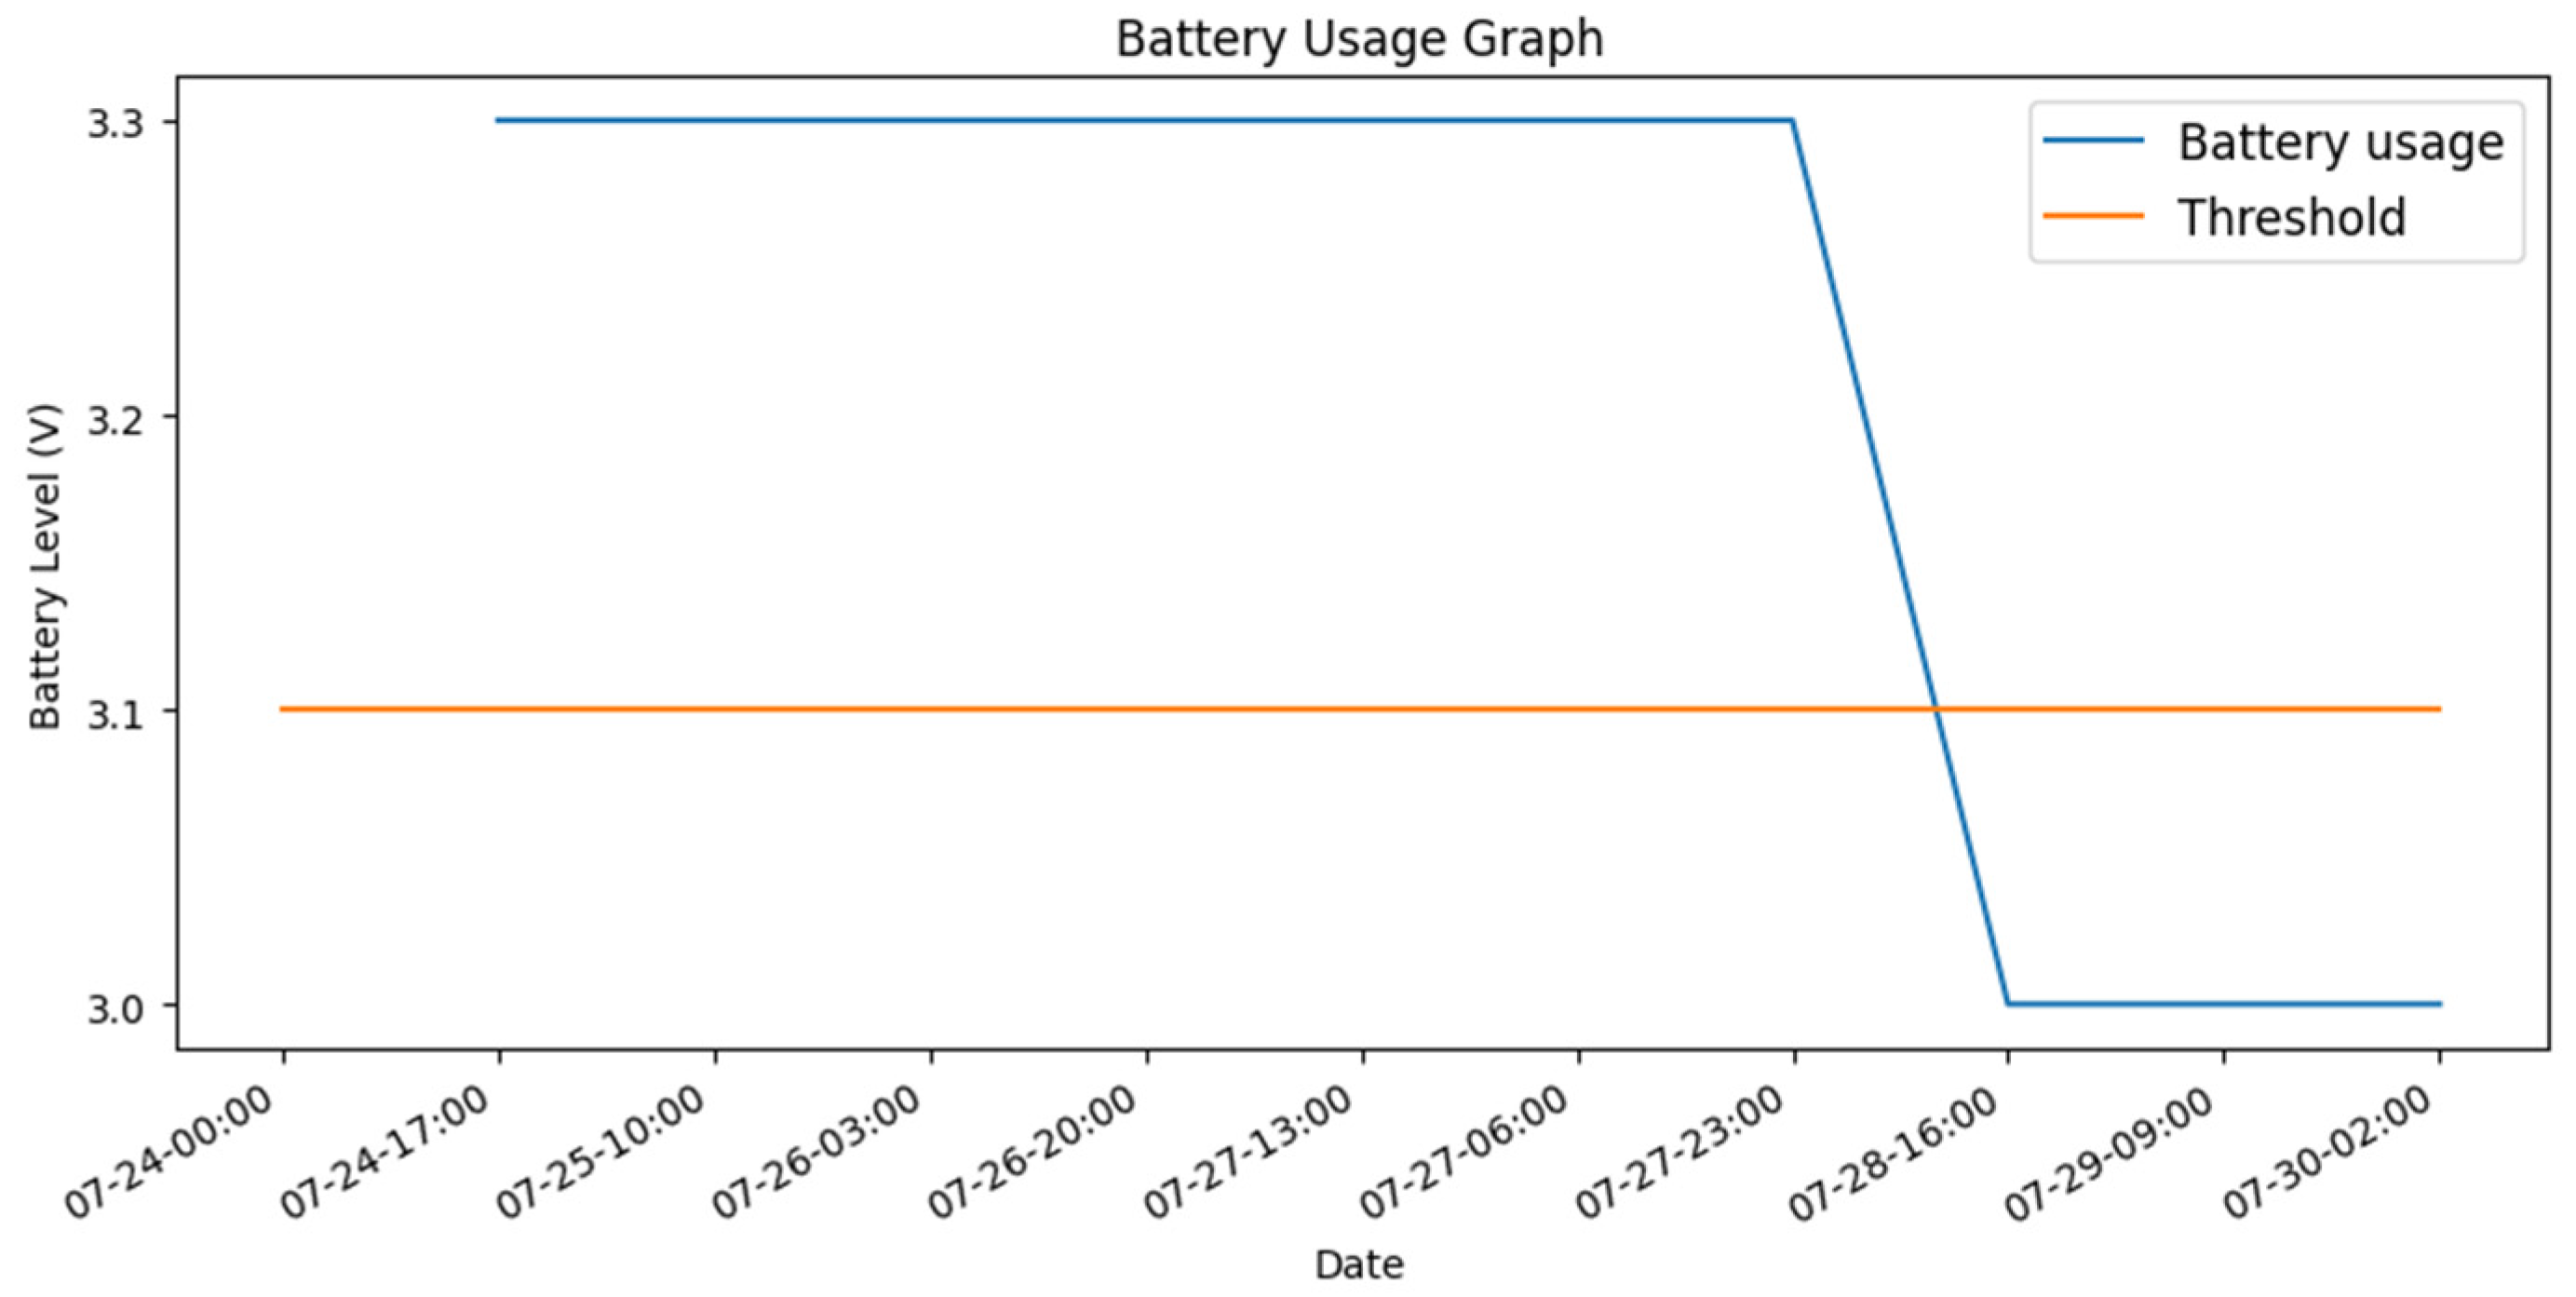
Figure 17. The constant battery voltage of 3.3 V was assumed for all the power budget calculations. The battery usage graph is shown in
Figure 18.
A sample visualization of the two-sensor data received for toilet and kitchen as shown in
Figure 1b. The tissue readings are displayed in red, orange, yellow, or green to indicate the levels are too low, adequate, a quarter, and high, respectively. It sends notification emails when tissue or battery voltage is low. The user can easily find out the tissue status or battery voltage via email when they are low.
When the system in active mode, the LED blinks. Hence, users are assured that the system is in active mode from the visual feedback. The application energy parameters shown in
Figure 11 are measured using software tools in [
36] and summarized in
Table 7.
At the product development stage, users can select the best suited profile from the software related to the system’s install environment. The power budget can automatically be calculated and displayed in the user dashboard.
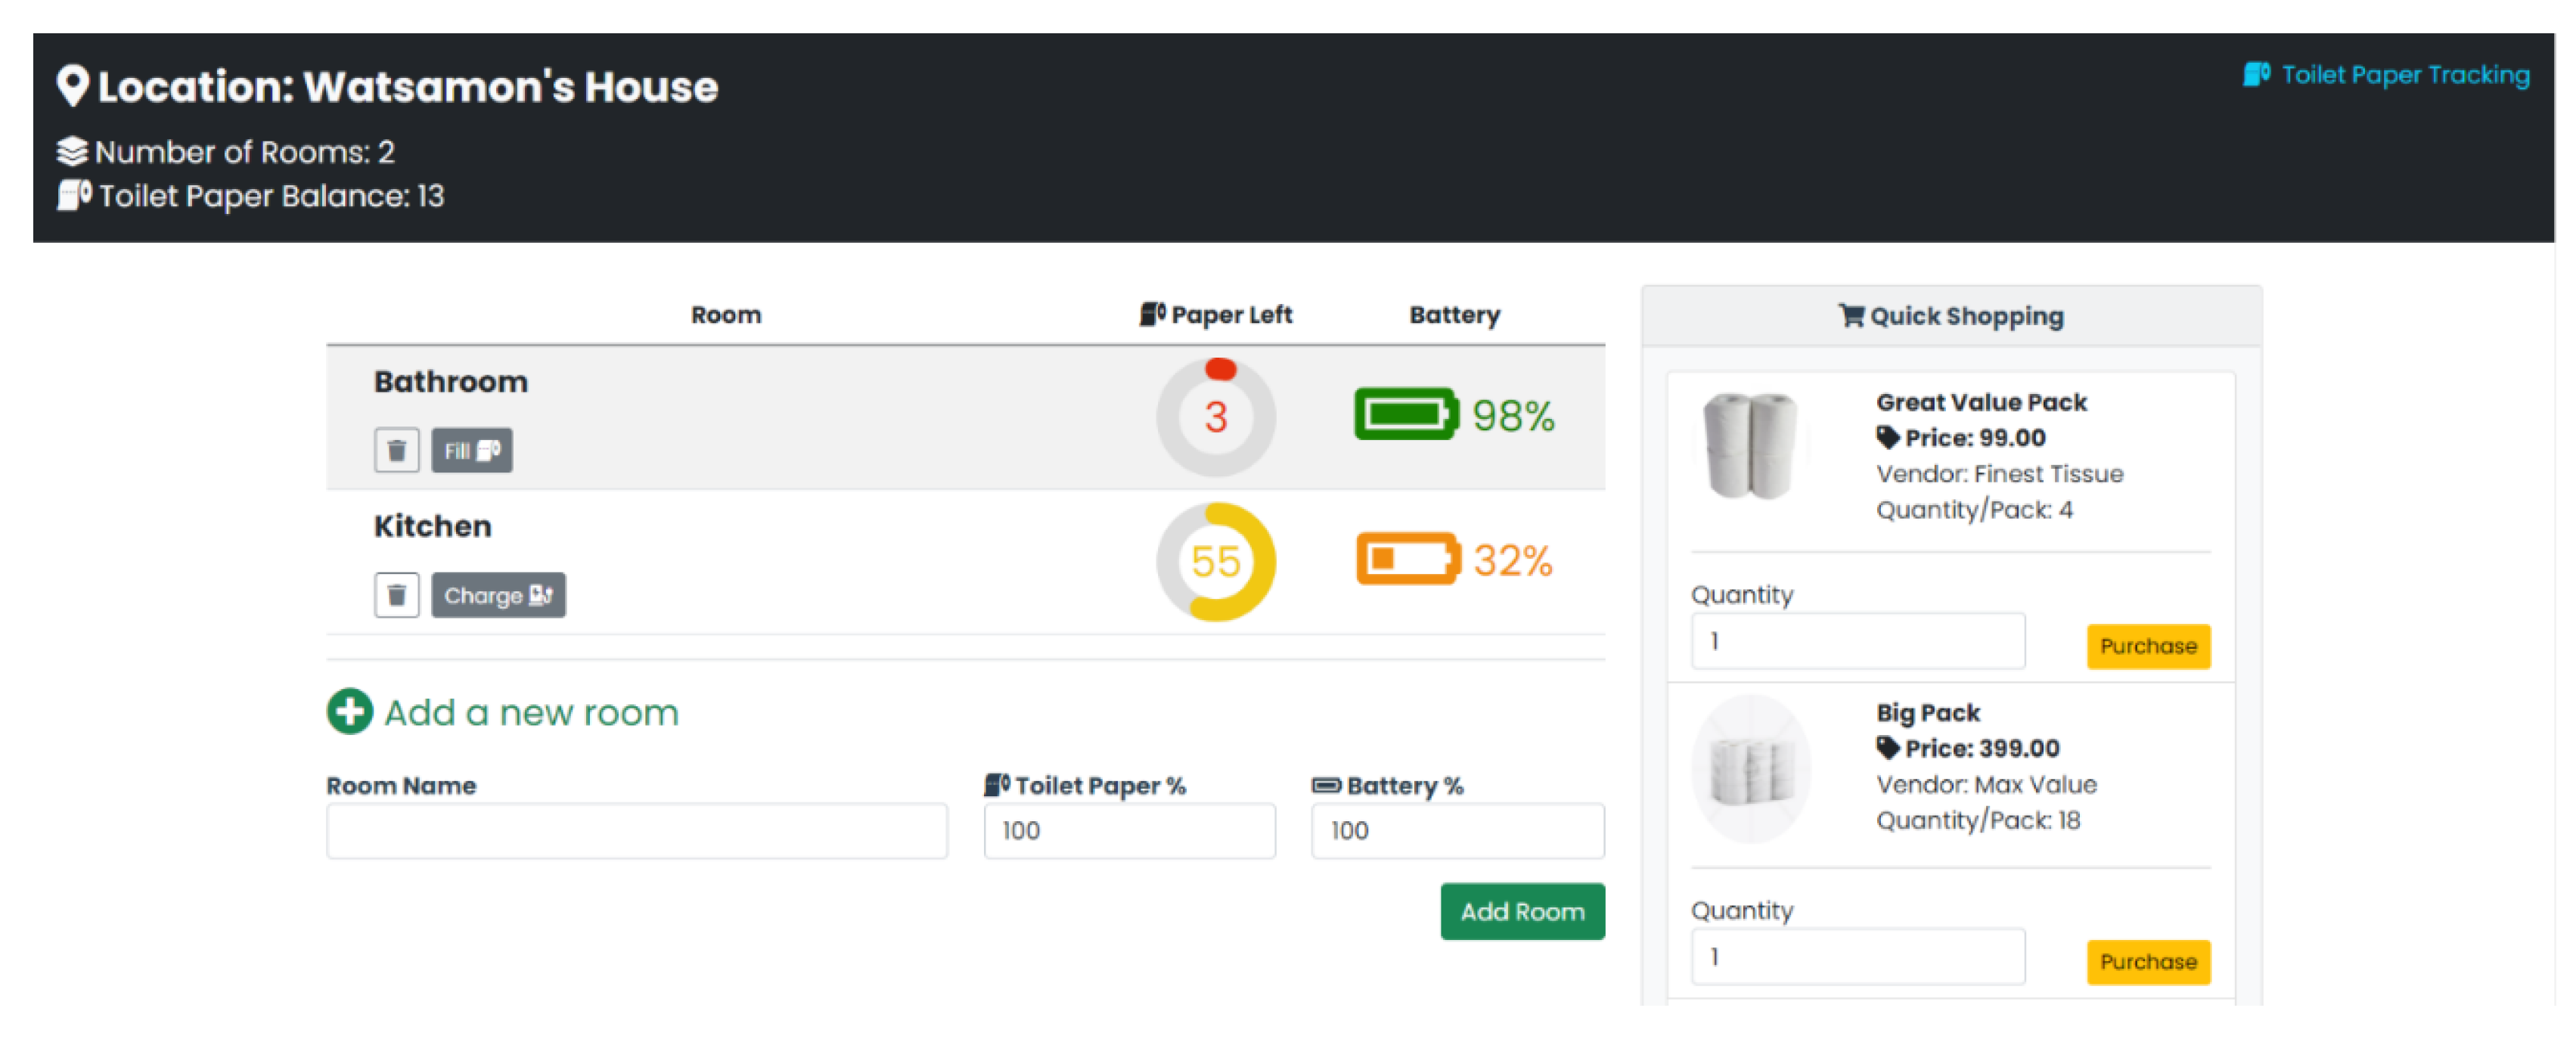
Nowadays, using a web application as a user interface is very convenient; thus, users can monitor the system anywhere and at any time. The web application is developed using the Vue.js framework, which is an open-source model and view front-end JavaScript framework for building user interfaces and single-page applications, integrated with a cloud database with Firebase. Firebase is a real-time database that links up the system and the web application easily. When Node-RED sends the data to the Firebase database, the web application automatically syncs the data from the database.
Figure 19 shows the application of a house and the registered user, Watsamon, who monitored the balance of tissue paper rolls in the house. The center panel describes the percentage of the toilet paper left and the remaining battery in each room. When the tissue papers run out, the user refills the paper, and the web application automatically decreases the balance of total tissue paper in the house. The users can subscribe to the vendor’s tissue packages based on the real-time tissue usage. Moreover, there is a form to add new room information when there is a new TMS installed. The right panel displays the tissue paper products from various vendors, providing a quick purchase interface as well.
The TMS provides a new business model for tissue vendors and removes tissue paper from daily shopping list for the users. After all, the TMS make our lives smarter and looks forward to smart cities.


 ,
, 


