
Application Specific Reconfigurable Processor for Eyeblink Detection from Dual-Channel EOG Signal

 ,
,  , , ,
, , ,
Abstract
:
1. Introduction
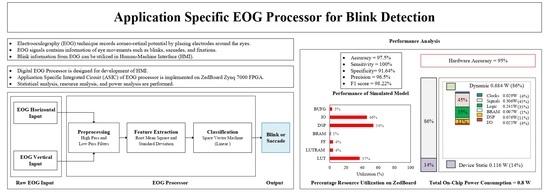
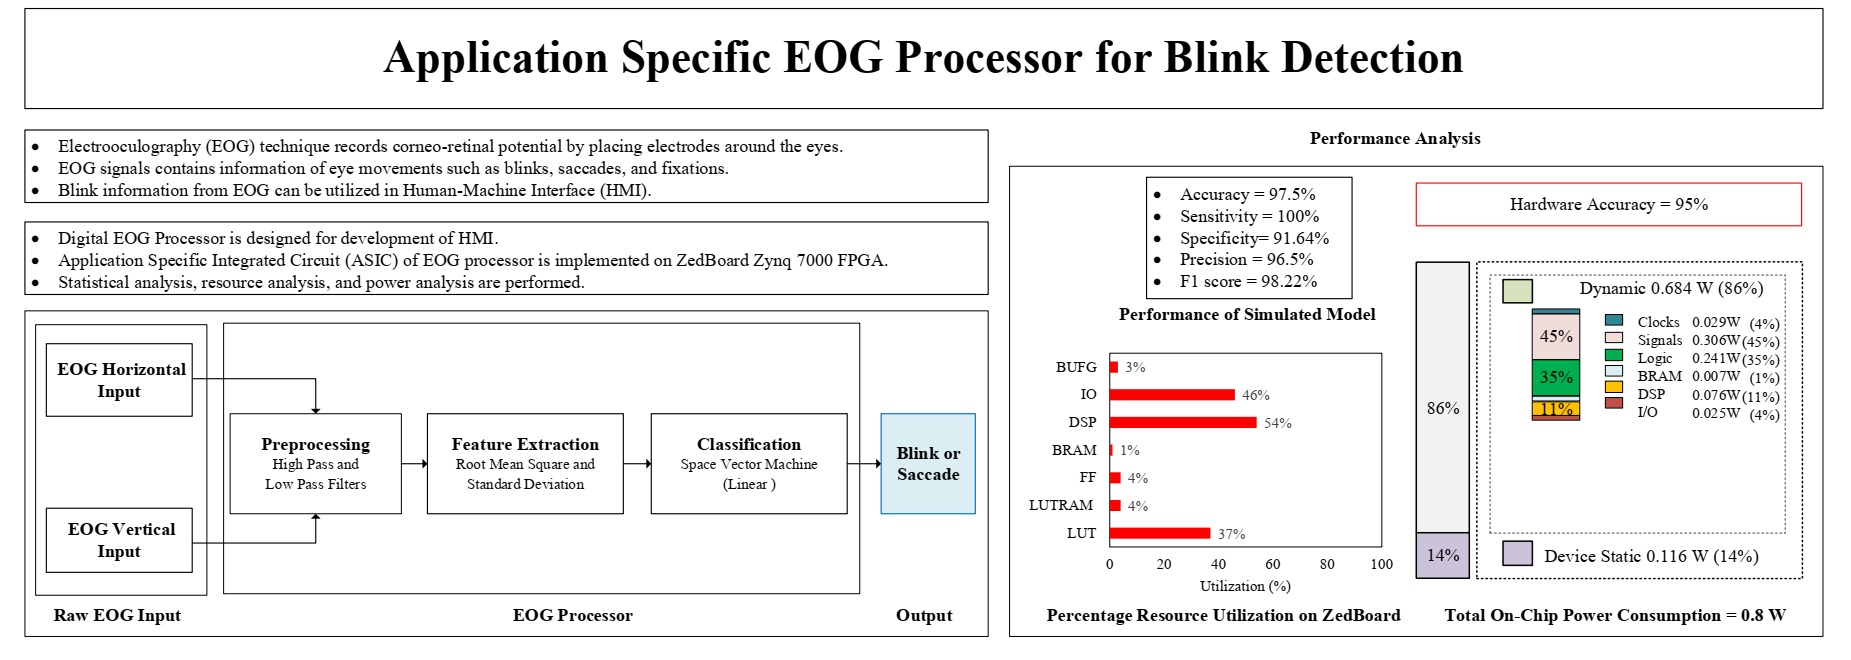
- A dual-channel EOG signal processor for blink detection with better accuracy at the software level than state-of-the-art works.
- A first-of-its-kind hardware-implemented EOG signal processor for blink detection.
- Better accuracy in the hardware-implemented model than the state-of-the-art works.
2. Background
2.1. Electrooculogram
2.2. Blinks
2.3. Saccades
2.4. Fixations
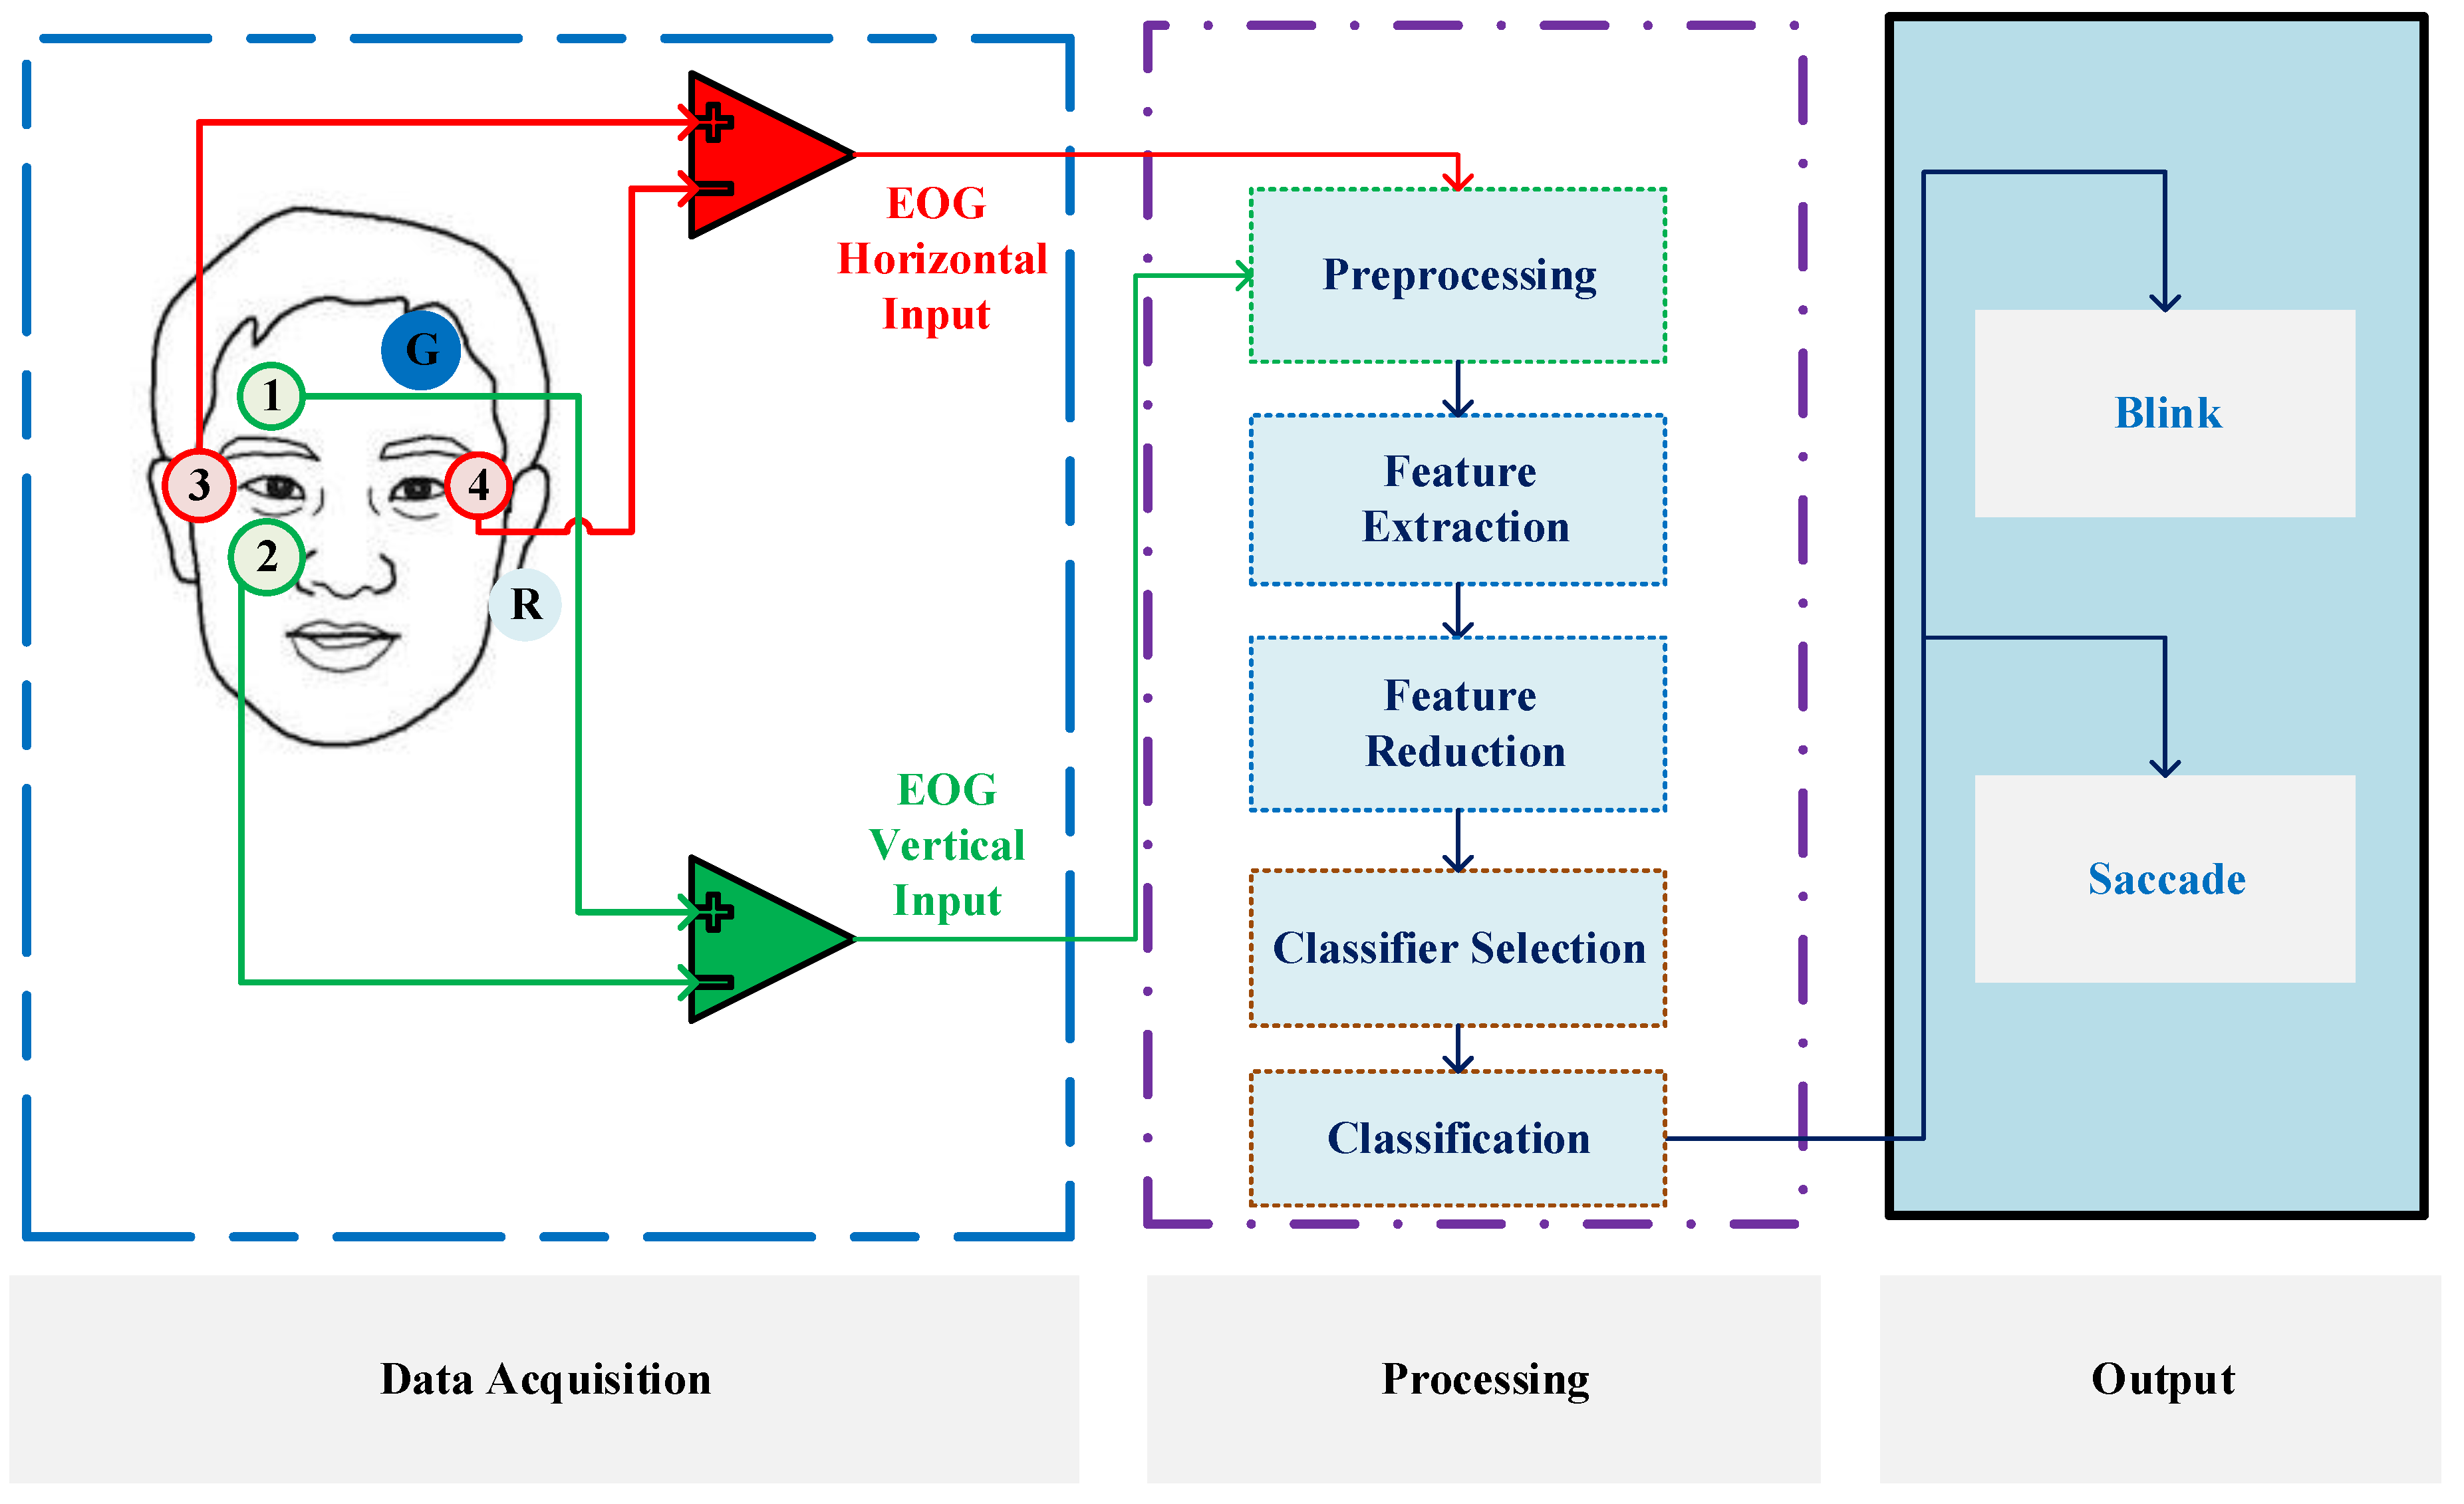
3. Methodology
3.1. Dataset
3.2. Simulation
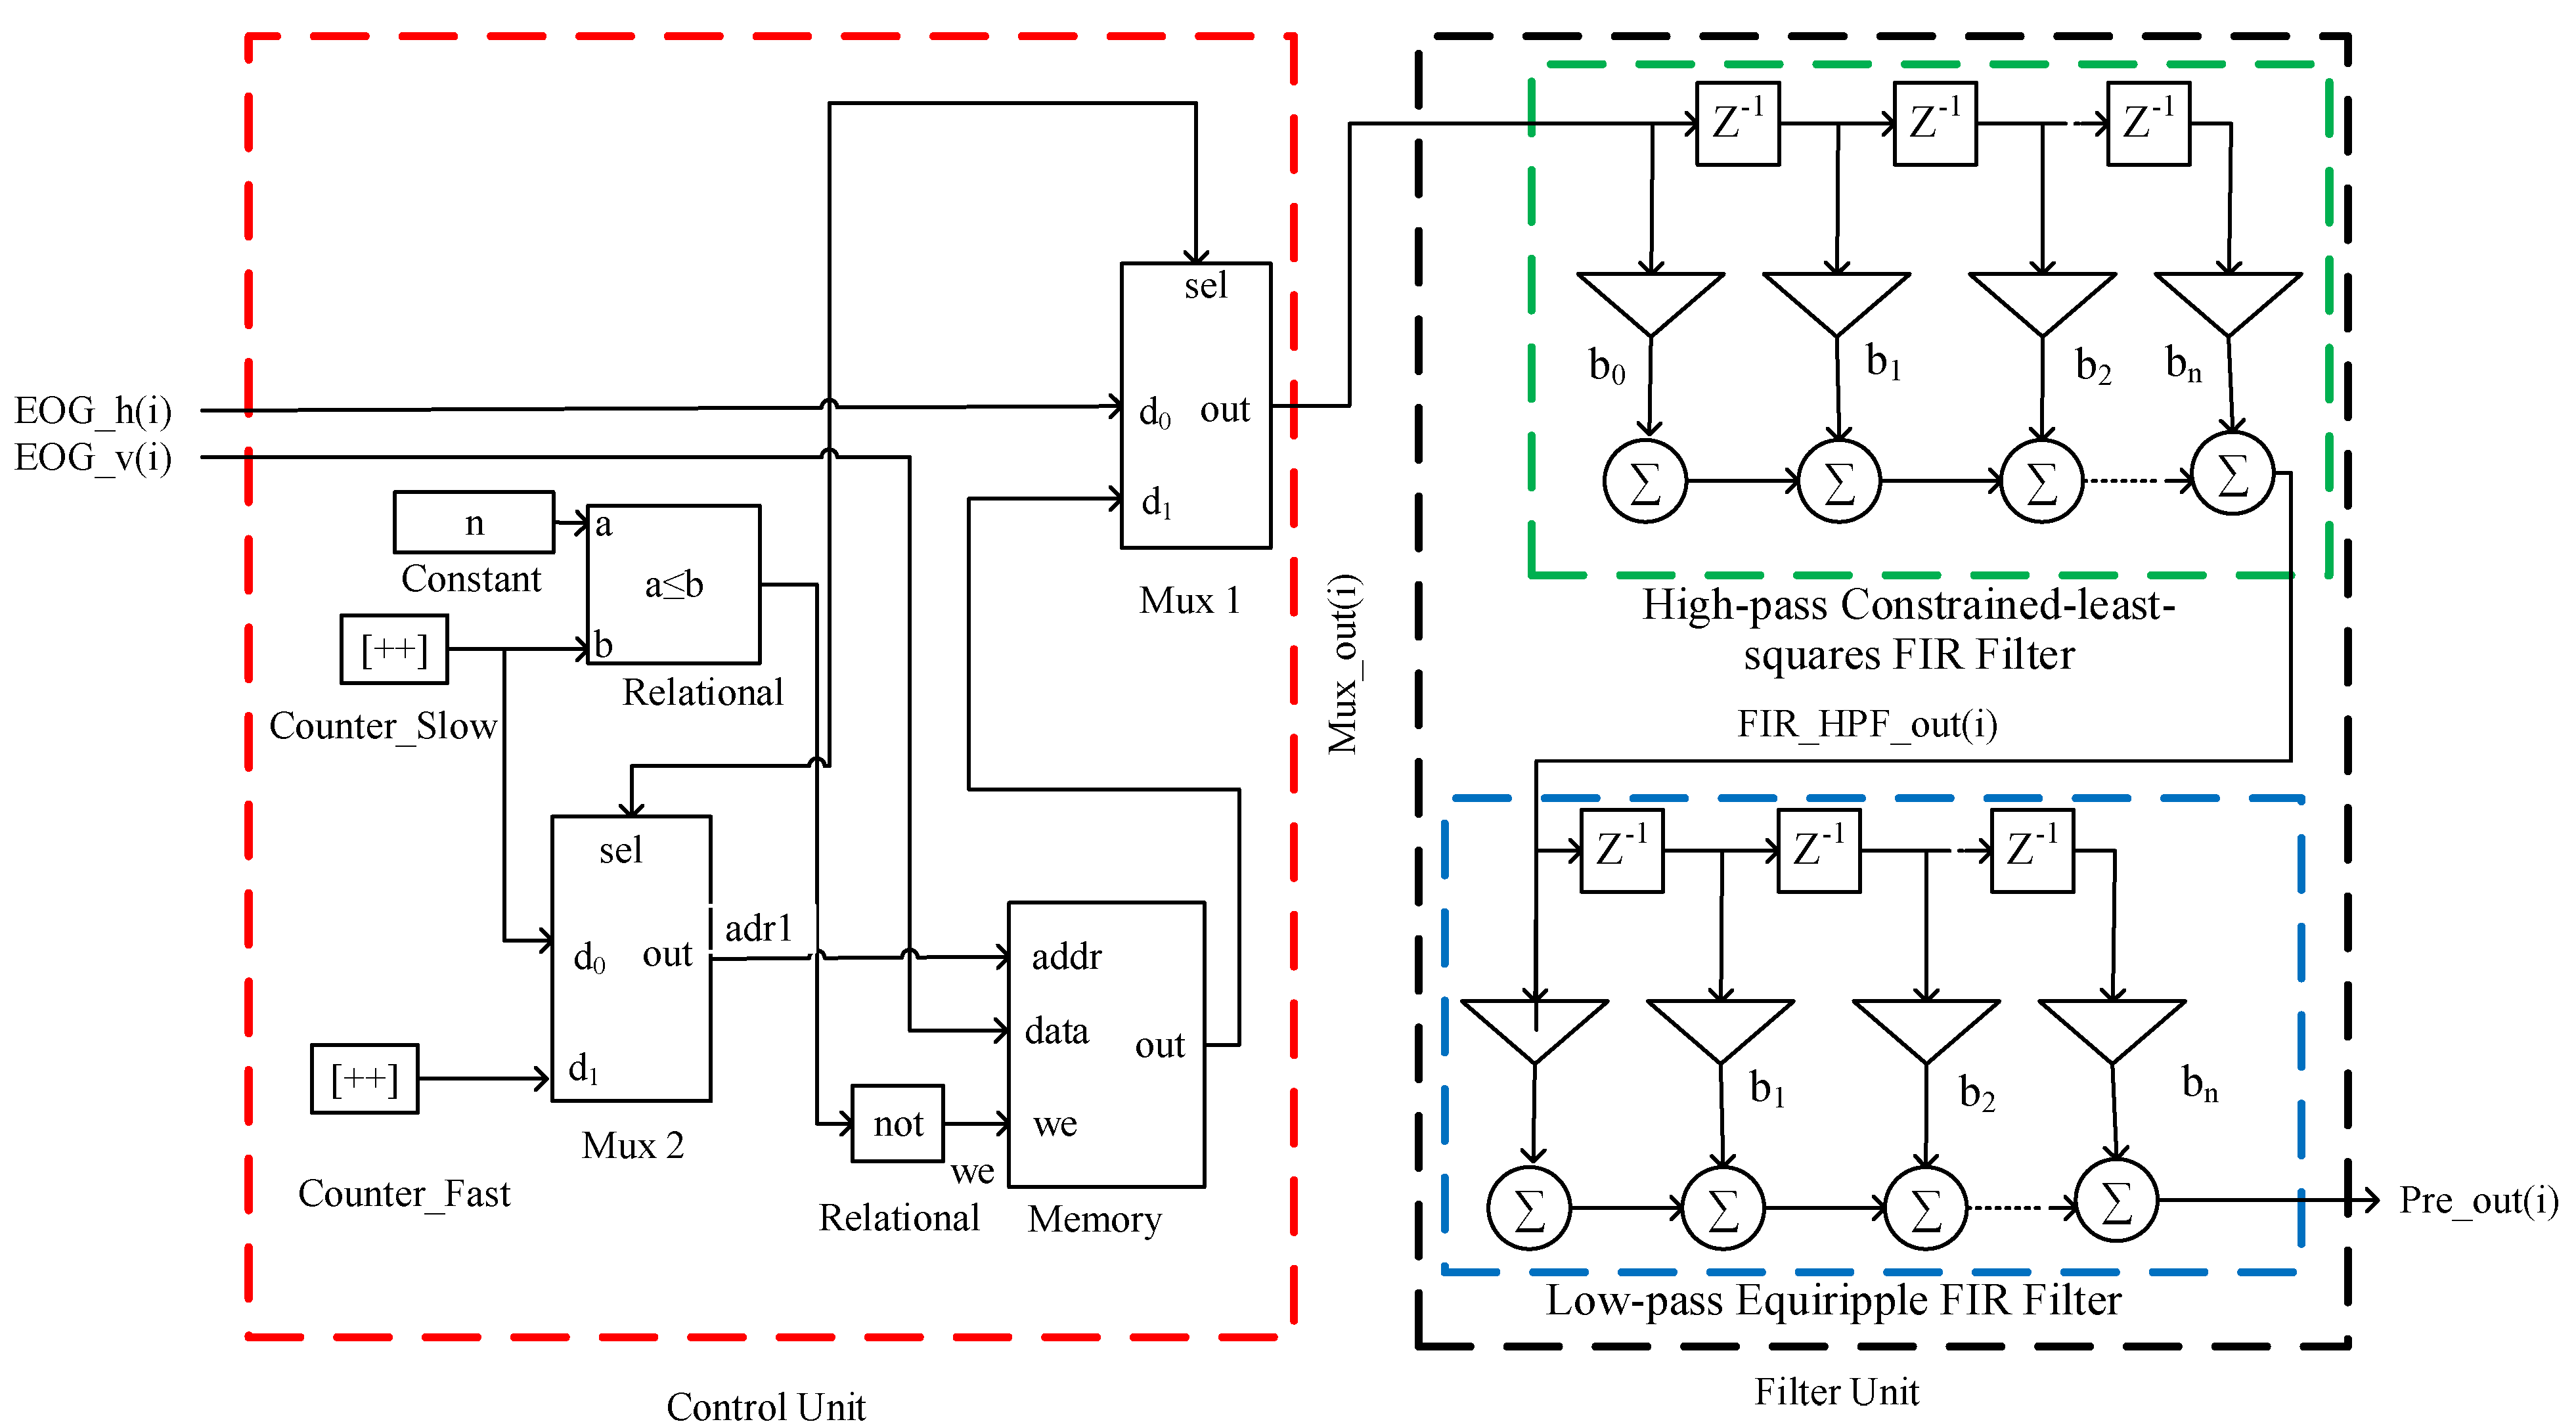
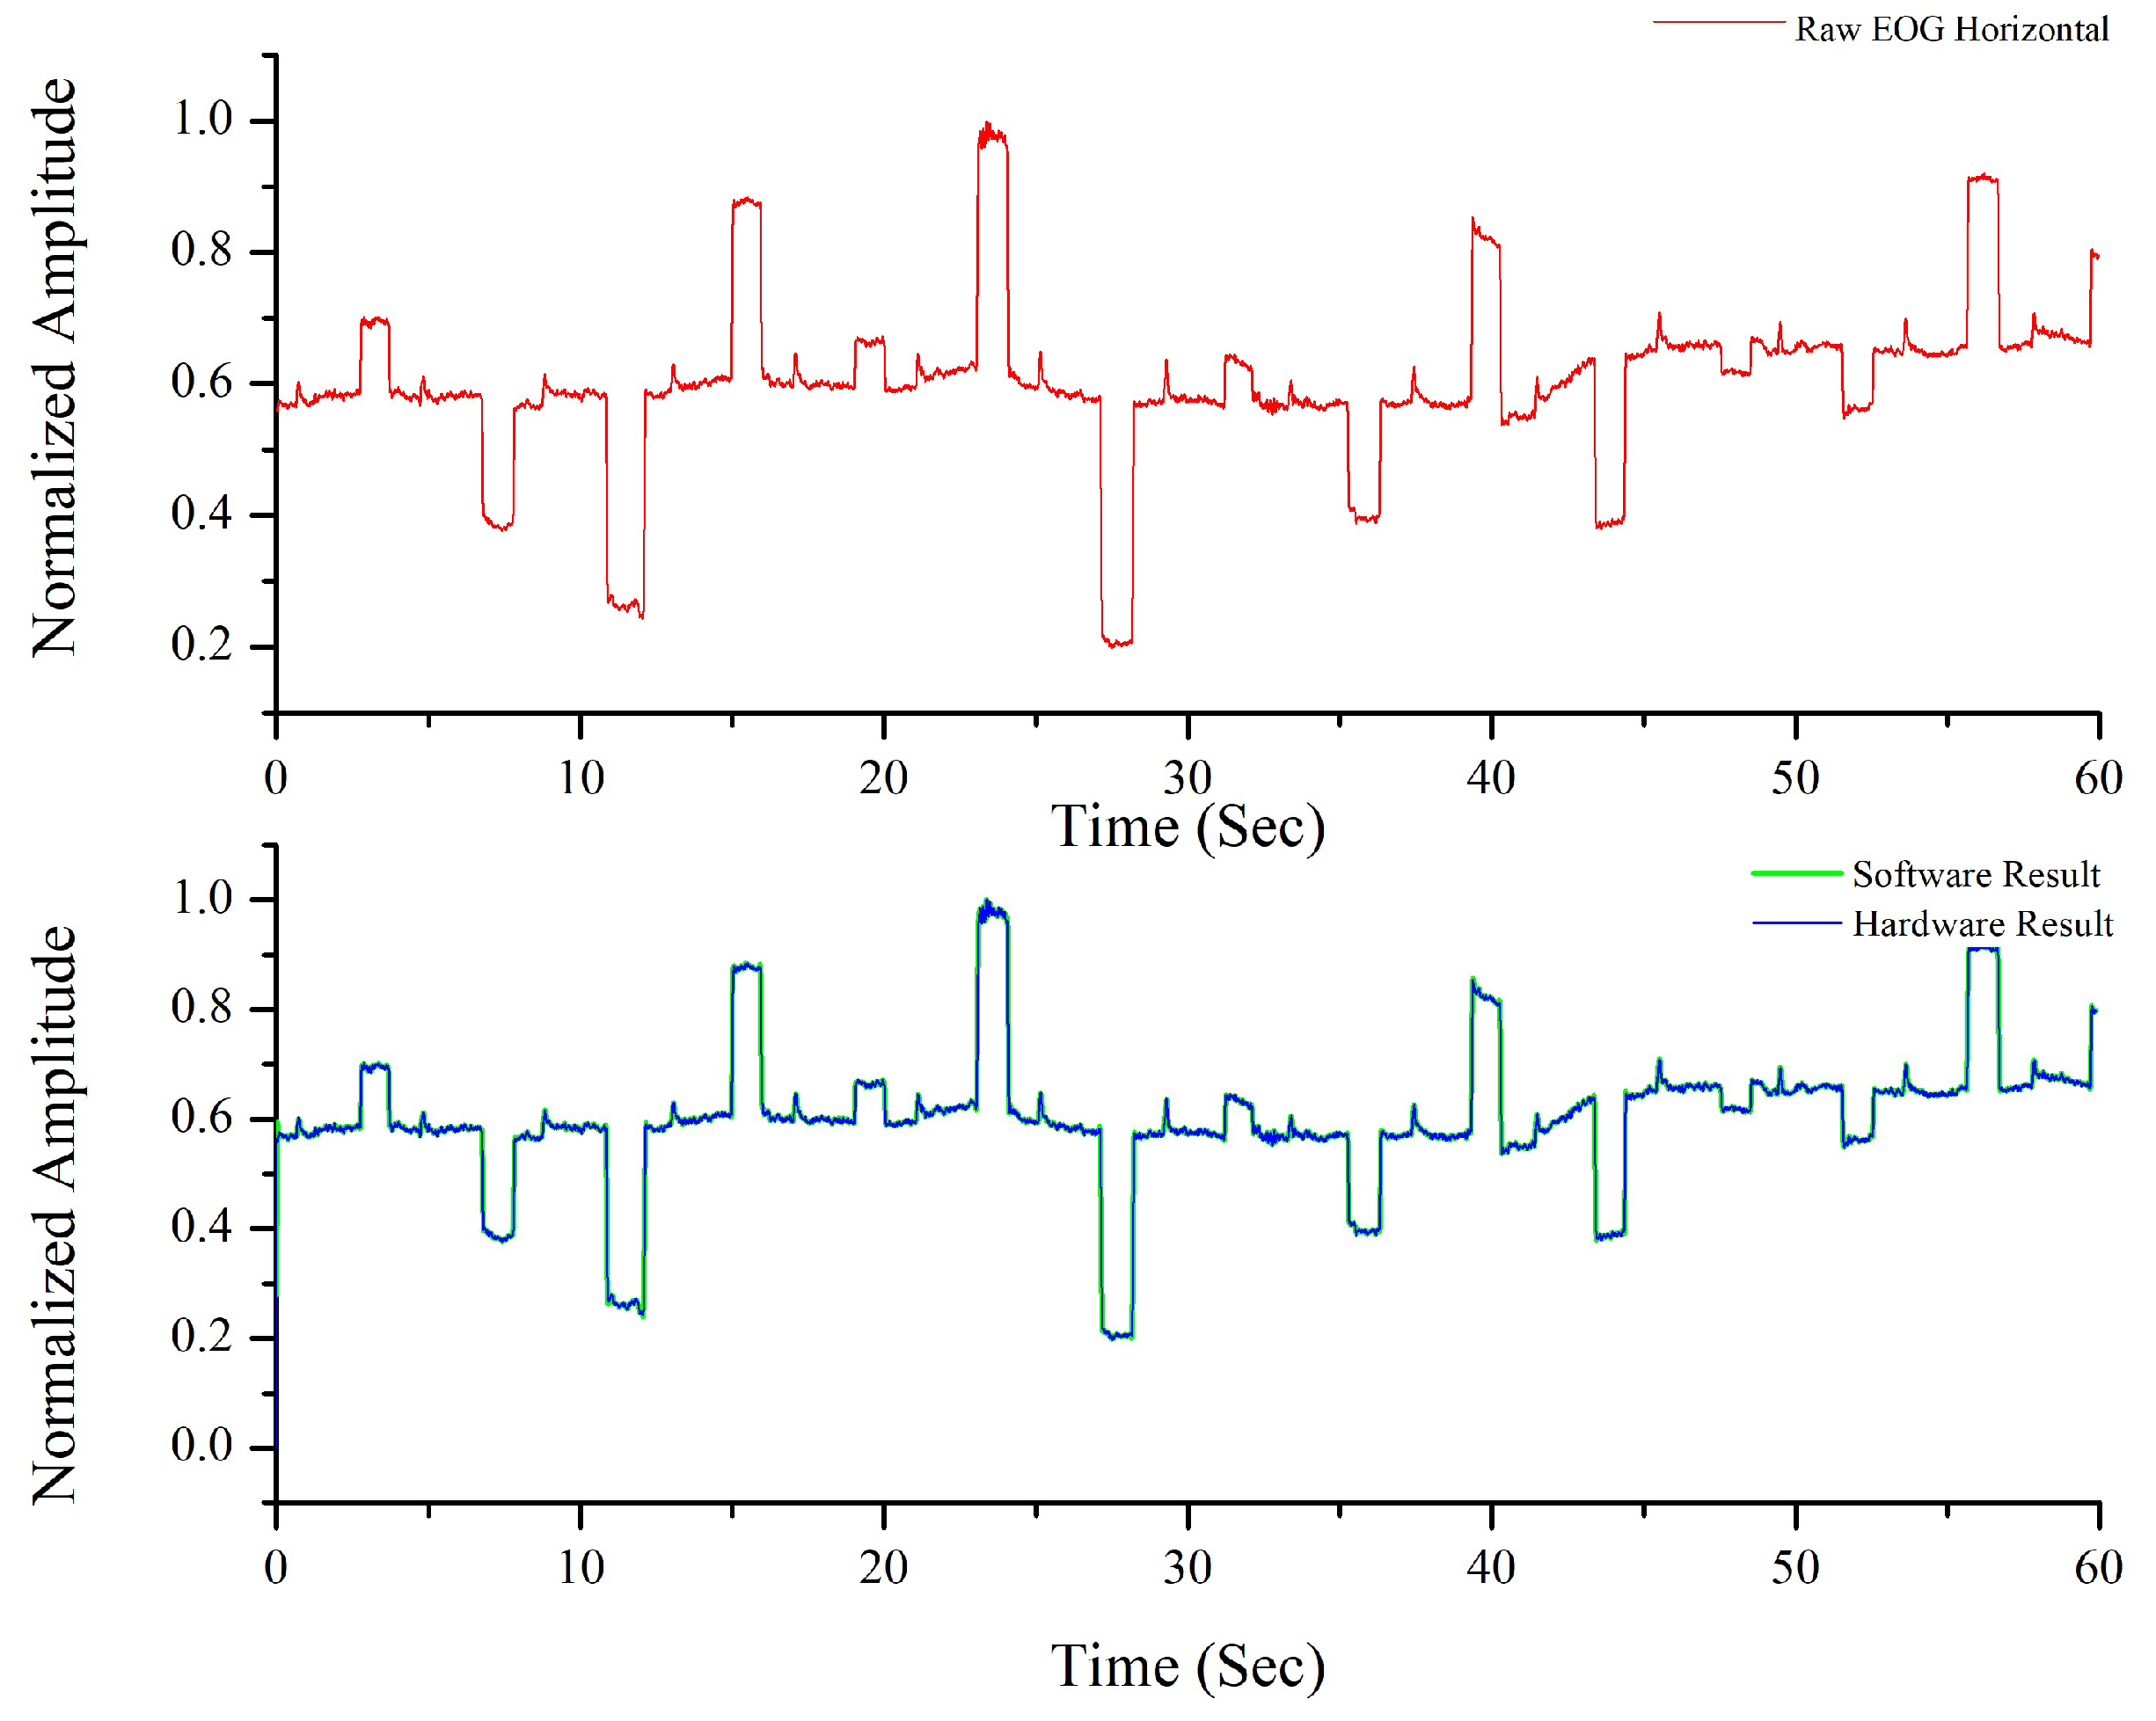
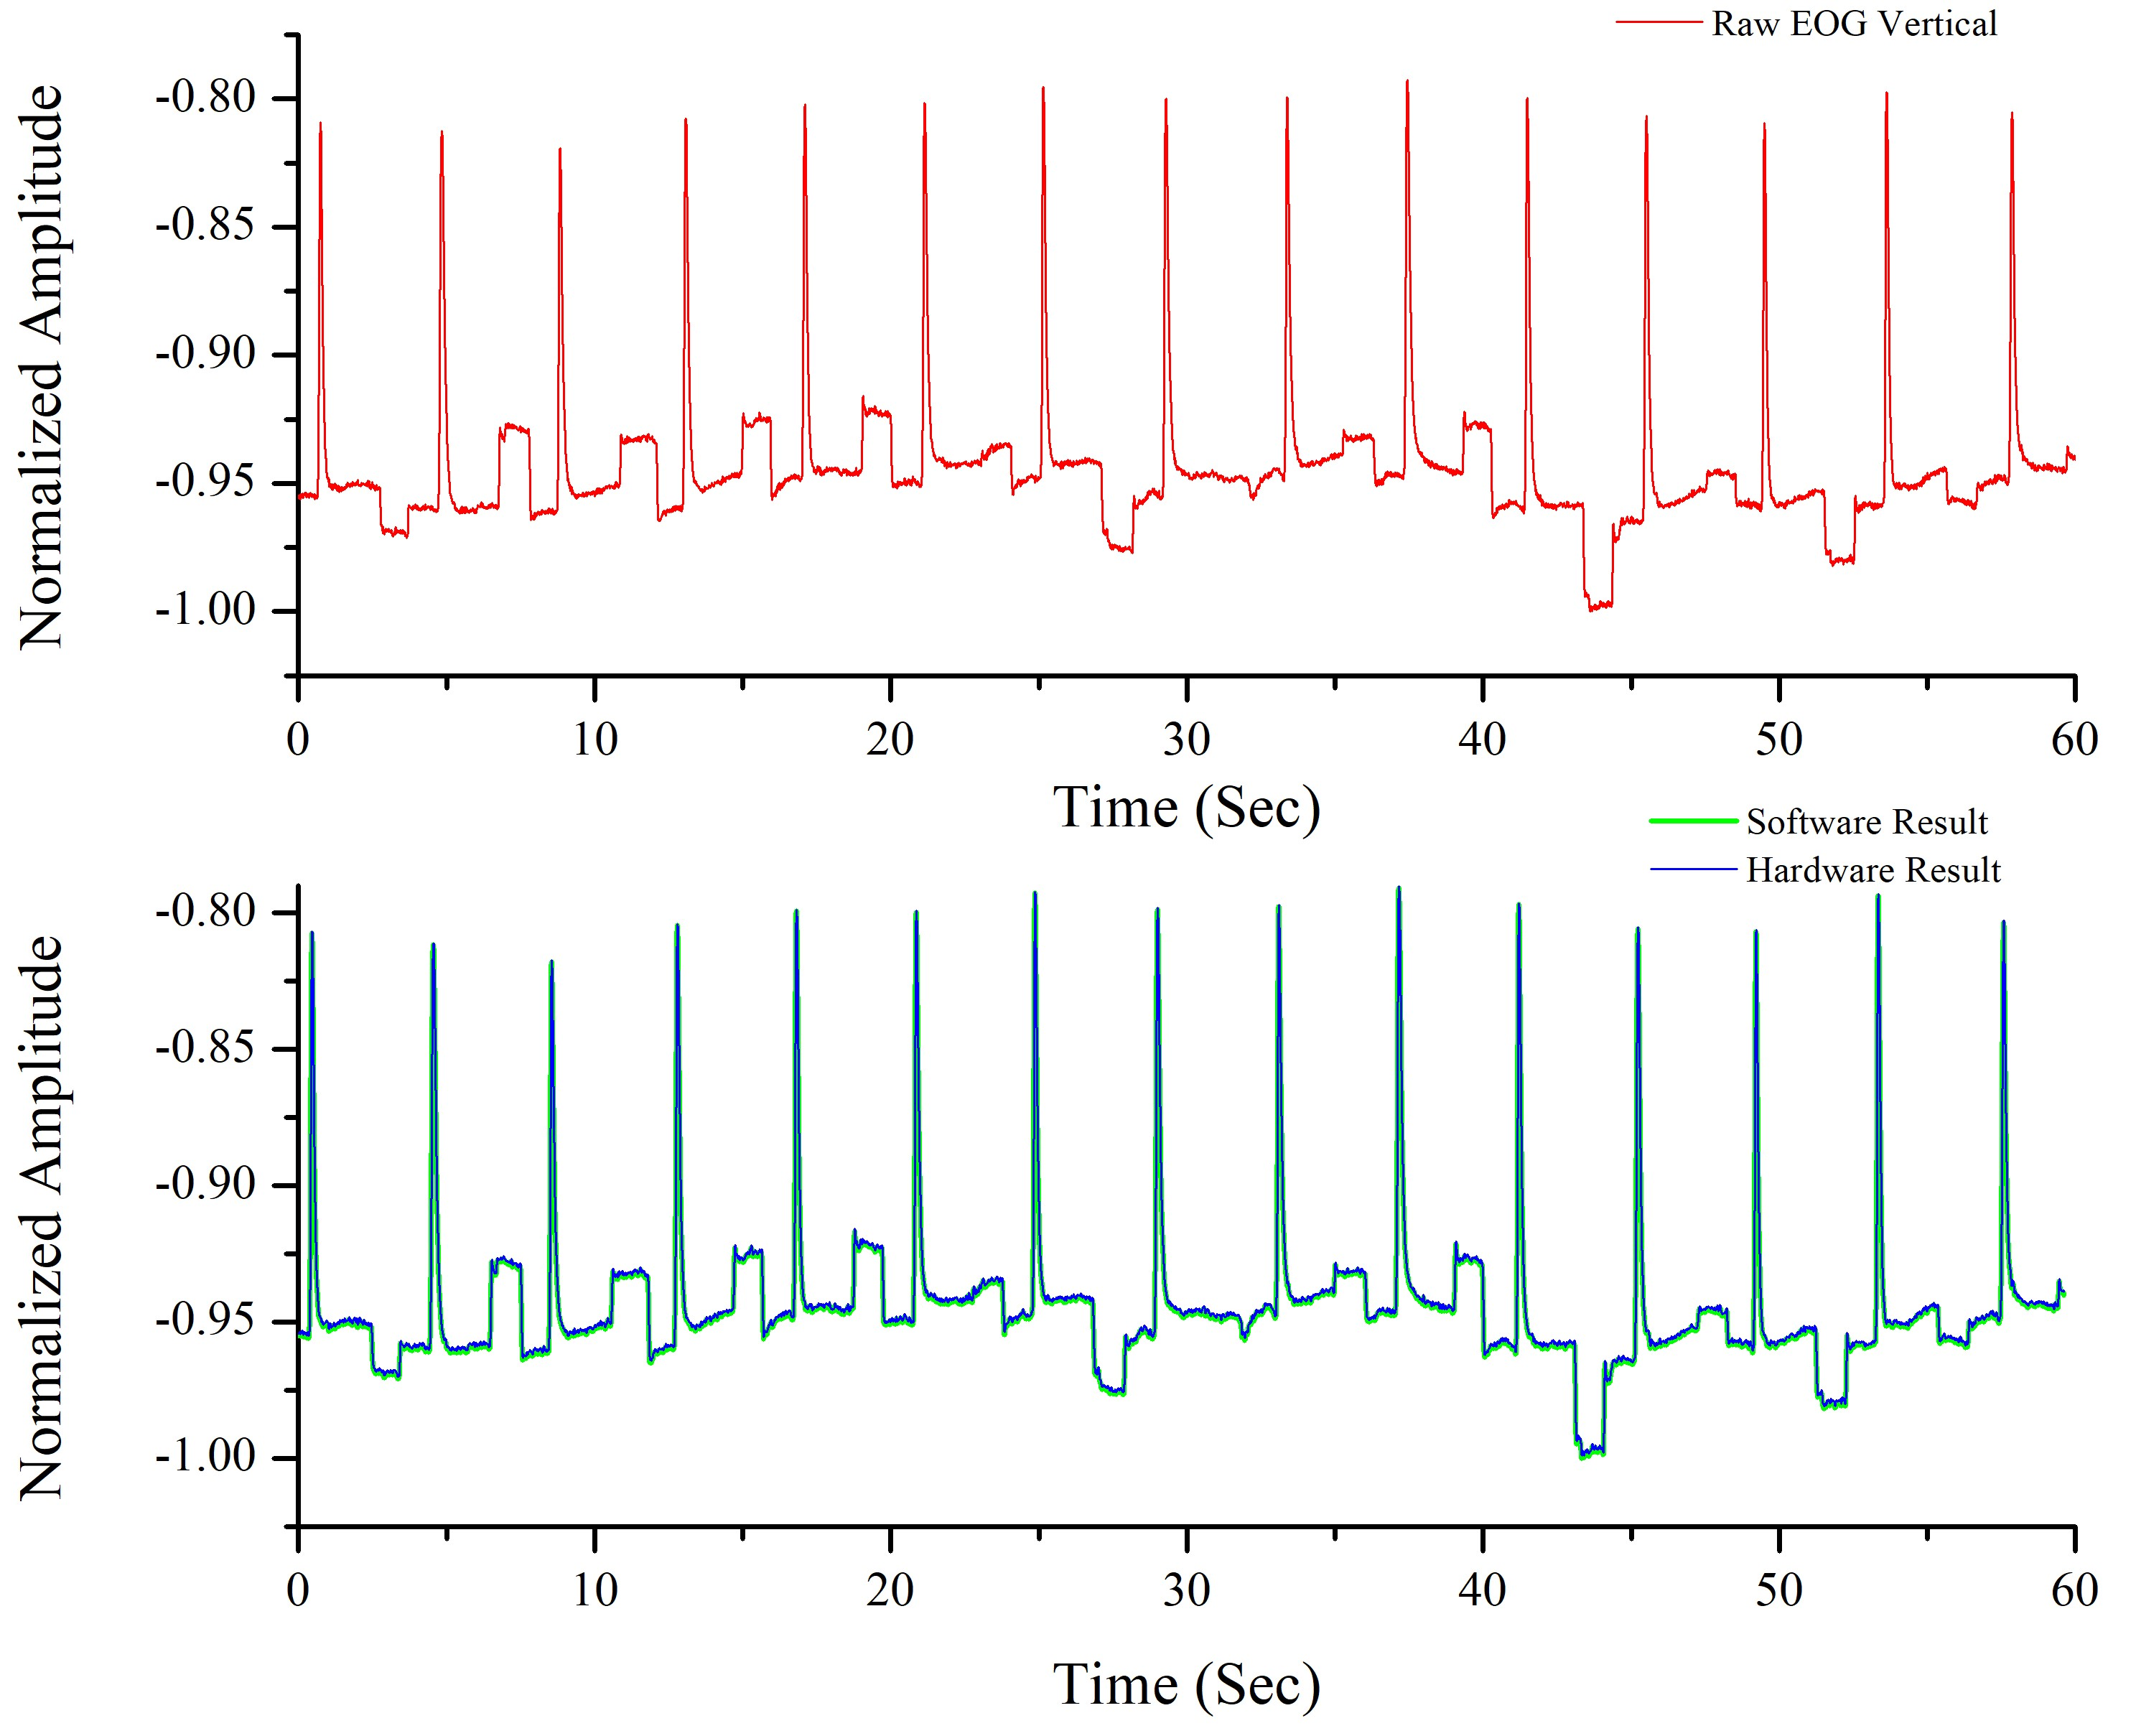
3.2.1. Preprocessing
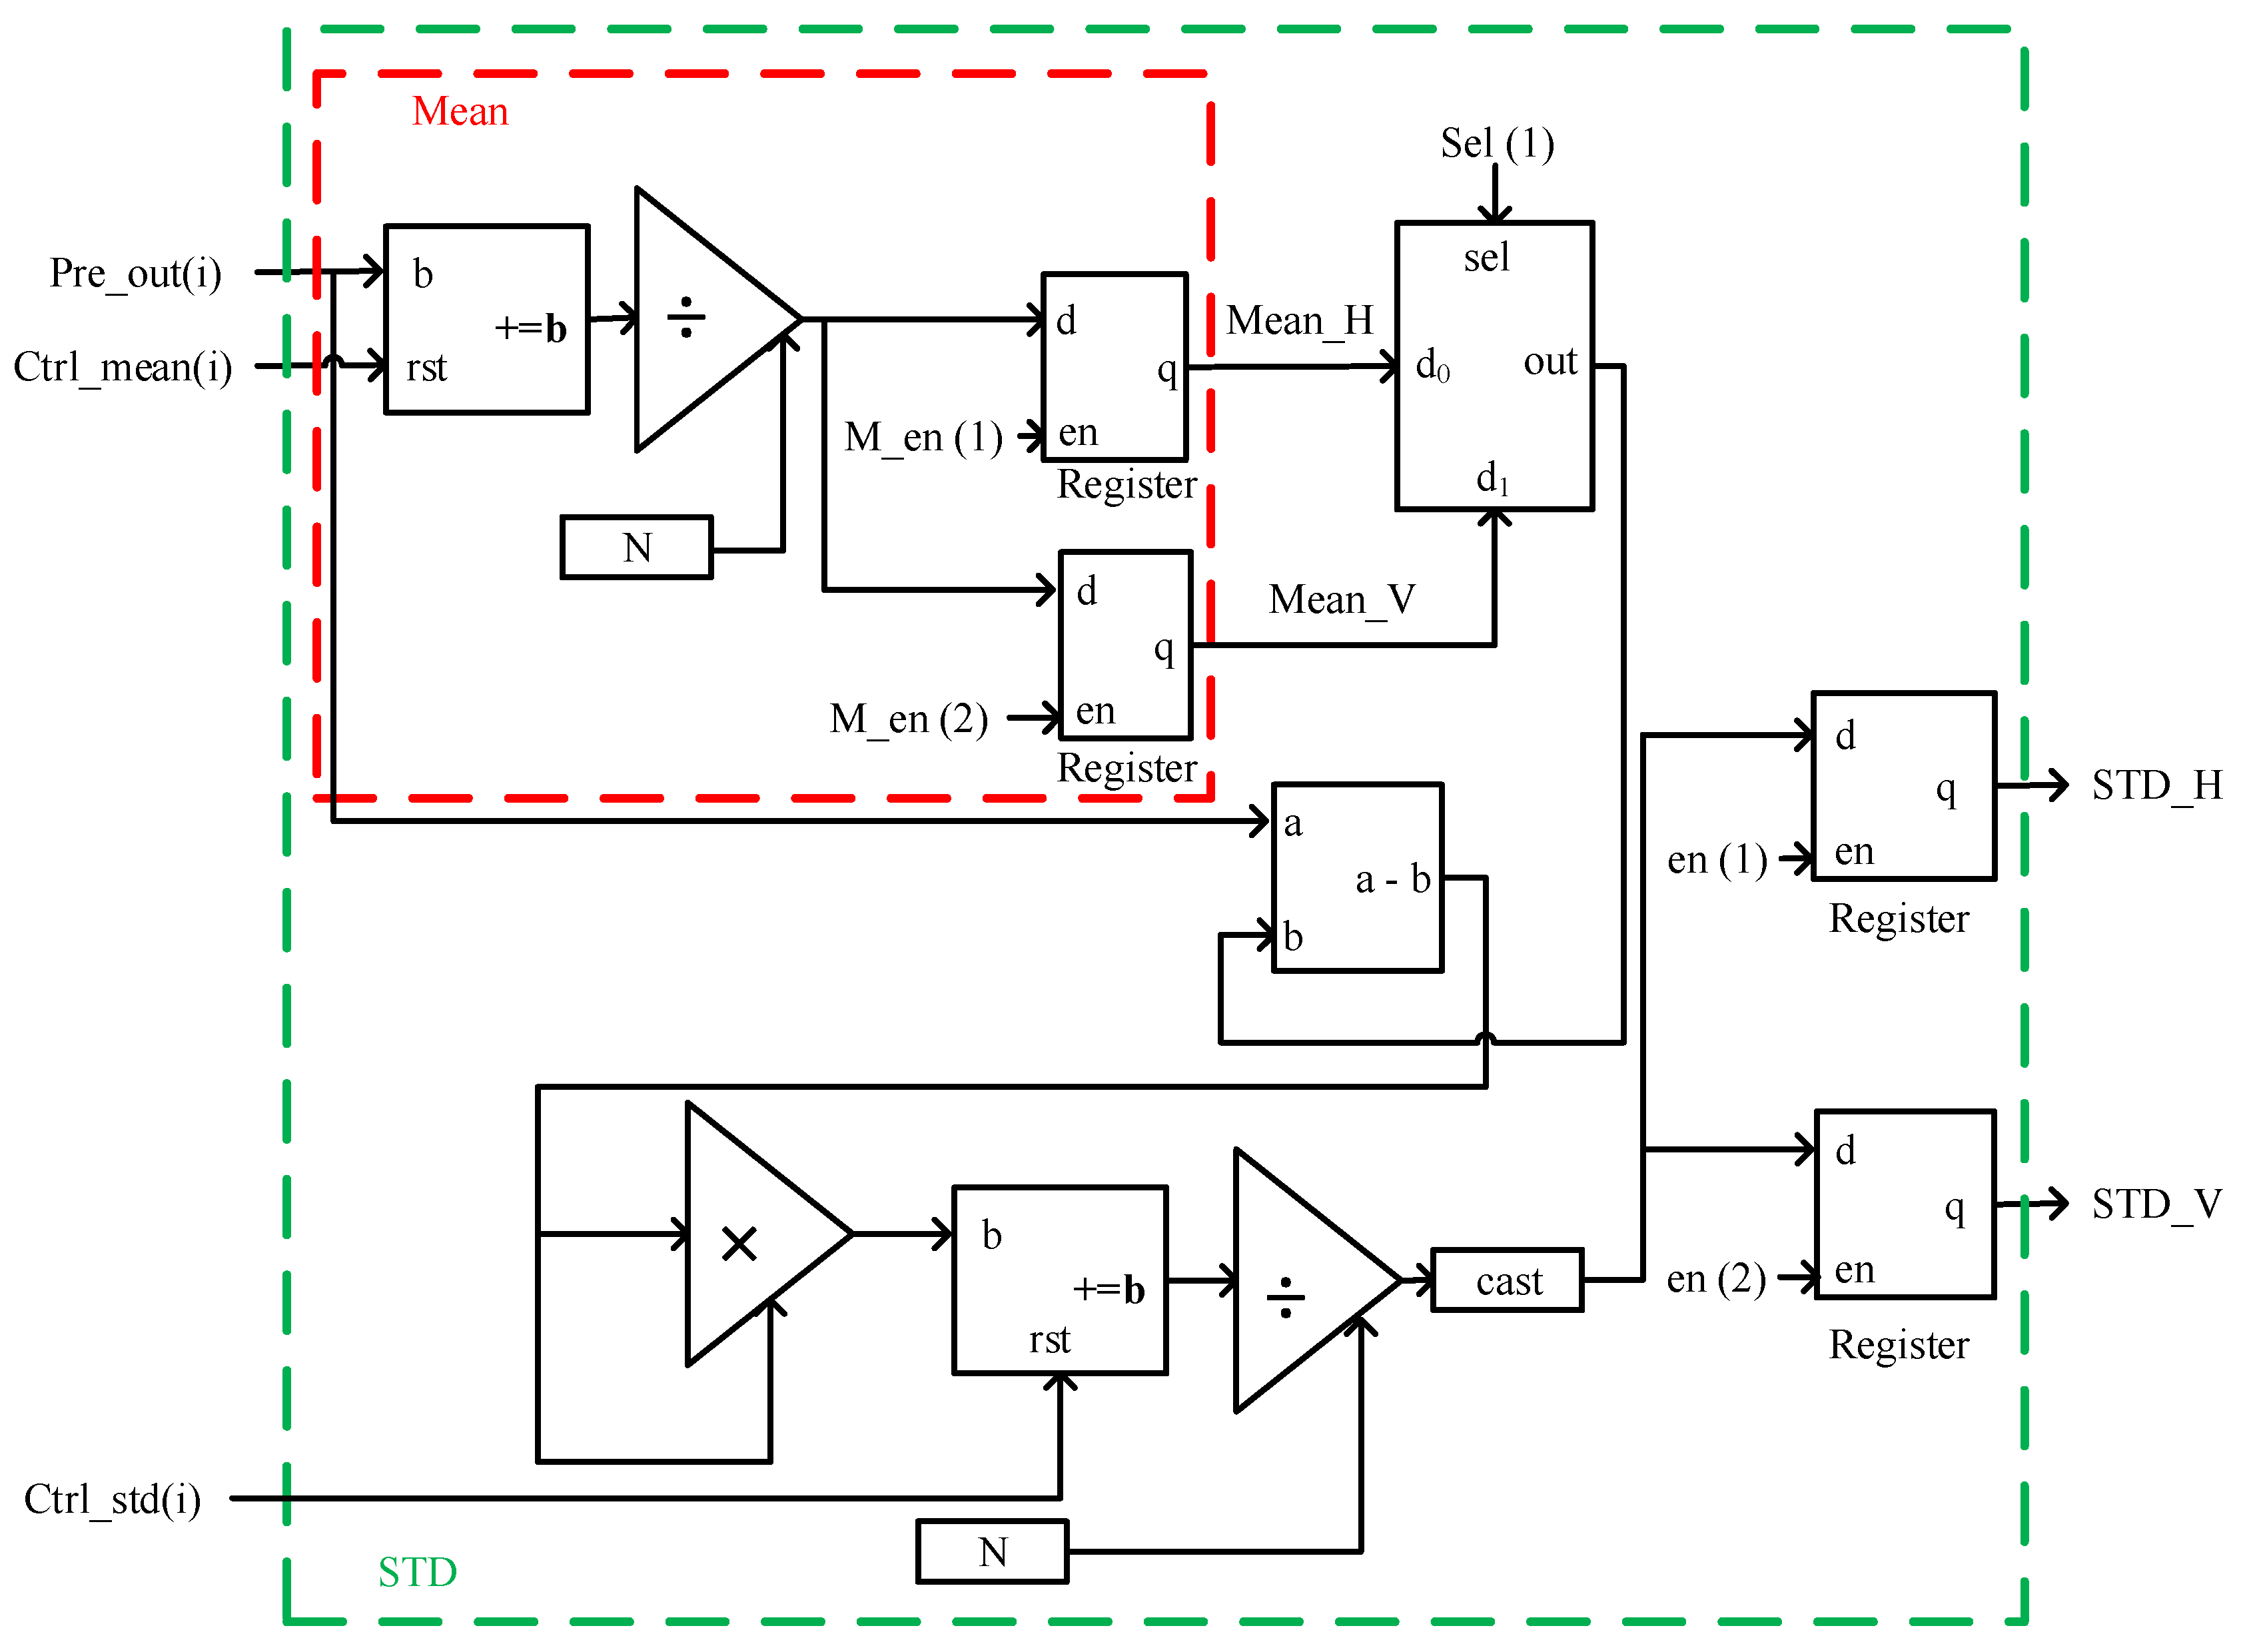
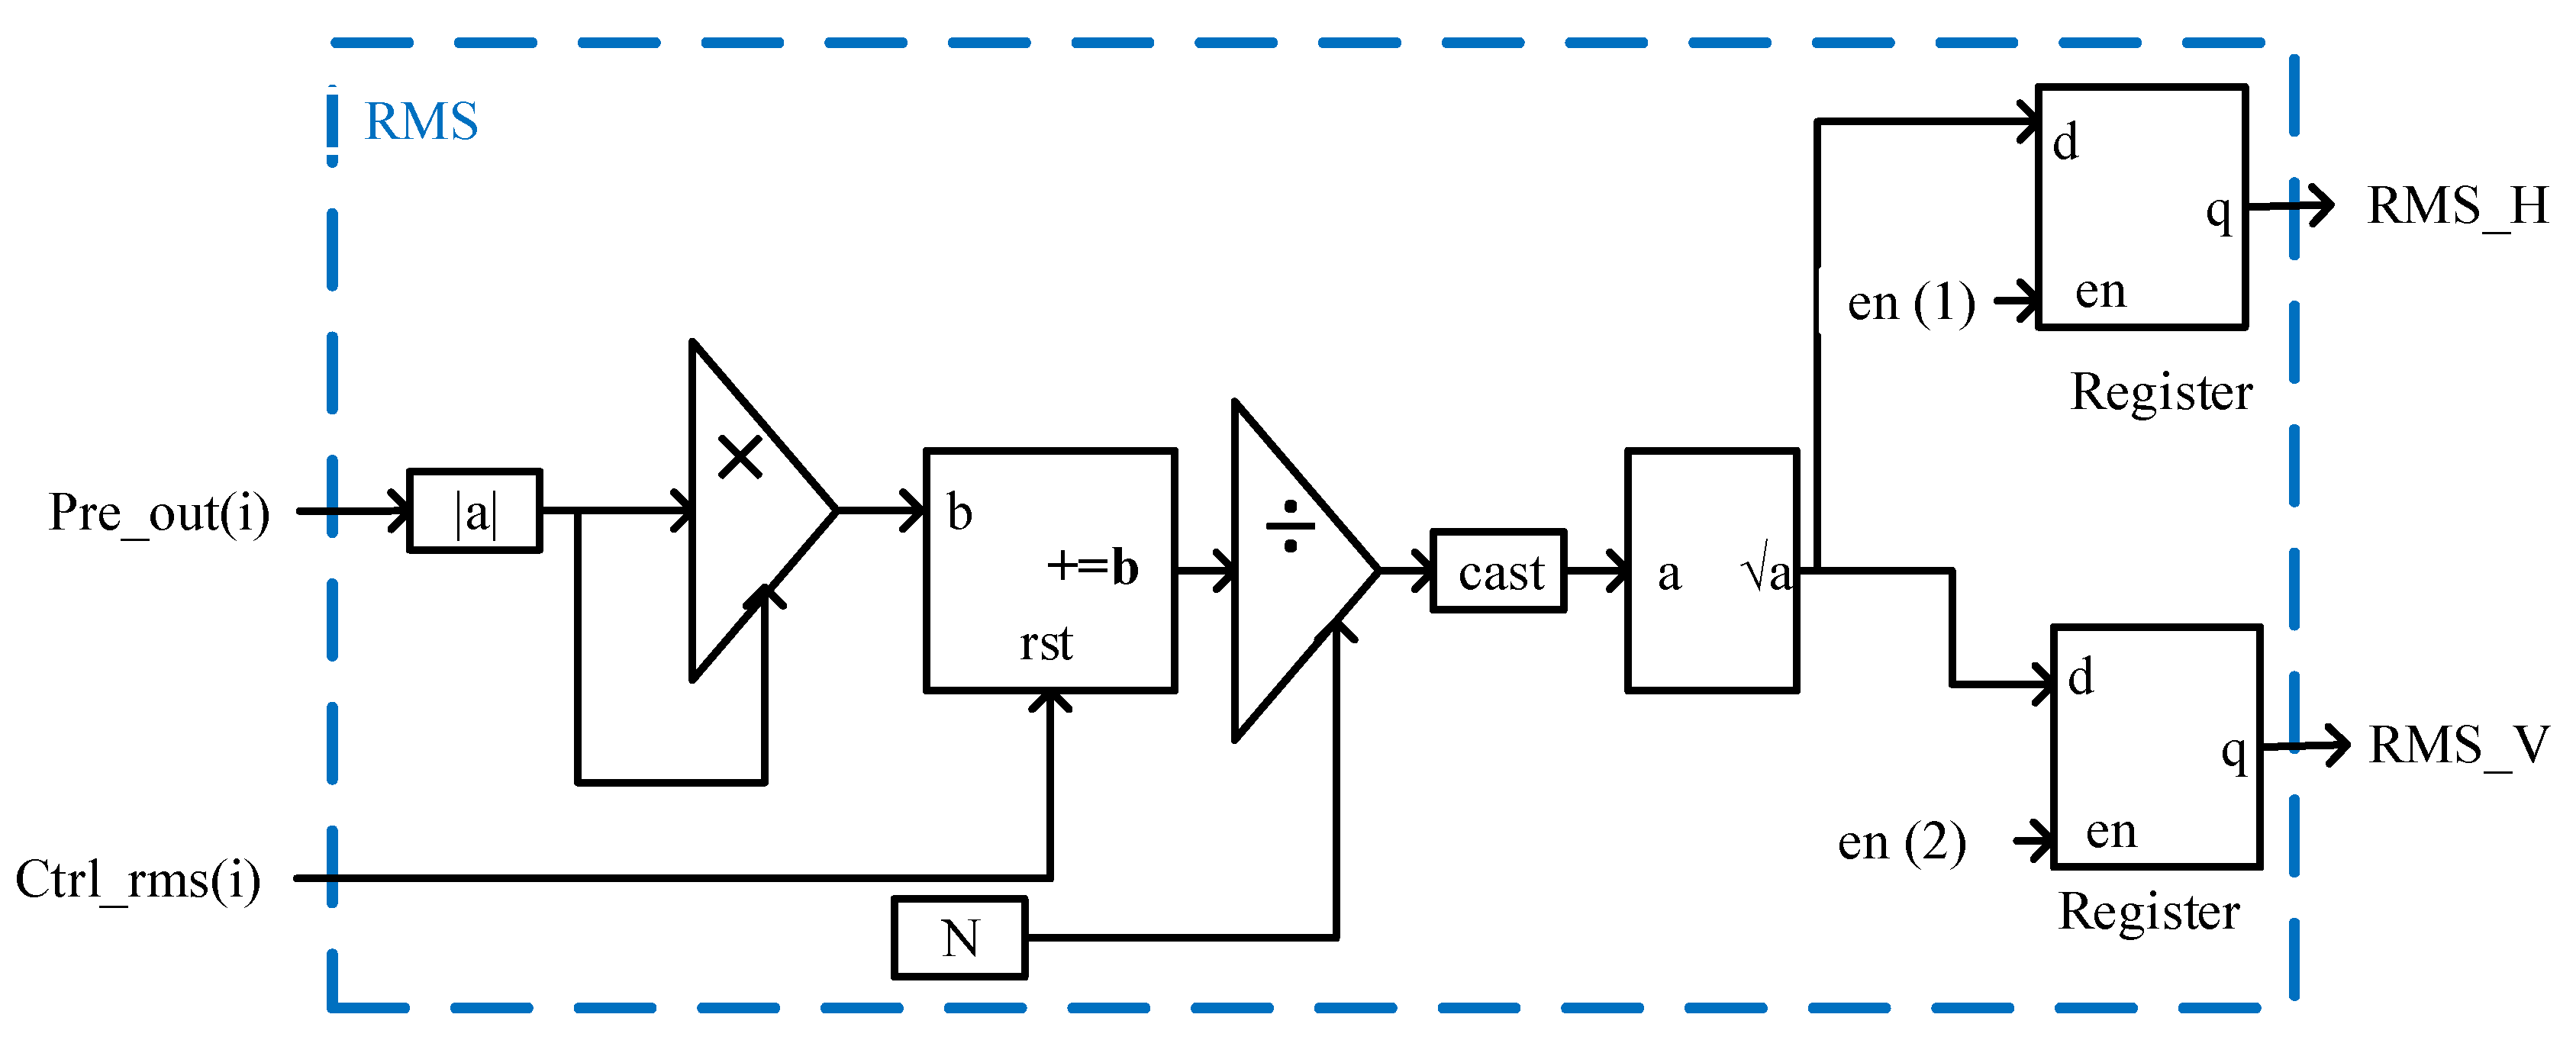
3.2.2. Feature Extraction
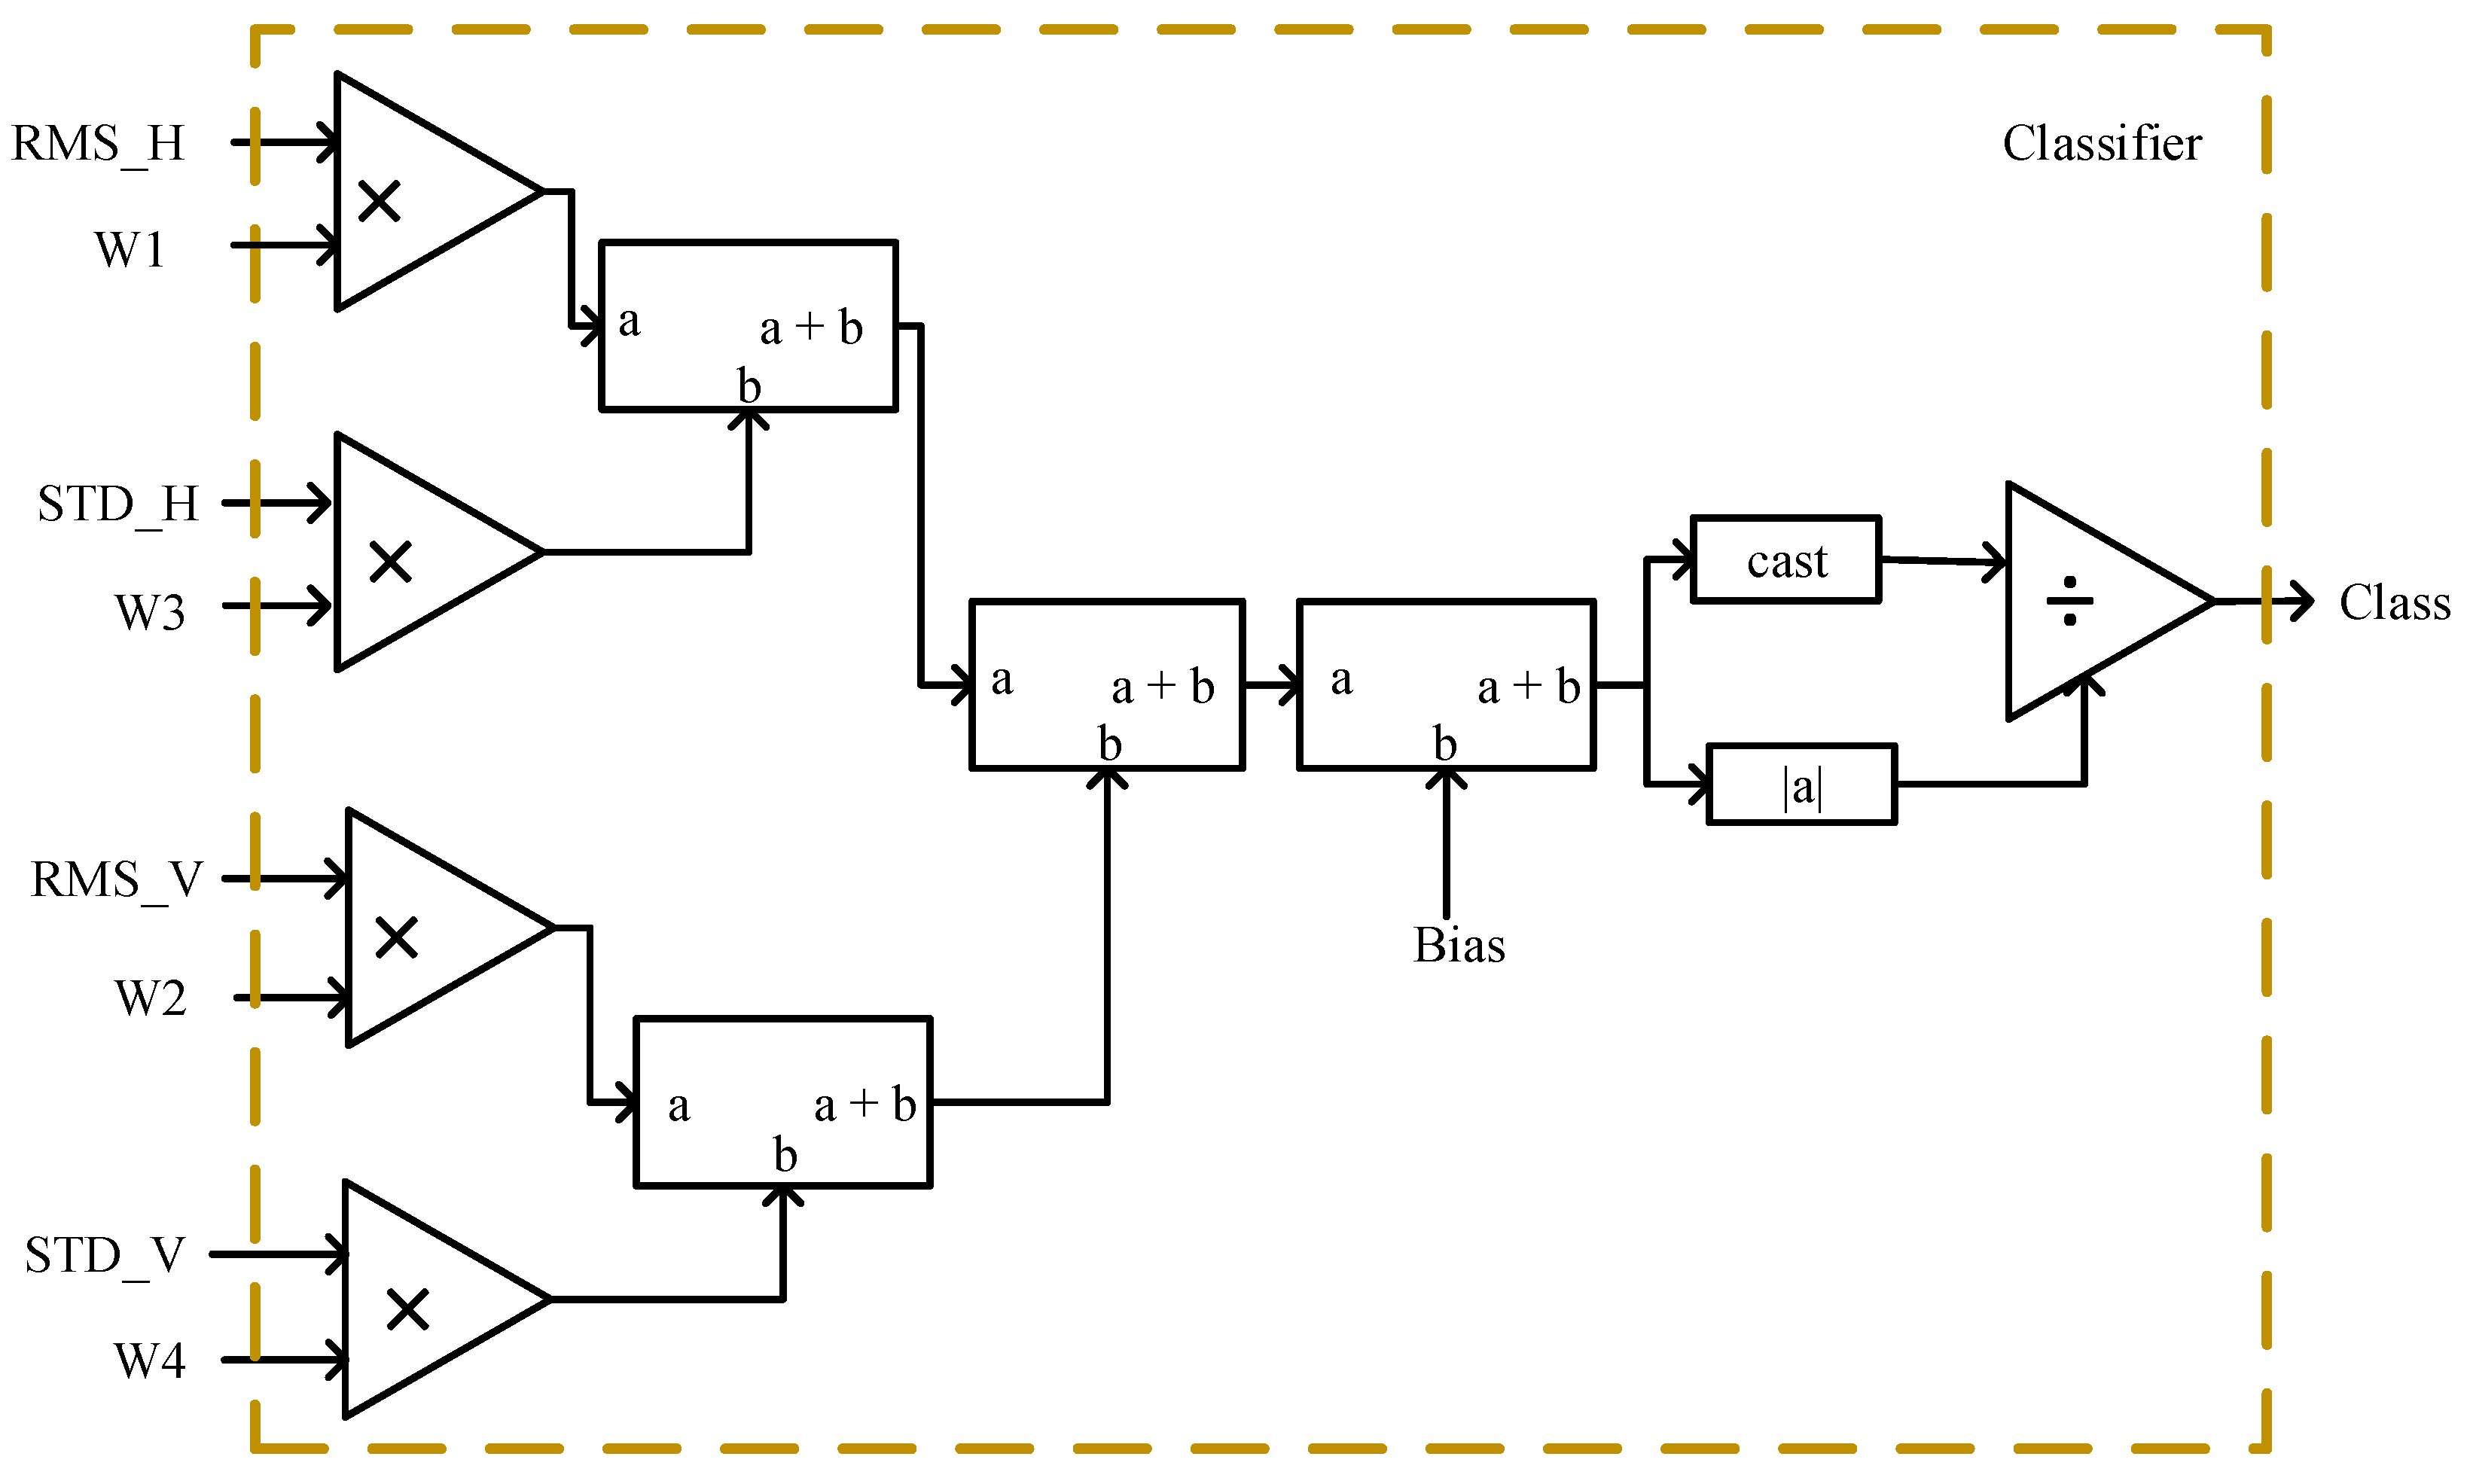
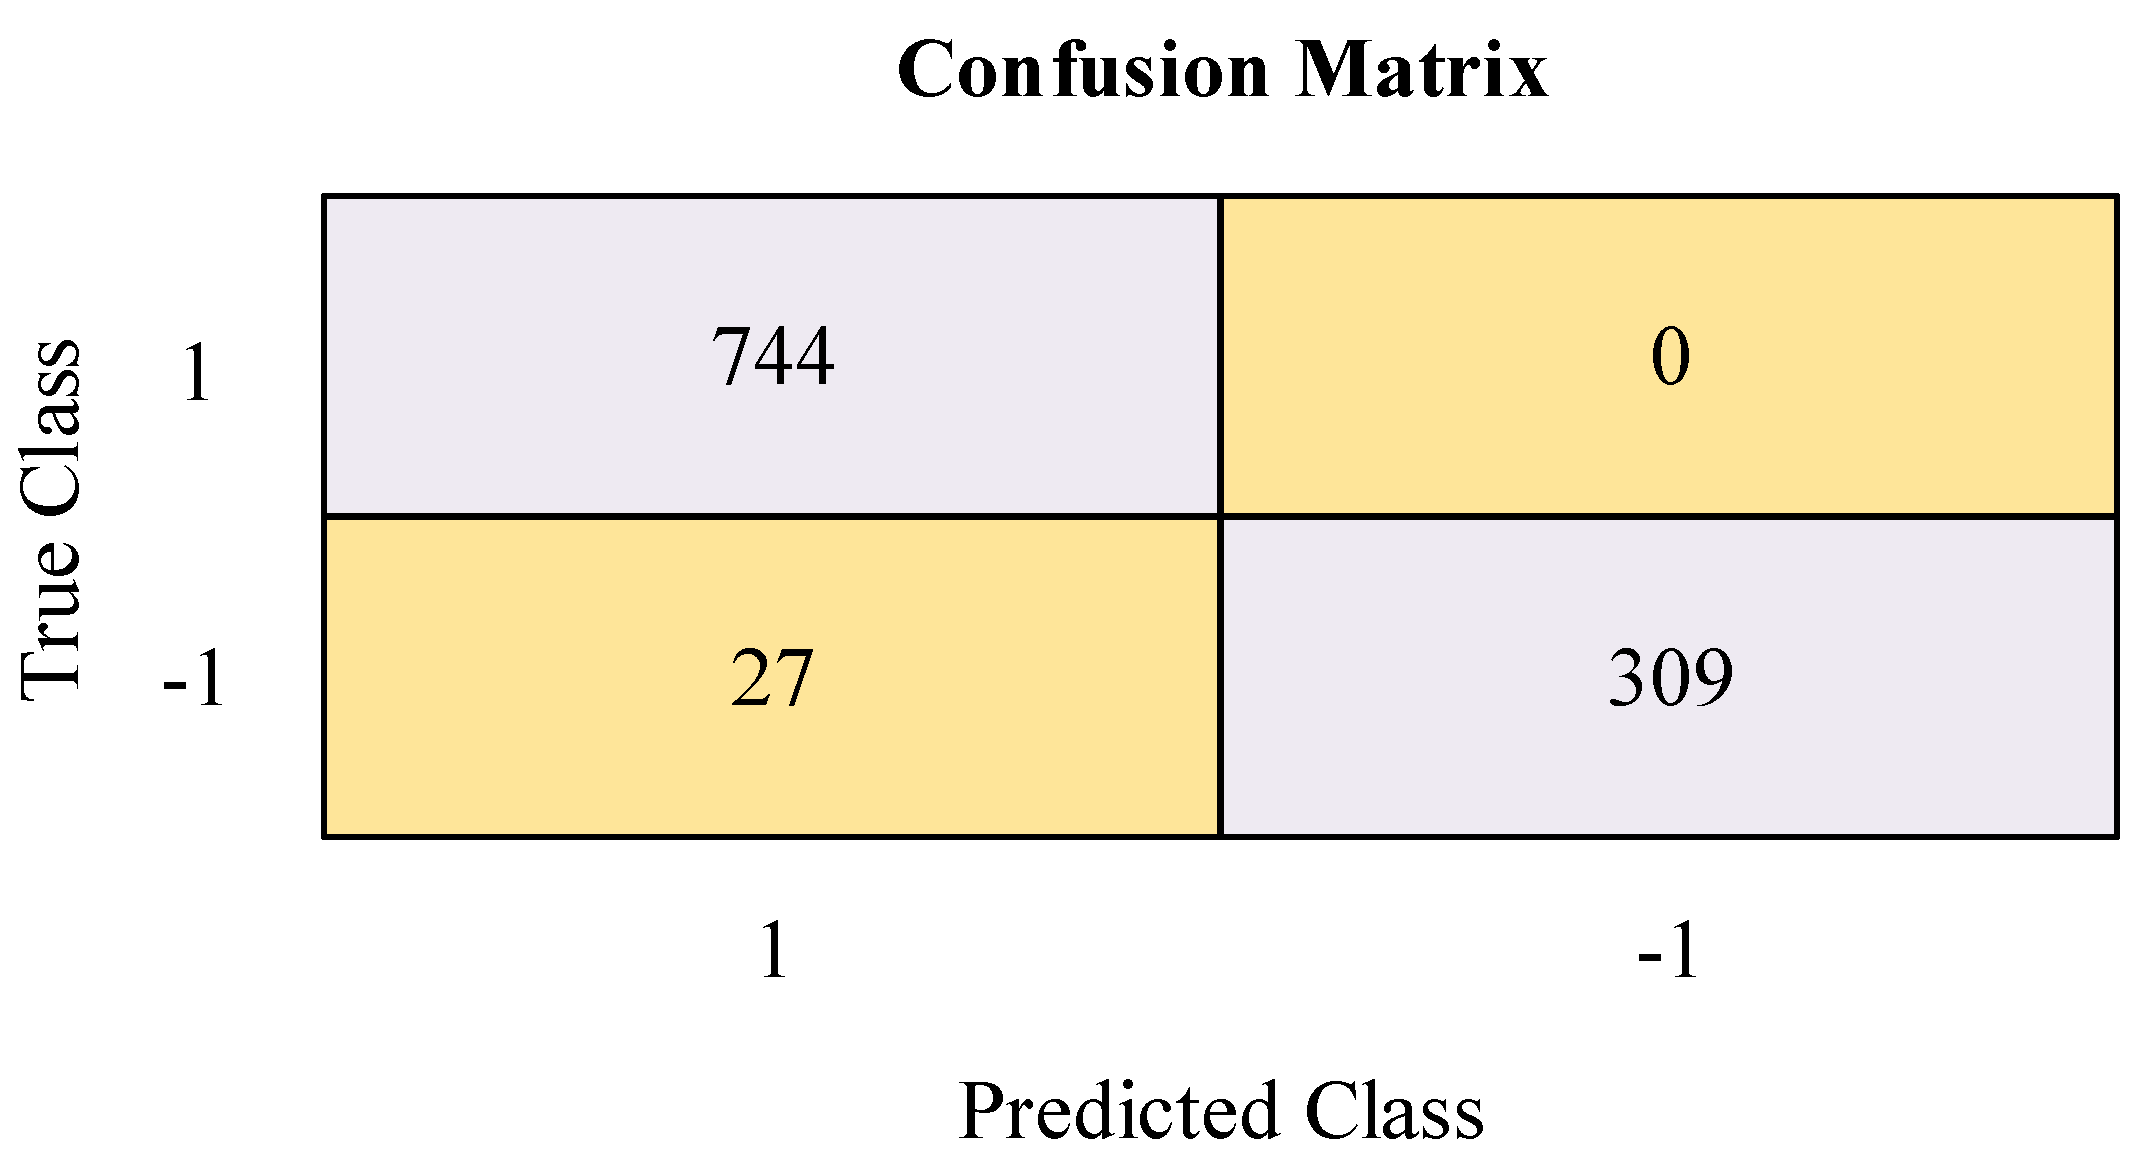
3.2.3. Classification
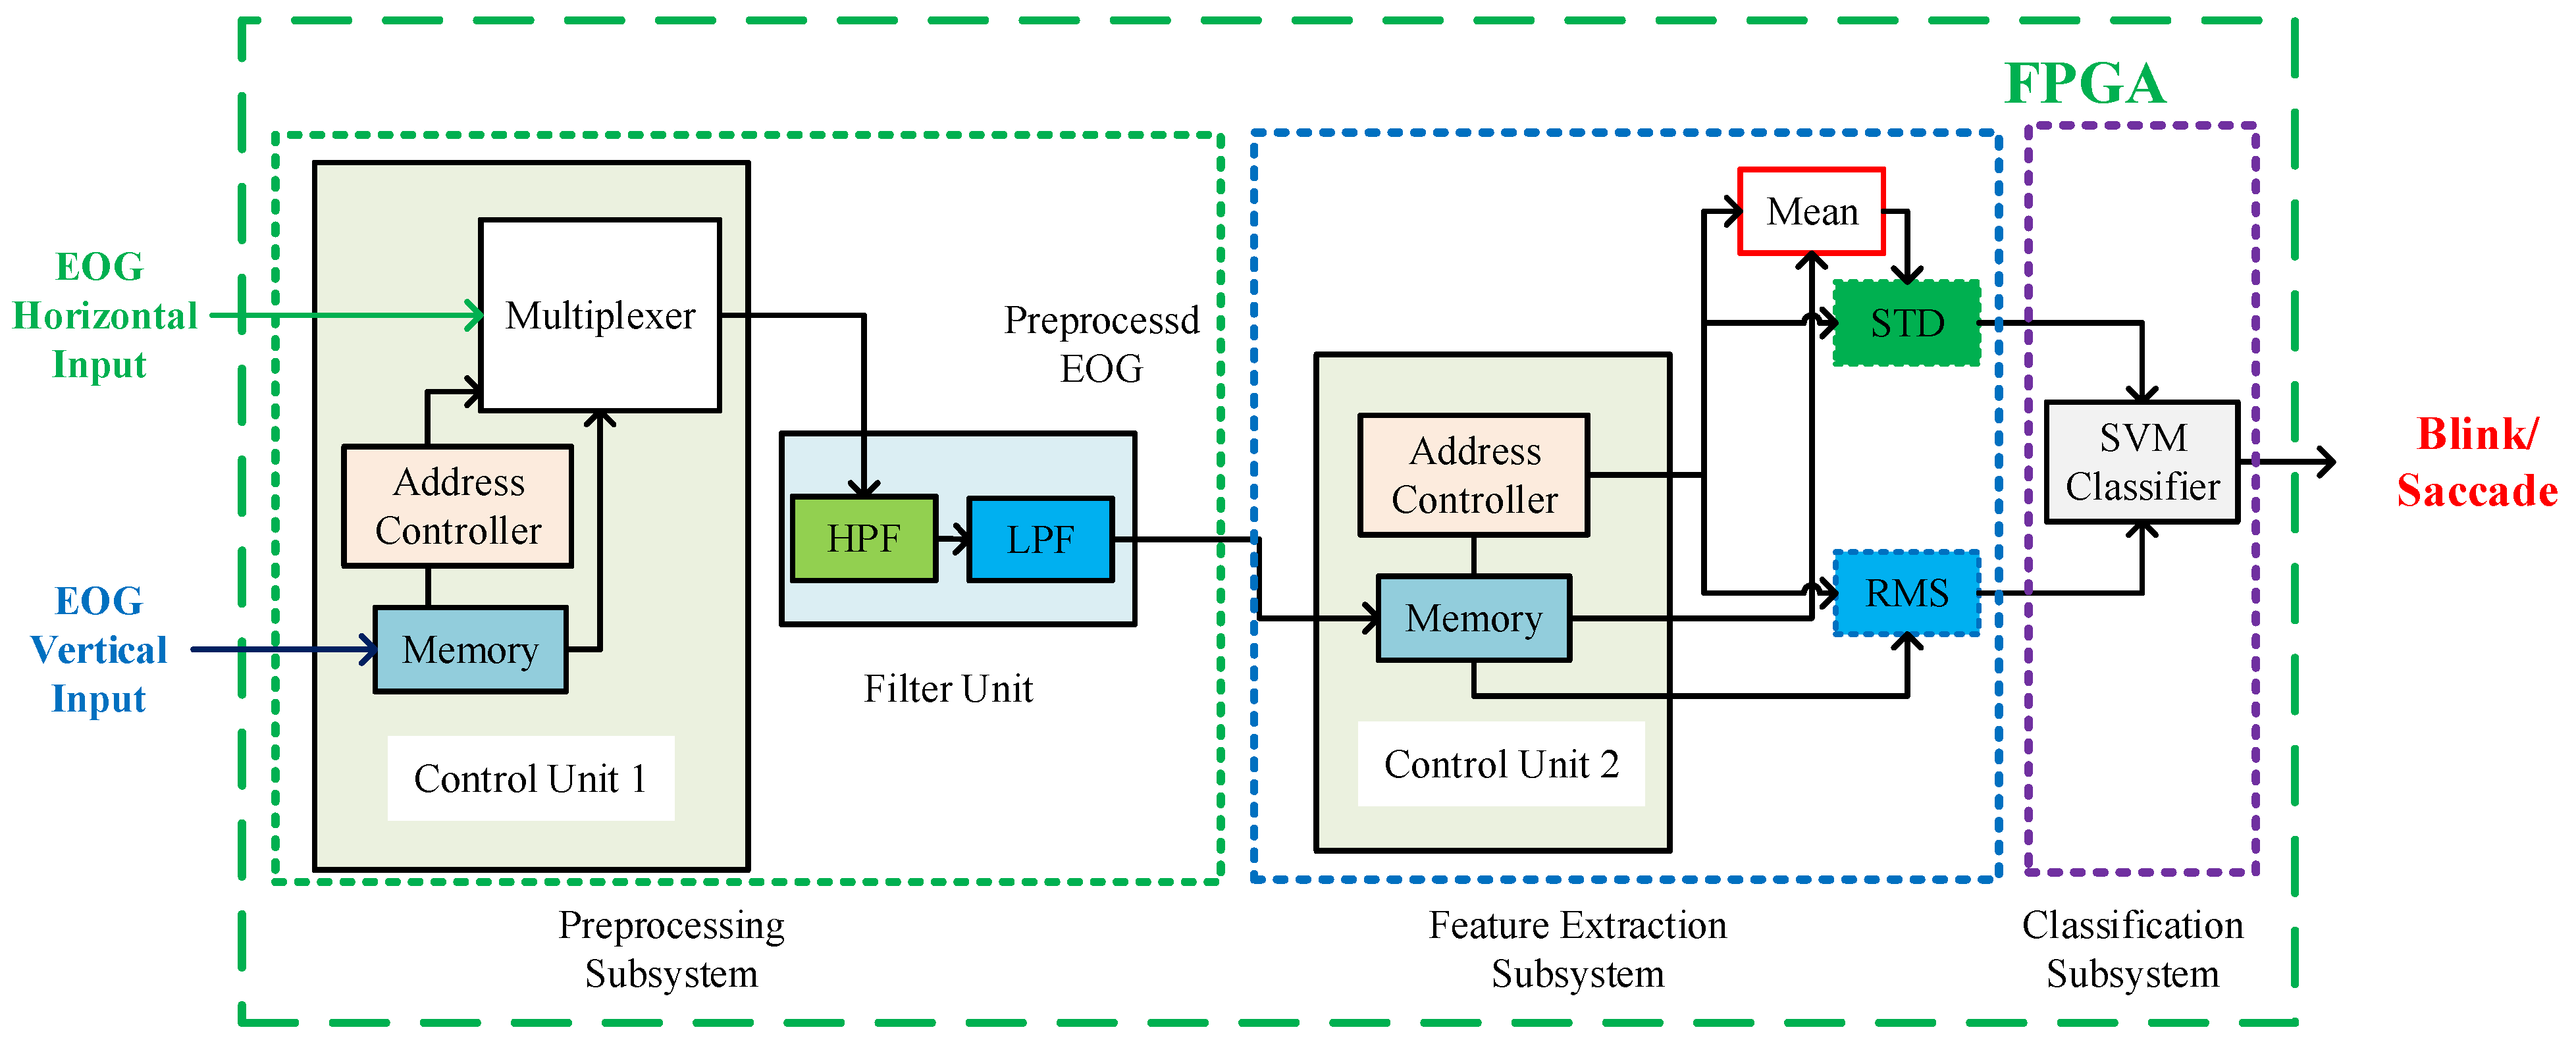
3.3. FPGA Implementation
- Preprocessing Subsystem
- Feature Extraction Subsystem
- Classification Subsystem
3.3.1. Preprocessing Subsystem
3.3.2. Feature Extraction Subsystem
3.3.3. Classification Subsystem
4. Result Analysis
5. Conclusions
Author Contributions
Funding
Data Availability Statement
Acknowledgments
Conflicts of Interest
References
- Molina-Cantero, A.J.; Lebrato-Vazquez, C.; Merino-Monge, M.; Quesada-Tabares, R.; Castro-Garcia, J.A.; Gomez-Gonzalez, I.M. Communication technologies based on voluntary blinks: Assessment and design. IEEE Access 2019, 7, 70770–70798. [Google Scholar] [CrossRef]
- Zhang, R.; He, S.; Yang, X.; Wang, X.; Li, K.; Huang, Q.; Yu, Z.; Zhang, X.; Tang, D.; Li, Y. An EOG-Based Human-Machine Interface to Control a Smart Home Environment for Patients with Severe Spinal Cord Injuries. IEEE Trans. Biomed. Eng. 2019, 66, 89–100. [Google Scholar] [CrossRef] [PubMed]
- Hernández Pérez, S.N.; Pérez Reynoso, F.D.; Gutiérrez, C.A.G.; Cosío León, M.D.l.Á.; Ortega Palacios, R. EOG Signal Classification with Wavelet and Supervised Learning Algorithms KNN, SVM and DT. Sensors 2023, 23, 4553. [Google Scholar] [CrossRef] [PubMed]
- He, S.; Zhou, Y.; Yu, T.; Zhang, R.; Huang, Q.; Chuai, L.; Mustafa, M.-U.; Gu, Z.; Yu, Z.L.; Tan, H. EEG- And EOG-Based Asynchronous Hybrid BCI: A System Integrating a Speller, a Web Browser, an E-Mail Client, and a File Explorer. IEEE Trans. Neural Syst. Rehabil. Eng. 2020, 28, 519–530. [Google Scholar] [CrossRef] [PubMed]
- Minati, L.; Yoshimura, N.; Koike, Y. Hybrid Control of a Vision-Guided Robot Arm by EOG, EMG, EEG Biosignals and Head Movement Acquired via a Consumer-Grade Wearable Device. IEEE Access 2016, 4, 9528–9541. [Google Scholar] [CrossRef]
- Wu, J.F.; Ang, A.M.S.; Tsui, K.M.; Wu, H.C.; Hung, Y.S.; Hu, Y.; Mak, J.N.F.; Chan, S.C.; Zhang, Z.G. Efficient Implementation and Design of a New Single-Channel Electrooculography-Based Human–Machine Interface System. IEEE Trans. Circuits Syst. II Express Briefs 2015, 62, 179–183. [Google Scholar] [CrossRef]
- Wu, S.-L.; Liao, L.-D.; Lu, S.-W.; Jiang, W.-L.S.; Chen, S.-A.; Lin, C.-T. Controlling a human–computer interface system with a novel classification method that uses electrooculography signals. IEEE Trans. Biomed. Eng. 2013, 60, 2133–2141. [Google Scholar] [CrossRef]
- Bulling, A.; Ward, J.A.; Gellersen, H.; Tröster, G. Eye movement analysis for activity recognition using electrooculography. IEEE Trans. Pattern. Anal. Mach. Intell. 2011, 33, 741–753. [Google Scholar] [CrossRef]
- López, A.; Ferrero, F.; Yangüela, D.; Álvarez, C.; Postolache, O. Development of a Computer Writing System Based on EOG. Sensors 2017, 17, 1505. [Google Scholar] [CrossRef]
- Das, D.; Chowdhury, A.; Sanka, A.I.; Chowdhury, M.H. Design and Performance Evaluation of an FPGA based EOG Signal Preprocessor. In Proceedings of the 2023 International Conference on Electrical, Computer and Communication Engineering (ECCE), Chittagong, Bangladesh, 23–25 February 2023; pp. 1–6. [Google Scholar] [CrossRef]
- Lin, C.-T.; King, J.-T.; Bharadwaj, P.; Chen, C.-H.; Gupta, A.; Ding, W.; Prasad, M. EOG-Based Eye Movement Classification and Application on HCI Baseball Game. IEEE Access 2019, 7, 96166–96176. [Google Scholar] [CrossRef]
- Zhang, Y.; Zheng, X.; Xu, W.; Liu, H. RT-Blink: A Method Toward Real-Time Blink Detection from Single Frontal EEG Signal. IEEE Sensors J. 2023, 23, 2794–2802. [Google Scholar] [CrossRef]
- Kołodziej, M.; Tarnowski, P.; Sawicki, D.J.; Majkowski, A.; Rak, R.J.; Bala, A.; Pluta, A. Fatigue Detection Caused by Office Work With the Use of EOG Signal. IEEE Sensors J. 2020, 20, 15213–15223. [Google Scholar] [CrossRef]
- Hayawi, A.A.; Waleed, J. Driver’s drowsiness monitoring and alarming auto-system based on eog signals. In Proceedings of the 2019 2nd International Conference on Engineering Technology and its Applications (IICETA), Najaf, Iraq, 27–28 August 2019; pp. 214–218. [Google Scholar] [CrossRef]
- Lapa, I.; Ferreira, S.; Mateus, C.; Rocha, N.; Rodrigues, M.A. Real-Time Blink Detection as an Indicator of Computer Vision Syndrome in Real-Life Settings: An Exploratory Study. Int. J. Environ. Res. Public Health 2023, 20, 4569. [Google Scholar] [CrossRef] [PubMed]
- Shahbakhti, M.; Beiramvand, M.; Rejer, I.; Augustyniak, P.; Broniec-Wojcik, A.; Wierz, M.; Marozas, V. Simultaneous Eye Blink Characterization and Elimination from Low-Channel Prefrontal EEG Signals Enhances Driver Drowsiness Detection. IEEE J. Biomed. Heal. Inform. 2022, 26, 1001–1012. [Google Scholar] [CrossRef] [PubMed]
- Ghosh, R.; Phadikar, S.; Deb, N.; Sinha, N.; Das, P.; Ghaderpour, E. Automatic Eyeblink and Muscular Artifact Detection and Removal From EEG Signals Using k-Nearest Neighbor Classifier and Long Short-Term Memory Networks. IEEE Sensors J. 2023, 23, 5422–5436. [Google Scholar] [CrossRef]
- Maddirala, A.K.; Veluvolu, K.C. SSA with CWT and k-Means for Eye-Blink Artifact Removal from Single-Channel EEG Signals. Sensors 2022, 22, 931. [Google Scholar] [CrossRef] [PubMed]
- Banerjee, A.; Pal, M.; Tibarewala, D.N.; Konar, A. Electrooculogram based blink detection to limit the risk of eye dystonia. In Proceedings of the 2015 Eighth International Conference on Advances in Pattern Recognition (ICAPR), Kolkata, India, 4–7 January 2015; pp. 1–6. [Google Scholar] [CrossRef]
- Ryu, J.; Lee, M.; Kim, D.H. EOG-based eye tracking protocol using baseline drift removal algorithm for long-term eye movement detection. Expert Syst. Appl. 2019, 131, 275–287. [Google Scholar] [CrossRef]
- Gundugonti, K.K.; Narayanam, B. Efficient Haar Wavelet Transform for Detecting Saccades and Blinks in Real-Time EOG Signal. SN Comput. Sci. 2021, 2, 156. [Google Scholar] [CrossRef]
- Gundugonti, K.K.; Narayanam, B. FPGA implementation of eye movement detection algorithm. Microprocess. Microsyst. 2021; in press. [Google Scholar] [CrossRef]
- Prakashan, D.; Ramya, P.R.; Gandhi, S. A Systematic Review on the Advanced Techniques of Wearable Point-of-Care Devices and Their Futuristic Applications. Diagnostics 2023, 13, 916. [Google Scholar] [CrossRef]
- Chowdhury, A.; Das, D.; Cheung, R.C.C.; Chowdhury, M.H. Hardware/Software Co-design of an ECG- PPG Preprocessor: A Qualitative & Quantitative Analysis. In Proceedings of the 2023 International Conference on Electrical, Computer and Communication Engineering (ECCE), Chittagong, Bangladesh, 23–25 February 2023; pp. 1–6. [Google Scholar] [CrossRef]
- Lin, W.; Zhu, Y.; Arslan, T. DycSe: A Low-Power, Dynamic Reconfiguration Column Streaming-Based Convolution Engine for Resource-Aware Edge AI Accelerators. J. Low Power Electron. Appl. 2023, 13, 21. [Google Scholar] [CrossRef]
- Giorgio, A.; Guaragnella, C.; Rizzi, M. FPGA-Based Decision Support System for ECG Analysis. J. Low Power Electron. Appl. 2023, 13, 6. [Google Scholar] [CrossRef]
- Chowdhury, M.H.; Cheung, R.C.C. Reconfigurable Architecture for Multi-lead ECG Signal Compression with High-frequency Noise Reduction. Sci. Rep. 2019, 9, 17233. [Google Scholar] [CrossRef] [PubMed]
- Conti, G.; Quintana, M.; Malagón, P.; Jiménez, D. An FPGA Based Tracking Implementation for Parkinson’s Patients. Sensors 2020, 20, 3189. [Google Scholar] [CrossRef] [PubMed]
- Savastaer, E.F.; Tepe, C. Single Channel EOG Measurement System and Interface Design. In Proceedings of the ISMSIT 2021-5th International Symposium on Multidisciplinary Studies and Innovative Technologies, Ankara, Turkey, 21–23 October 2021; pp. 115–119. [Google Scholar] [CrossRef]
- Pai, Y.S.; Bait, M.L.; Lee, J.; Xu, J.; Peiris, R.L.; Woo, W.; Billinghurst, M.; Kunze, K. NapWell: An EOG-based Sleep Assistant Exploring the Effects of Virtual Reality on Sleep Onset. Virtual Real. 2022, 26, 437–451. [Google Scholar] [CrossRef]
- Masai, K.; Sugimoto, M. Eye-based interaction using embedded optical sensors on an eyewear device for facial expression recognition. In Proceedings of the AHs ’20: Proceedings of the Augmented Humans International Conference, Kaiserslautern, Germany, 16–17 March 2020. [Google Scholar] [CrossRef]
- Li, L.; Xie, Y.; Xiong, J.; Hou, Z.; Zhang, Y.; We, Q.; Wang, F.; Fang, D.; Chen, X. Smartlens: Sensing eye activities using zero-power contact lens. In Proceedings of the Annual International Conference on Mobile Computing and Networking, MOBICOM, Sydney, Australia, 17–21 October 2022; pp. 473–486. [Google Scholar] [CrossRef]
- Bolte, B.; Lappe, M. Subliminal reorientation and repositioning in immersive virtual environments using saccadic suppression. IEEE Trans. Vis. Comput. Graph. 2015, 21, 545–552. [Google Scholar] [CrossRef] [PubMed]
- Barbara, N.; Camilleri, T.A.; Camilleri, K.P. A comparison of EOG baseline drift mitigation techniques. Biomed. Signal Process. Control 2020, 57, 101738. [Google Scholar] [CrossRef]
- Shahbakhti, M.; Beiramvand, M.; Nazari, M.; Broniec-Wojcik, A.; Augustyniak, P.; Rodrigues, A.S.; Wierzchon, M.; Marozas, V. VME-DWT: An Efficient Algorithm for Detection and Elimination of Eye Blink From Short Segments of Single EEG Channel. IEEE Trans. Neural Syst. Rehabil. Eng. 2021, 29, 408–417. [Google Scholar] [CrossRef]
- Shahbakhti, M.; Beiramvand, M.; Nasiri, E.; Far, S.M.; Chen, W.; Sole-Casals, J.; Wierzchon, M.; Broniec-Wojcik, A.; Augustyniak, P.; Marozas, V. Fusion of EEG and Eye Blink Analysis for Detection of Driver Fatigue. IEEE Trans. Neural Syst. Rehabil. Eng. 2023, 31, 2037–2046. [Google Scholar] [CrossRef]
- Chowdhury, M.H.; Eldaly, A.B.M.; Agadagba, S.K.; Cheung, R.C.C.; Chan, L.L.H. Machine Learning Based Hardware Architecture for DOA Measurement from Mice EEG. IEEE Trans. Biomed. Eng. 2021, 69, 314–324. [Google Scholar] [CrossRef]
- Egila, M.G.; El-Moursy, M.A.; El-Hennawy, A.E.; El-Simary, H.A.; Zaki, A. FPGA-based electrocardiography (ECG) signal analysis system using least-square linear phase finite impulse response (FIR) filter. J. Electr. Syst. Inf. Technol. 2016, 3, 513–526. [Google Scholar] [CrossRef]
- Das, R.; Guha, A.; Bhattacharya, A. FPGA based higher order FIR filter using XILINX system generator. In Proceedings of the 2016 International Conference on Signal Processing, Communication, Power and Embedded System (SCOPES), Paralakhemundi, India, 3–5 October 2016; pp. 111–115. [Google Scholar] [CrossRef]
- Cicuttin, A.; Morales, I.R.; Crespo, M.L.; Carrato, S.; García, L.G.; Molina, R.S.; Valinoti, B.; Folla Kamdem, J. A Simplified Correlation Index for Fast Real-Time Pulse Shape Recognition. Sensors 2022, 22, 7697. [Google Scholar] [CrossRef] [PubMed]
- Wang, G.; Lauri, F.; Hassani, A.H.E. Feature Selection by mRMR Method for Heart Disease Diagnosis. IEEE Access 2022, 10, 100786–100796. [Google Scholar] [CrossRef]
- Afifi, S.; GholamHosseini, H.; Sinha, R. FPGA Implementations of SVM Classifiers: A Review. SN Comput. Sci. 2020, 1, 133. [Google Scholar] [CrossRef]
- Zhang, Q.; Zhou, D. Machine Learning Electrocardiogram for Mobile Cardiac Pattern Extraction. Sensors 2023, 23, 5723. [Google Scholar] [CrossRef]


| Resource | Utilization | Available | Percentage Utilization |
|---|---|---|---|
| LUT | 19,684 | 53,200 | 37% |
| LUTRAM | 696 | 17,400 | 4% |
| FF | 4256 | 106,400 | 4% |
| BRAM | 1 | 140 | 1% |
| DSP | 119 | 220 | 54% |
| IO | 92 | 200 | 46% |
| BUFG | 1 | 32 | 3% |
| Logic Operation | Power Consumption | |
|---|---|---|
| Clocks | 0.029 W (4%) | |
| Signals | 0.306 W (45%) | |
| Dynamic (86%) | Logic | 0.241 W (35%) |
| BRAM | 0.007 W (1%) | |
| DSP | 0.076 W (11%) | |
| IO | 0.025 W (4%) | |
| Device Static (14%) | - | 0.0116 W |
| Total On-Chip power | 0.8 W | |
| Implementation | ||||||
|---|---|---|---|---|---|---|
| References | Detection Approach | Accuracy | Preprocessing | Feature Extraction | Classification | Device |
| Banerjee et al. [19] | RBF kernel SVM | 95.33% | × | × | × | × |
| Ryu et al. [20] | DOSbFC and Thresholding | 94.3% | × | × | × | × |
| Molina-Cantero et al. [1] | Adaptive K-means | 89.9% | ✓ | × | × | Discrete |
| Gundugonti and Narayanam [22] | DWT and Thresholding | - | ✓ | × | ✓ | FPGA |
| Proposed work | Linear SVM | 97.5% * and 95% ** | ✓ | ✓ | ✓ | FPGA |
Disclaimer/Publisher’s Note: The statements, opinions and data contained in all publications are solely those of the individual author(s) and contributor(s) and not of MDPI and/or the editor(s). MDPI and/or the editor(s) disclaim responsibility for any injury to people or property resulting from any ideas, methods, instructions or products referred to in the content. |
© 2023 by the authors. Licensee MDPI, Basel, Switzerland. This article is an open access article distributed under the terms and conditions of the Creative Commons Attribution (CC BY) license (https://creativecommons.org/licenses/by/4.0/).
Share and Cite
Das, D.; Chowdhury, M.H.; Chowdhury, A.; Hasan, K.; Hossain, Q.D.; Cheung, R.C.C. Application Specific Reconfigurable Processor for Eyeblink Detection from Dual-Channel EOG Signal. J. Low Power Electron. Appl. 2023, 13, 61. https://doi.org/10.3390/jlpea13040061
Das D, Chowdhury MH, Chowdhury A, Hasan K, Hossain QD, Cheung RCC. Application Specific Reconfigurable Processor for Eyeblink Detection from Dual-Channel EOG Signal. Journal of Low Power Electronics and Applications. 2023; 13(4):61. https://doi.org/10.3390/jlpea13040061
Chicago/Turabian StyleDas, Diba, Mehdi Hasan Chowdhury, Aditta Chowdhury, Kamrul Hasan, Quazi Delwar Hossain, and Ray C. C. Cheung. 2023. "Application Specific Reconfigurable Processor for Eyeblink Detection from Dual-Channel EOG Signal" Journal of Low Power Electronics and Applications 13, no. 4: 61. https://doi.org/10.3390/jlpea13040061
APA StyleDas, D., Chowdhury, M. H., Chowdhury, A., Hasan, K., Hossain, Q. D., & Cheung, R. C. C. (2023). Application Specific Reconfigurable Processor for Eyeblink Detection from Dual-Channel EOG Signal. Journal of Low Power Electronics and Applications, 13(4), 61. https://doi.org/10.3390/jlpea13040061