Article

Identifying Key Sectors and Measures for a Transition towards a Low Resource Economy

1
Finnish Environment Institute, P.O. Box 140, 00251 Helsinki, Finland
2
Thule Institute, University of Oulu, P.O. Box 7300, Oulu 90014, Finland
*
Author to whom correspondence should be addressed.
Resources 2013, 2(3), 151-166; https://doi.org/10.3390/resources2030151
Submission received: 2 May 2013 / Revised: 10 June 2013 / Accepted: 25 June 2013 / Published: 8 July 2013

Abstract

:
A transition towards a low resource economy is unavoidable. This can be concluded from numerous initiatives which have been introduced recently. Methodologies and indicators are required in order to better assess the possibilities and challenges related to a transition towards a low resource economy. One of these is economy-wide material flow analysis (MFA). When MFA is connected to national economics accounts it enables the input-output analysis (IOA) of the economic structures causing material flows. In this study we used IO modelling and total flow analysis to identify industrial sectors with the highest material flows in Finland. The analysis exposed that in Finland most resource consumption is caused by the export industry, of which material intensity is low and does not produce significant value added, whereas the domestic construction sector, with notable resource flows, produces significant value added. A low resource economy requires significant and radical change in socio-technological systems and people’s mindsets. Due to the complexity of society and the diversity of the economy different types of measures are needed in order to achieve the change. We suggest some measures related to regulations, eco-design, material recycling and welfare for production, investments, services and individual consumption, for example. In the future, the transition towards a low resource economy needs radical changes, more innovations, policy support and actions on all societal levels.

1. Introduction

A transition towards a low resource economy is unavoidable. This can be concluded from numerous initiatives which have been introduced recently. The initiatives include the green economy initiative by the United Nations (UN) and green growth initiative by the Organisation for Economic Co-operation and Development (OECD). Additionally, the EU is aiming at improving resource efficiency and diminishing climate impacts in order to make a low-carbon economy reality [1]. These initiatives are introduced as a response to the recent economic recession and other global challenges, including environmental issues such as climate change, deficiency of renewable and non-renewable resources, loss of biodiversity, but also long-term economic and social issues, such as changes in political and economic dominance, poverty and inequality. Various definitions of the green economy and green growth have been given. However, the general content of the definitions is similar, and a green economy can be defined as an economy with low-carbon, resource-efficient economic growth based on safeguarding the functional capacity of ecosystems while promoting well-being and social justice [2].
Improving resource efficiency is a central element of the transition. During the period 1900 to 2005, global total material extraction increased by a factor of 8, while the world’s gross domestic product (GDP) increased by a factor of 23 [3]. Since 1980, global material extraction increased by an average of 2.8% annually and physical trade by 5.6%. Global material consumption only declined after the second oil crisis in 1981 and after the collapse of the Soviet Union in 1990/91. Furthermore, mainly due to growth dynamics in China, material consumption increased significantly faster after 2000 than in the 1980s and 1990s [4]. In order to show the necessity for global material flow reduction, a factor X concept was introduced by Professor Schmidt-Bleek [5]. Since the average material consumption per capita in OECD countries is at least five times that of developing countries, and since further increases in world population are unavoidable, sustainable levels of material flows on a global level will not be achieved unless the current resource use in industrialised countries is decreased by a factor of at least 10 [6].
In this paper, we analysed the economy of Finland which represents a northern developed country in the EU. When compared to many European countries, Finnish resource productivity [if measured by GDP per domestic material consumption (DMC)] is low [7]. Finland is a relatively small and sparsely populated country. Even though the country has a relatively small influence on total global material flows, it serves as an interesting case when considering the transition towards a low resource economy. First, Finland has relatively large reserves of natural resources, mainly in terms of large forests and a rich bedrock. In Finland, there is no paucity of either land or water. Second, the country has an open economy with high dependency on international trade.
The transition to services is often mentioned as one of the key measures in the promotion of resource efficiency. Currently, most of the Finnish gross domestic product (GDP) is already produced in services (70% of GDP), followed by secondary production (28%) and primary production (3%) [8]. The promotion of resource efficiency in Finland is a high priority on the country’s political agenda too. The current Finnish government has stated that it “strives for a Finland that is among the world’s forerunners in environmentally friendly, resource and material-efficient economies and as developer of sustainable consumption and production methods” [9]. Thus, to achieve a low resource society, a better understanding of Finnish material flows is needed.
Methodologies and indicators are required in order to better assess the possibilities and challenges related to a transition towards a low resource economy. One of these is economy-wide material flow analysis (MFA), which can be used to analyse the volume and structure of the material throughout economies, and to assess the metabolic performance in terms of sustainable development [10]. The MIPS (Material Intensity per Service Unit) concept is an application of MFA in which the material flows are linked to the desired utility (e.g., [11,12]). When MFA is connected to national economics accounts it enables the input-output analysis (IOA) of the economic structures causing material flows.
The aim of this paper is to identify the key Finnish industrial sectors with highest resource use using an environmentally extended input-output (EEIO) model and to clarify the similarities of IO resource counting with the MIPS approach. Furthermore, we compare resource and GHG (greenhouse gases) intensities of the key sectors to each other. Resource intensity means the amount of resources used per GDP and GHG intensity produced GHG emissions per GDP. Finally, measures required in a transition towards a low resource economy in Finland are discussed.

2. Materials and Methods

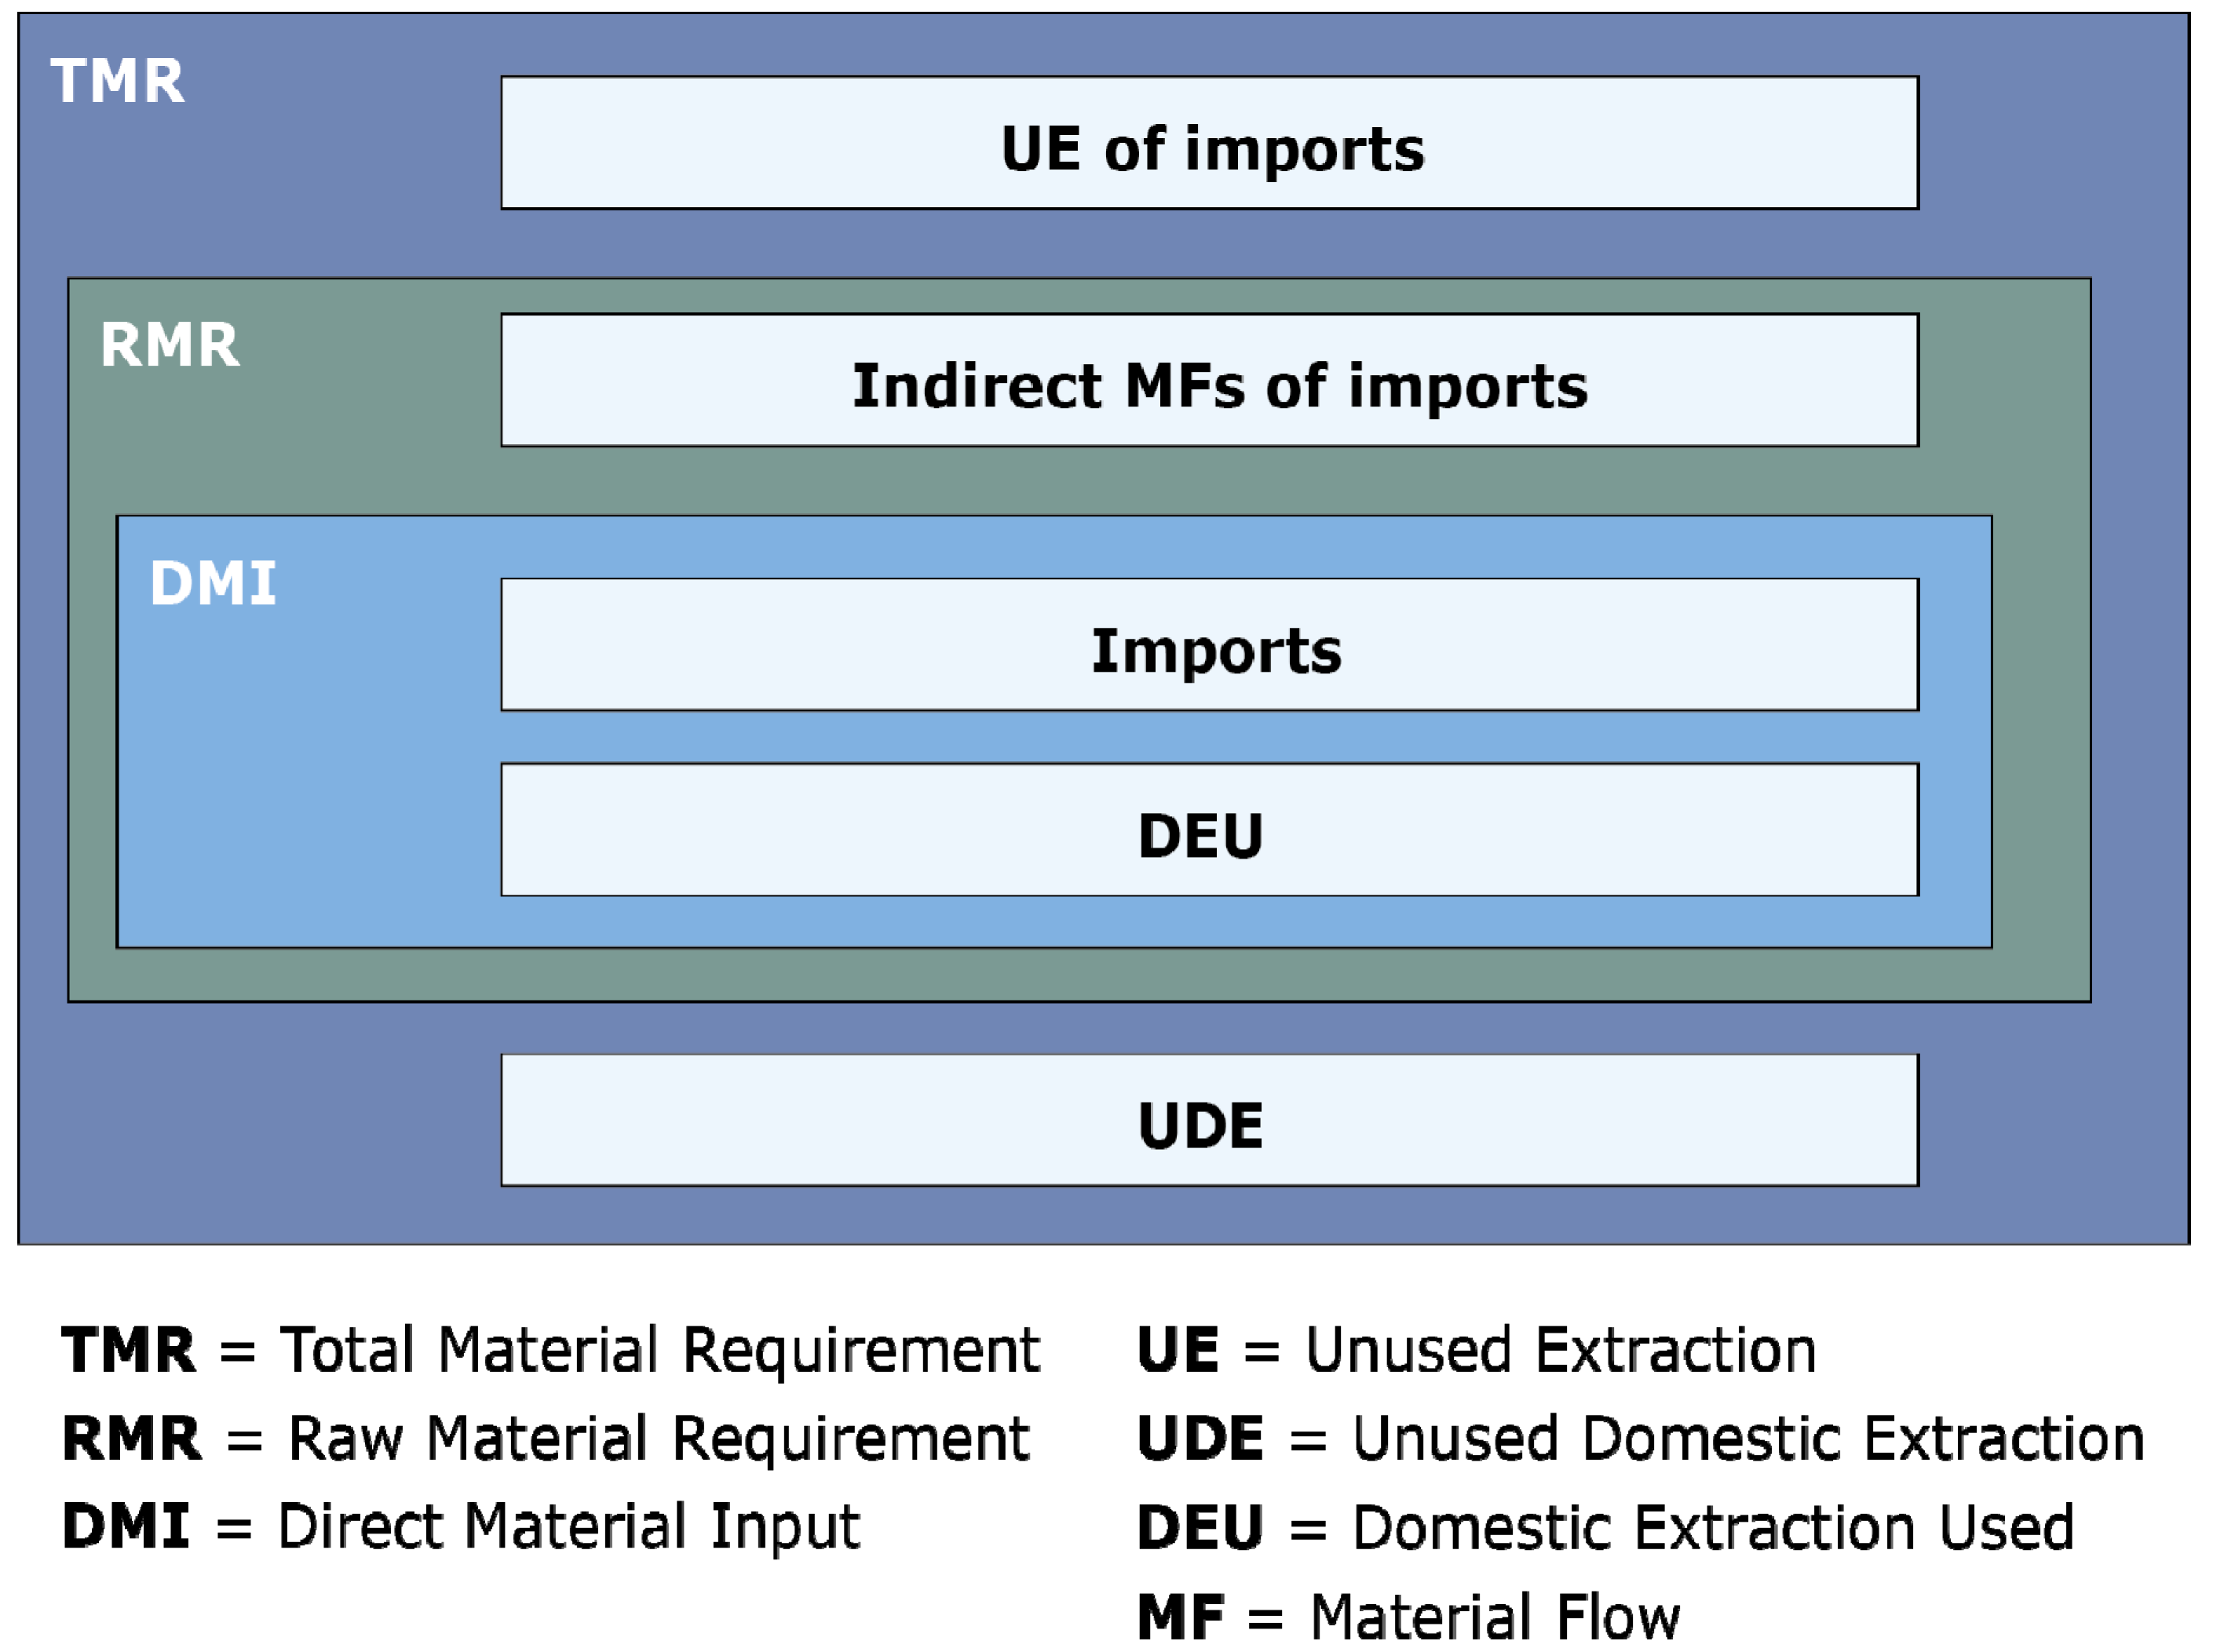
2.1. Material Flow Indicators and MIPS

Several material flow indicators with different system boundaries have been produced [13]. The simplest input indicator, DMI (Direct Material Input), consists of domestic resource extraction (DEU, Domestic Extraction Used) plus the mass of direct imports (Figure 1). The indicator which measures the total resource use of an economy is referred as Total Material Requirement (TMR). It is defined as the domestic resource extraction and the resource extraction associated with imports and their Unused Extraction (UE), or in other words hidden flows (HF). A similar indicator is the Raw Material Requirement (RMR), also known as RMI or raw material input, which indicates all extracted resources that are used by the economy. Unused resources which do not enter the economy from the environment are excluded [14]. The exclusion consists of flows such as mining waste rock, logging residues, soil erosion or left-over earth in construction. Recently, raw material equivalence (RME) factors calculated with environmentally extended input-output models have been published [15]. They allow the inclusion of embodied raw material of imports into the analysis. In this paper, we used RMR instead of TMR, since it indicates the flows that are actually taken into the economy.
MIPS is a subfield of Material Flow Analysis (MFA) (e.g., [16]). MIPS represents the aggregate mass of resources used for a product or service (e.g., [11,12]). The perspective of the calculation is the entire life cycle of a single product or service, including manufacturing, transport, packaging, operating, recovery and disposal [11]. Material inputs are divided into five categories: abiotic raw materials, biotic raw materials, earth movements, water and air. If the first three input categories are aggregated, the result is the TMR material flow indicator [14].
Figure 1. Definitions of material flow indicators TMR (Total Material Requirement), RMR (Raw Material Requirement) and DMI (Direct Material Input).
Resources 02 00151 g001
MIPS is often estimated with average material intensity factors (MI factors) for materials and other inputs (e.g., [16]). MI factors are the ratios between the quantity of resources used and the quantity of product obtained. In other words, the factors indicate how many kilograms of natural resources in each of the five material input categories are used or transferred in the ecosystem to produce one kilogram of material or a unit of energy. The Wuppertal Institute has published the material intensity factors (MI factors) for various materials and energy. These factors are also known as material rucksacks, representing the embodied material flow burden from the life cycle of a product.

2.2. Material/Resource Intensities at the Economy Level with EEIO Models

The same rucksack or MIPS philosophy can be applied at the macroeconomic level. In an economy, the MIPS represents the material resources needed to supply the whole production of goods and services. The simplest way to aggregate the different products and services is to do so through value added, resulting in gross domestic product (GDP). A similar aggregation of material inputs can be TMR, RMR or DMI. Their ratio can be thought of as either a resource productivity (€/kg) or a resource intensity (kg/€) of an economy, representing an indicator similar to GHG intensities (kg CO2e/€) or labour productivities (€/working hour).
The material intensity of an economy can be determined at an aggregated scale from official statistics. However, environmentally extended input-output models allow the disaggregation of the intensities to individual industries and product chains. EEIO models have been used extensively to track environmental impacts across global supply chains in hybrid and IO-LCA (life cycle assessment) models [17]. The application of EEIO to MFA can be thought of as hybrid-IO-MIPS in this regard.
For the purposes of this study, a disaggregated EEIO model of the Finnish economy (ENVIMAT) was used. The structure and mathematical framework have been published in [18,19]. In the first version of the model, the years 2002 and 2005 were included. This study includes results from an update to 2008. The model follows a typical input-output formulation:
Resources 02 00151 i001
where: x = production output by industry [€]; A = technology matrix of intermediate input coefficients [€/€]; y = final demand by industry [€]; L = Leontief inverse [€/€]; I = identity matrix [€/€].
Production and the resource extraction of production were therefore assumed to be driven by demand (y) and the model proceeded by allocating the burdens of resource extraction to final demand:
Resources 02 00151 i002
where: B = material intensity by industry [kg/€]; gi = embodied material burden allocated to final demand of industry i [kg]; yi = final demand of industry i [€].
The monetary input-output tables (A,y) were based on the detailed supply and use tables (SUT) consisting of 150 industries, 676 domestic products and 676 imported products. The tables were obtained from the Statistics Finland under confidentiality agreements. These were then converted into the technology matrix by using the industry technology assumption as recommended by Eurostat [20]. Imports were kept at the product level to allow connection to a process-LCA database [21]. The material intensity of domestic products was calculated by connecting the direct material inputs to industries and dividing by the sectoral output (x). For imported products, the Ecoinvent database [21] was used to quantify the primary raw materials, and auxiliary mining and agricultural statistics [22] were used to estimate the rest of the raw material inputs. The monetary imports were converted into mass flows for connection with Ecoinvent through the use of trade statistics obtained from Customs Finland. For the inputs, which could not be obtained from the Ecoinvent database (services, etc.) the domestic technology assumption was applied, therefore assuming that the material intensity would be similar as in Finland.
The use of general material intensity factors for imports introduced an error due to geographical aggregation, since the Ecoinvent database typically does not report country specific factors. This error could be avoided by using multiple region input-output (MRIO) models, such as the WIOD [23]. However, because the sectoral disaggregation in MRIO models is typically very coarse grained, this would have introduced a more serious problem of product aggregation (e.g., not differentiating between different basic chemicals). The errors associated with process- and IO- based approaches are well discussed in [24]. For this study we chose to minimize the product aggregation error by using a process-LCA database as the main source, although this was at the cost of increased geographical aggregation.

2.3. Identification of Key Sectors through Total Flow Analysis

Key economic sectors are those industries that exhibit the greatest backward and forward influence, usually quantified through the Leontief and Ghosh inverses [25]. Often the key sectors are weighted by final demand, in order to give priority to large and connected sectors over small and connected sectors. In this study, we expand the concept to take into account the material flow multipliers and define the material flow key sectors as those sectors that have the greatest throughflow of embodied material use. The embodied material throughflow can be calculated in two ways, both giving a different perspective on the same issue. Both rest on the concept of economic total flow [26], defined as [27]:
Resources 02 00151 i003
The total flow quantifies the multiplier impact that an industry has on the output of other industries. However, it does so by removing the effect of closed cycles (e.g., pulp and paper purchases chemicals which use the products of pulp and paper) from the equation by the division with the diagonal of the Leontief inverse. Overall, it defines key sectors by asking the question: “What would happen to domestic production if a domestic sector would be replaced with imports?” The same logic can be applied to an environmentally extended input-output model to yield a total flow of materials:
Resources 02 00151 i004
where Resources 02 00151 i006 is a diagonal matrix of a direct material intensity vector [kg/€].
The column sums of the total material flow matrix represent the resource total flow going through each industry and the row sums are meaningless. The similar column sums can be obtained with a different formulation of the same problem:
Resources 02 00151 i005
where Resources 02 00151 i007 is a diagonal matrix of the total material intensity vector [kg/€].
In Equation (5), the inputs of an industry are weighted with the total production, which is first corrected by dividing the Leontief inverse diagonal to remove cyclical flows. This yields a flow table of economic flows in the economy, not including those, which are for internal consumption of the industry either directly or through the supply chain. The flow table is then weighted with the embodied total material intensities of each input, calculated by multiplying direct material intensities with the Leontief inverse. Each element Resources 02 00151 i008 
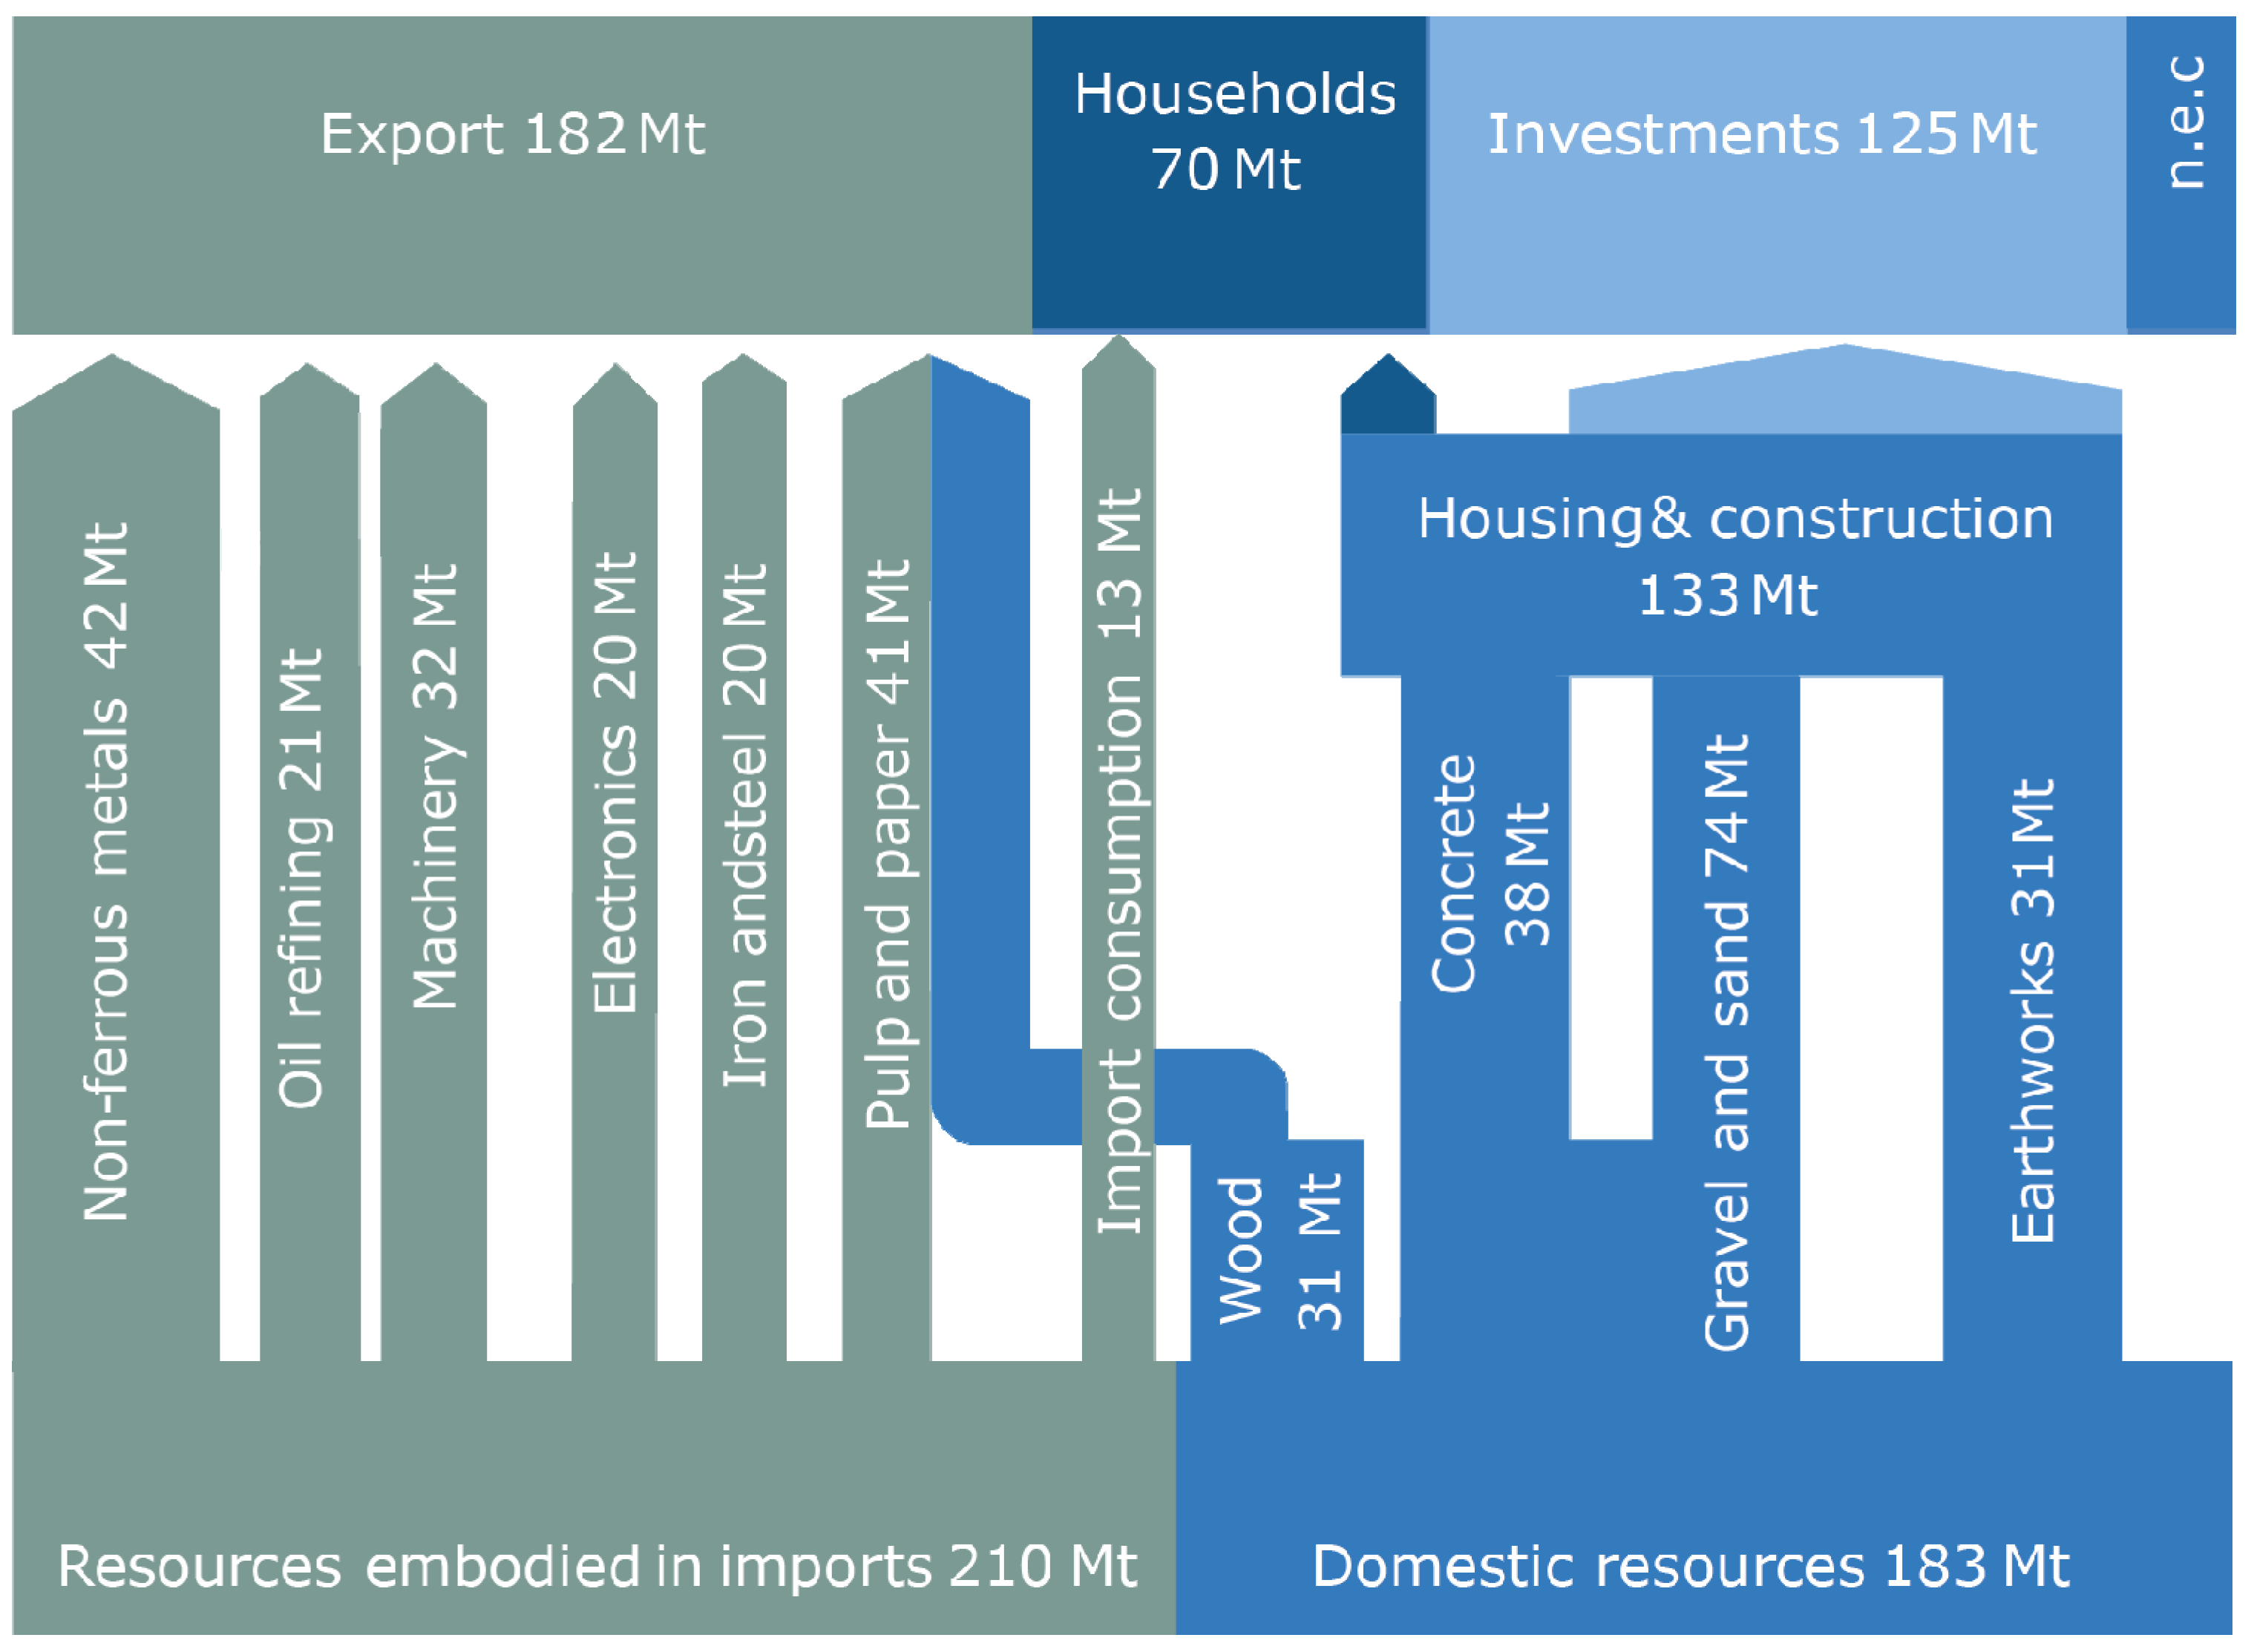
of the total material flow matrix describes how much material flow is embodied in the purchase of input i to sector j. Therefore, the matrix can be used to construct a flow diagram of the economy based on accumulative material burden (or a rucksack, to use the original MIPS terminology).

3. Results and Discussion

3.1. The Key Sectors and Main Pathways of Resource Use in Finland
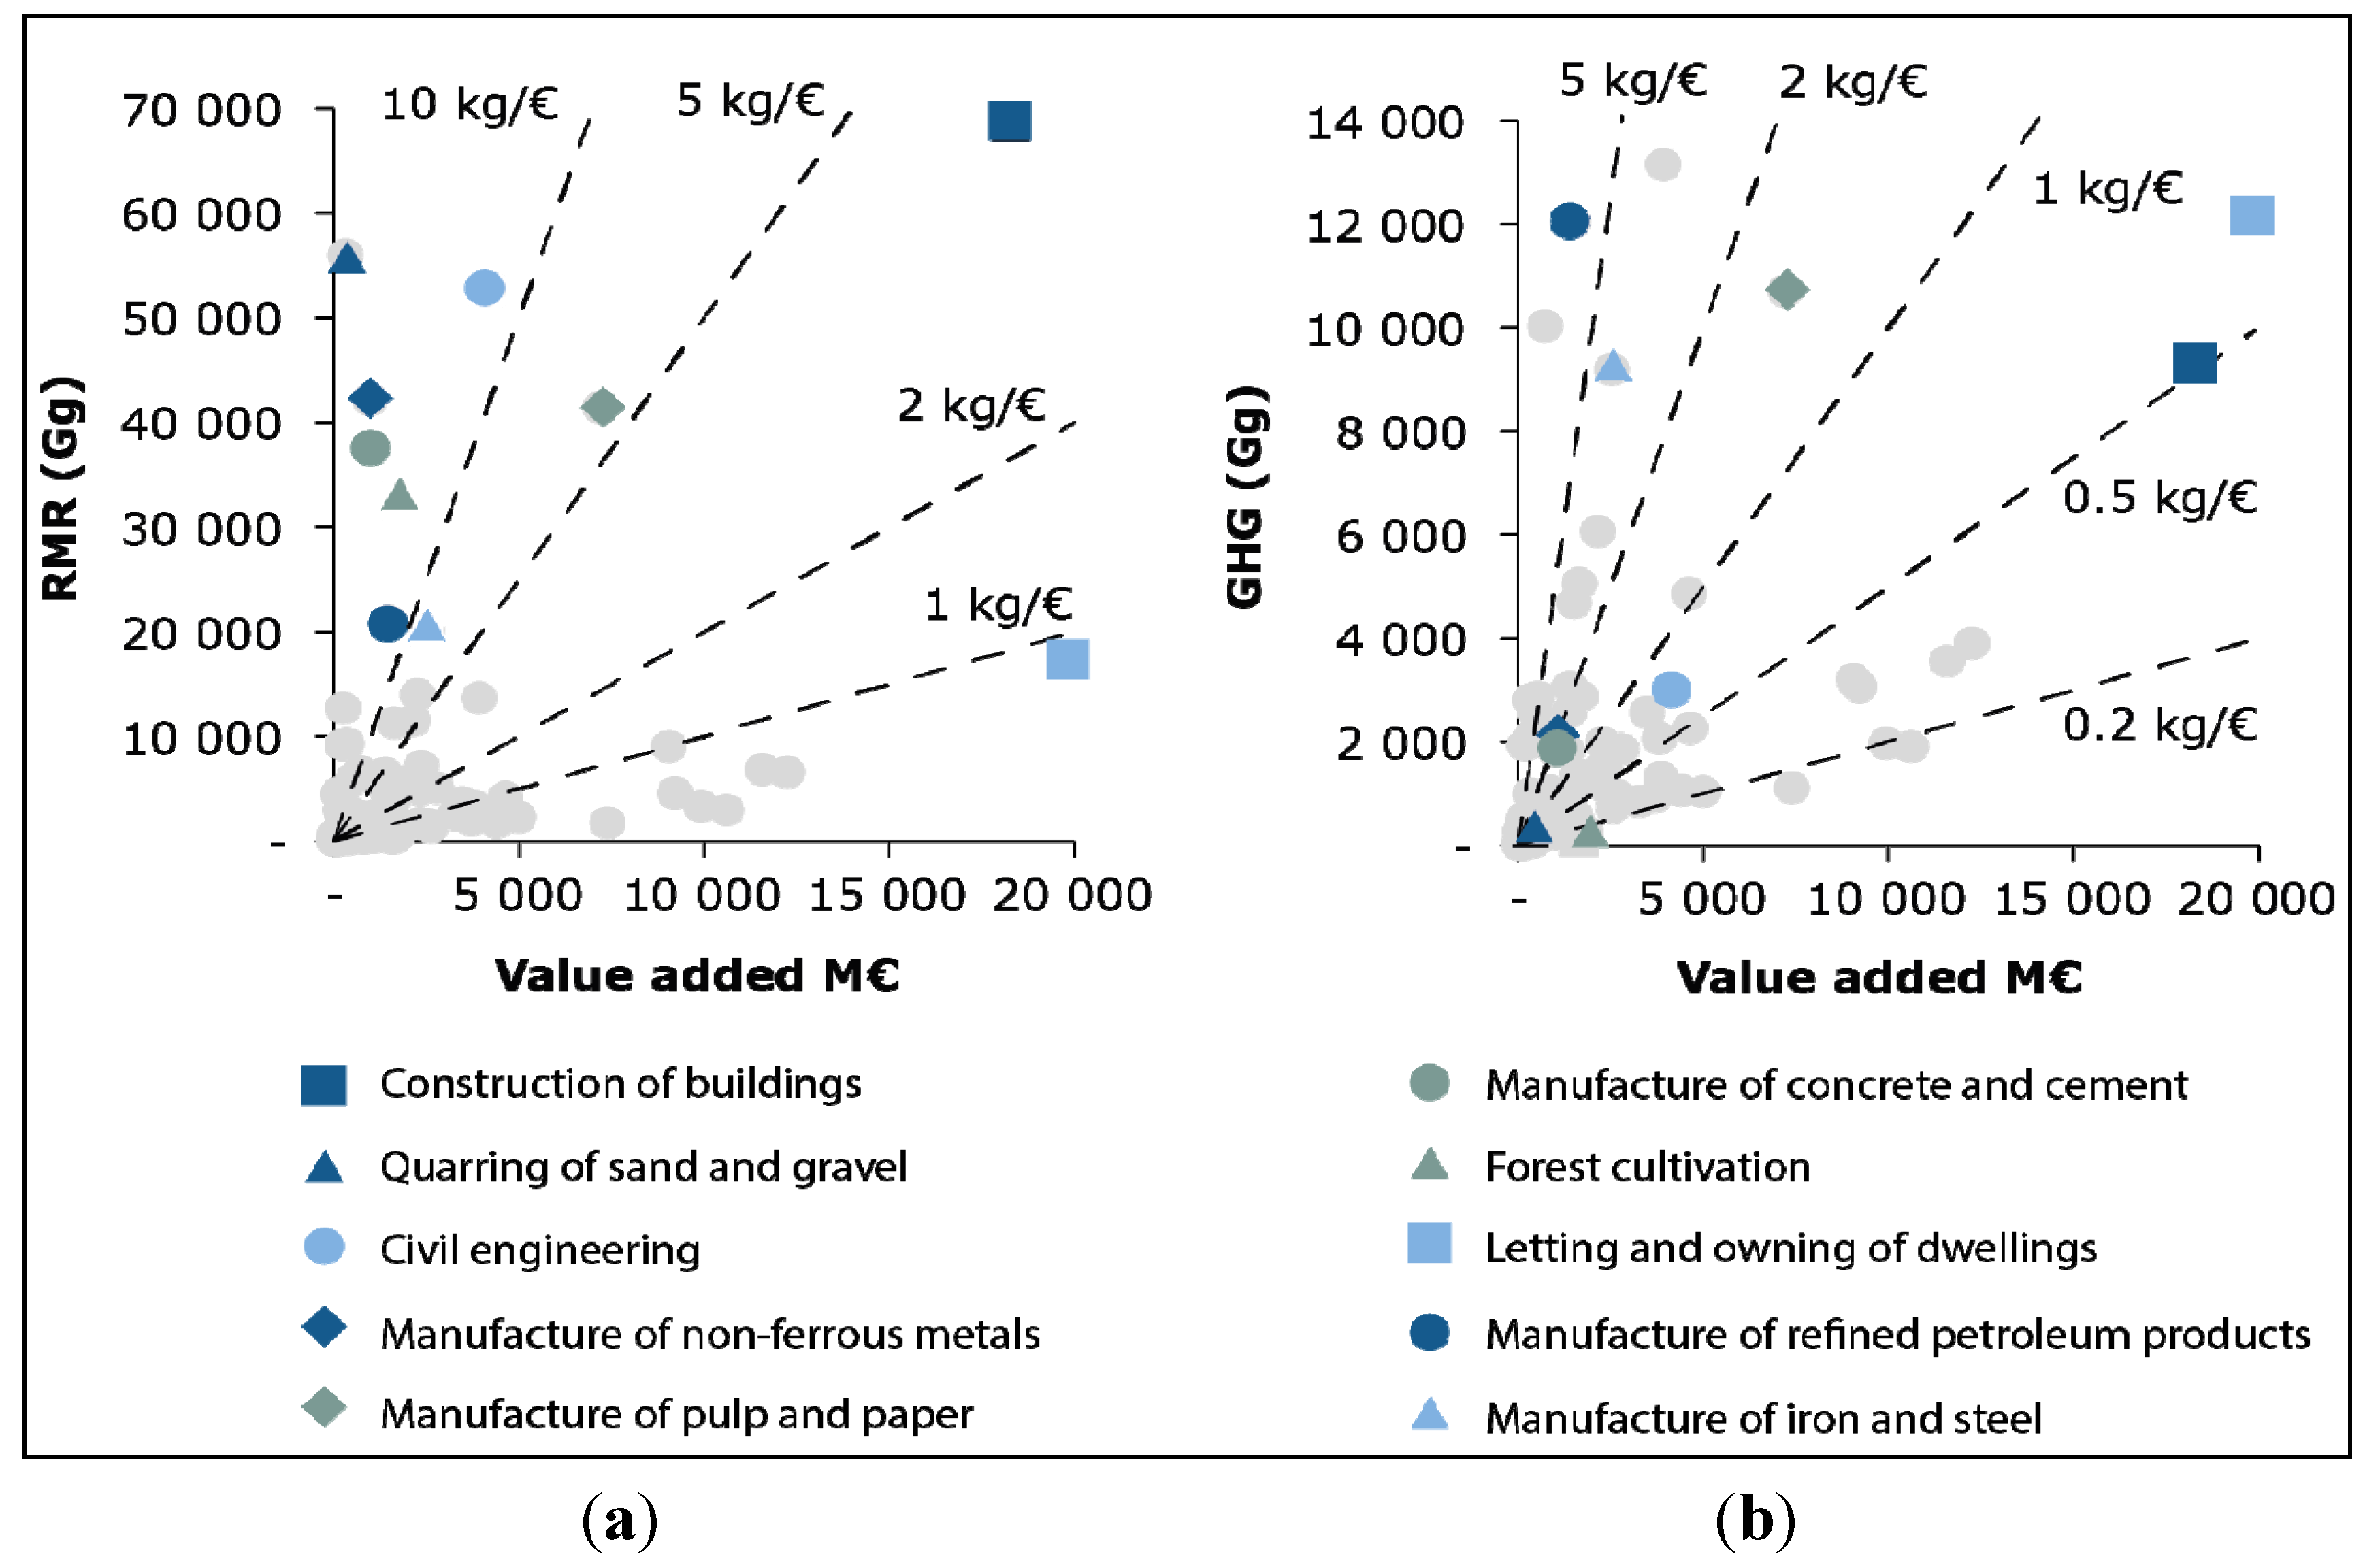
The total flow analysis revealed a few industries with a considerably high resource total flow (Table 1). The industry with the highest total flow was residential construction, followed by sand and clay quarrying, civil engineering, manufacture of non-ferrous metals, and pulp and paper. Improvements in the input-output efficiency in any of these industries, or the reduction of production scale, would significantly reduce the overall resource consumption across the economy.
The interpretation of total flow results is difficult, since the same resources flow through various supply chains. For example, the construction of residential buildings requires concrete, which requires sand. Residential construction also supplies repair services to the sector of letting and owning of dwellings. The total flow of sand is accounted for all these industries and therefore the figures in Table 1 cannot simply be added up. The impact of reducing impacts on the supply chain is also less than the sum of the components (i.e., smaller buildings for dwelling, less concrete in building, less sand in concrete or use of waste material in producing construction sand do not add up). It also shows the indirect connections between sand quarrying and residential construction. Compared to other methods such as structural path analysis [28,29], the total flow includes all the indirect connections between two sectors. For example, the connection between letting and owning of dwellings and forest cultivation includes both the wood used for energy as well as the wood used for repair construction (as well as all the other innumerable pathways linking wood to buildings, for example through paper products).
Table 1. Industries with the highest total flows of Raw Material Requirements (RMR) in Finland 2008.
NACE1IndustryRMR (Gg)
4501Construction of residential buildings68.5
142Quarrying of sand and clay56.0
4502Civil engineering52.6
274Manufacture of non-ferrous metals42.2
211Manufacture of pulp, paper and paperboard41.4
266Manufacture of concrete and cement37.5
0211Forest cultivation32.5
232Manufacture of refined petroleum products21.0
271Manufacture of iron and steel20.1
7021Letting and owning of dwellings17.4
Average sector4.8
Note: 1NACE, Statistical classification of economic activities in the European Community.
In spite of its completeness, the total flow can be overwhelming because all possible pathways are combined in the interconnectedness coefficients of Z and M matrices. Therefore, the alternative formulation of the total flow can be useful [Equation (5)]. By weighting the sector inputs with the total resource consumption intensities, one can describe the upstream impacts of each input. In effect, this exercise is constructing a material footprint or a rucksack for all industries, but removing the double counting effects of cyclical flows in the process. Taken across the economy (or at least across key sectors), these rucksacks allow a construction of an embodied flow diagram (Figure 2). The resource total flows of Figure 2 were taken from the matrix, which was calculated from Equation (5).
In Figure 2, only the flows which were higher than 10 Mtons were included. Together, the 11 flows contain the majority of resource flows in the economy. The width of the arrows does not match the width of the boxes, since the flows which were under 10 Mtons were excluded. Exceptions to the cut-off rule were the imported consumer items and the machinery manufacture sectors, which were individually small but collectively significant. They were aggregated in order to include them in the overall picture.
Based on the total resource flow diagram, the Finnish economy was a throughflow system in 2008. Resources were imported, processed and then exported. The only major domestically consumed resources were sand and gravel, used for construction either directly, through concrete or through earthworks. The only major domestic resource exported was wood, processed to pulp and paper. The main resources which were imported and then reprocessed were non-ferrous metal ores, crude oil, metals for machinery, electronic components, steel and iron ores as well as wood and pulp.
Commonly discussed resource flows such as food and wood used for energy or construction were such small and dispersed flows that they were not included in the main flow diagram. If the priority is to minimize resource extraction (as it is implicitly assumed in the MIPS methodology), the focus should be exclusively on mining and forestry outside Finland, and on sand extraction, forestry and construction within Finland. If this is not the case, then RMR is not an appropriate indicator for resource management policy.
Figure 2. The flow of embodied resources (RMR) induced by the key sectors of the Finnish economy in 2008. (n.e.c. = not elsewhere classified). The width of the arrows does not match the width of the boxes, as arrows less than 10 Mt were excluded.
Resources 02 00151 g002

3.2. Material/Resource Intensities of the Industries

Based on material flow statistics, in Finland, GDP and TMR have been growing at an even rate with the exception of two recessions in 1990–1994 and in 2008–2010 (Figure 3). Material intensity (TMR/GDP) has been very constant until the mid-1990s and started to decline afterwards due to the rise of the electronics industry, the implementation of nuclear power and high capacity of hydropower. Thus, the decline does not refer to the improvement of resource efficiency in other industries.
In the previous section it was shown that the RMR of Finland was mainly caused by a few key sectors and the export industry in particular. The material intensity of these sectors can be analysed by calculating the total flow of value added through these sectors (i.e., the multiplier effect of the industry on the whole economy, excluding the cyclical flows). This can reveal whether the industries with high total material flow are also key economic sectors. Based on the results (Figure 4A), only letting and owning of dwellings and residential construction have significant effect on total value added, which were million EUR 18,300 and 19,000 in 2008, respectively. Due to the high value added, the material intensity of construction did not rise over 4kg/€ and for dwellings it is below 1 kg/€, the same level as for services and retail.
Figure 3. The development of resource intensity in Finland 1975–2011. Solid dark line = GDP. Solid light line = TMR. Dotted line = Resource intensity.
Resources 02 00151 g003
Figure 4. (a) Total flow of RMR; and (b) CO2e as a function of value added in Finland in 2008. The key sectors of Table 1 are presented with dark outlines; other sectors are presented in grey. Material and GHG intensity lines are drawn for clarity.
Resources 02 00151 g004
Pulp and paper manufacturing is also a major contributor to value added (approximately one-third of the value of construction). The rest of the sectors with high total material flow (e.g., quarrying of sand and clay, civil engineering, manufacture of concrete products) were not significant in terms of domestic value added. This is also accurate for export industries caused by the fact that they rely on imported raw materials, which were then processed to low value added goods and exported. From the material intensity viewpoint, as defined above, the pulp and paper industry is more efficient than the manufacturing of metals.
As a consequence of the low value added and high material flow, the export sectors form a group of very resource-intensive industries, with intensity figures mainly over 10 kg/€. As a comparison, the overall material intensity of the economy measured in RMR was about 2 kg/€ (measured in TMR it was higher, around 3.4 kg/€, Figure 3).
Additionally, oil refining has high resource and GHG intensities. One very interesting observation is that oil refining, which was not highlighted in previous TMR studies [18], can be seen at the top of the RMR ranking. The reason is that the extraction of metals has much larger hidden flows than oil. This is also illustrated by the MI factors of Wuppertal: copper has over 100 times the MI of crude oil, for example [30]. Overall, most of the raw material requirement of Finland was driven by the export production of high material intensity goods.
Since raw material requirements do not correlate with climate or other environmental impacts [16,18], a comparison with GHG intensities was also made (Figure 4B). It could then be observed that many of the industries with high total material flow (e.g., quarrying of sand and clay, civil engineering, manufacture of concrete products) have relatively low embodied CO2e flows. As a result, their GHG intensities were much lower than their material intensities. The management of dwellings consumes a lot of energy but not so much material, and therefore its environmental impacts are mainly caused by greenhouse gas emissions (GHG). However, GHG intensity is not very high (approximately 0.6 kg/€) due to the high value added.

3.3. Measures towards a Low Resource Economy

In the current Finnish economic structure, the most efficient measures to reduce total material flows include diminishing the input flows and closing the material cycles, especially in the key sectors. A radical step towards a low resource Finnish society would be to cease resource-intensive industrial sectors in Finland. However, this would not be sustainable in social or economic terms. In addition, as Finland is not an isolated system, this would have an impact on global resource flows and environmental impacts as well. When considering the global economic system, it is justified that the manufacturing of resource and energy intensive products takes place in the countries where the best available technology has been adopted and the energy production profile is more favourable than in other countries. So far, a comprehensive global benchmarking study of this specific subject is, however, lacking.
The achievement of a low-carbon and low resource economy requires significant and radical change in the socio-technological system and people’s mind-sets, referred to as transition. The causes and processes of system transition have been assessed by e.g., [31,32,33]. System transition means a shift from one socio-technical system to another, such as the transition to a mobile phone society or from a horse-based society to an automobile society [32]. In the transition, there is no simple solution or driver, but it involves all the societal actors, including industry, policy, technology, markets and user preferences, science and culture, consumers and policy makers, and all system levels leading to a macro-level change. However, some measures are more efficient, and some moments are more favourable for interventions in the system. At these leverage points, even small shifts in one thing can produce large changes in all other system compartments [34].
The system approach can be utilised when considering the changes needed in Finnish society in a transition towards a low resource economy. Based on the IO modelling, the economy can be divided into production, investments, services and individual consumption. Finnish production is typically further divided into resource-intensive industry, such as the metal and forest industries, and other industry. Investments consist mostly of buildings and infrastructure. In services, the most important areas are social and health care, and education. Here, consumption refers to the consumption of households. These sectors need distinct but also common measures in transition towards a low resource economy. Some measures to improve resource efficiency are identified in Table 2. Even though we considered here the context of Finnish society, the measures are also applicable in other countries.
Table 2. Examples of identified measures in the transition towards a low resource society. Note that the measures are not in priority order and furthermore, they do not have the same effectiveness.
ProductionInvestments on infrastructure
  • Limiting material extraction through land use planning; changing ownership of mineral reserves in legislation.
  • Regulating material intensity; focus on high value added products; import taxes for material intensive products.
  • Investing in product design: eco-design; design for disassembly; Cradle-to-Cradle approach.
  • Improving reusability, recyclability, recovery of materials; developing recycle technology; limits for landfilling.
  • Developing novel materials from renewable resources.
  • Transferring to renewable energy resources.
  • Mindset change in production and business models: lean manufacturing, biomimicry, servicizing, 3d printing.
  • Limiting sand and gravel quarrying by regulations; economic incentives; land use planning.
  • Regulating building and road maintenance materials.
  • Increase the longevity of buildings and other constructions; design for multiple uses; improve flexibility and durability.
  • Testing of ecological building materials; easier permits on experimental housing.
  • Using public procurement to support resource efficient building.
  • Improving energy efficiency of residential buildings; passive houses; houses producing energy.
  • Co-creating new types of low resource housing; applying for example biomimicry for both urban and rural areas.
ServicesConsumption
  • Reducing the need for infra in social, public and health services; improving e-services; shared spaces.
  • Allowing priority for low resource products in public procurement
  • Encourage public consumption behavior to reduce waste; save energy; etc.
  • Creating and supporting new services: providing infra-for-rent, shared ownership, servicizing.
  • Reward preventive measures in health and social services.
  • Direct consumption towards low resource use through resource taxes and regulations; sanctions for waste production.
  • Providing information about product life cycle impacts.
  • Promoting spreading of resource efficient user innovations.
  • Shifting consumption pattern; second hand use; renting and shared ownership; consuming more services instead of products.
  • Change consumerism ideals: voluntary frugality; less is more.
  • Valuing the environment.
Notes: Pinpointing problems in the current paradigm: more resource flows do not always increase welfare; Implementation of full cost of ownership and externalities in pricing; Applying sustainability criteria to financial investments; Promoting circular economy.
To spotlight some of the measures, it is good to emphasise the current paradigm in which monetary issues are very powerful. Especially in companies, simultaneous cost savings are good motivation to improve resource efficiency. Germany is one of the pioneers in promoting material efficiency, and the country has supported material auditing for over 10 years. Evaluations of the programme show an average material saving of nearly 27% of the material costs in supported material efficiency networks [35]. Similar measures on material auditing based on material flow cost accounting [36] have been launched in Finland by the Ministry of Employment and the Economy.
In Finland, material consumption is also topical at the governmental level, since the EU calls for national actions to promote resource efficiency. A working group has been established to create the framework for the Finnish road map to a resource-efficient society. The results of this study will be used as background information in framework creation.
The importance of the construction sector to the economy has been pointed out in the previous sections, not only in economic terms but also environmentally. In Finland, a fourth of the total energy is consumed in heating of the buildings; therefore, the energy saving actions of buildings have been given first priority in recent years supported by new regulations. In the future, the Passive House standard could offer a cost-effective way to minimise the energy demand of new buildings and due to the minor energy demand, good opportunities to produce the requisite energy exclusively from renewable sources [37].
Without addressing patterns and levels of consumption, it may not be possible to reach the vision of a low resource economy, therefore the need to debate sustainable consumption has entered the political agenda [38]. Servizicing is a new concept to diminish consumption and to produce services with new business models in the framework of product-service systems (PPS). The servizicing economy, based on functionality rather than on product manufacturing, does not necessarily lead to lower resource use, and therefore, more knowledge is needed to understand how changes at the systems level can be shaped so that environmental impacts or resource consumption are reduced [38]. GDP is widely considered to be an indicator of standard of living, but actually the ultimate question facing today’s society in industrialised countries is whether consumerism actually contributes to human welfare and happiness [38].
The term “circular economy” has been launched to refer to a new approach for the more circular use of resources (e.g., [39]) and to cast off the “linear” economy. The main elements of the circular economy are recycling, reuse and recovery, which are relevant issues through the economy in the transition towards a low resource economy. The recycling of materials cannot succeed without the development of new recycling technologies and before anything without a comprehensive product design process, where the main requirements for materials or components are reusability and recyclability.
This type of macroeconomic analysis is useful in providing a large-scale picture that is needed when considering policy and other measures improving the transition towards a low resource economy. However, due to the high aggregation of sectors, the analysis does not reveal radical grass-roots level innovations that are equally or even the most important components in the change as innovations to macro-level policy. In the transition process, a reproductive type of change on a micro-level with incremental innovations is equally important, because, over time, those can accumulate and result in major performance improvements for dominant actors. However, reproductive change is not enough, because the key technology and knowledge base does not fundamentally change [32]. The most effective leverage points to intervene in the system occur when the system goals, mindsets and paradigms change [34]. However, the transition is normally a long-term process, and radical changes do not occur overnight. Therefore, measures at lower level leverage points, such as regulation, economic instruments, improvement of process efficiencies and knowledge development are also needed. Through these smaller changes, mindset change becomes legitimised and possible.
The experiences from previous significant system transitions show that they were not coordinated, planned and goal-oriented processes, but instead, the dynamics were more complex and there were multiple groups involved with different interests and views, leading to contestations and struggles [32].

4. Conclusions

In this study we used IO modelling and total flow analysis to identify the industrial sectors with the highest material flows in Finland. This could be thought of as a sector-level MIPS, but with different system boundaries and selection of resources. The analysis exposed that in Finland, most of the resource consumption is caused by the export industry, of which material intensity is low and does not produce significant value added, whereas the domestic construction sector with notable resource flows produces significant value added.
MFA indicators have been used to estimate the progress of sustainability, but the material quantities are not sufficient to indicate all aspects of environmental impacts, harmfulness or importance to the economy. The material accounting is relevant and valuable as such, but it indicates only extraction rates and flows through the economy.
A low resource economy requires significant and radical change in a socio-technological system and in people’s mindsets. Due to the complexity of society and the diversity of the economy different types of measures are needed in order to achieve the change. We suggest some measures related to regulations, eco-design, material recycling and welfare for production, investments, services and individual consumption. They are also applicable outside Finland. In the future, the transition towards a low resource economy needs radical changes, more innovations, policy support and actions on all societal levels.

References

  1. European Commission. A Resource-Efficient Europe-Flagship Initiative under the Europe 2020 Strategy; COM(2011)21. Available online: http://ec.europa.eu/resource-efficient-europe/pdf/resource_efficient_europe_en.pdf (accessed on 27 June 2013).
  2. Antikainen, R.; Mickwitz, P.; Seppälä, S.; Virkamäki, V.; Leppänen, M.; Hujala, T.; Riala, M.; Nummelin, T.; Paavilainen, L.; Vihinen, H.; et al. Opportunities for Green Growth [In Finnish with English abstract]; Prime Minister’s Office Reports 4/2013: Helsinki, Finland, 2013; Available online: http://vnk.fi/julkaisukansio/2013/r04-vihrean-kasvun/PDF/fi.pdf (accessed on 27 June 2013).
  3. Kowalski, M.; Swilling, M.; von Weizsäcker, E.U.; Ren, Y.; Moriguchi, Y.; Crane, W.; Krausmann, F.; Eisenmenger, N.; Giljum, S.; Hennicke, P.; et al. Decoupling Natural Resource Use and Environmental Impacts from Economic Growth; United Nations Environment Programme (UNEP): Geneva, Switzerland, 2011; A Report of the Working Group on Decoupling to the International Resource Panel. [Google Scholar]
  4. Dittrich, M.; Giljum, S.; Lutter, S.; Polzin, C. Green Economies around the World? Implications of Resource Use for Development and Environment; Sustainable Europe Research Institute (SERI): Vienna, Austria, 2012; Available online: http://www.boell.de/downloads/201207_green_economies_around_the_world.pdf (accessed on 27 June 2013).
  5. The Factor 10 Institute. Available online: http://www.factor10-institute.org/ (accessed on 28 June 2013).
  6. Robèrt, K.H.; Schmidt-Bleek, B.; Aloisi de Larderel, J.; Basile, G.; Jansen, J.L.; Kuehr, R.; Price Thomas, P.; Suzuki, M.; Hawken, P.; Wackernagel, M. Strategic sustainable development—Selection, design and synergies of applied tools. J. Clean. Prod. 2002, 10, 197–214. [Google Scholar] [CrossRef]
  7. European Commission, Eurostat. Resource Productivity by Countries. 2009. Available online: http://epp.eurostat.ec.europa.eu/statistics_explained/index.php?title=File:Resource_Productivity_by_countries,_2009_%28EUR_per_kg%29.png&filetimestamp=20120809145542 (accessed on 16 April 2013).
  8. National Accounts, Gross Domestic Product by Industry (TOL 2008), %. Available online: http://www.stat.fi/tup/suoluk/suoluk_kansantalous_en.html (accessed on 9 April 2013).
  9. Programme of Prime Minister Jyrki Katainen’s Government. Prime Minister’s Office: Helsinki, Finland, 22 June 2011. Available online: http://valtioneuvosto.fi/hallitus/hallitusohjelma/pdf/en334743.pdf (accessed 24 April 2013).
  10. Bringezu, S.; Schütz, H.; Steger, S.; Baudisch, J. International comparison of resource use and its relation to economic growth. The development of total material requirement, direct material inputs and hidden flows and the structure of TMR. Ecol. Econ. 2004, 51, 97–124. [Google Scholar] [CrossRef]
  11. Hinterberger, F.; Schmidt-Bleek, F. Dematerialization, MIPS and Factor 10. Physical sustainability indicators as a social device. Ecol. Econ. 1999, 29, 53–56. [Google Scholar] [CrossRef]
  12. Ritthoff, M.; Rohn, H.; Liedtke, C. Calculating MIPS. Resource Productivity of Products and Services. Wuppertal Spezial 27e; Wuppertal Institute for Climate, Environment and Energy: Wuppertal, Germany, 2002. [Google Scholar]
  13. Economy Wide Material Flow Accounts and Derived Indicators (Edition 2000). A Methodological Guide; Eurostat, European Communities: Luxembourg, 2001.
  14. Economy-Wide Material Flow Accounts (EW-MFA). Compilation Guide 2012; Eurostat, European Communities: Luxembourg, 2012.
  15. Schoer, K.; Weinzettel, J.; Kovanda, J.; Giegrich, J.; Lauwigi, C. Raw material consumption of the European Union—Concept, calculation method, and results. Environ. Sci. Tech. 2012, 46, 8903–8909. [Google Scholar] [CrossRef]
  16. Mancini, L.; Lettenmeier, M.; Rohn, H.; Liedtke, C. Application of the MIPS method for assessing the sustainability of production-consumption systems of food. J. Econ. Behav. Organ. 2012, 81, 779–793. [Google Scholar]
  17. Suh, S. Handbook of Input-Output Economics in Industrial Ecology; 2nd Printing; Springer: Dordrecht, Germany, 2009. [Google Scholar]
  18. Seppälä, J.; Mäenpää, I.; Koskela, S.; Mattila, T.; Nissinen, A.; Katajajuuri, J.M.; Härmä, T.; Korhonen, M.R.; Saarinen, M.; Virtanen, Y. An assessment of greenhouse gas emissions and material flows caused by the Finnish economy using the ENVIMAT model. J. Clean. Prod. 2011, 19, 1833–1841. [Google Scholar] [CrossRef]
  19. Koskela, S.; Mäenpää, I.; Seppälä, J.; Mattila, T.; Korhonen, M.-R. EE-IO modeling of the environmental impacts of Finnish imports using different data sources. Ecol. Econom. 2011, 70, 2341–2349. [Google Scholar] [CrossRef]
  20. Eurostat Manual of Supply, Use and Input-Output Tables; Eurostat: Luxembourg, 2008; Available online: http://epp.eurostat.ec.europa.eu/cache/ITY_OFFPUB/KS-RA-07-013/EN/KS-RA-07-013-EN.PDF (accessed on 28 January 2013).
  21. Ecoinvent Database v.2.2. Swiss Centre for Life Cycle Inventories; Ecoinvent. 2010. Available online: http://www.ecoinvent.org (accessed on 28 January 2013).
  22. Faostat Web Page. Available online: http://faostat.fao.org/ (accessed on 28 January 2013).
  23. Timmer, M. The World Input-Output Database (WIOD): Contents, Sources and Methods. 2012. Available online: http://www.wiod.org/database/index.htm (accessed on 7 June 2013).
  24. Lenzen, M. Errors in conventional and input-output-based life-cycle inventories. J. Ind. Ecol. 2001, 4, 127–148. [Google Scholar] [CrossRef]
  25. Oosterhaven, J. On the Definition of Key Sectors and the Stability of Net versus Gross Multipliers; Research Report 04C01; University of Groningen: Groningen, The Netherlands, 2004. [Google Scholar]
  26. Szyrmer, J.M. Measuring connectedness of input-output models: 2. Total flow concept. Environ. Plan. A 1986, 18, 107–121. [Google Scholar]
  27. Wood, R.; Lenzen, M. Aggregate measures of complex economic structure and evolution. J. Ind. Ecology 2009, 13, 264–283. [Google Scholar] [CrossRef]
  28. Lenzen, M. Environmentally important paths, linkages and key sectors in the Australian economy. Struct. Change Econ. Dyn. 2003, 14, 1–34. [Google Scholar] [CrossRef]
  29. Mattila, T. Any sustainable decoupling in the Finnish economy? A comparison of the pathways and sensitivities of GDP and ecological footprint 2002–2005. Ecol. Indic. 2012, 16, 128–134. [Google Scholar] [CrossRef]
  30. Material Intensity Factors, Overview on Materials, Fuels, Transport Services and Food. Available online: http://wupperinst.org/uploads/tx_wupperinst/MIT_2011.pdf (assessed on 25 April 2013).
  31. Martens, P.; Rotmans, J. Transitions in a globalising world. Futures 2005, 37, 1133–1144. [Google Scholar] [CrossRef]
  32. Geels, F.W.; Kemp, R. Dynamics in socio-technical systems: Typology of change processes and contrasting case studies. Technol. Soc. 2007, 29, 441–445. [Google Scholar] [CrossRef]
  33. Bergek, A.; Jacobsson, S.; Carlsson, B.; Lindmark, S.; Rickne, A. Analyzing the functional dynamics of technological innovation systems: A scheme of analysis. Res. Policy 2008, 37, 407–429. [Google Scholar] [CrossRef]
  34. Meadows, D.H. Thinking in Systems. Chapter Six: Leverage Points: Places to Intervene in a System; Chelsea Green Publishing Company: White River Junction, VT, USA, 2008; pp. 145–165. [Google Scholar]
  35. Europan Environment Agency. Survey of Resource Efficiency Policies in EEA Member and Cooperating Countries. Available online: http://www.eea.europa.eu/themes/economy/resource-efficiency/germany-2014-resource-efficiency-policies (accessed on 27 June 2013).
  36. The International Organization for Standardization (ISO), Environmental Management, Material Flow Cost Accounting, General Framework; ISO 14051:2011; ISO: Geneva, Switzerland, 2011.
  37. Schnieders, J.; Hermelink, A. DEPHEUS results: Measurements and occupant’s satisfaction provide evidence for passive houses being an option for sustainable building. Energy Policy 2006, 34, 151–171. [Google Scholar] [CrossRef]
  38. Mont, O.; Plepys, A. Sustainable consumption progress: Should we be proud or alarmed? J. Clean. Prod. 2008, 16, 531–537. [Google Scholar] [CrossRef]
  39. Hislop, H.; Hill, J. Reinventing the Wheel: A Circular Economy for Resource Security; Green Alliance: London, UK, 2011. [Google Scholar]

