Energy Saving Estimation of Athens Trolleybuses Considering Regenerative Braking and Improved Control Scheme


Department of Electrical & Computer Engineering, Democritus University of Thrace, 67132 Xanthi, Greece
*
Author to whom correspondence should be addressed.
Resources 2018, 7(3), 43; https://doi.org/10.3390/resources7030043
Submission received: 23 June 2018
/
Revised: 13 July 2018
/
Accepted: 19 July 2018
/
Published: 22 July 2018
(This article belongs to the Special Issue Advance Research on Power Electronics for Sustainable Energy Conversion Systems)
Abstract
:In this work, the electromechanical system of the 8000-series of Athens trolleybuses, based on data provided by OSY S.A., is analyzed. Those data were used to develop a valid model in order to estimate the total energy consumption of the vehicle under any possible operating conditions. In addition, an effort is made to estimate the energy saving potential if the wasted energy—in the form of heat—during braking or downhill courses is recovered (regenerative braking) and retrofitted during normal operation. This process requires the installation of appropriate electrical apparatus to recover and temporarily store this energy amount. Moreover, due to the fact that the main engine of the system is an asynchronous electric machine, its driving scheme is also of interest. This study assumes the current driving scheme, that is the direct vector control (DVC), and proposes an alternative control method, the direct torque control (DTC). Energy consumption/saving calculations highlight the effectiveness of incorporating regenerative braking infrastructure in trolleybuses transportation systems. Finally, a sustainable hybrid energy storage unit that supports regenerative braking is proposed.
1. Introduction
Athens trolleybuses are a particularly widespread electric vehicle for mass transportation in Greece. OSY S.A. owns 91 single buses and 51 articulated buses, covering 25 route-lines in Athens center [1]. The main traction motor of the 8000-series single trolleybuses under study is an asynchronous machine of 210 kW rated power; from the perspective of limiting the trolleybus electric energy consumption, the focus is on investigating the regenerative energy saving potential and the efficiency of the machine driving scheme [1].
Although regenerative braking energy recovery has been widely used in hybrid electric vehicles [2,3,4,5,6], as well as in some public means of electrical transportation, such as metros and trains [7,8], it has not been studied and incorporated in the case of trolleybuses, in any east-European country and other countries world-wide. The reason for this is some technical restrictions in the electric system of those vehicles, which are being discussed in this study. Hence, under this frame, the main contribution of the current work is the comprehensive study of regenerative braking energy recovery application in trolleybuses. In addition, a hybrid energy storage system is proposed, in order to improve the energy efficiency of the regenerative braking scheme.
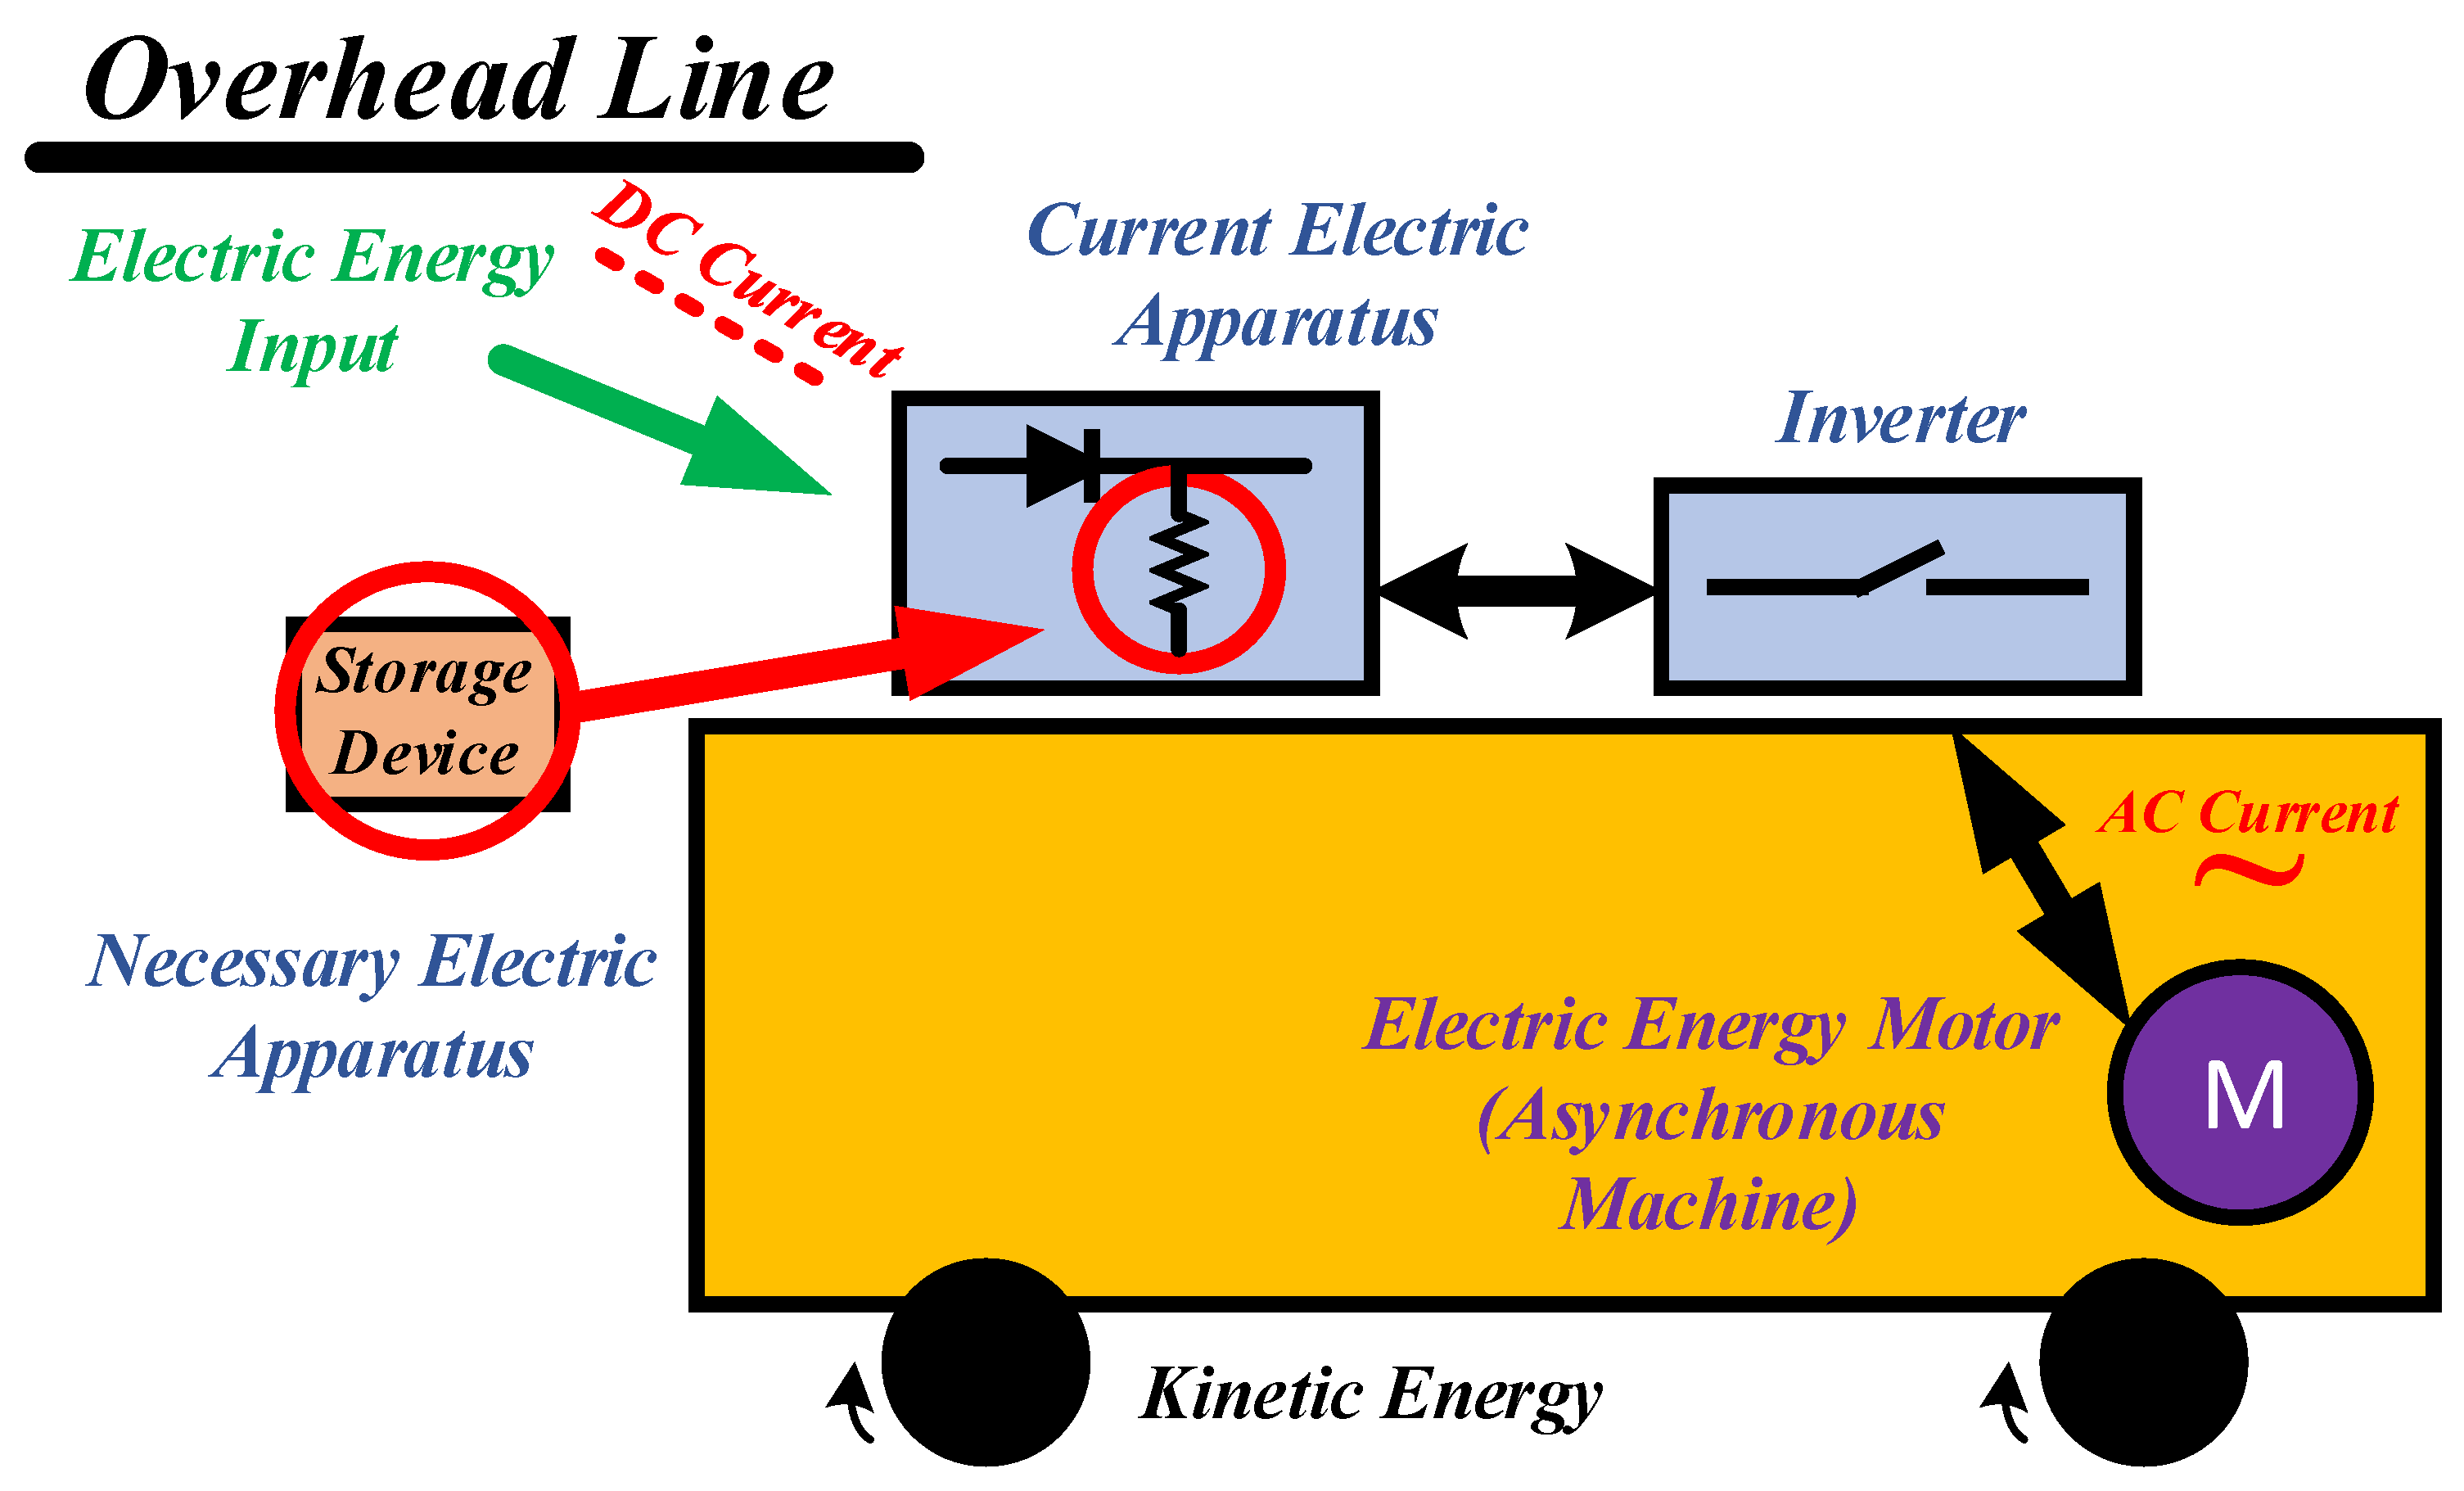
Regarding the regenerative braking, the amount of energy that can be saved from the existing trolleybuses under real operating conditions (e.g., during speed reduction intervals or downhill traveling) is estimated [1]. However, this energy saving scheme cannot be directly applied to the existing power supply system of those trolleybuses because there is not any energy storage unit available, as shown in Figure 1. However, modern power electronic technologies of energy storage and retrofit that have been proposed in recent literature [9,10,11] can be used (under appropriate scaling) in order to implement regenerative braking recovery, as proposed in Figure 1.
In addition, besides implementing the existing direct vector control (DVC) scheme of the trolleybus asynchronous machine, the direct torque control (DTC), which is widely used for the dynamic control of electric alternating current (AC) machines [12,13], is also considered. Both methods rely on the dynamic model of the machine, though they implement different control logic [14]. These driving schemes are applied to the electric trolleybuses of interest in order to highlight the performance of each one across the total operating range for this particular application.
In the present study, an appropriate behavioral model of the trolleybus electromechanical system is developed, including the machine driving scheme. Exhaustive simulations based on this model are performed in Matlab/Simulink environment, covering the total operating range of the trolleybus; the results lead to an analytical functional model of the energy consumption estimation, as well as of the regenerative energy recovery potential; energy consumption/saving calculations are based on realistic transportation conditions. Finally, sustainability estimations regarding the necessary energy recovery apparatus are presented [15].
It is noted that the current work focuses on the 8000-series of single trolleybuses owned by OSY S.A. Nevertheless, the proposed modelling and energy saving analysis is valid for any type of trolleybus.
2. Existing and Proposed Driving Scheme
2.1. Existing Driving Scheme—Direct Vector Control
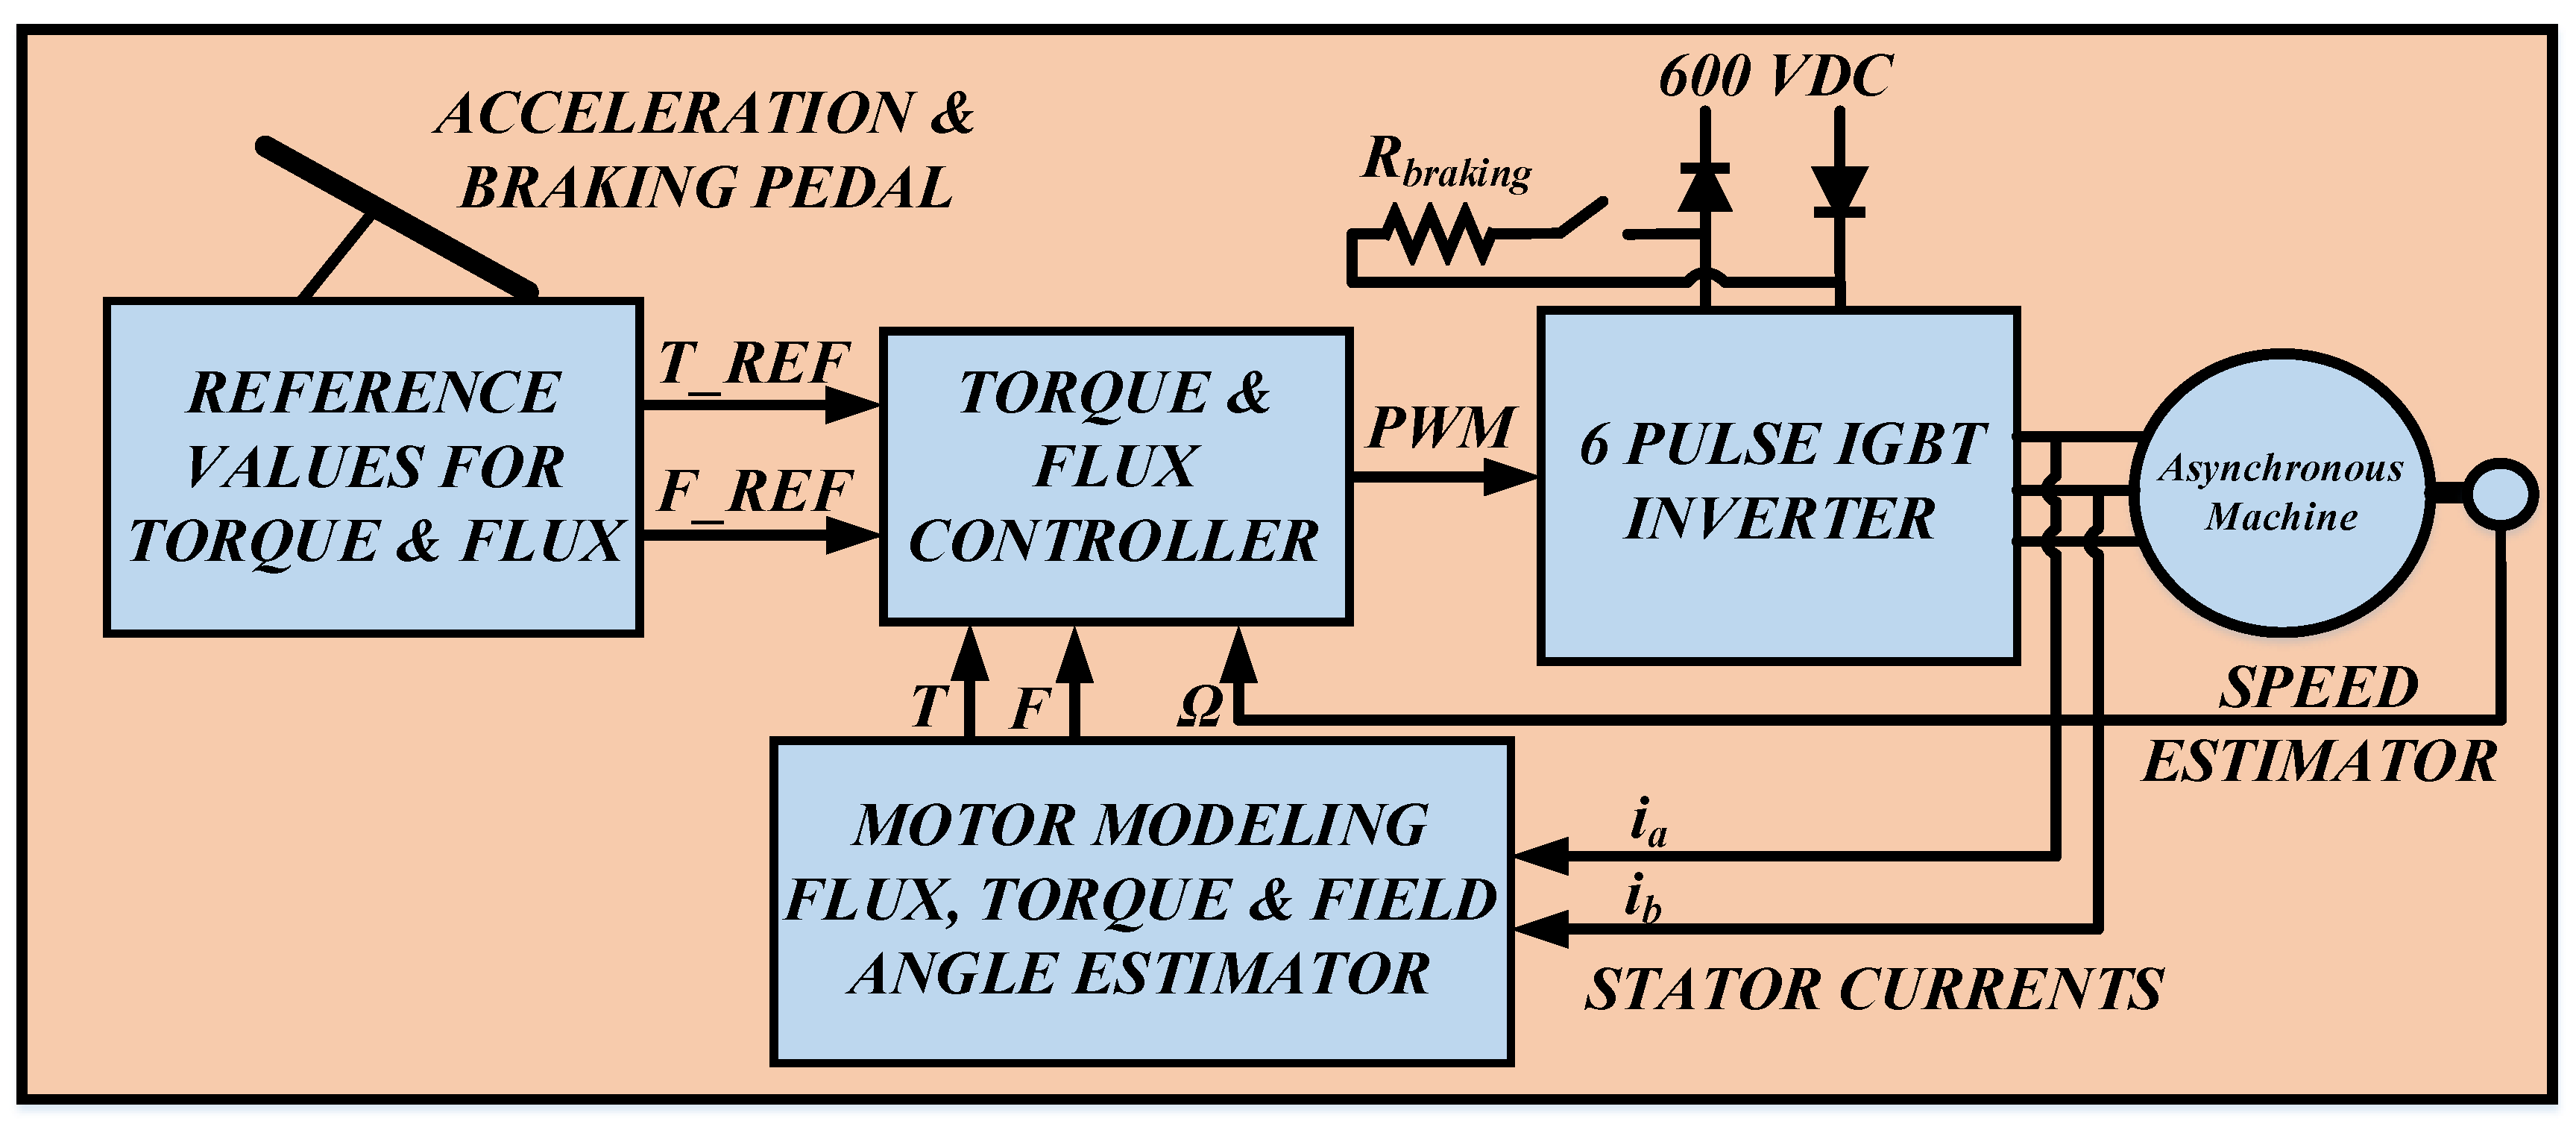
The block diagram of the DVC that is currently used in the trolleybuses under study is depicted in Figure 2 [1]. The dynamic equivalent model of the asynchronous machine applied to the stator reference frame is used for the calculation of the torque and flux producing currents. Specifically, two stator phase currents and rotor speed feedback serve as inputs to the rotor flux, electromagnetic torque, and rotor field angle estimator unit, based on the dynamic model of the machine. The estimated values are compared to the reference values to produce the PWM signals that drive the six-pulse inverter. Park transformation is used to turn the time-variable (sinusoidal) quantities of the machine (current, voltages, flux, etc.) into time-invariable ones (direct current (DC) quantities), to be used by error controllers. The implementation of closed loop control (torque and flux controller) of the appropriate estimated DC quantities approximates the control of the separately excited DC machines; as a result, fast dynamic response and accuracy of the control system is achieved [16,17].
2.2. Proposed Control Scheme—Direct Torque Control
The main difference of DTC with respect to DVC is that transformation from the static reference frame to the synchronously rotating reference frame is not necessary [14]. Because of the fact that this technique involves error limitation within a hysteresis zone, there is no need for handling DC quantities, which simplifies the control scheme. In addition, there is no need for a speed sensor.
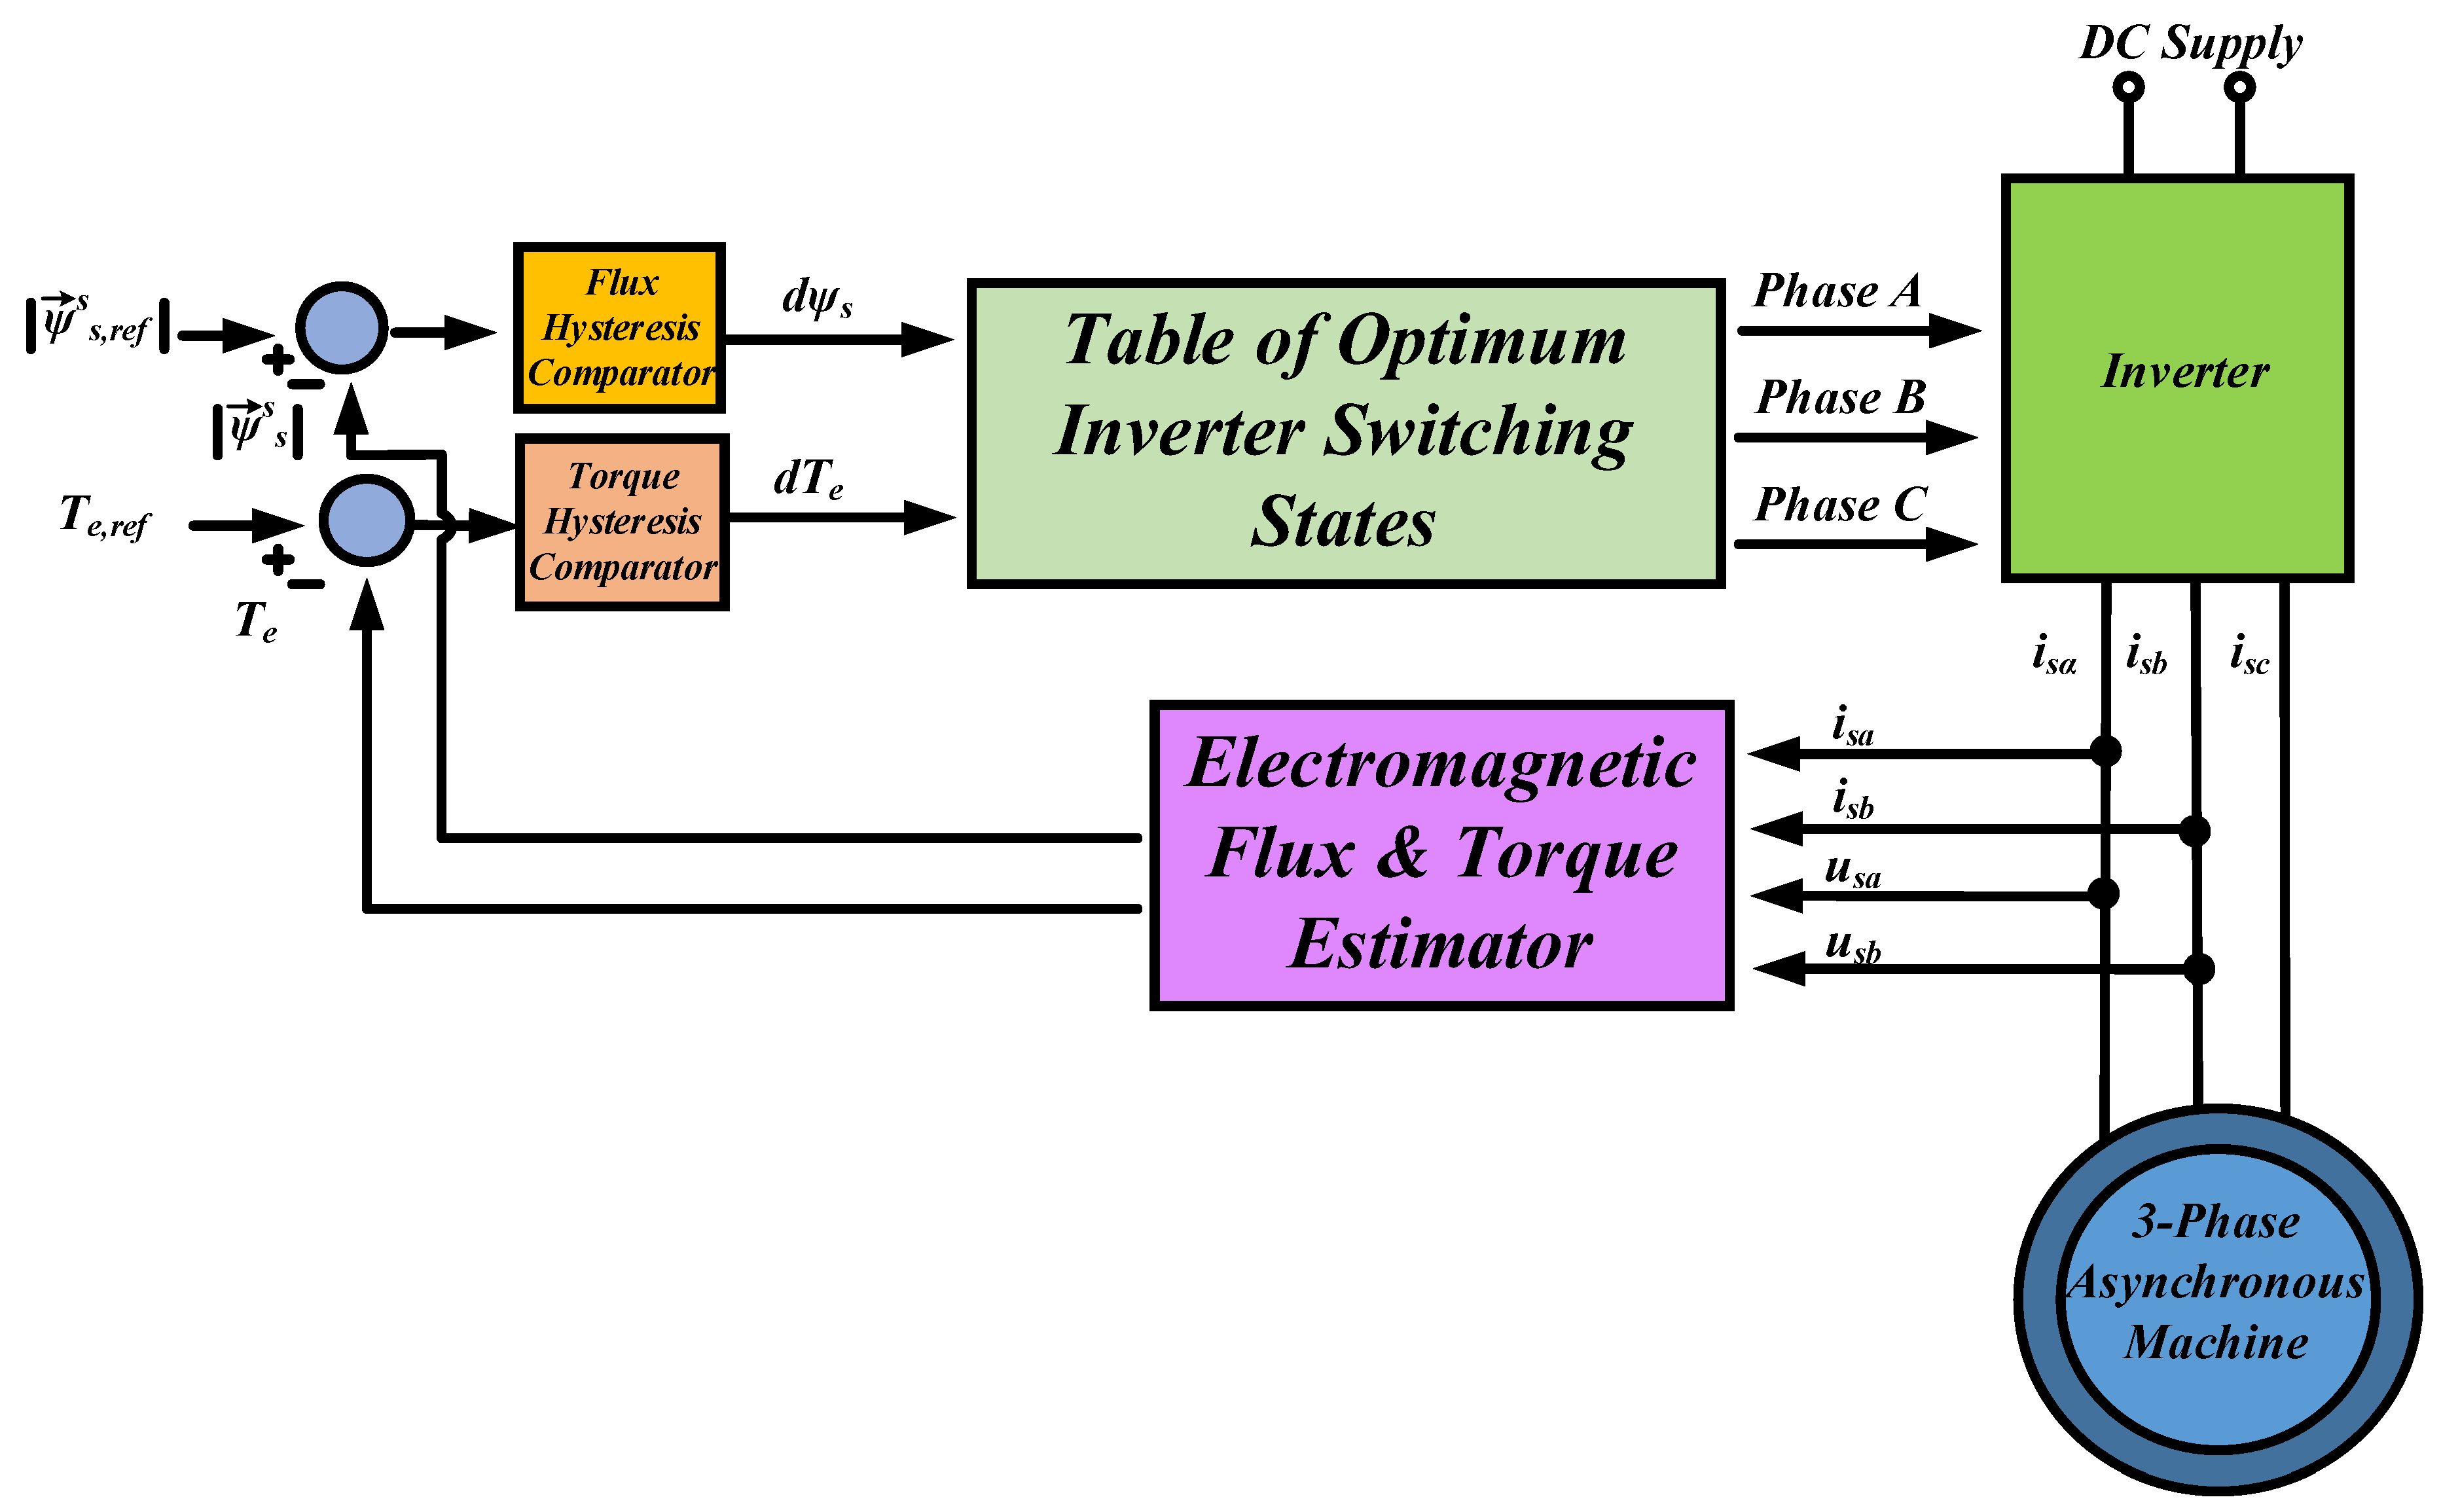
Figure 3 depicts the DTC block diagram, where electromagnetic flux and torque values estimated by the dynamic machine model are compared to their reference values. The errors are fed to two hysteresis controllers and the resulting signals determine the inverter pulsation, with the use of an optimally operating state selection table.
3. Modeling of the Electromechanical System
3.1. Electric Supply Circuit
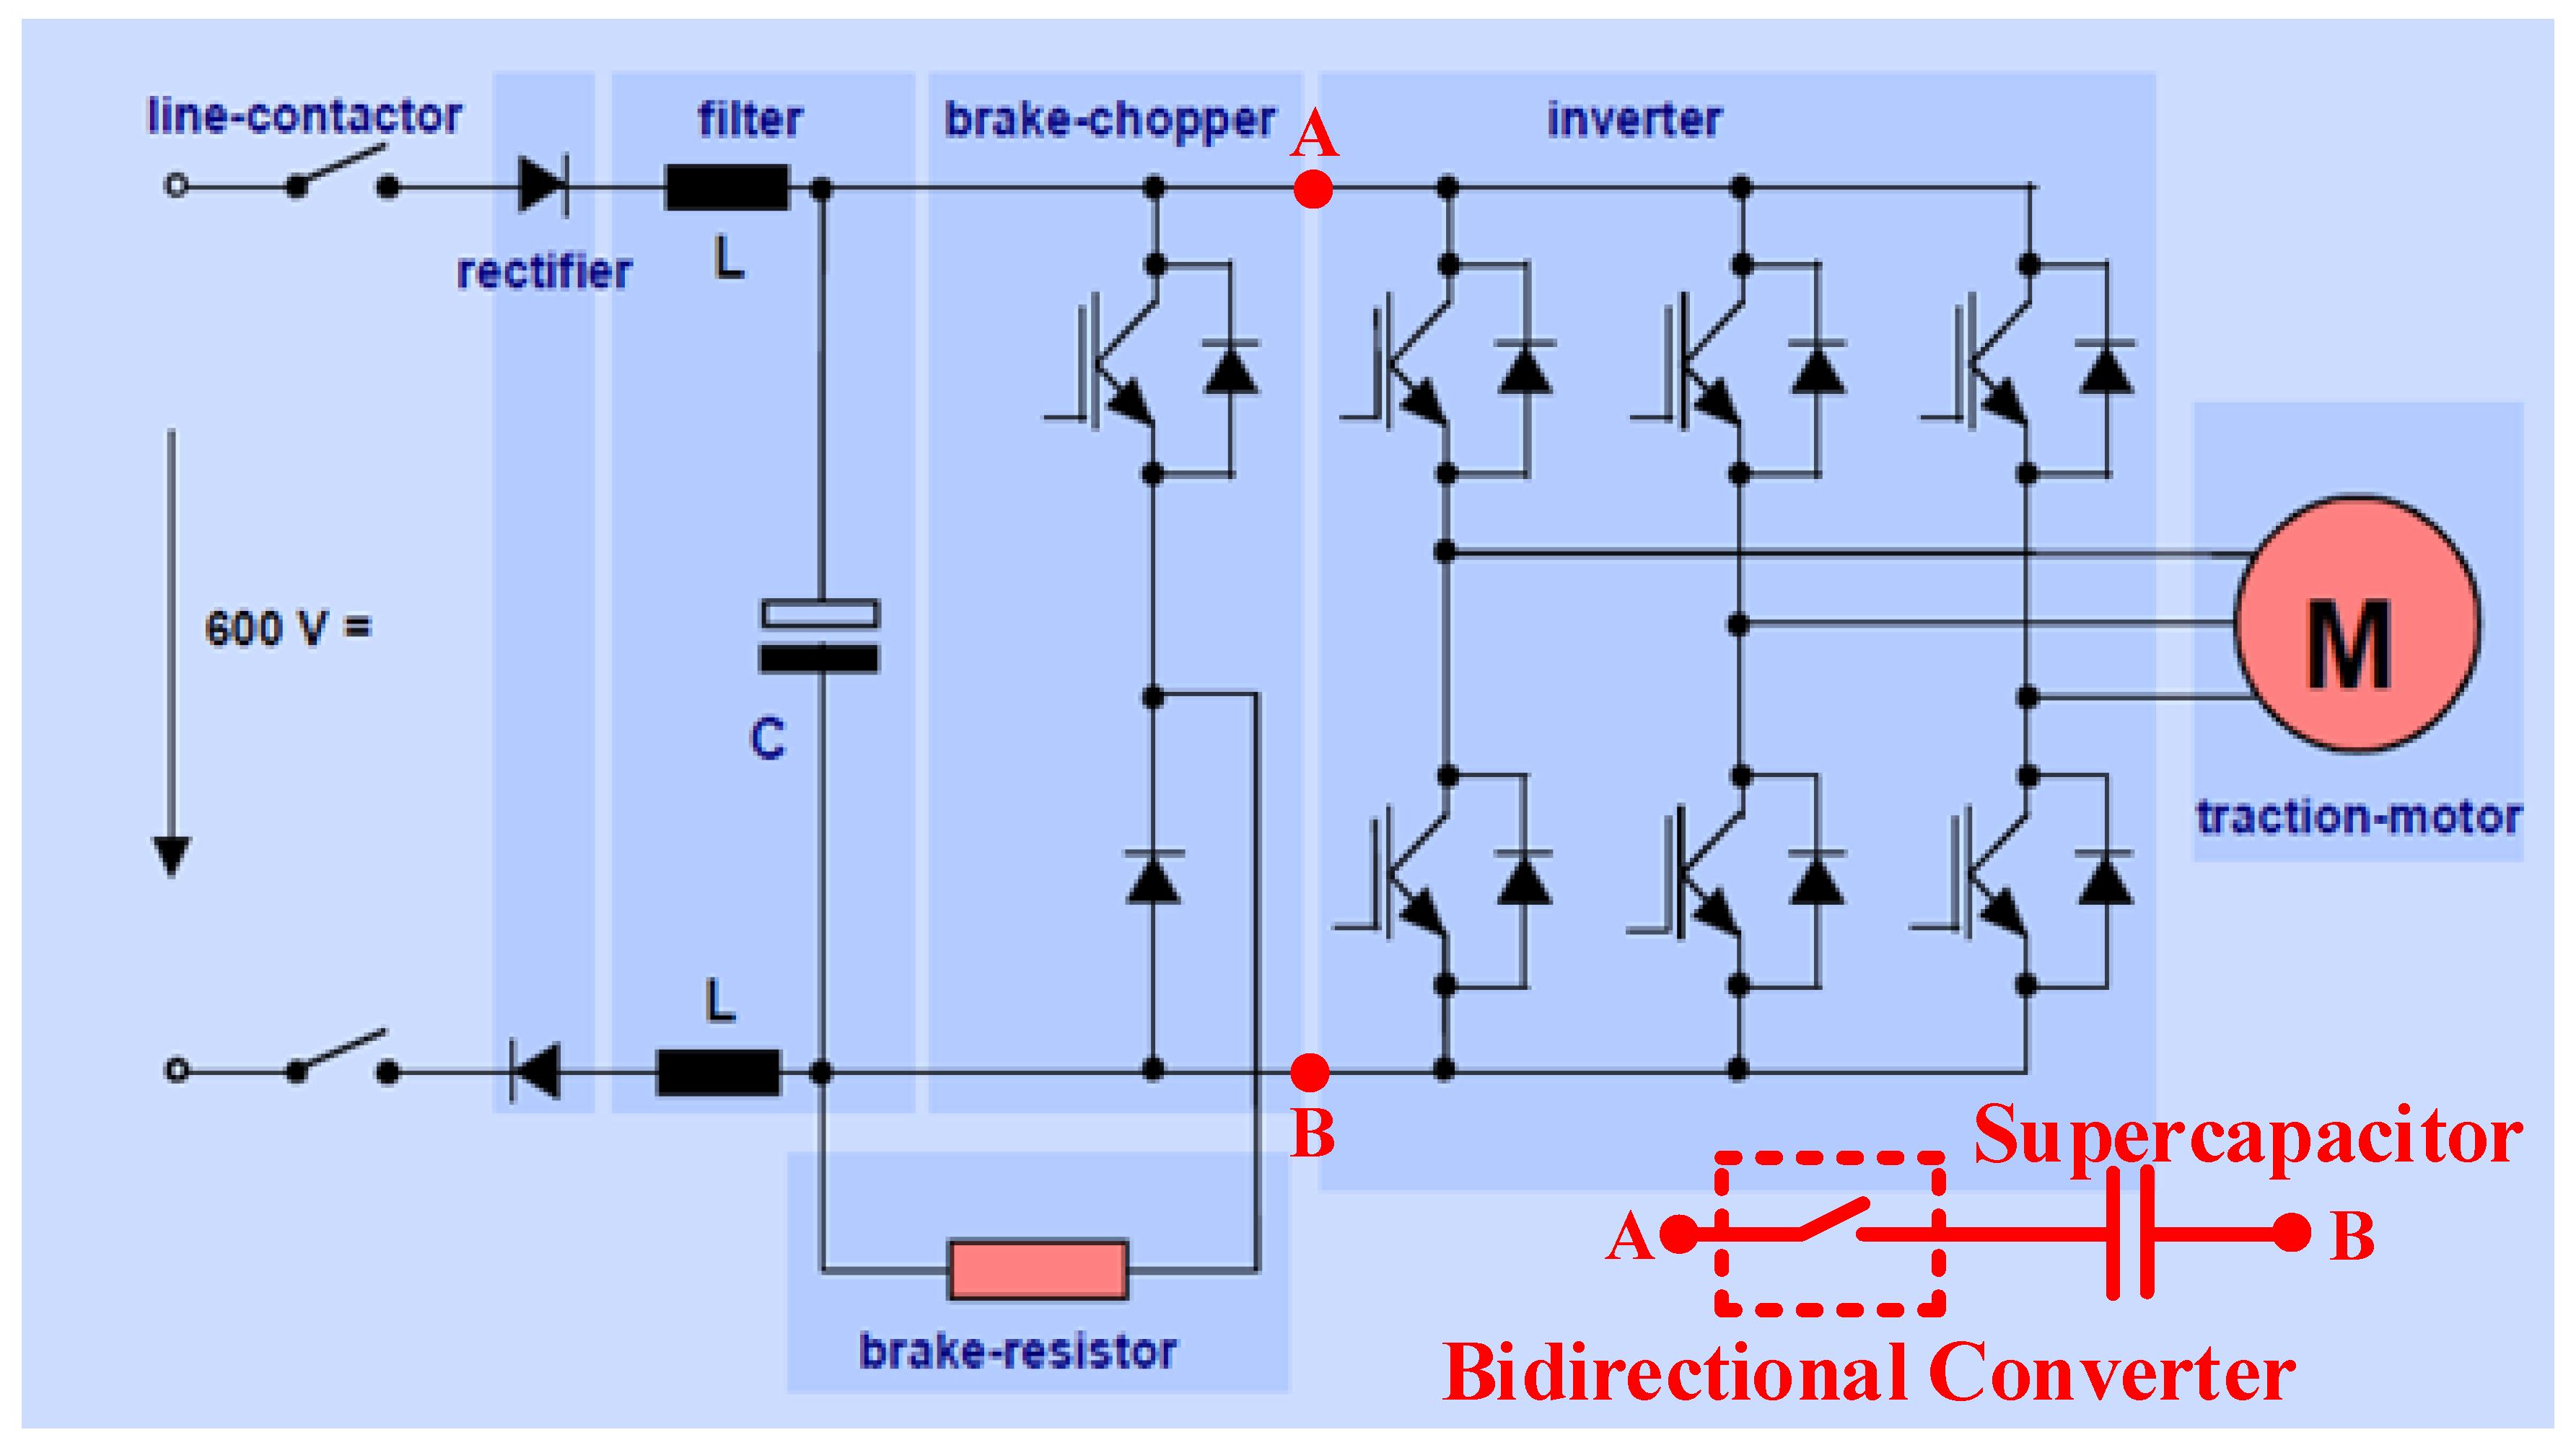
Figure 4 illustrates the driving unit of the trolleybuses under study; it includes the vehicle power source (600 VDC), an LC filter, a braking resistance—combined with a unidirectional chopper—branch, the power inverter, and the asynchronous machine (M).
During accelerations and constant speed vehicle courses, the energy flow is directed from the power supply to the machine, which operates as a motor.
During deceleration/braking intervals and downhill traveling, the asynchronous machine operates as a generator, converting the kinetic energy of the trolleybus into electric energy, this time routed from the machine via the power inverter, to the inverter DC bus; this energy can, under appropriate conditions, be stored and retrofitted to the electric machine (when it requests energy supply). However, in the system under study, there is no storage unit available. Thus, the braking energy is consumed on the braking resistance, in the form of heat.
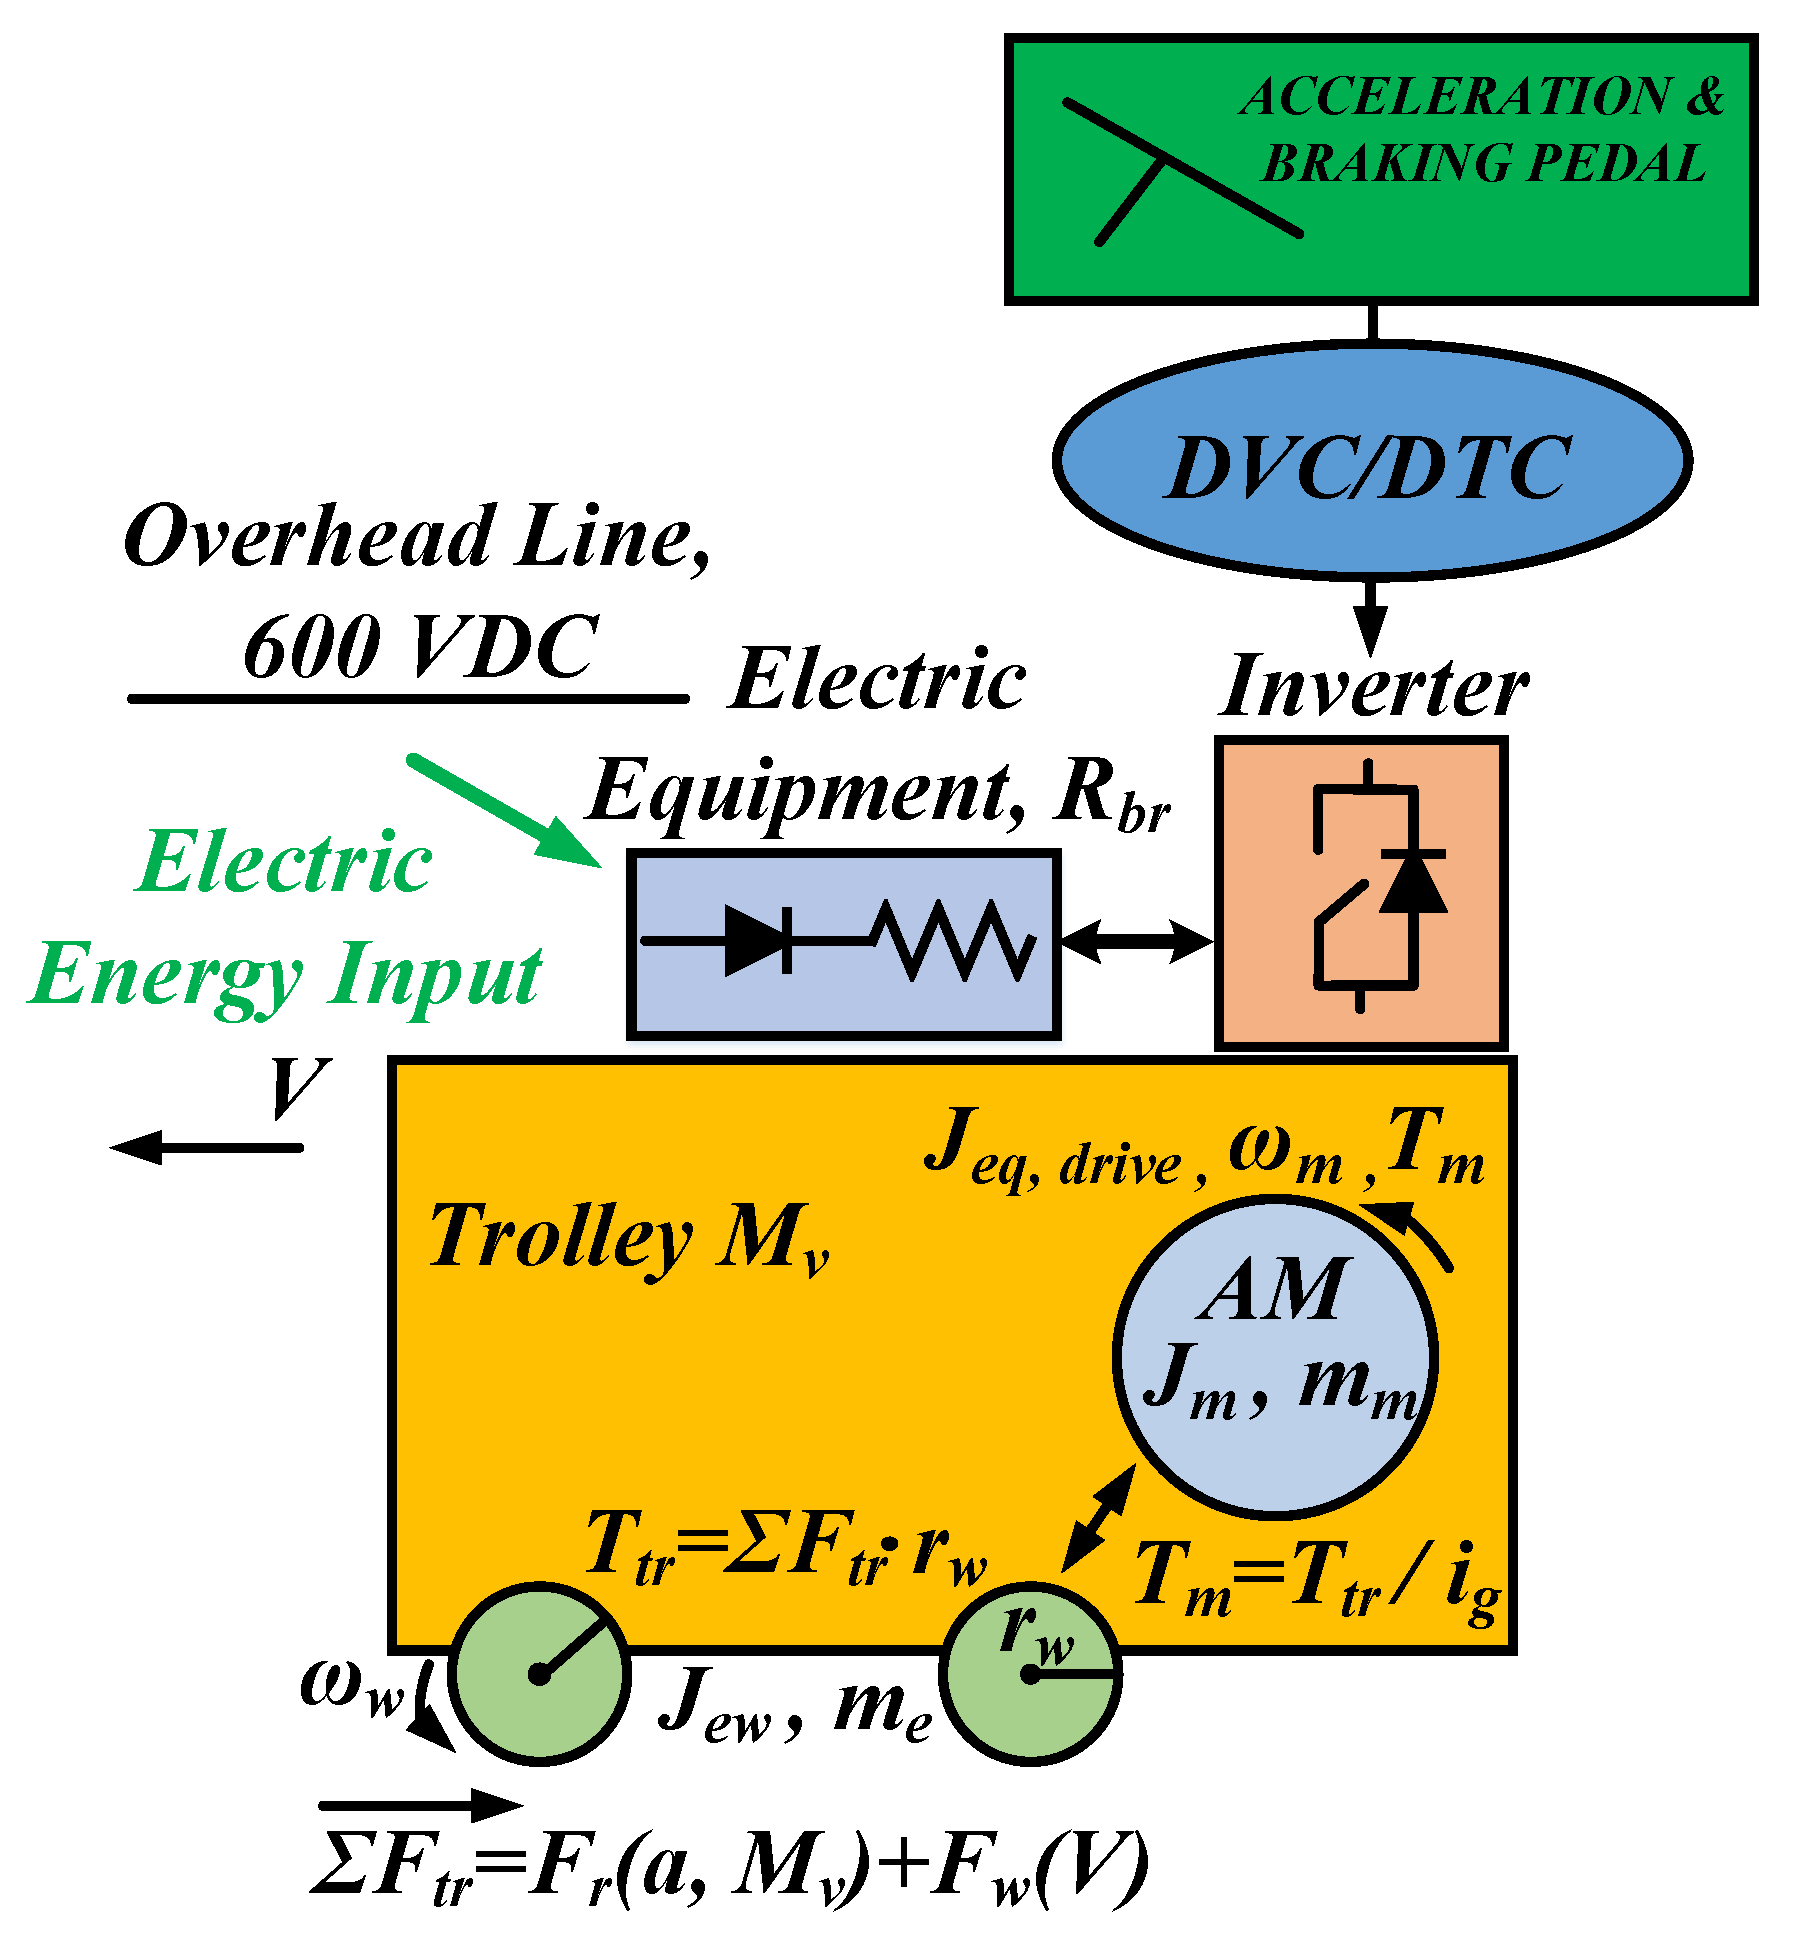
3.2. Mechanical Modeling of the Trolleybus
Figure 5 describes the mechanical part of the trolleybus [1,18]. The total rolling resistance of the vehicle (ΣFtr) comprises the rolling resistance (Fr) and the wind resistance (Fw); this force—that is, the vehicle transport load—is calculated and reduced to a torque value on the wheels (Ttr). Then, according to the trolleybus drive system (transmission factor ig), this torque value is reduced to the electric machine shaft level (mechanical load, Tm) [19,20].
The mathematical equations of the mechanical model in Figure 5 are as follows:
where Mv is the passenger load; g is the acceleration of gravity; fr is the rolling resistance coefficient, related to the type and shape of the vehicle; a is the road inclination angle; Af is the area of the vehicle face; kair is the aerodynamic coefficient; V is the linear velocity of the trolleybus; me is the equivalent vehicle mass; δ is the vehicle mass increase resulting from the individual moments of inertia of all its rotating masses (in this case, the rotating masses are considered to be the wheels and the electric motor); Jw is the inertia of the wheels; Jm is the motor inertia; mw is the mass of the wheels; mm is the motor mass; rw is the radius of the wheels; Jew is the equivalent vehicle moment of inertia; me is the equivalent total vehicle mass; and Je,drive is the total vehicle (equivalent) inertia reduced to the motor axis rotating speed.
3.3. Electrical Modeling of the Trolleybus
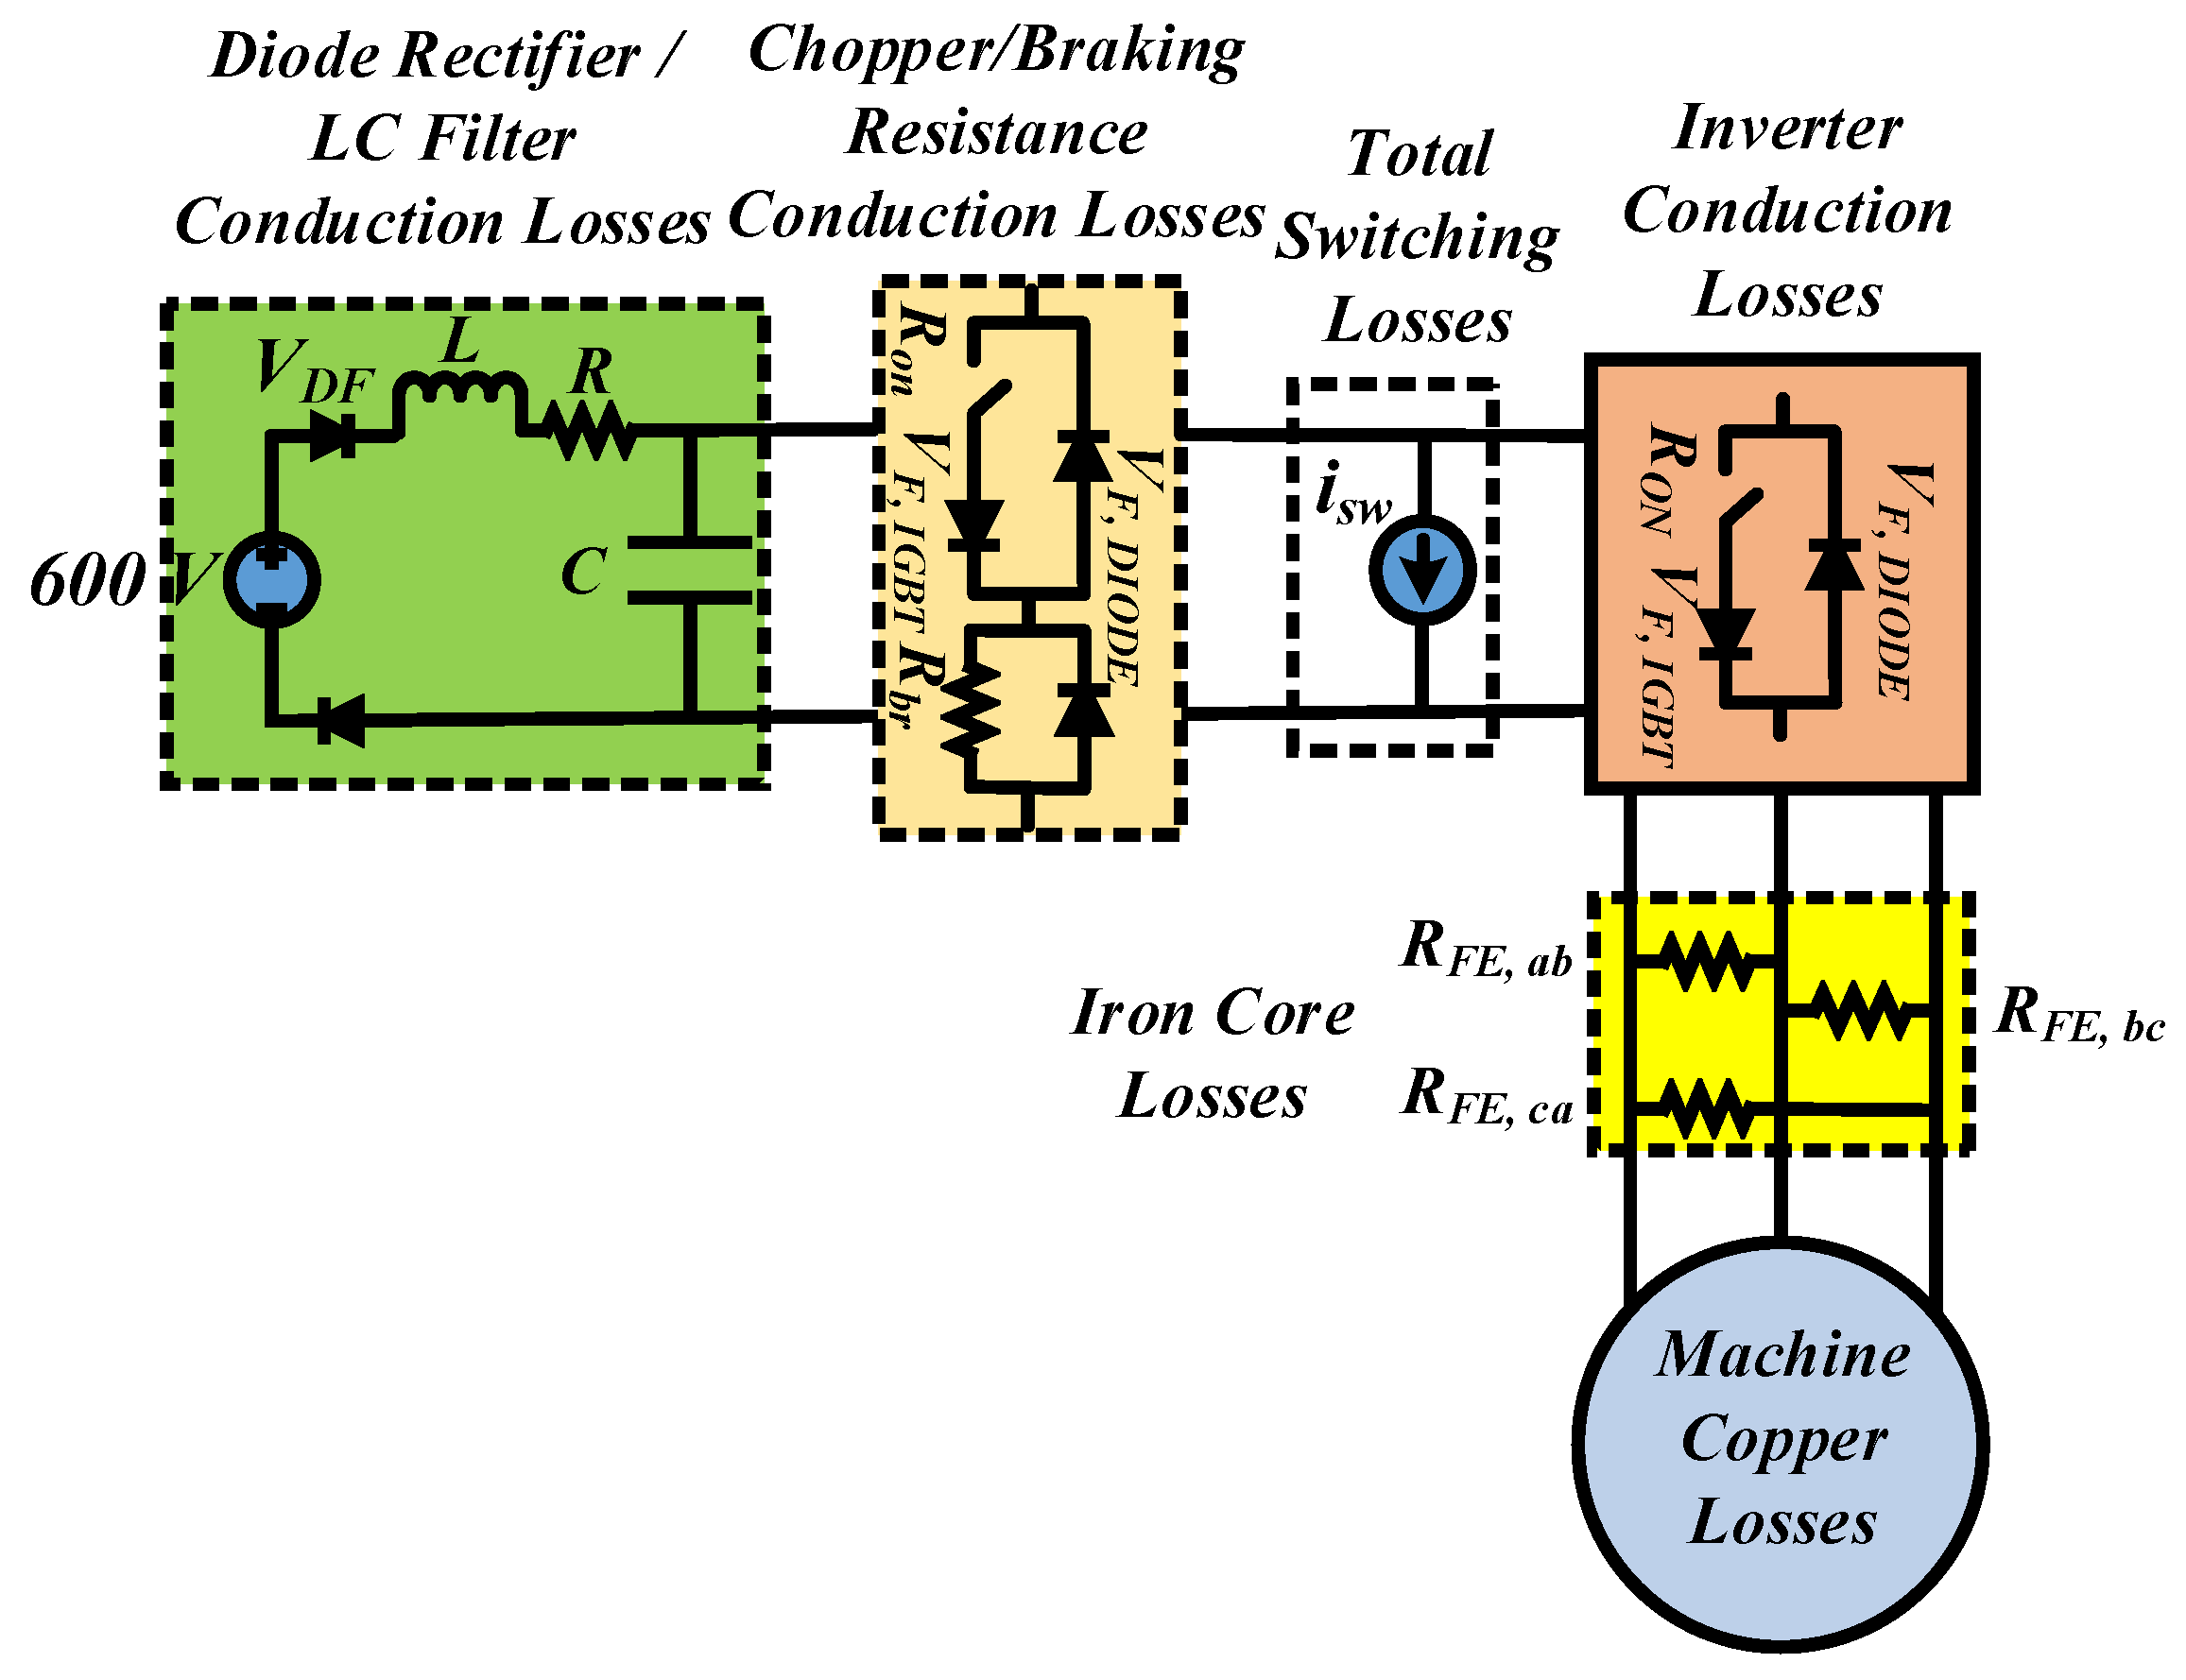
With regard to the electrical losses of the power supply circuit and the machine itself [23], all technical and operational parameters of the trolleybus were taken into account [1]. In addition, the switching losses of the device are estimated as a percentage of the machine rated output power and modeled as a variable current source, depending on the system electromagnetic torque. The trolleybus electrical losses model is shown in Figure 6.
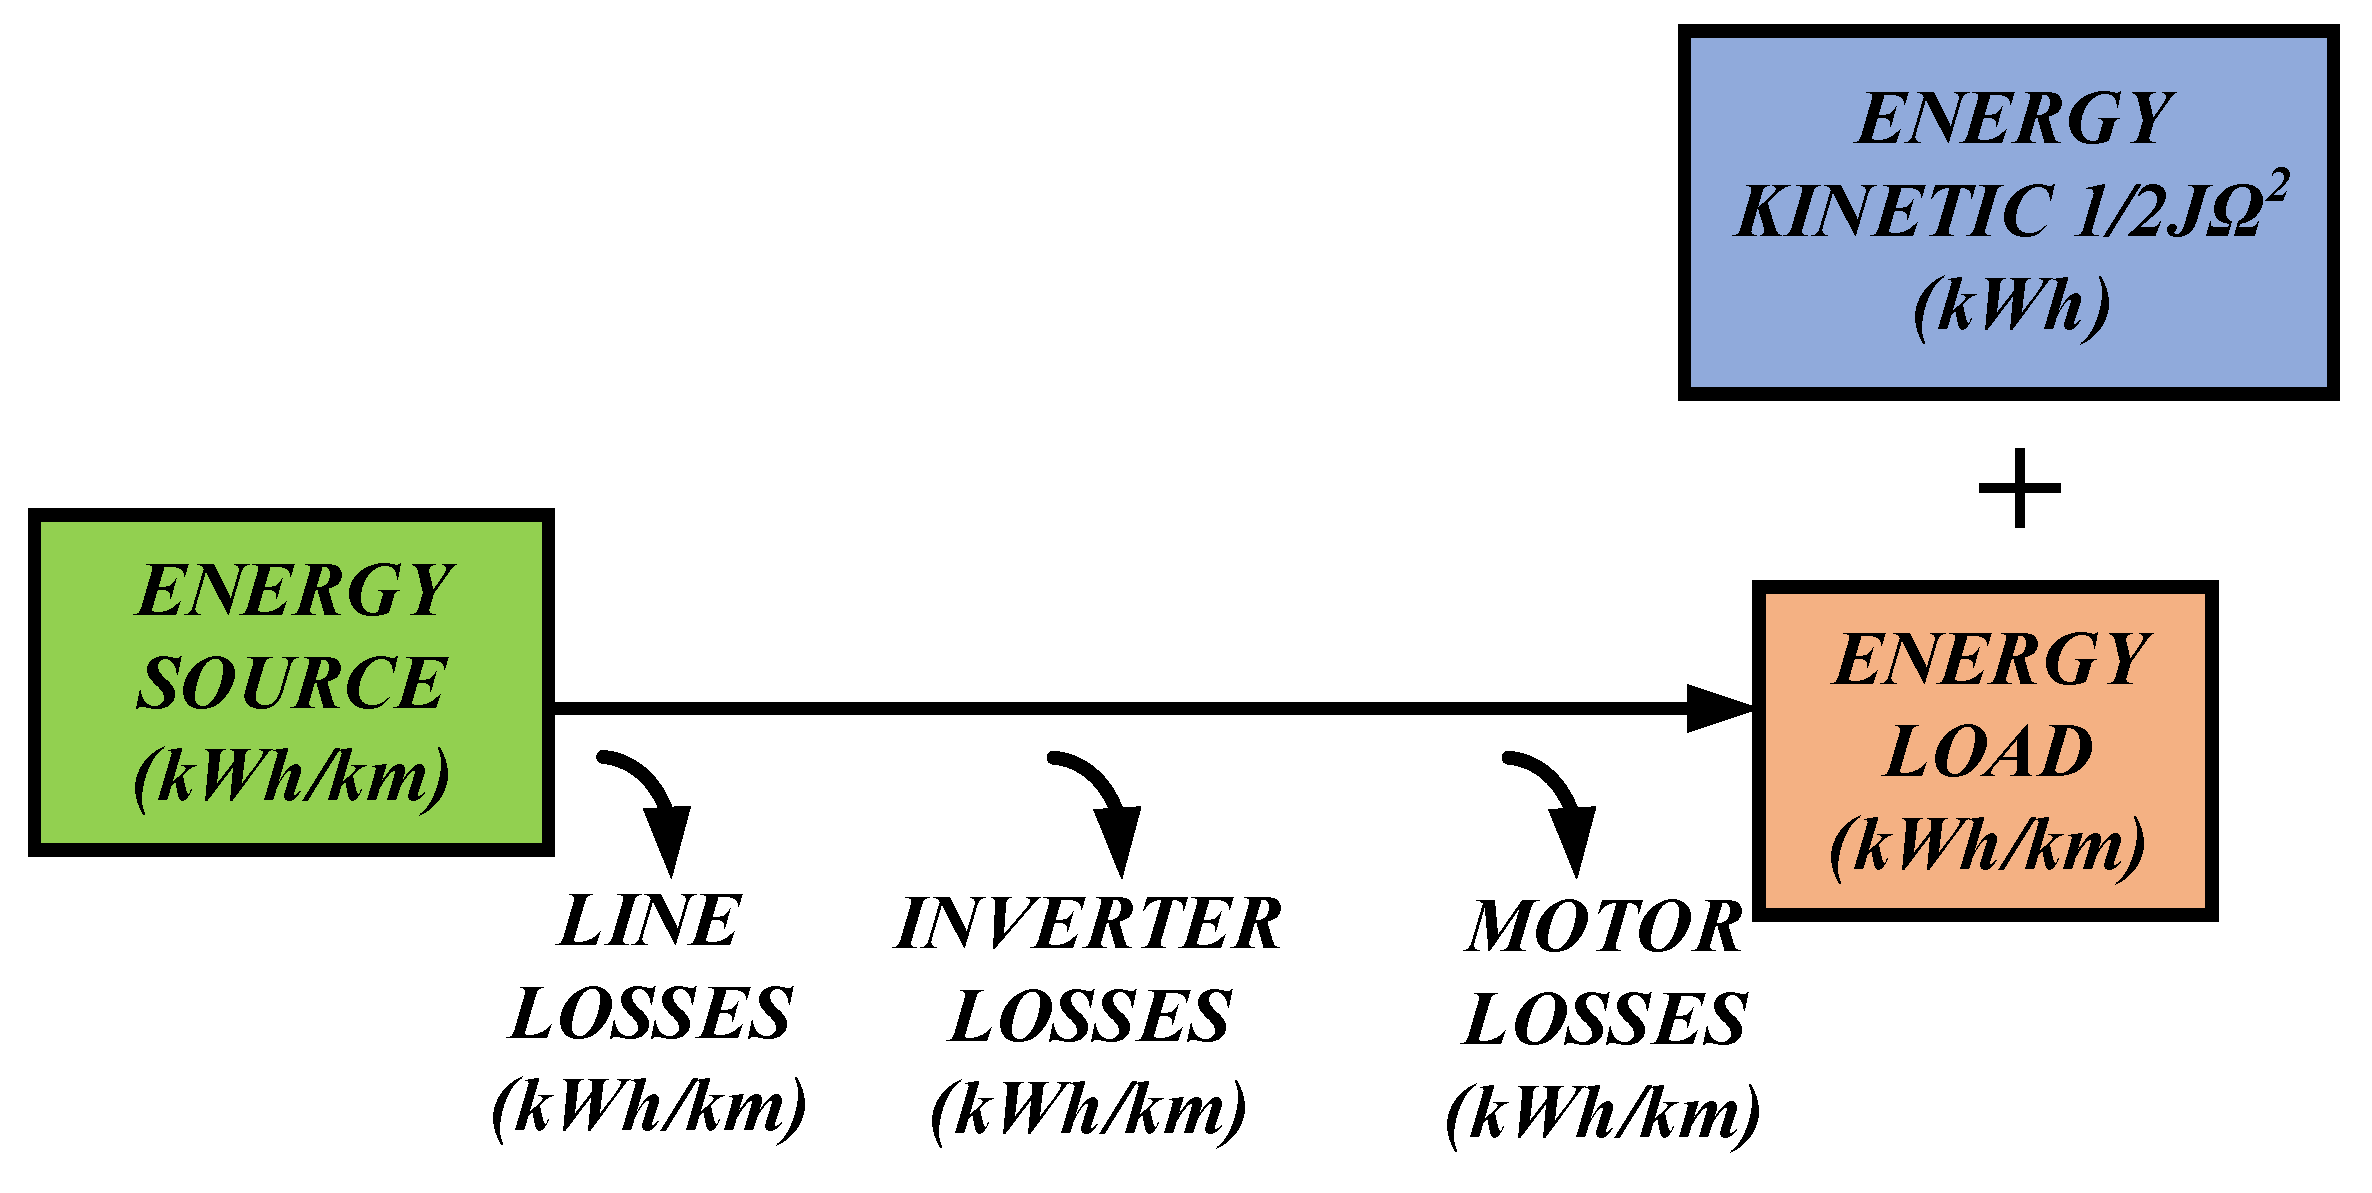
In addition, the total energy consumption is analyzed in the individual electrical losses of the line—including the diode rectifier, the LC filter, and the braking resistance branch—the power inverter losses, the asynchronous machine losses, the load energy (that is, the transport load, which includes the rolling resistance, the wind resistance, and the trolley passenger load), and finally the kinetic energy stored in the rotating/moving parts of the vehicle (as shown in Figure 7).
3.4. Matlab/Simulink Behavioral Model
The energy that is currently wasted in the above-mentioned way can be estimated considering the vehicle total energy consumption, that is, the electrical and mechanical power losses of the traction system, as analyzed. To achieve a valid estimation, a detailed behavioral Simulink model is developed, as shown in Figure 8.
Simulations have been performed in Matlab/Simulink environment, based on the electromechanical model of Figure 8, with sampling frequency 200 kHz; both DVC and the proposed DTC driving schemes are considered. The switching frequency of the PWM unit used in the DVC is 2 kHz, coinciding with the one used in the trolleybuses under study [1].
4. Energy Consumption Estimations Using DVC and DTC—Comparison of Results
4.1. Trolleybus Traveling Conditions under Study
The total energy consumption, as well as the amount of energy consumed on the dynamic braking resistance (which represents the percentage of the energy that can be recovered) are estimated under various operating conditions. These operating conditions are summarized below:
- Minimum (Mv = 14,000 kg) and maximum (Mv = 20,000 kg) passenger load.
- Accelerating from zero to different speeds—up to 65 km/h—assuming zero-inclined road.
- Acceleration at intermediate speeds, assuming zero-inclined road.
- Decelerating from maximum trolley speed (65 km/h) [1] to various speeds, assuming zero-inclined road.
- Decelerations from intermediate speeds, assuming zero-inclined road.
- Steady-speed courses (10, 20, 30, 40, and 50 km/h), assuming 0%, 1%, 5%, −1% and, −5% road inclination, respectively.
- DVC and DTC driving schemes.
- In DVC case, asynchronous machine slip is 1%.
In all cases of acceleration, the maximum torque is constant and equal to 1708.1 Nm—achieved with a suitable torque limiter—resulting in the vehicle maximum acceleration limit (1.5 m/s2). Similarly, in all deceleration conditions, the maximum torque is constant at −1480.6 Nm, resulting in the trolley maximum deceleration limit (1.3 m/s2), according to data provided by OSY. S.A.
4.2. Energy Consumption Estimations—Constant Speed Course
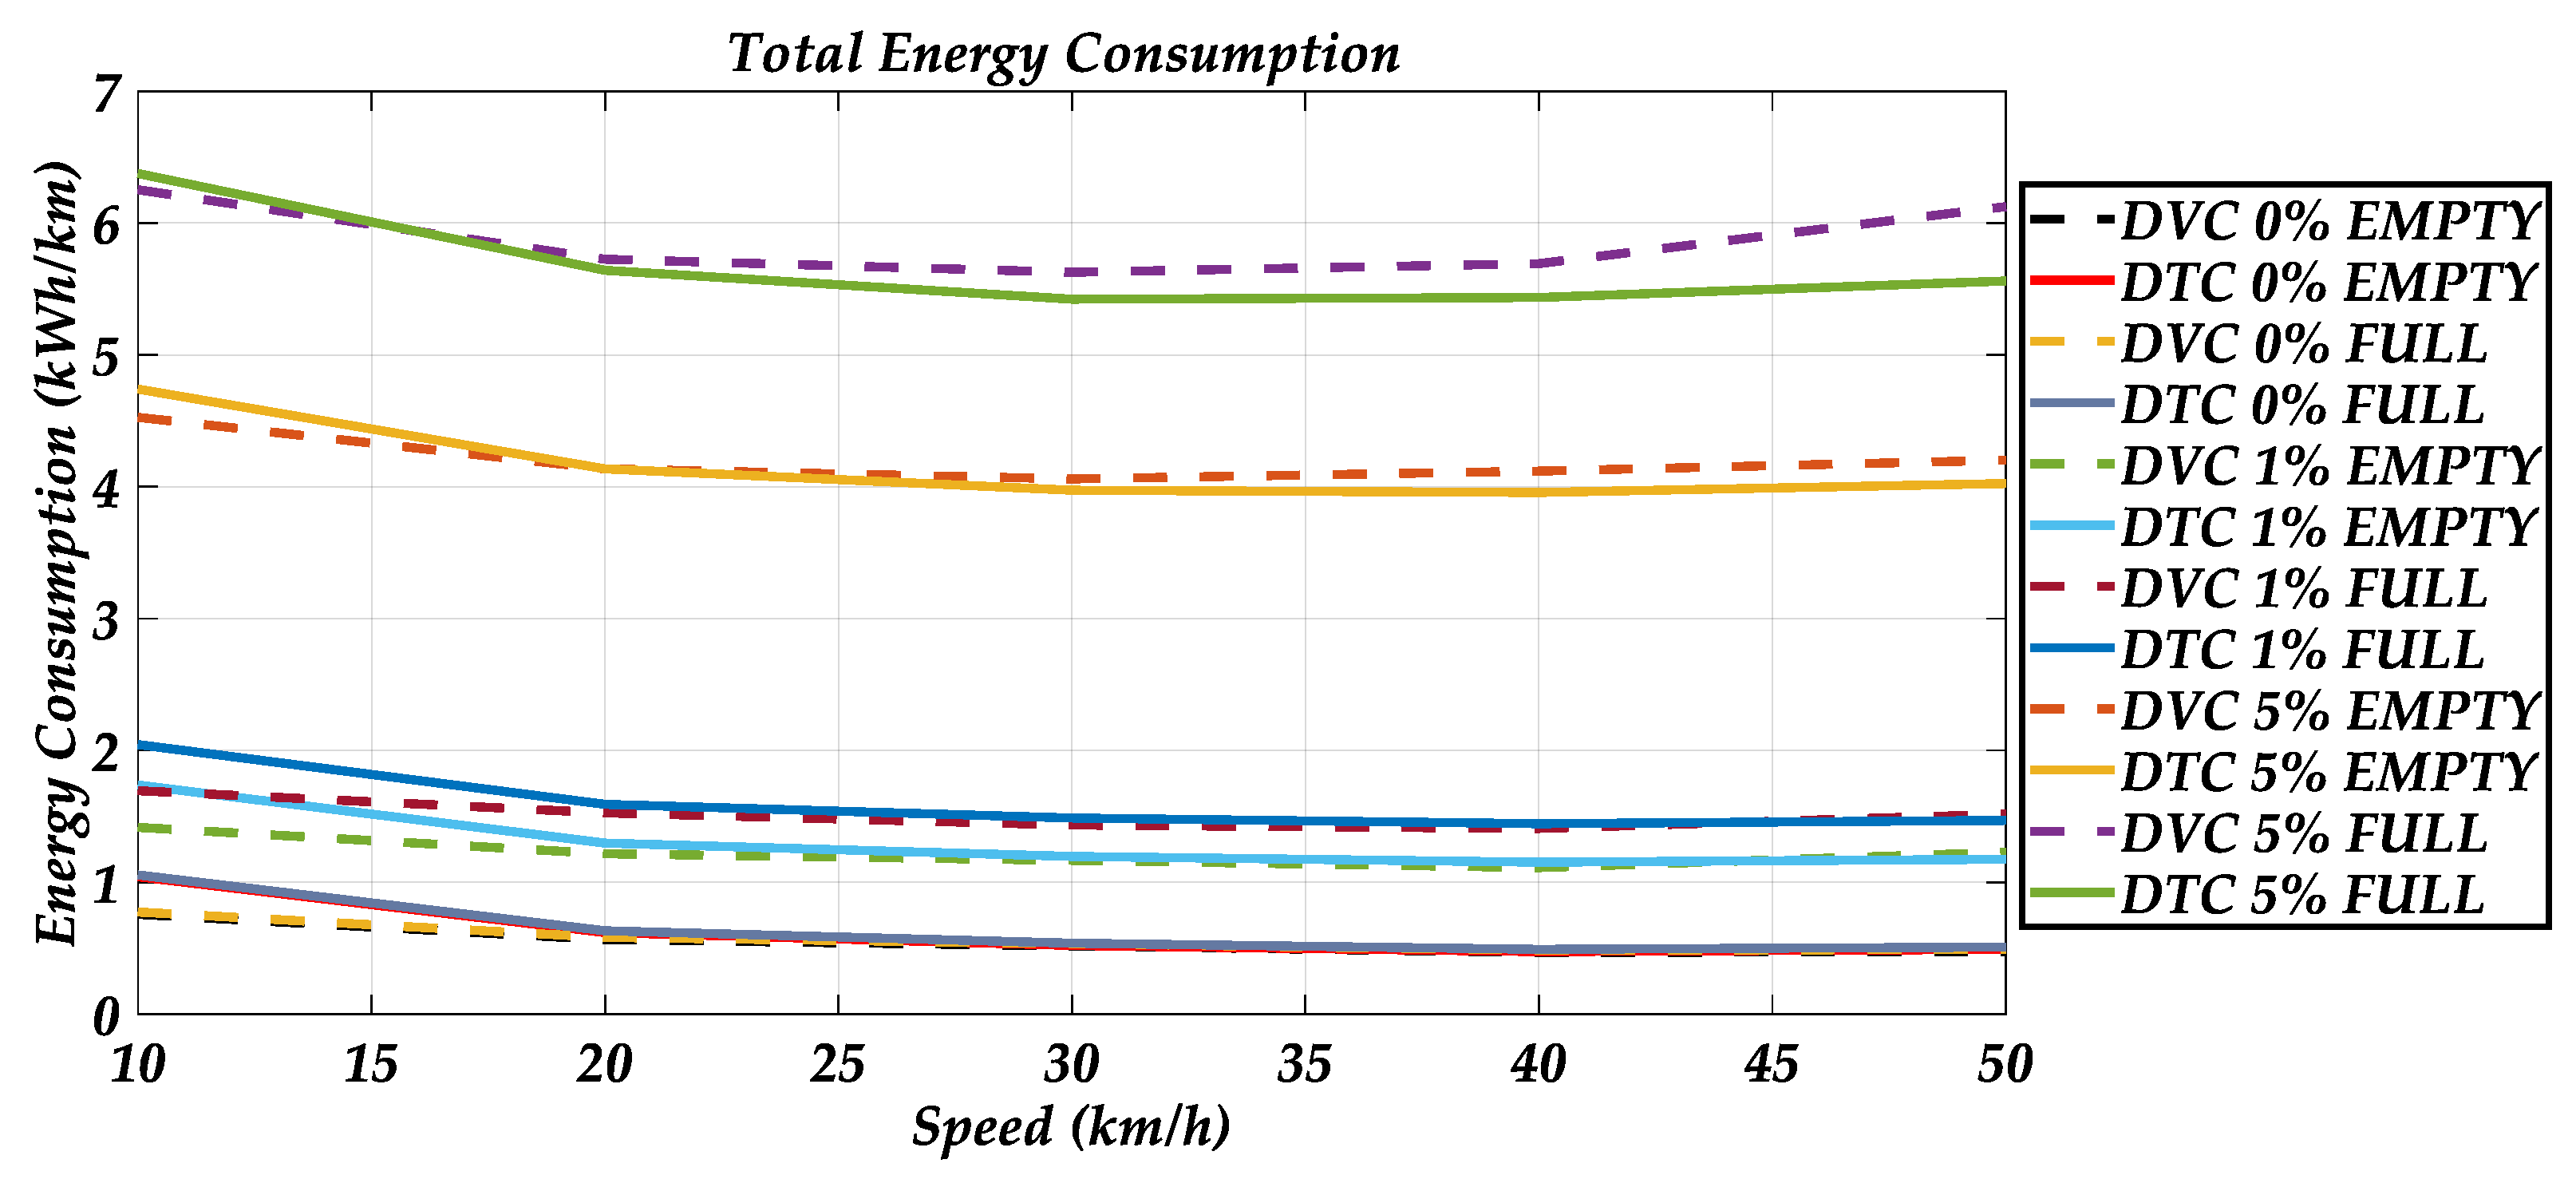
Figure 9 depicts the trolleybus total energy consumption during constant-speed courses, as a function of vehicle speed, in case of maximum (FULL) and minimum (EMPTY) passenger load, assuming 0%, 1%, and 5% road inclination; both DVC and DTC schemes are considered. As derived from Figure 9, in all examined cases, energy consumption is almost the same for DVC and DTC schemes (noted deviations are within the simulation accuracy limits).
An interesting outcome is that, in all cases except the one of DVC on 5% road inclination with maximum passenger load (FULL), higher energy consumption is observed at low speeds. This could be explained by the fact that at low speeds, the machine operates with under high electromagnetic flux values, whereas over nominal speed—that is, 28 km/h—the electromagnetic flux reference value is reduced inversely to speed (field weakening technique). Also, at low speeds, the machine operates with small amplitude modulation ratio compared with that at high speed operation, which leads to machine low power factor and high stator rms current values.
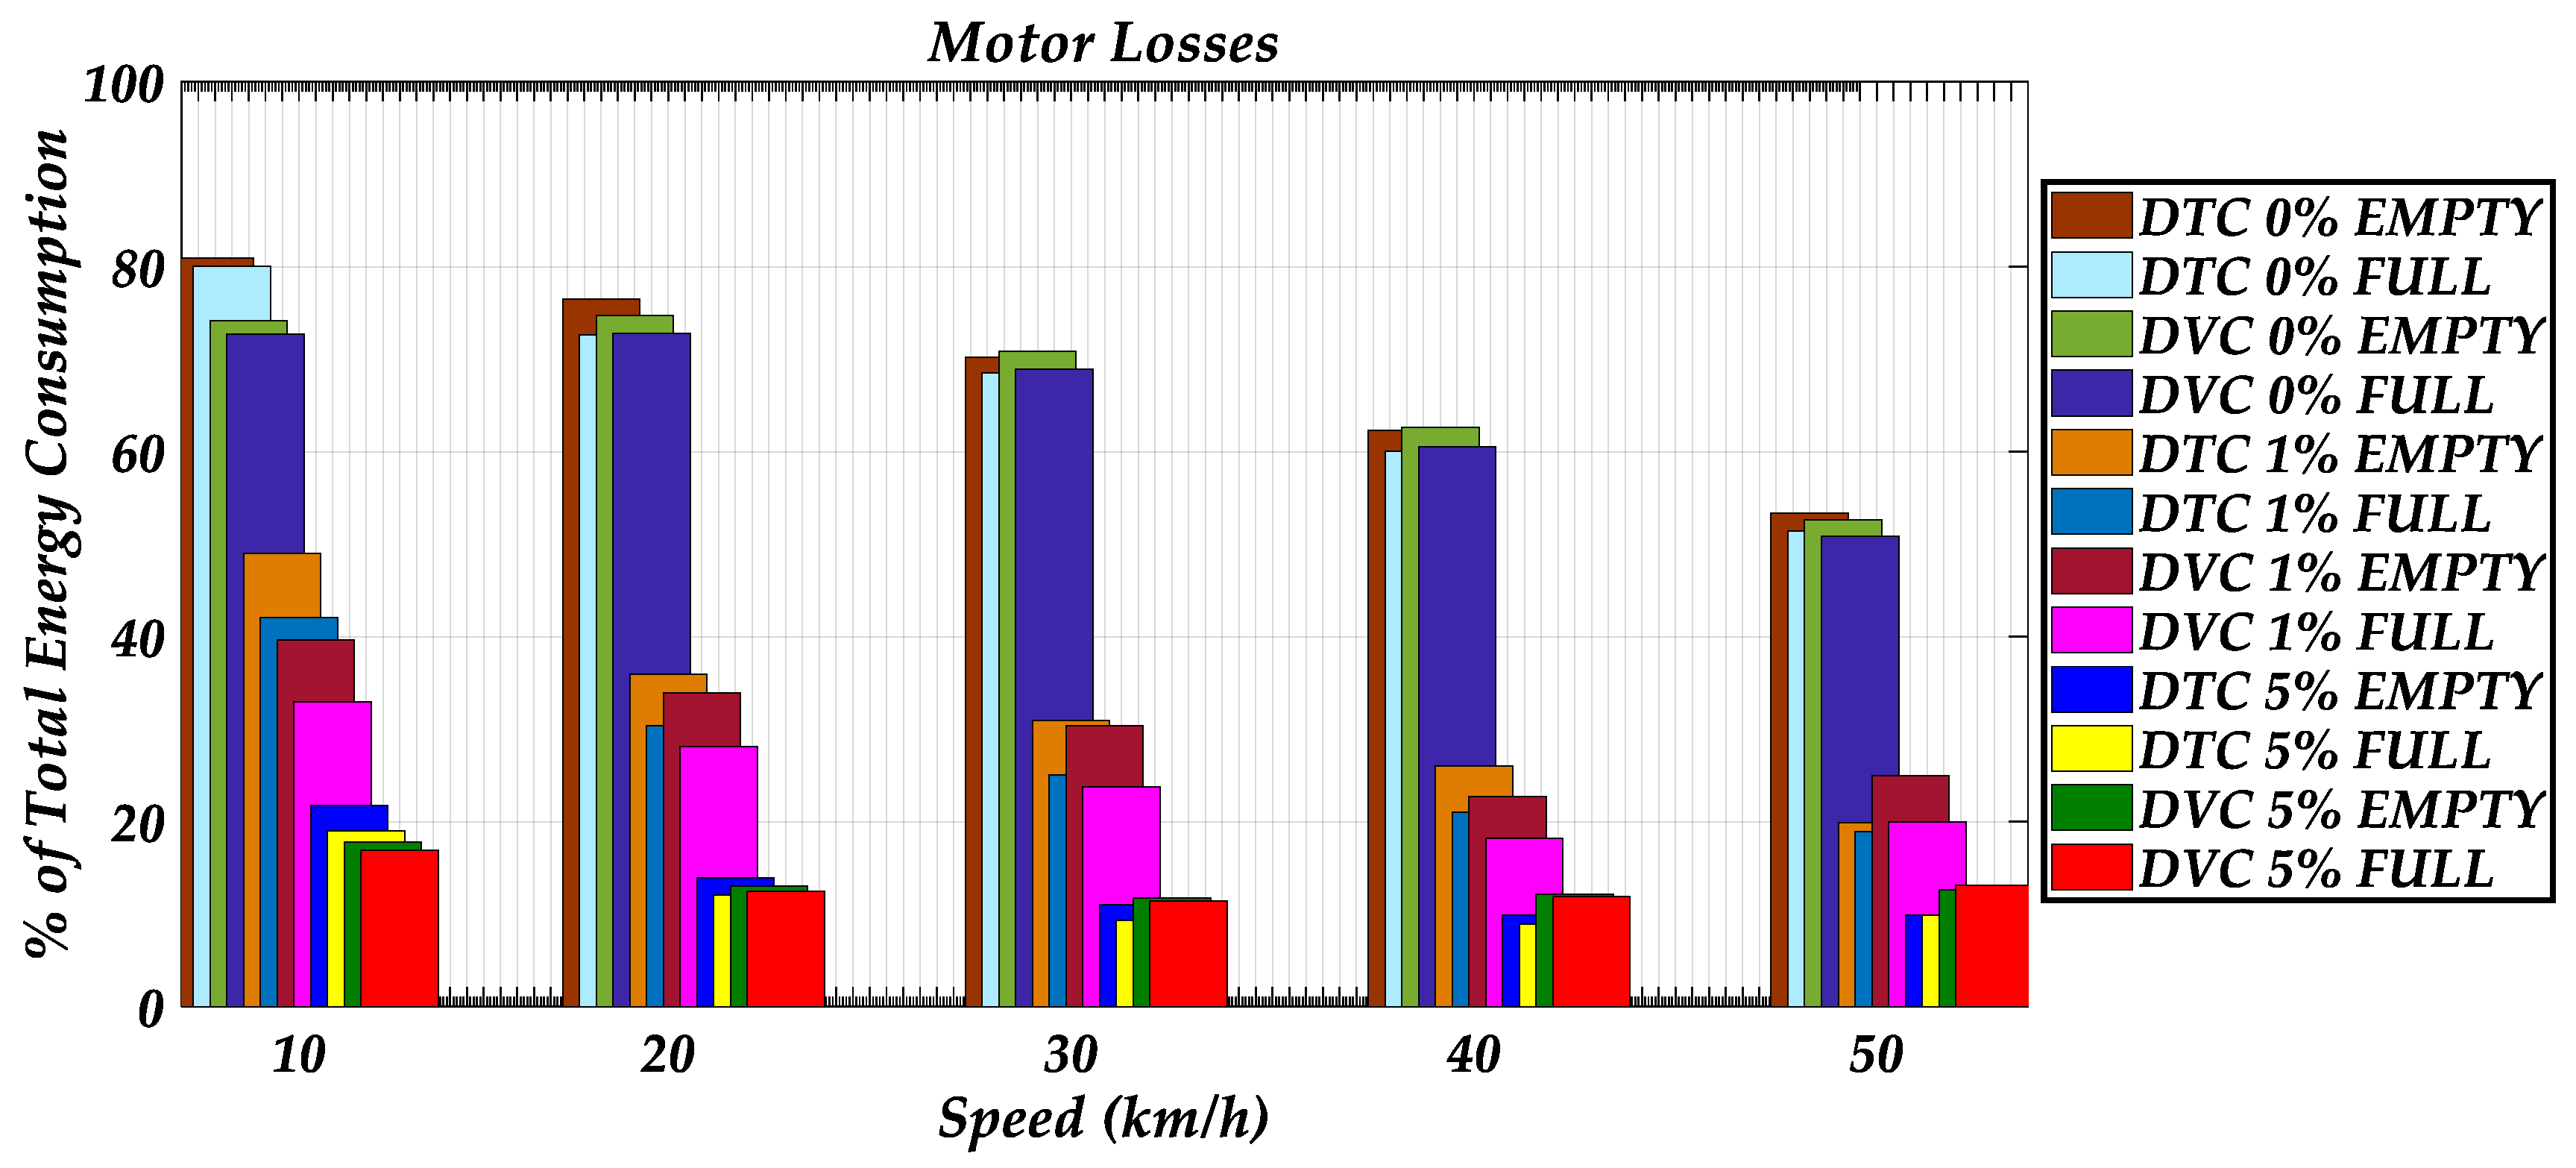
Figure 10, Figure 11 and Figure 12 depict the trolleybus total energy consumption allocation, according to Figure 7, in case of maximum (FULL) and minimum (EMPTY) passenger loads, 0%, 1%, and 5% road inclination, with DVC and DTC implementation.
In particular, Figure 10 depicts the motor energy consumption as a function of speed, under various operating/control conditions.
From Figure 10, it appears that, in the case of 0% road inclination, motor energy consumption receives the highest portion of the total energy consumption across the speed range. However, in the case of 1% road inclination, this portion is significantly decreased, whereas in case of 5% road inclination, it is drastically restricted.
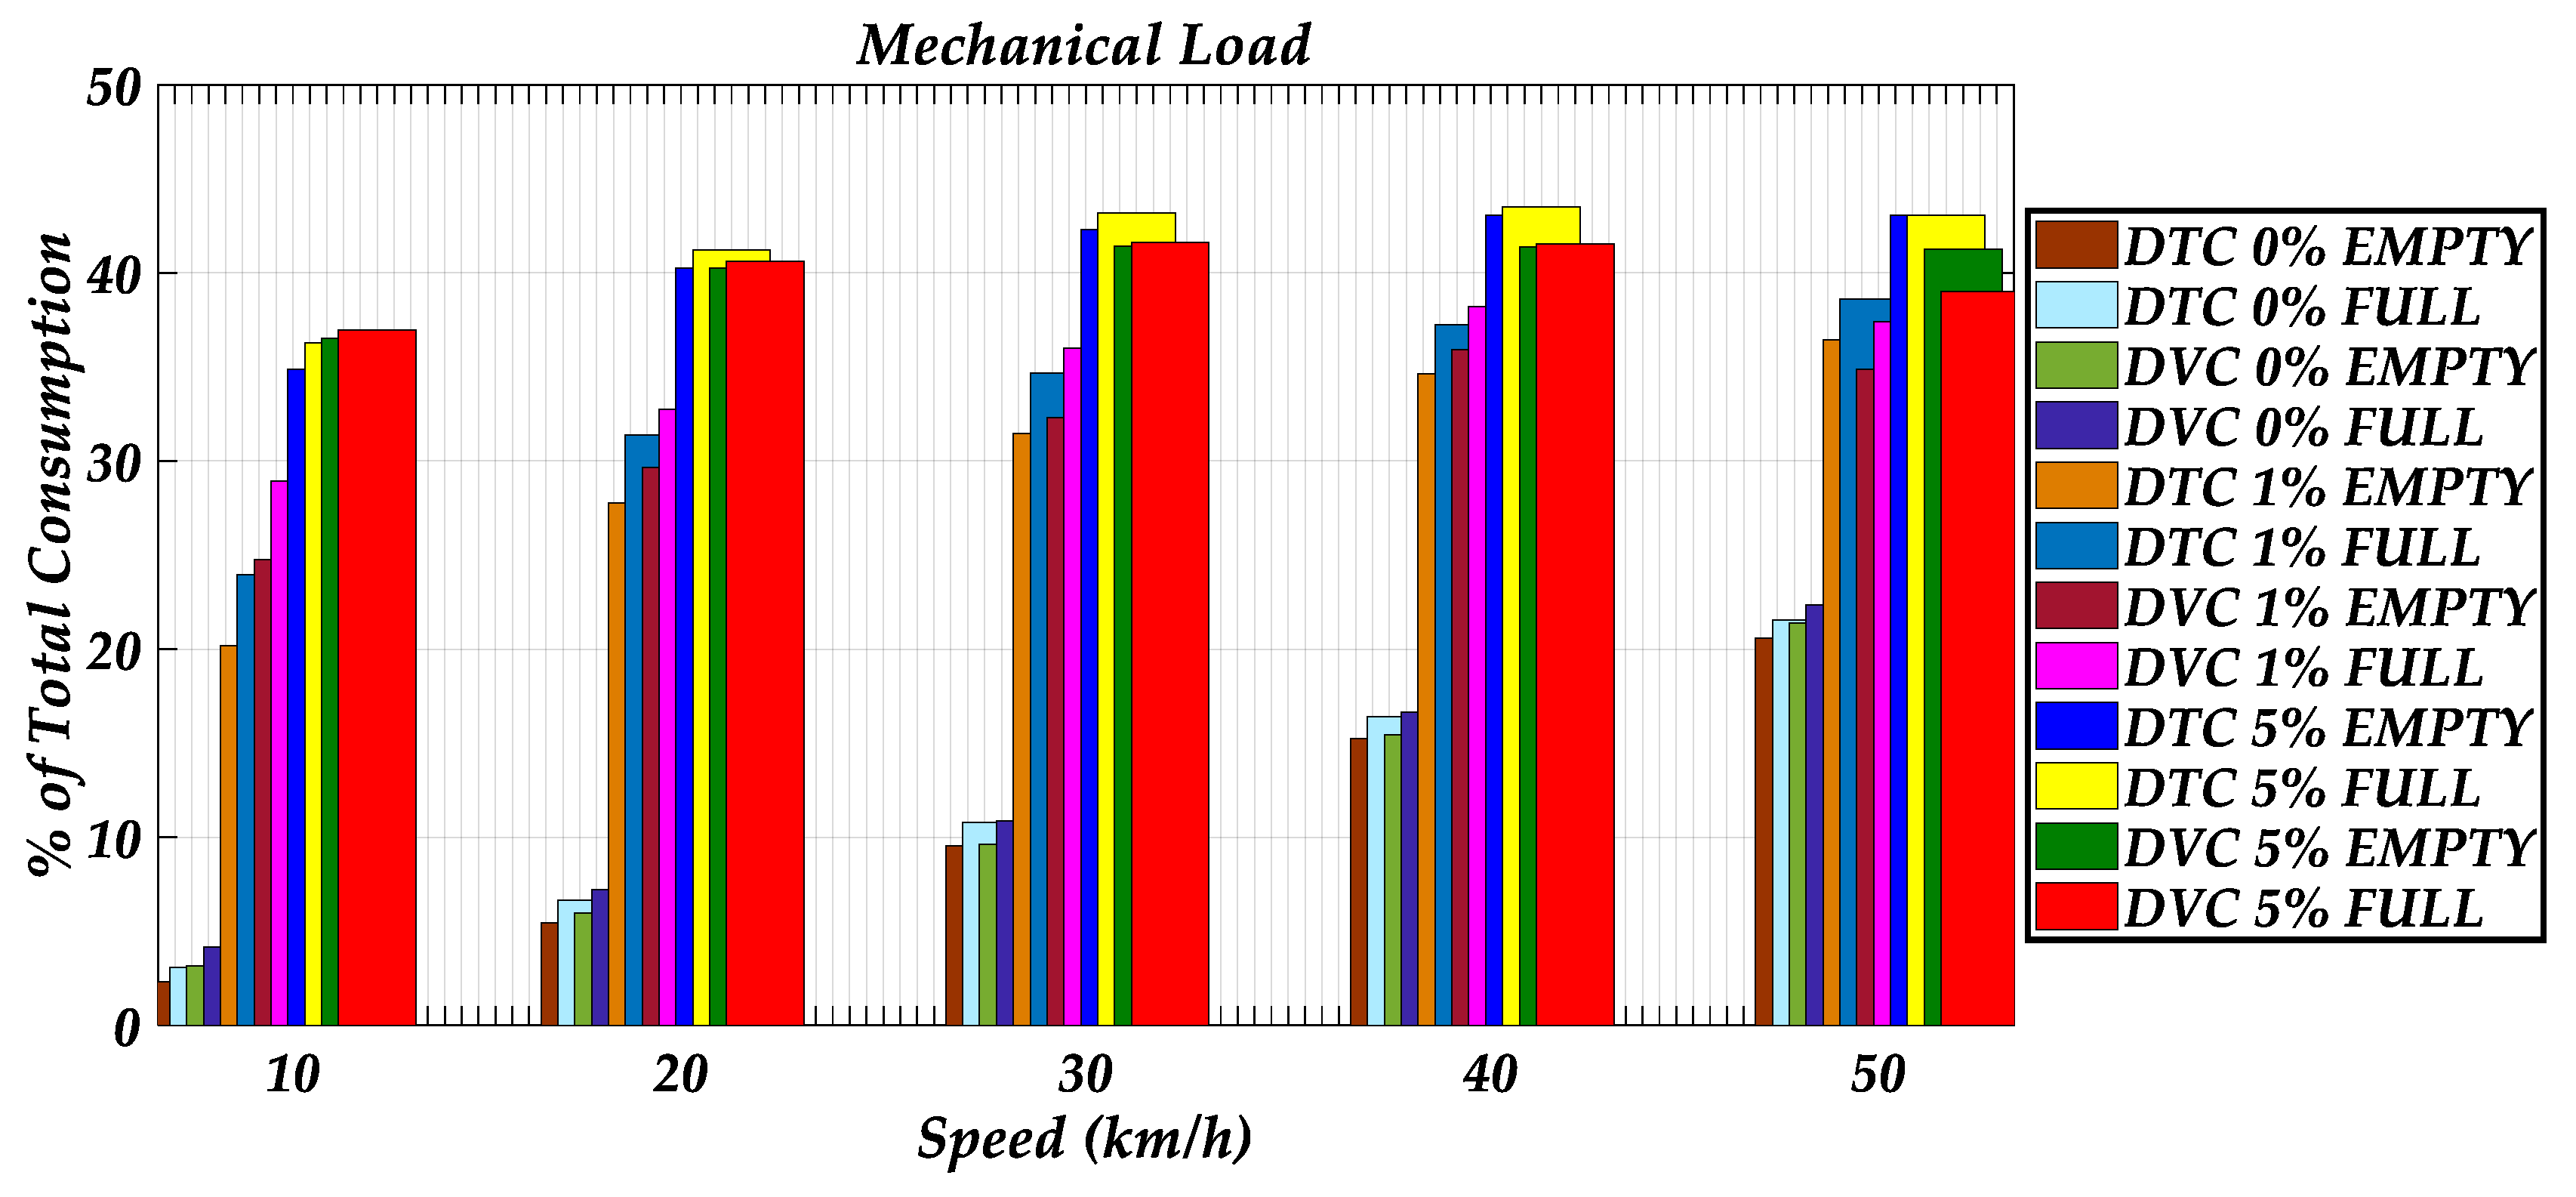
Figure 11 depicts the mechanical–transport–load energy consumption as a function of speed for various operating/control conditions under study.
Figure 11 shows that in the case of 0% road inclination, the mechanical load consumption a receives limited portion of the total energy consumption at low speeds, which increases with speed. In the case of 1% road inclination, this portion increases significantly, whereas in the case of 5% road inclination, the increase becomes significant.
Figure 12 depicts the inverter energy consumption as a function of speed, for various operating/control conditions under study.
Figure 12 shows that the inverter energy consumption receives a limited portion of the total energy consumption across the speed range, which is drastically decreased with road inclination. In addition, it decreases moderately with speed rise.
Figure 10, Figure 11 and Figure 12 suggest that the allocation of individual system losses is mainly affected by road inclination—which is the main parameter of total transport load increase—while trolleybus passenger load has limited effects on it. Also, it is noted that in all cases, line losses receive a low, almost constant (under 2%) portion of total energy consumption.
4.3. Energy Consumption Estimations—Acceleration
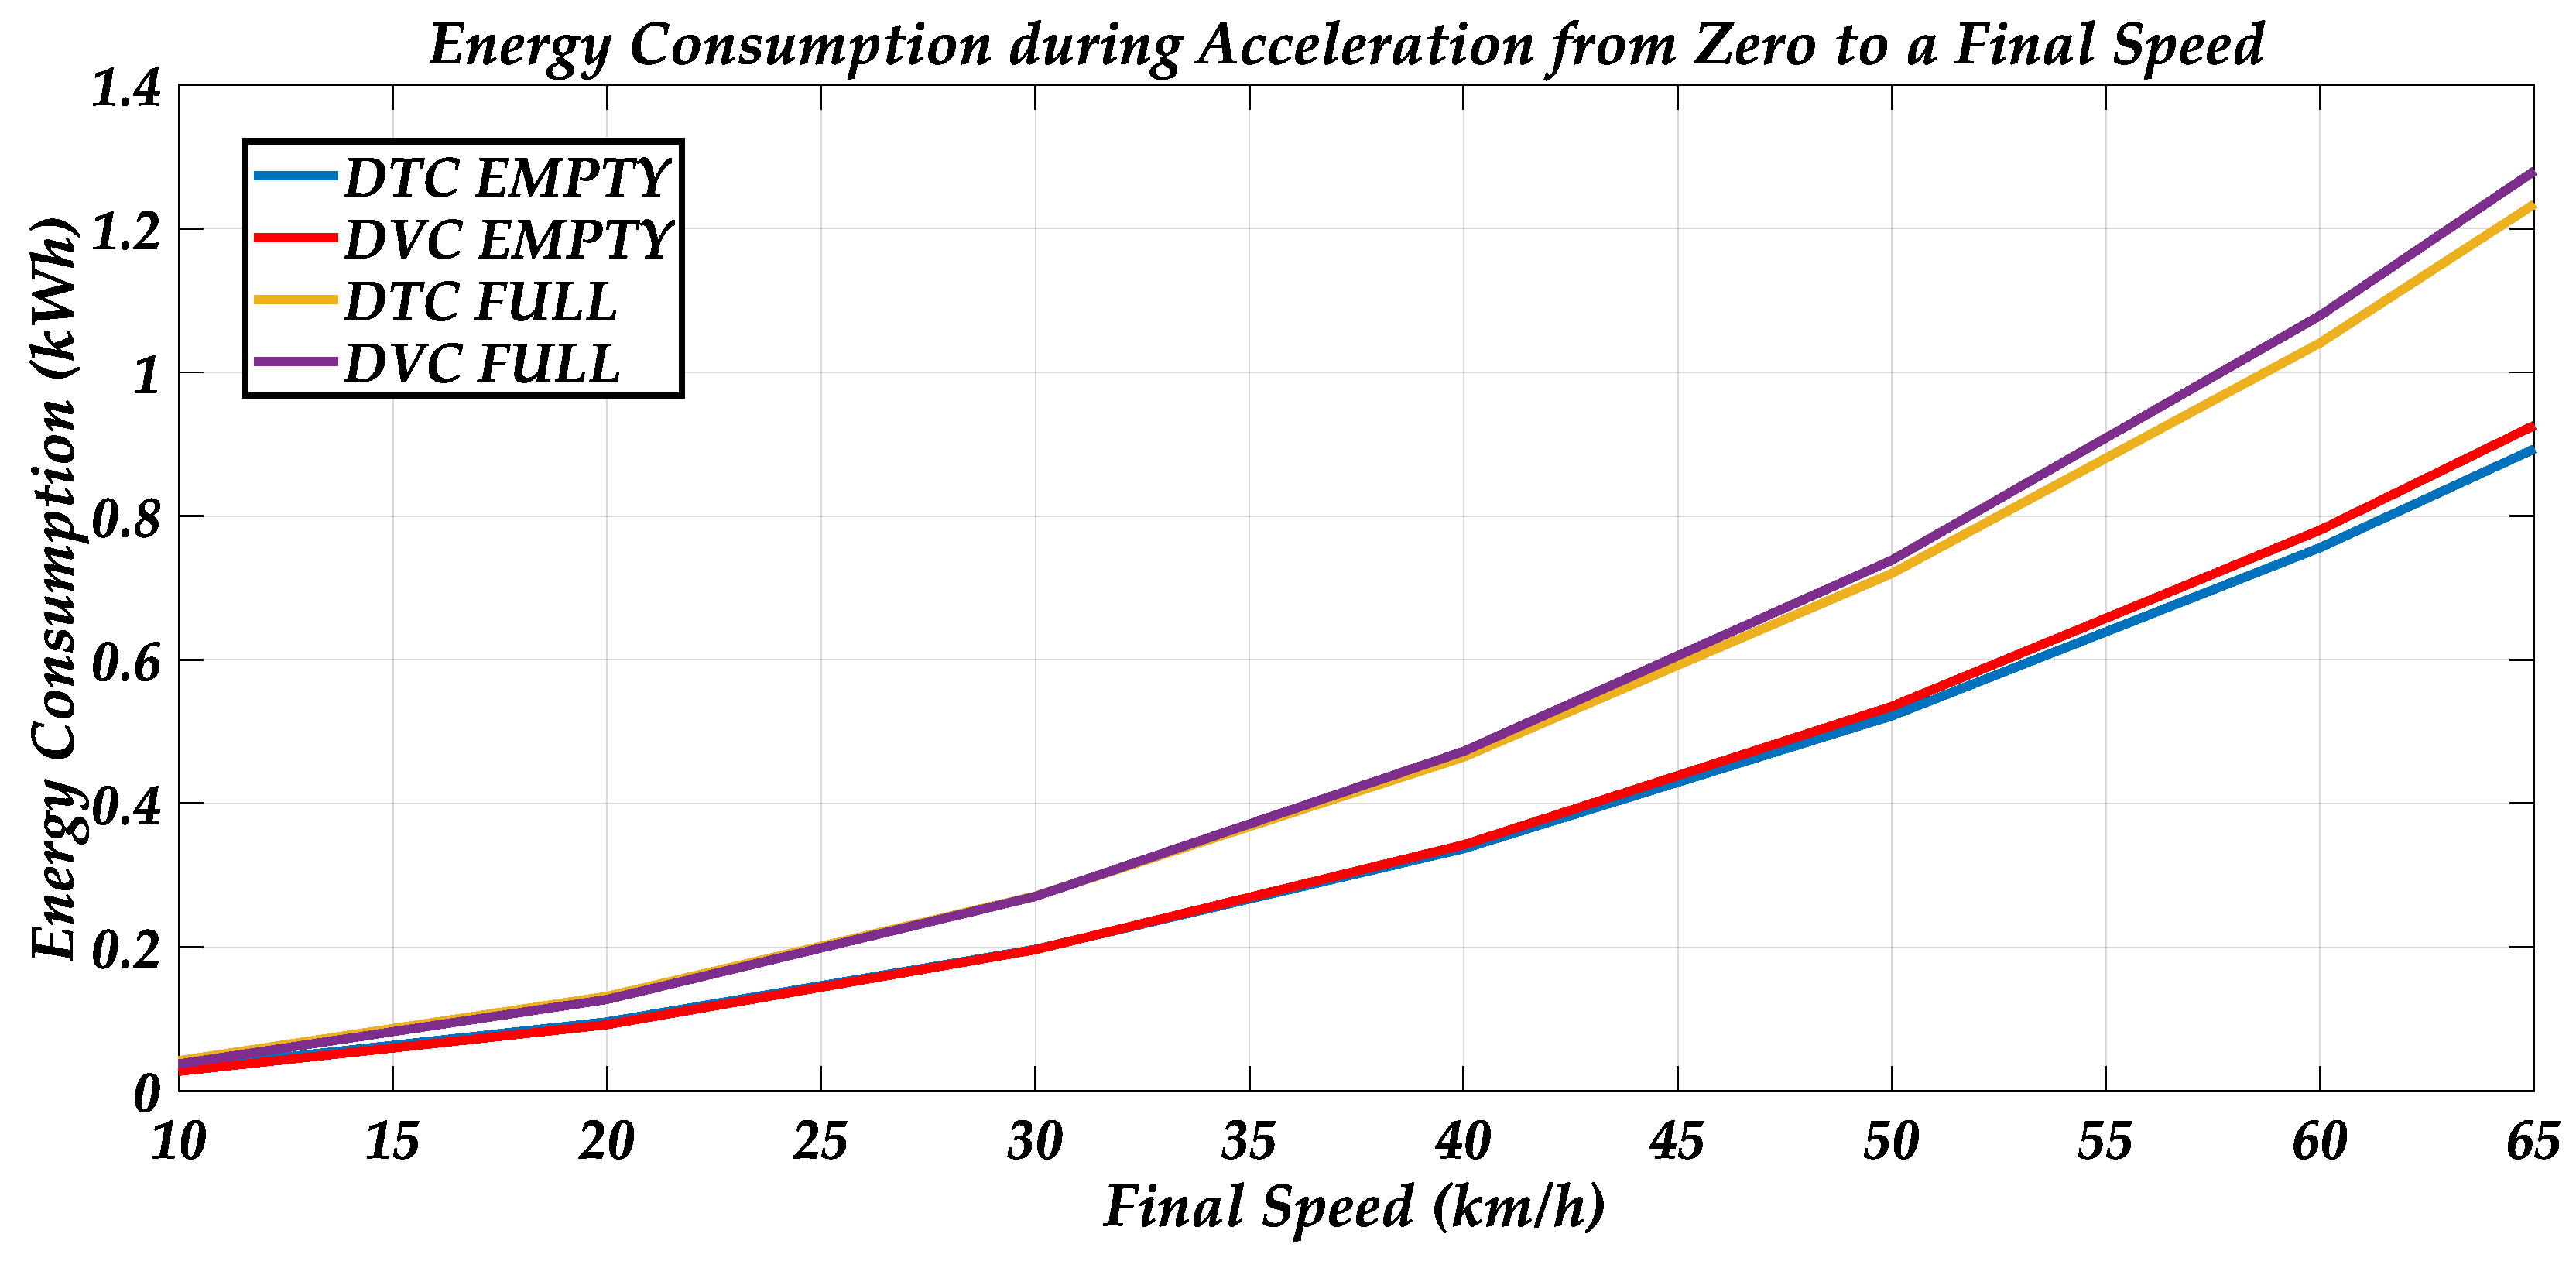
Figure 13 depicts the trolleybus total energy consumption during acceleration from zero to different speeds, as a function of vehicle speed, on 0% road inclination, in the case of maximum (FULL) and minimum (EMPTY) passenger load, with DVC and DTC implementation.
Figure 13 suggests that during acceleration from zero to final speed, lower total consumption is observed with DTC.
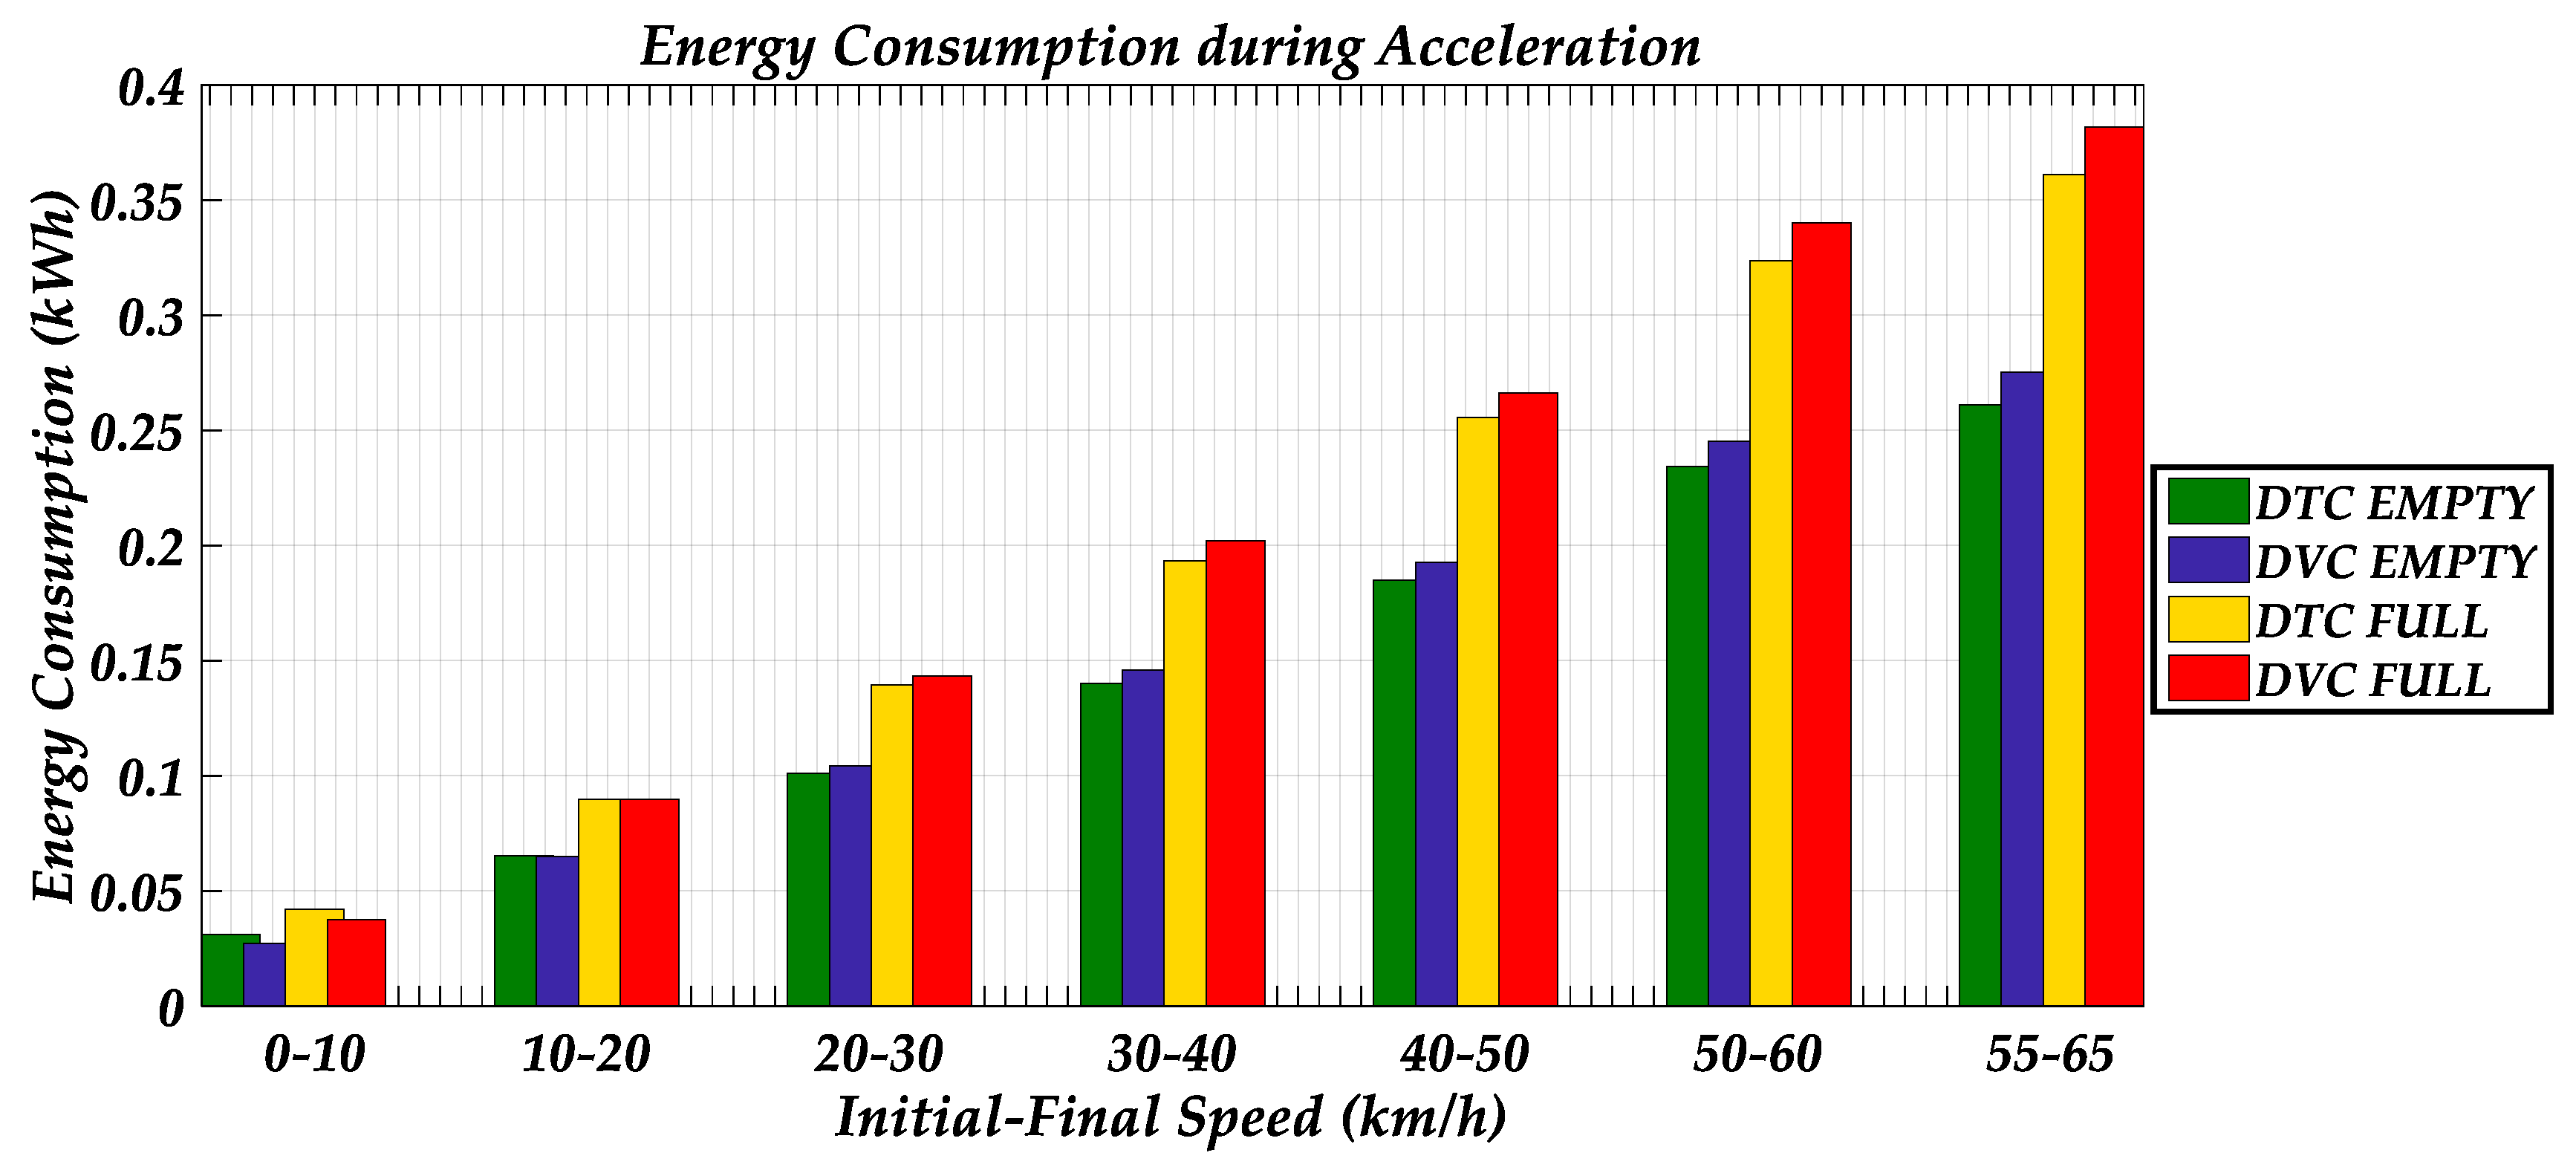
Figure 14 depicts the trolleybus total energy consumption during acceleration at intermediate speeds, on 0% road inclination, in case of maximum (FULL) and minimum (EMPTY) passenger load, with DVC and DTC implementation.
From Figure 14, it seems that during acceleration intervals from an initial to a final speed, lower total consumption is observed with DTC, whereas the lower the machine slip in DVC, the lower the total energy consumption becomes.
All cases of acceleration under study suggest that, in the specific machine operation point (that is, 1708.1 Nm), DTC proves more effective, contrary to DVC. This is due to the fact that DTC is more efficient at high-torque transient operating conditions [14].
4.4. Energy Recovery Estimations—Deceleration
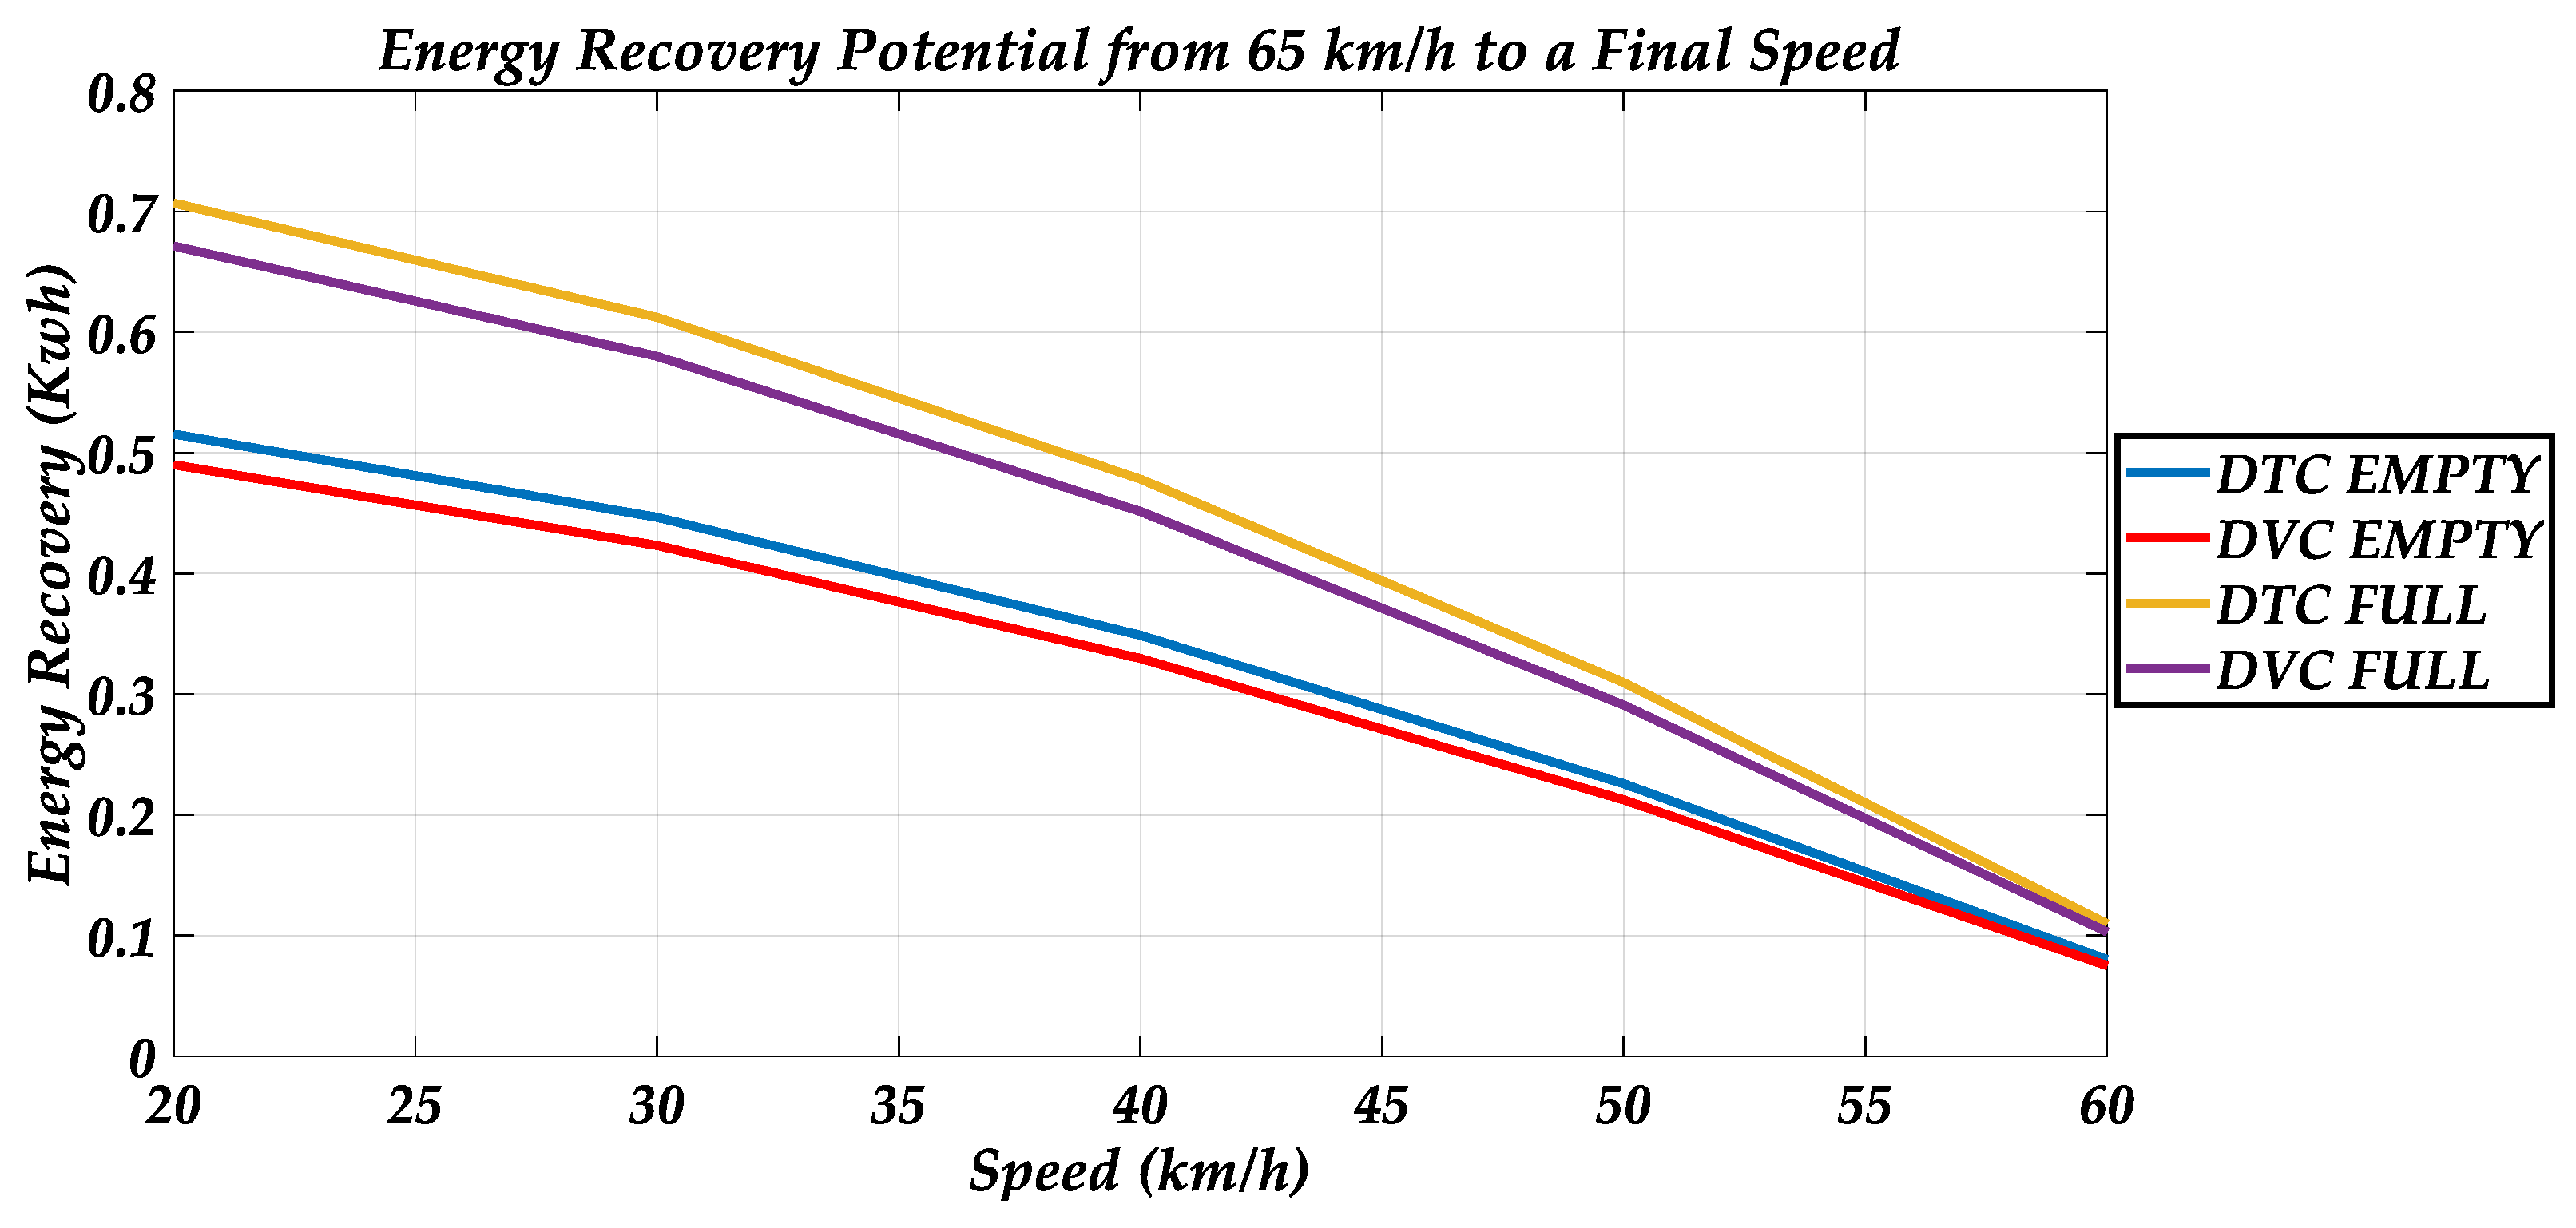
Figure 15 depicts the energy recovery potential during deceleration from 65 km/h to a final vehicle speed, as a function of vehicle speed, on 0% road inclination, in case of maximum (FULL) and minimum (EMPTY) passenger load, with DVC and DTC implementation.
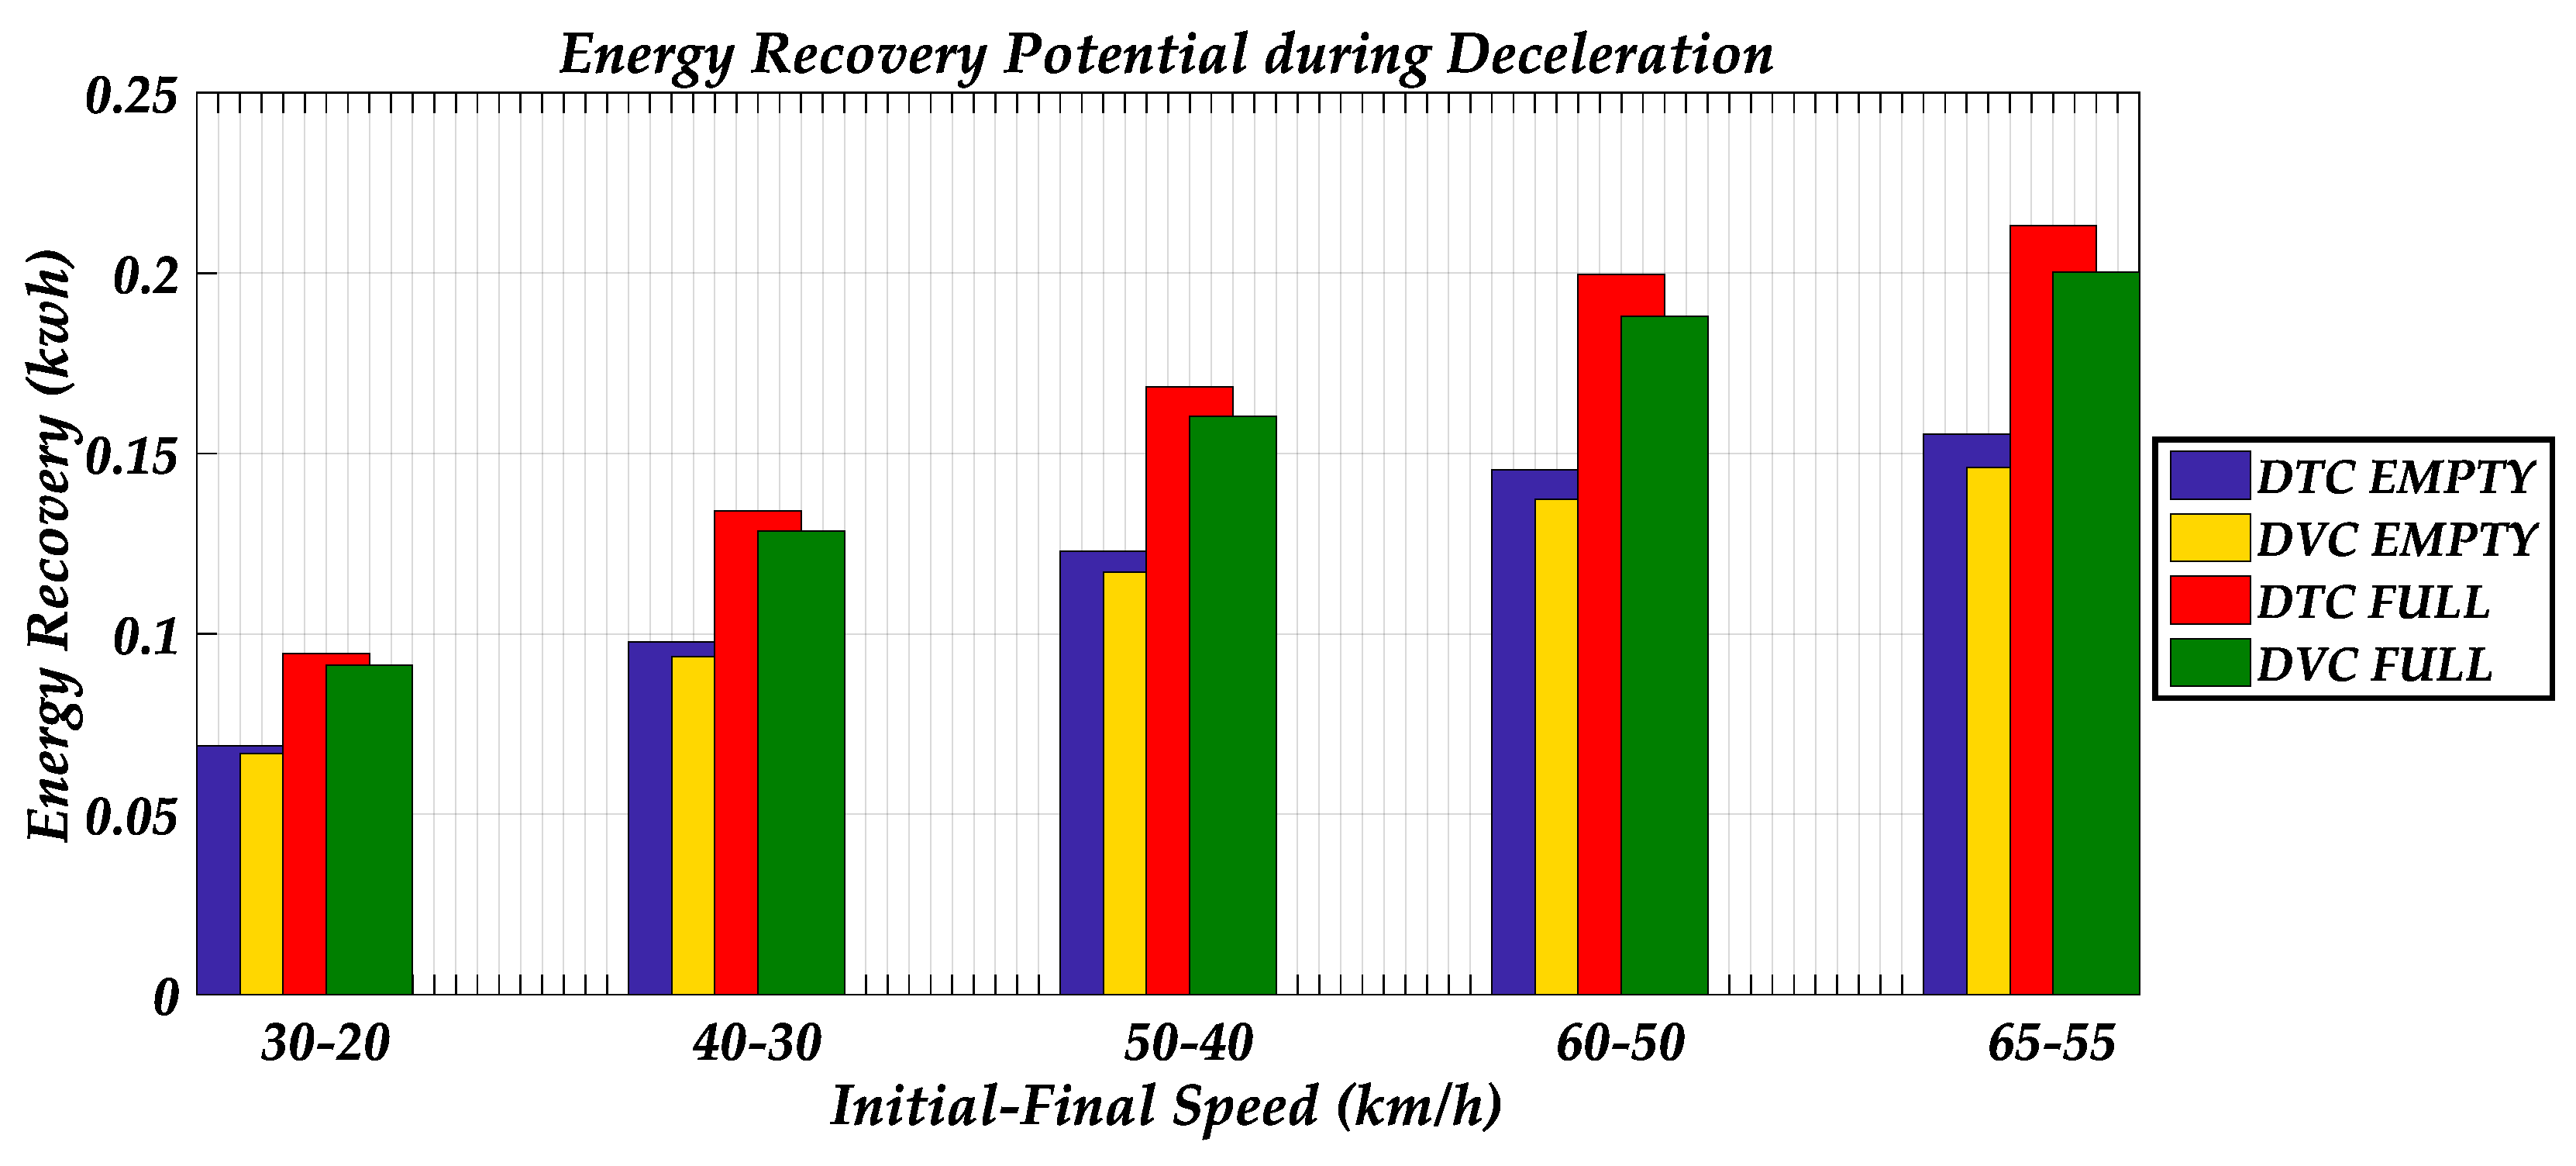
From Figure 15, it seems that during deceleration from 65 km/h to final speed, higher energy recovery is observed with DTC. This result indicates that at the maximum deceleration working point (that is, −1480.6 Nm), DTC is proven to be more efficient than DVC. This is in agreement with the results in Section 4.3, where high-torque transient conditions are also present. Moreover, Figure 16 depicts the energy recovery potential during deceleration from an initial to a final speed, on 0% road inclination, in case of maximum (FULL) and minimum (EMPTY) passenger load, with DVC and DTC implementation.
Similar to Section 4.3 and Section 4.4, higher energy recovery is observed with DTC during deceleration at intermediate speeds. Moreover, the higher energy recovery is observed in the region of high speeds, because of the higher kinetic energy of the system.
According to the results in Figure 15 and Figure 16 and the technical data in Table 1, the energy recovery efficiency in all cases of speed reduction ranges from roughly 66% to 73%. These results are in accordance with results found in literature regarding energy recovery efficiency of public means of electrical transportation (trains and metros) [24,25,26], which reinforces the reliability of the proposed modeling.
4.5. Energy Recovery Estimations—Downhill
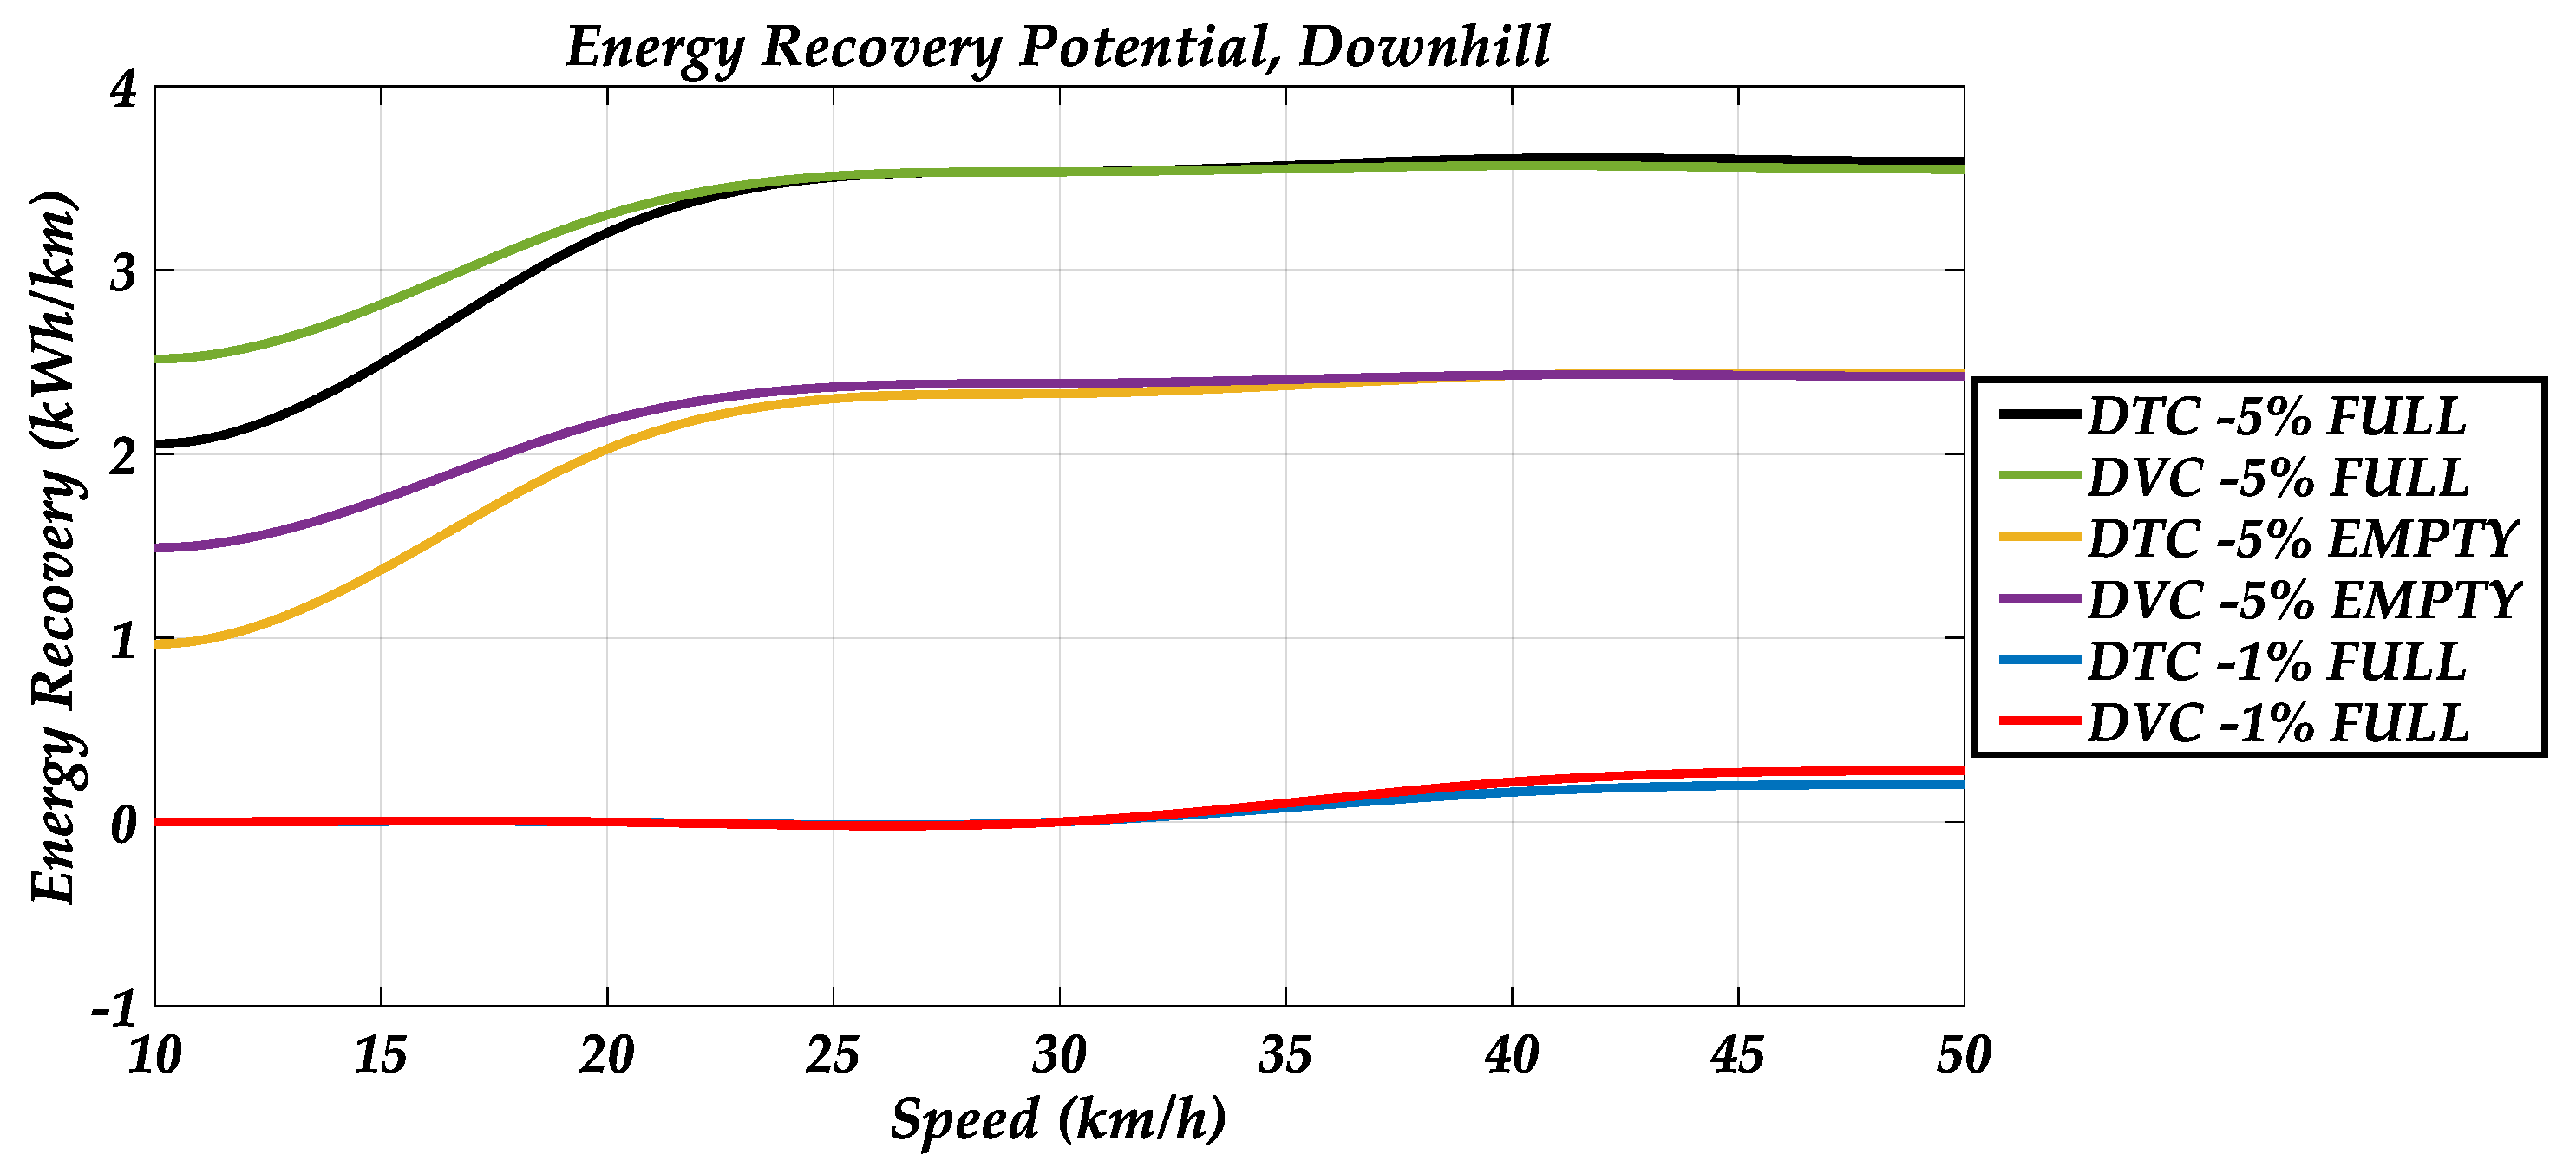
Figure 17 depicts the energy recovery potential as a function of vehicle speed, in the case of maximum (FULL) and minimum (EMPTY) passenger load, during constant speed course on road with −1% and −5% road inclination, with DVC and DTC implementation.
It is noted that the energy recovery for the empty trolleybus course on a downhill slope of −1% is negligible, thus this case is not mentioned in Figure 17.
Figure 17 suggests that, during downhill courses, in the case of −1% road inclination, higher energy recovery is observed with DVC. However, in the case of −5% road inclination, over 30–35 km/h, higher energy recovery is observed with DTC. Those results are also justified by the corresponding torque conditions. Once more, passenger load has insignificant effect on trolleybus energy behavior.
4.6. Energy Consumption/Recovery Overall Conclusions
In summary, the most important conclusions drawn from the energy consumption estimations are the following:
- In constant-speed courses, energy consumption is significantly increased by increasing road inclination, whereas the increase in the trolleybus passenger load, for the same road inclination, has limited effects. Also, the greater the downhill inclination, the greater the regenerated energy amount.
- Correspondingly, the energy consumption allocation (see Figure 7) is significantly influenced by road inclination, whereas the trolleybus passenger load has limited effects on it. Also, it appears that as speed increases and load torque approaches the machine nominal value (1355 Nm), the electrical losses of the machine become less relative to the mechanical ones. Therefore, the system performance is higher in this operating range.
- During constant speed courses, in the case of zero road inclination, the system mechanical load (for both empty and full trolleybus) ranges from about 10 Nm (0.66% of the nominal torque value) to 40 Nm (3% of the nominal load). These values are much lower than the machine nominal torque value (1355 Nm). In the case of 1% road inclination, the machine mechanical load ranges from about 130 Nm (9.6% of the nominal torque value) to 212 Nm (15.6% of the nominal torque value), whereas for 5% road inclination, the machine load ranges from about 619 Nm (45.62% of the nominal torque value) to 895 Nm (65.97% of the nominal torque value). This wide load torque deviation justifies the fact that DVC and DTC are more effective under different operating conditions.
- During deceleration at intermediate speeds, a greater amount of energy recovery is achieved in the area of higher initial speeds (i.e., 40, 50, 60 km/h), as a result of the higher kinetic energy of the electromechanical system.
- For constant-speed courses at low speeds (i.e., at 10 km/h), trolleybus consumption is greater than the energy consumption at higher speeds. This is due to the high electromagnetic flux and the small amplitude modulation ratio of the inverter.
- During accelerations with the maximum permitted rate—it corresponds to a torque equal to 125% of the machine nominal torque value—DTC seems to outperform DVC in terms of energy consumption (as it has been already discussed).
- Similarly, during decelerations with the maximum permitted rate—it corresponds to a braking torque equal to −109% of the machine nominal torque value—DTC seems to outperform DVC in terms of the brake energy recovery amount.
- Finally, it appears that there is a possibility of recovering a significant amount of energy both during decelerations of the trolleybus, as well as during its downhill courses. In the latter case, the energy recovery is higher than in the first one. However, the first case is more frequent on actual trolleybus runs.
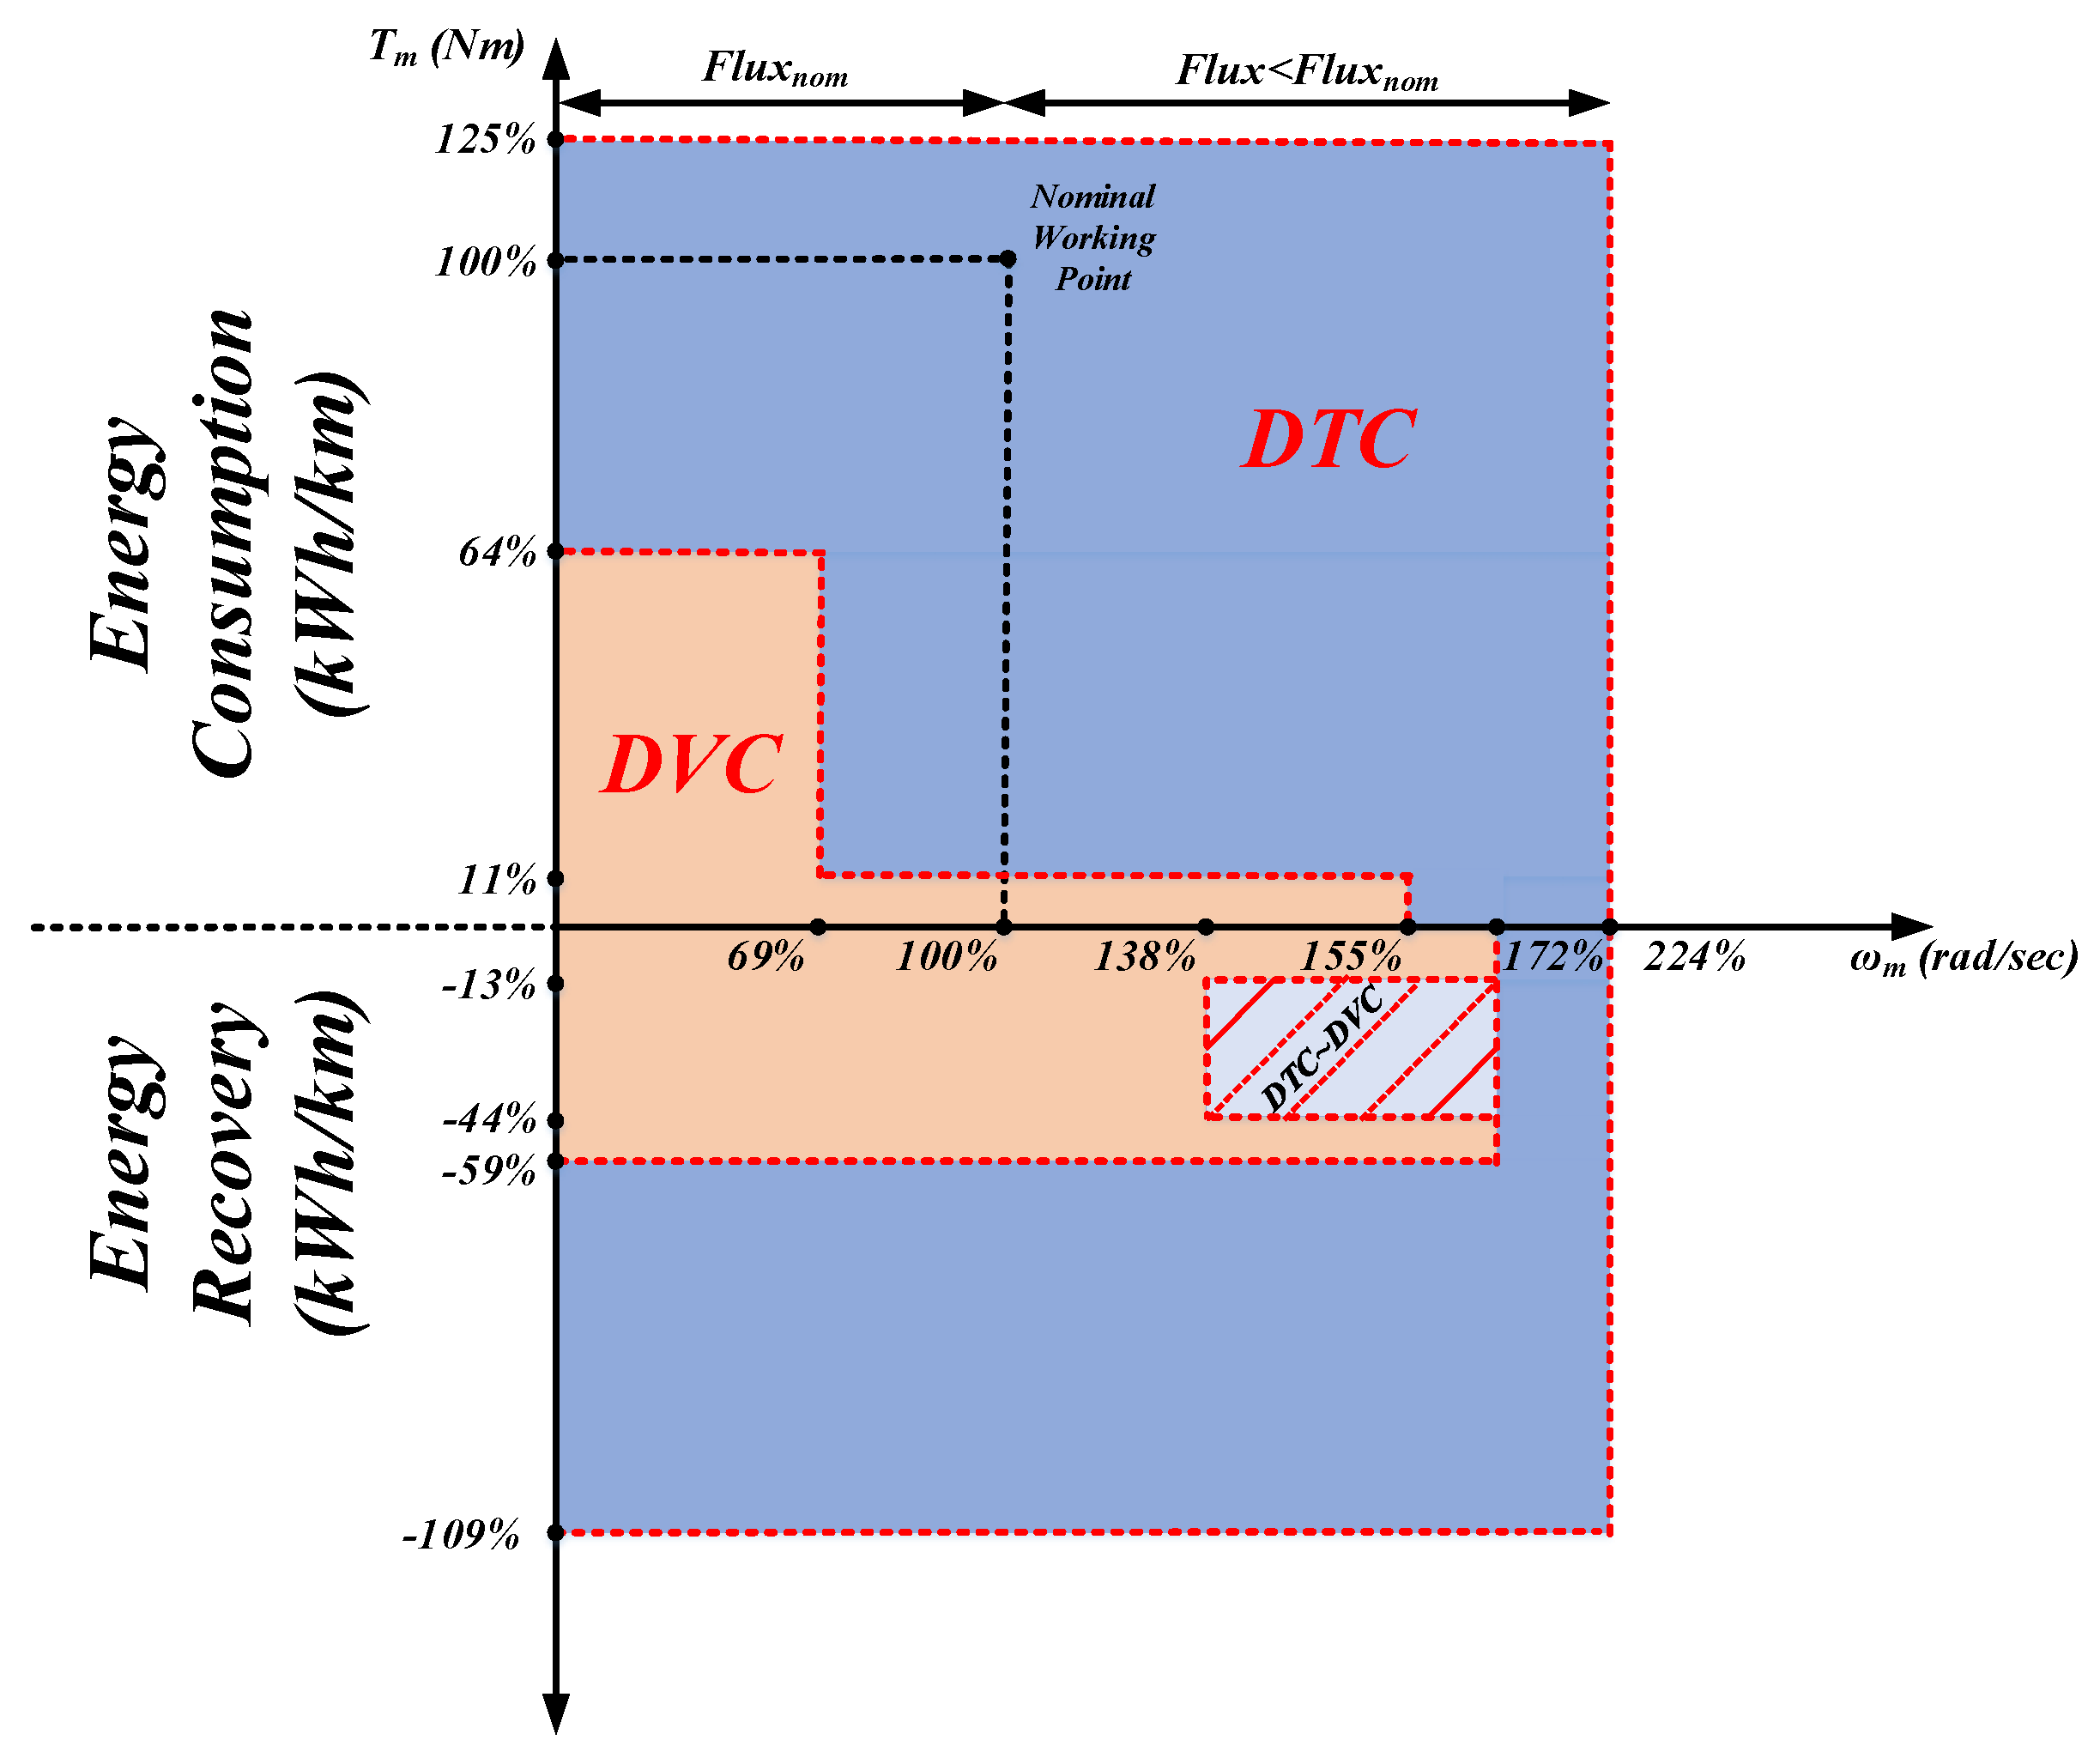
These results suggest that each driving method (DVC and DTC) is more efficient—from an energy consumption point of view—at different machine operating points, for the given control parameters (DVC error controller gains, DTC hysteresis loop bands). Considering the energy consumption estimations, it seems that a diagram of machine working points (as a combination of machine speed and torque values) can be defined, for the various trolleybus drive scenarios under study. In this context, Figure 18 depicts the machine operating range map, where the area of DTC outperformance (lower energy consumption) is marked in blue color, whereas the pink colored area stands for the DVC outperformance. In the hatched area, the performance of these two driving methods is almost the same.
Last, but not least, the optimum operating mode map in Figure 18 can be exploited by the owner company of the trolleybuses in a future upgrade of the driving scheme.
5. Energy Consumption/Saving Potential Estimations for a Typical Trolley Course
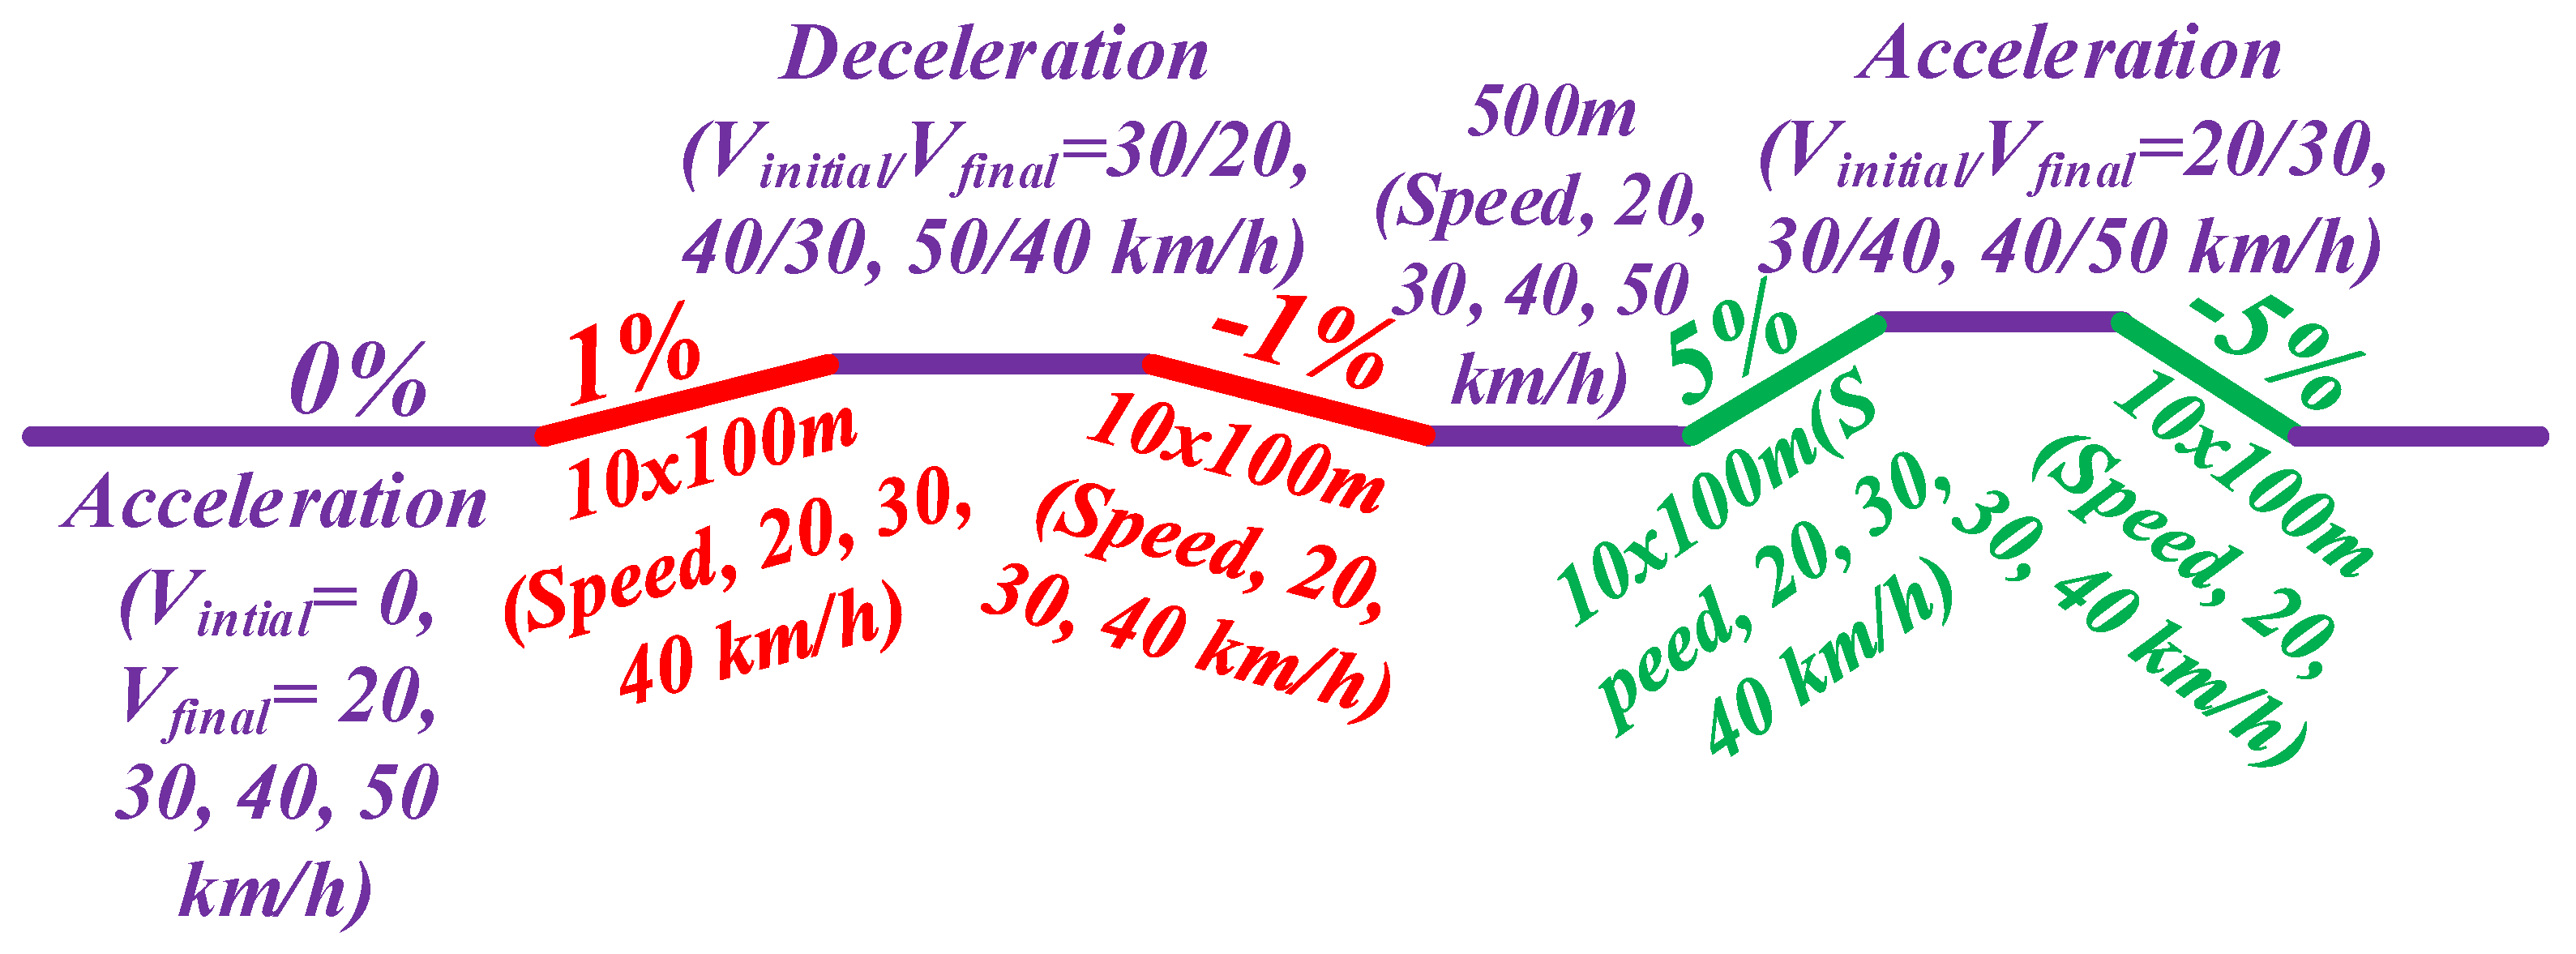
Considering the developed energy consumption profile (based on exhaustive simulations) of the trolleybus, we may proceed with calculations regarding the total energy consumption of the vehicle and the corresponding energy recovery potential for a typical course scenario, including all the previously-mentioned road/travelling conditions. Figure 19 depicts the course under study.
The travelling conditions of the course in Figure 19 are listed in Table 2. According to Figure 19 and Table 2, the total distance of the course is 14 km. In addition, Table 1 includes two additional scenarios of the route described in Figure 19.
Table 3 summarizes the energy consumption results for those three alternative scenarios, as well as the energy recovery potential as a percentage of the consumed energy.
As shown in Table 3, energy consumption with the implementation of DTC, in both traffic cases, is slightly lower, whereas the energy recovery potential as a percentage of energy consumption is slightly higher, compared with DVC. However, the deviation of the results is small.
In Scenario 2, where high road inclinations (5%, −5%) are omitted, energy consumption appears to be significantly lower than in Scenario 1 and the percentage of the energy recovery potential is higher. In addition, it appears that energy consumption in both scenarios is not particularly affected by the driving method.
In Scenario 3, where road inclinations are completely omitted, it appears that in both traffic conditions, with DTC implementation, energy consumption is slightly lower and the percentage of the energy recovery potential is higher. Compared with Scenarios 1 and 2, energy consumption in Scenario 3 is lower (as there are no road inclinations).
Considering the results of energy consumption/saving potential calculations in Table 2, it seems that a significant percentage of the braking energy can be recovered, that is, up to 24% of daily energy consumption (particularly under heavy traffic conditions, where the number of decelerations increases significantly). These outcomes are in line with results regarding regenerative energy savings found in literature [27,28,29].
6. Proposed Hybrid Energy Storage Apparatus
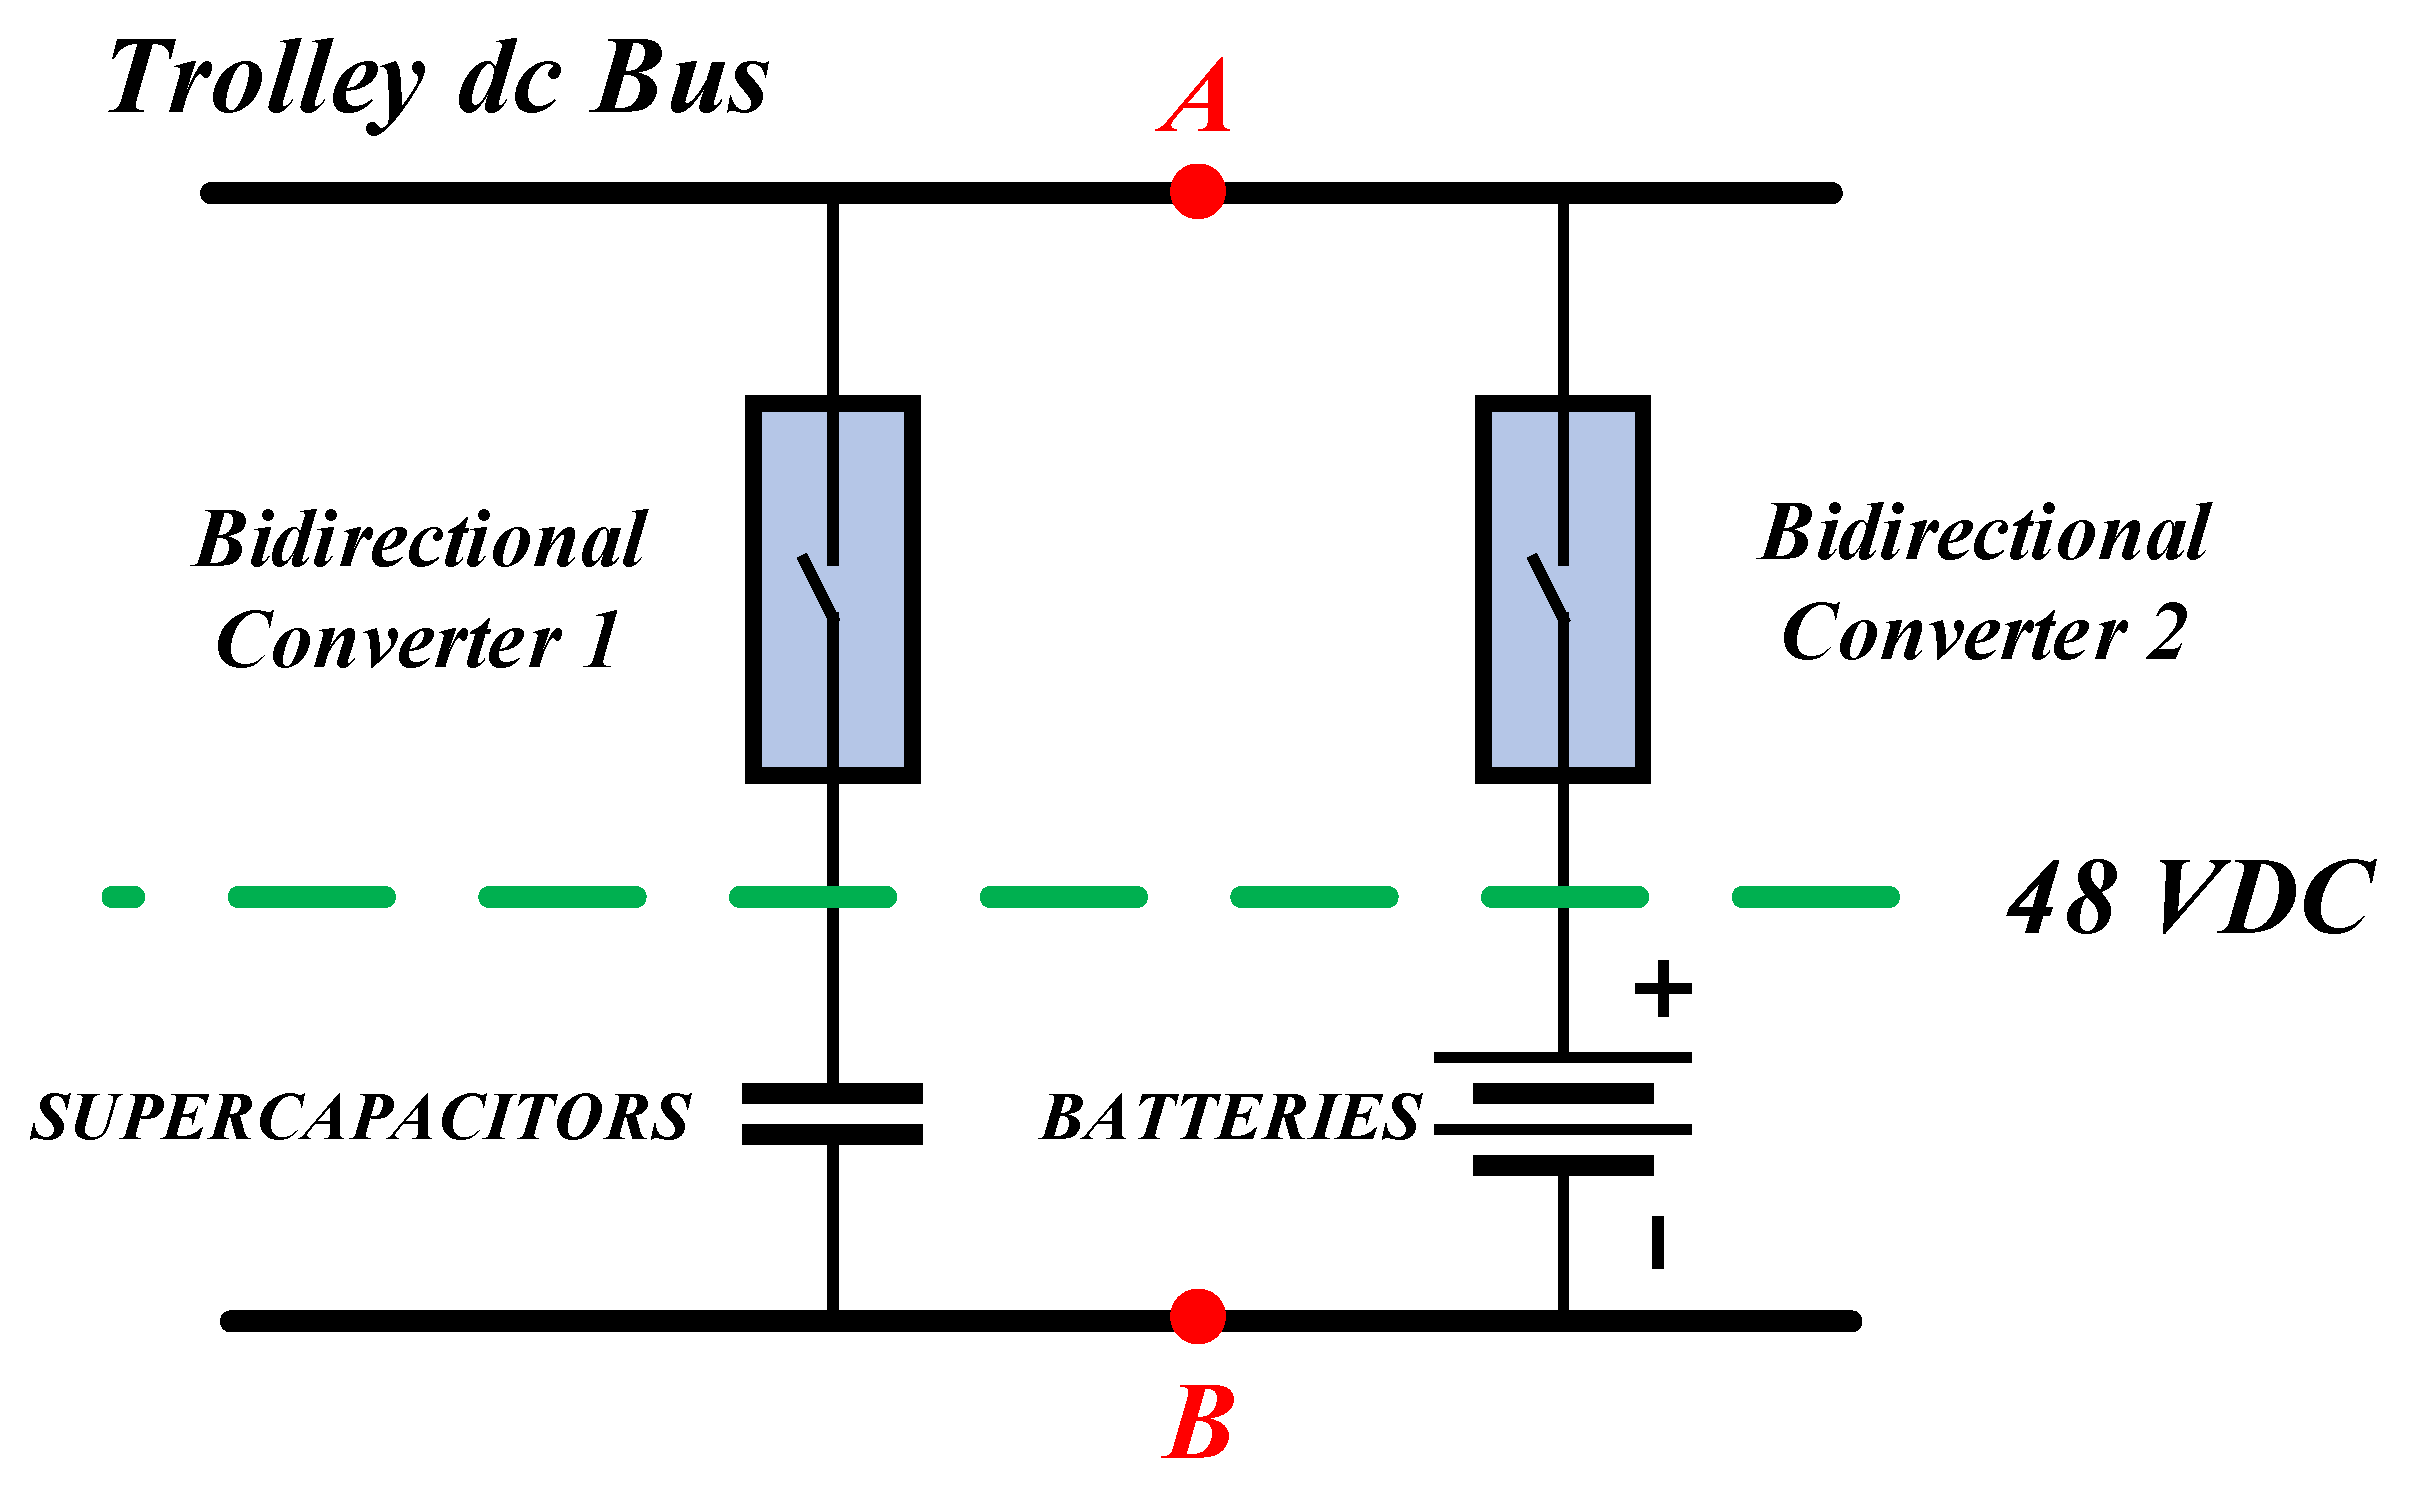
In this paragraph, an initial estimation of the sustainability of a proposed hybrid energy storage apparatus, which is an optimal solution incorporated in many public means of electrical transportation worldwide [24,30], is attempted; this is illustrated in Figure 20.
The components of the proposed apparatus of Figure 20 are the following:
- A supercapacitor bank of 0.2 kWh maximum storage capability, in order to support the energy recovery during deceleration intervals. This unit will also support acceleration intervals, in order to limit the power losses of the overhead supply network. Its dimensioning is based on the results of Figure 15 and Figure 16.
- A battery bank of 3.5 kWh maximum energy capability, in order to support the energy recovery during vehicle downhill courses. Its dimensioning is based on the results of Figure 17.
- Two bidirectional DC/DC converters, one for each energy storage bank.
As depicted in Figure 20, the assumed energy storage voltage level is 48 V and the selected battery technology is Li–ion, in order to have mature commercial solutions available [31]. According to these specifications and taking into account the current electric energy prices and the available commercial data, it turns out that the investment payoff is estimated at 30,000 km, which leads to a payback period of less than two years. This result highlights the sustainability potential of the proposed energy recovery scheme.
7. Conclusions
In this article, the behavioral model of 8000-series of Athens trolleybuses is developed, with the use of data provided by OSY S.A., in order to achieve a reliable estimation of their energy consumption. At the same time, the amount of kinetic energy stored in the rotating/moving parts of the vehicle is estimated; the feasibility of saving this energy, by means of regenerative braking, is considered. Furthermore, the employed driving methods are the existing DVC and the DTC (as an interesting alternative).
In this context, an energy consumption functional model of the trolleybus has been developed, based on exhaustive simulations in Matlab/Simulink environment under various travelling and transport loading conditions (using both DVC and DTC). Next, this energy consumption model is utilized for the energy saving potential estimation of these trolleybuses, under various realistic operating scenarios.
The results of this study lead to the conclusion that there is a significant margin of energy saving of Athens trolleybuses; up to 24% of daily energy consumption. Furthermore, a sustainable hybrid energy storage apparatus is proposed and estimations regarding its payoff period suggest a less than two year payback time interval.
Finally, the proposed energy consumption modelling and energy saving estimation procedure is applicable for any trolleybus system of public transportation.
Author Contributions
Conceptualization, N.A. and N.P.; Methodology, N.P.; Software, N.A.; Validation, N.P. and N.A.; Formal Analysis, N.P.; Investigation, N.A.; Resources, N.A.; Data Curation, N.A.; Writing-Original Draft Preparation, N.A.; Writing-Review & Editing, N.P.; Visualization, N.A.; Supervision, N.P.; Project Administration, N.P.; Funding Acquisition, N.P.
Funding
This research received no external funding.
Acknowledgments
Authors would like to thank OSY S.A. and especially Ellias Kollias and Paraskevas Kampourakis for their support and for providing the necessary data regarding the 8000-series of Athens Trolleybuses.
Conflicts of Interest
The authors declare no conflict of interest.
References
- Apostolidou, N.; Papanikolaou, N.; Kollias, E.; Kampourakis, P. Survey on Regenerative Energy Potential of Athens Trolleybuses. In Proceedings of the 20th International Symposium on Electrical Apparatus and Technologies (SIELA), Burgas, Bulgaria, 3–6 June 2018. [Google Scholar]
- Chen, Y.C.; Chang, Y.C.; Cheng, J.F.; Yu, W.C.; Lin, C.L. Regenerative Braking-Driving Control System. In Proceedings of the 13th IEEE Conference on Industrial Electronics and Applications (ICIEA), Wuhan, China, 31 May–2 June 2018. [Google Scholar]
- Neyestani, N.; Damavandi, M.Y.; Godina, R.; Catalão, J.P.S. Integrating the PEVs’ traffic pattern in parking lots and charging stations in micro multi-energy systems. In Proceedings of the 51st International Universities Power Engineering Conference (UPEC), Coimbra, Portugal, 6–9 September 2016. [Google Scholar]
- Yang, Y.; He, X.; Zhang, Y.; Qin, D. Regenerative Braking Compensatory Control Strategy Considering CVT Power Loss for Hybrid Electric Vehicles. Energies 2018, 11, 497. [Google Scholar] [CrossRef]
- Sarrafan, K.; Muttaqi, K.M.; Sutanto, D.; Town, G.E. A Real-Time Range Indicator for EVs Using Web-Based Environmental Data and Sensorless Estimation of Regenerative Braking Power. IEEE Trans. Veh. Technol. 2018, 67, 4743–4756. [Google Scholar] [CrossRef]
- Liu, B.; Li, L.; Wang, X.; Cheng, S. Hybrid Electric Vehicle Downshifting Strategy Based on Stochastic Dynamic Programming During Regenerative Braking Process. IEEE Trans. Veh. Technol. 2018, 67, 4716–4727. [Google Scholar] [CrossRef]
- Zhang, G.; Tian, Z.; Du, H.; Liu, Z. A Novel Hybrid DC Traction Power Supply System Integrating PV and Reversible Converters. Energies 2018, 11, 1661. [Google Scholar] [CrossRef]
- Bu, B.; Qin, G.; Li, L.; Li, G. An Energy Efficient Train Dispatch and Control Integrated Method in Urban Rail Transit. Energies 2018, 11, 1248. [Google Scholar] [CrossRef]
- Karatzaferis, I.; Tatakis, E.C.; Papanikolaou, N. Investigation of Energy Savings on Industrial Motor Drives Using Bidirectional Converters. IEEE Access 2017, 5, 17952–17961. [Google Scholar] [CrossRef]
- Allegre, A.-L.; Bouscayrol, A.; Delarue, P.; Barrade, P.; Chattot, E.; El-Fassi, S. Energy Storage System With Supercapacitor for an Innovative Subway. IEEE Trans. Ind. Electron. 2010, 12, 4001–4012. [Google Scholar] [CrossRef]
- Drabek, P.; Streit, L. The Energy Storage System with Supercapacitor for Public Transport. In Proceedings of the IEEE Vehicle Power and Propulsion Conference (VPPC ‘09), Dearborn, MI, USA, 7–10 September 2009. [Google Scholar]
- Aberkane, H.; Sakri, D.; Rahem, D. Comparative Study of Different Variants of Direct Torque Control Applied to Induction Motor. In Proceedings of the 9th International Renewable Energy Congress (IREC), Hammamet, Tunisia, 20–22 March 2018. [Google Scholar]
- Ganthia, B.P.; Rana, P.K.; Pattanai, S.A. Space Vector Pulse Width Modulation Fed Direct Torque Control of Induction Motor Drive Using Matlab-Simulink. In Proceedings of the 3rd International Conference on Electrical, Electronics, Engineering Trends, Communication, Optimization and Sciences (EEECOS), Tadepalligudem, India, 1–2 June 2016. [Google Scholar]
- Vas, P. Sensorless Vector and Direct Torque Control; Oxford University Press: Oxford, UK, 1998; pp. 263–323. [Google Scholar]
- Conte, M.; Genovese, A.; Ortenzi, F.; Vellucci, F. Hybrid battery-supercapacitor storage for an electric forklift: A life-cycle cost assessment. J. Appl. Electrochem. 2014, 44, 523–532. [Google Scholar] [CrossRef]
- Mitronikas, E.; Safakas, A. An Improved Sensorless Vector Control Method for an Induction Motor Drive. IEEE Tran. Ind. Electron. 2005, 52, 1660–1668. [Google Scholar] [CrossRef]
- Lascu, C.; Boldea, I.; Blaabjerg, F. A Modified Direct Torque Control for Induction Motor Sensorless Drive. IEEE Trans. Power Electron. 2000, 36, 122–130. [Google Scholar] [CrossRef]
- Ehsani, M.; Gao, Y.; Gay, S.E.; Emadi, A. In Modern Electric, Hybrid Electric, and Fuel Cell Vehicles; CRC Press: Boca Raton, FL, USA, 2005; pp. 21–43, 99–110. ISBN 0-8493-3154-4. [Google Scholar]
- Fajri, P.; Ahmadi, R.; Ferdowsi, M. Equivalent Vehicle Rotational Inertia Used for Electric Vehicle Test Bench Dynamic Studies. In Proceedings of the 38th Annual Conference on IEEE Industrial Electronics Society, Montreal, QC, Canada, 25–28 October 2012; pp. 4115–4120. [Google Scholar]
- Xiaohua, Z.; Haitao, M.; Xing, X.; Qingnian, W. Parameter Design for Power Train and Performance Simulation of Electrical City Bus. In Proceedings of the IEEE Vehicle Power and Propulsion Conference (VPPC), Harbin, China, 3–5 September 2008. [Google Scholar]
- MAN Truck & Bus Company Website. Available online: www.mantruckandbus.com (accessed on 10 June 2018).
- Men, X.; Guo, Y.; Wu, G.; Shi, C.; Zhu, J. Implementation of a Motor Control System for Electric Bus based on DSP. In Proceedings of the 20th International Conference on Electrical Machines and Systems (ICEMS), Sydney, NSW, Australia, 11–14 August 2017. [Google Scholar]
- Karampasis, E.; Papanikolaou, N.; Voglitsis, D.; Loupis, M.; Psarras, A.; Boubaris, A.; Baros, D.; Dimitrakopoulos, G. Active Thermoelectric Cooling Solutions for Airspace Applications: The THERMICOOL Project. IEEE Access 2017, 5, 2288–2299. [Google Scholar] [CrossRef]
- Adib, A.; Dhaouadi, R. Modeling and analysis of a regenerative braking system with a battery-supercapacitor energy storage. In Proceedings of the 7th International Conference on Modeling, Simulation, and Applied Optimization (ICMSAO), Sharjah, United Arab Emirates, 4–6 April 2017. [Google Scholar]
- Liu, P.; Yang, L.; Gao, Z.; Huang, Y.; Li, S.; Gao, Y. Energy-Efficient Train Timetable Optimization in the Subway System with Energy Storage Devices. IEEE Trans. Intell. Transp. Sys. 2018, 1–17. [Google Scholar] [CrossRef]
- Lv, C.; Zhang, J.; Li, Y.; Yuan, Y. Mechanism analysis and evaluation methodology of regenerative braking contribution to energy efficiency improvement of electrified vehicles. Energy Convers. Manag. 2015, 92, 469–482. [Google Scholar] [CrossRef]
- Liu, W.; Xu, J.; Tang, J. Study on control strategy of urban rail train with on-board regenerative braking energy storage system. In Proceedings of the 43rd Annual Conference of the IEEE Industrial Electronics (IECON), Beijing, China, 29 October–1 November 2017. [Google Scholar]
- Khodaparastan, M.; Mohamed, A. A study on super capacitor wayside connection for energy recuperation in electric rail systems. In Proceedings of the 6th International Conference on Renewable Energy Research and Applications (ICRERA), San Diego, CA, USA, 5–8 November 2017. [Google Scholar]
- Yang, Z.; Yang, Z.; Xia, H.; Lin, F. Brake Voltage Following Control of Supercapacitor-Based Energy Storage Systems in Metro Considering Train Operation State. IEEE Trans. Ind. Electron. 2018, 65, 6751–6761. [Google Scholar] [CrossRef]
- Ostadi, A.; Kazerani, M. A Comparative Analysis of Optimal Sizing of Battery-Only, Ultracapacitor-Only, and Battery–Ultracapacitor Hybrid Energy Storage Systems for a City Bus. IEEE Trans. Veh. Technol. 2015, 64, 4449–4460. [Google Scholar] [CrossRef]
- Mouser Electronics. Available online: www.mouser.com (accessed on 10 June 2018).
Figure 1.
Electric energy management in 8000-series of Athens trolleybuses. The energy flows strictly unidirectionally from the overhead power line to the trolleybus electric apparatus. DC—direct current; AC—alternating current.
Figure 1.
Electric energy management in 8000-series of Athens trolleybuses. The energy flows strictly unidirectionally from the overhead power line to the trolleybus electric apparatus. DC—direct current; AC—alternating current.

Figure 2.
Block-diagram of 8000-series Athens trolleybuses traction system [13]. VDC: DC voltage supply, Rbraking: Breaking Resistance.
Figure 2.
Block-diagram of 8000-series Athens trolleybuses traction system [13]. VDC: DC voltage supply, Rbraking: Breaking Resistance.

Figure 3.
Block diagram of direct torque control (DTC) of an asynchronous machine.

Figure 4.
Driving unit of Athens trolleybuses asynchronous machine (M) [1].
Figure 4.
Driving unit of Athens trolleybuses asynchronous machine (M) [1].

Figure 5.
Model of the trolleybus mechanical part.
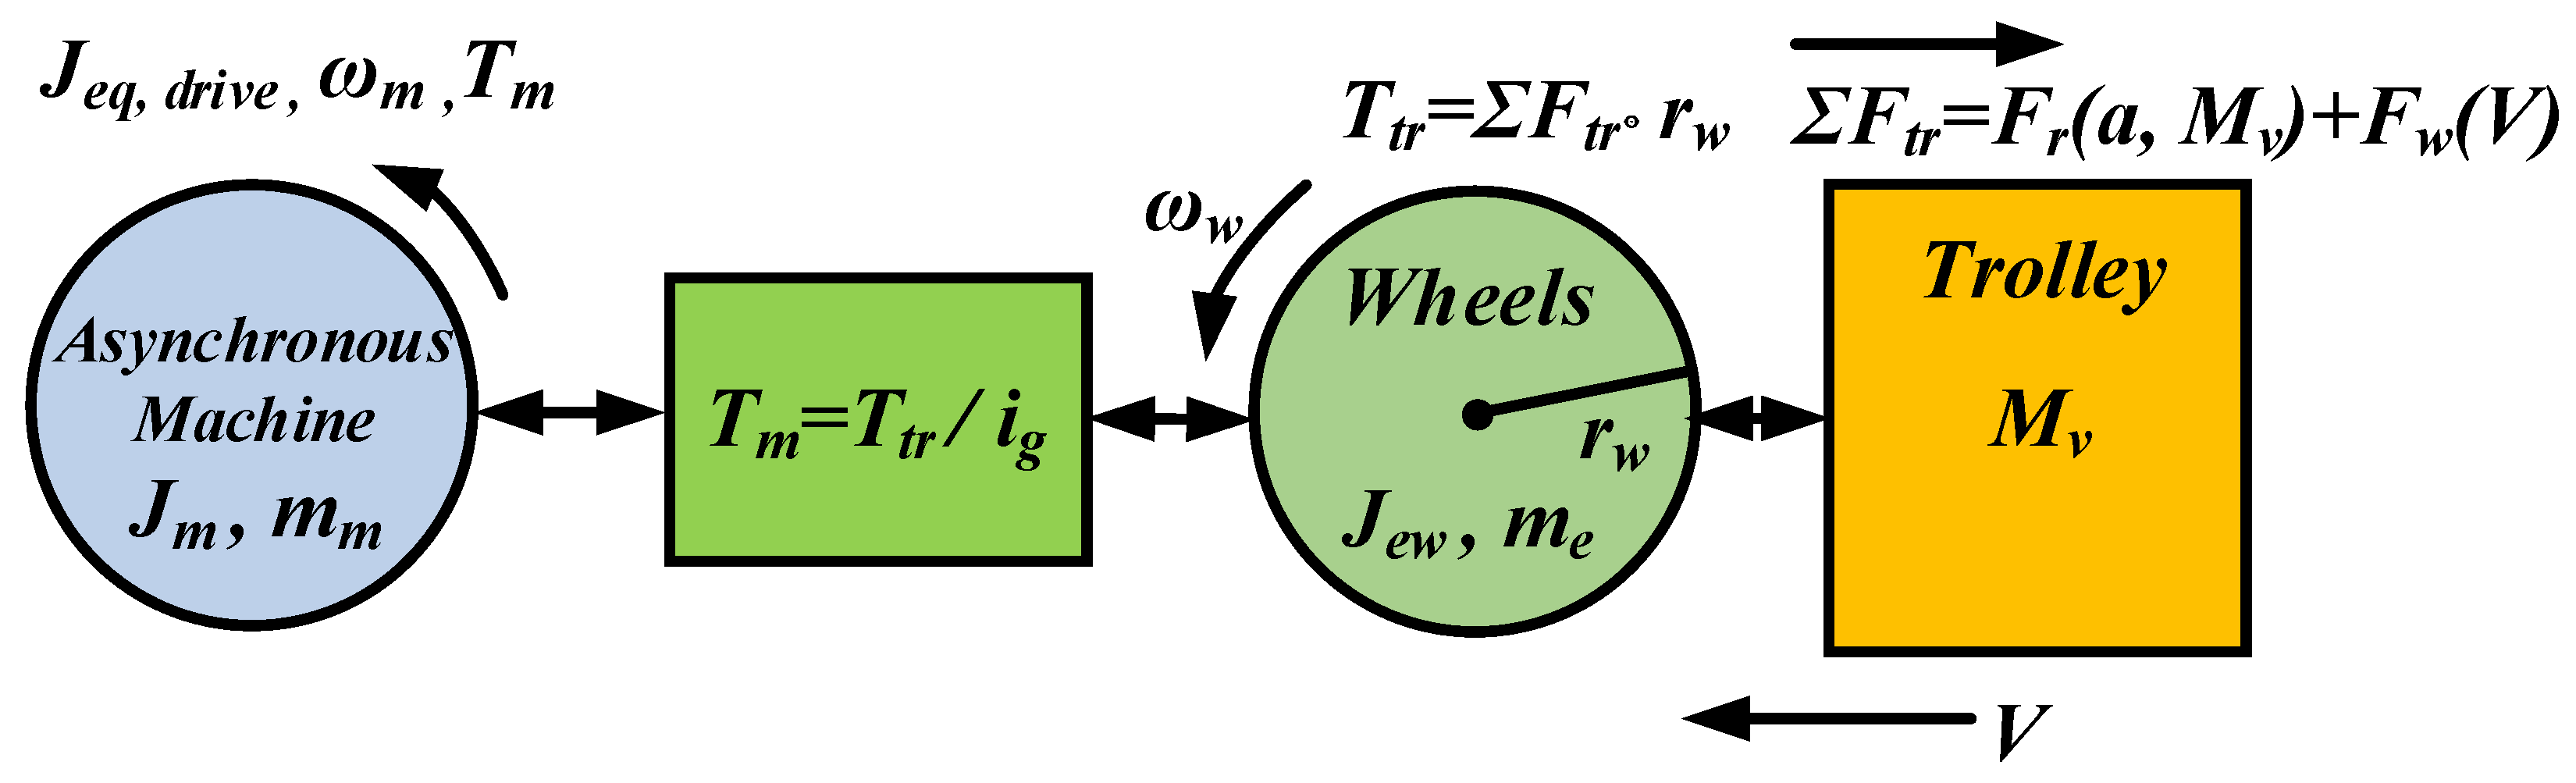
Figure 6.
Trolleybus total electrical losses model.

Figure 7.
Trolleybus individual energy consumption components.

Figure 8.
Athens trolleybuses electromechanical model. DVC—direct vector control, DTC—direct torque control.
Figure 8.
Athens trolleybuses electromechanical model. DVC—direct vector control, DTC—direct torque control.

Figure 9.
Trolleybus total energy consumption as a function of speed, for various conditions of passenger load (EMPTY, FULL), road inclination (0%, 1%, 5%) and driving scheme (DVC, DTC).
Figure 9.
Trolleybus total energy consumption as a function of speed, for various conditions of passenger load (EMPTY, FULL), road inclination (0%, 1%, 5%) and driving scheme (DVC, DTC).

Figure 10.
Motor energy consumption as a function of speed, for various conditions of passenger load (EMPTY, FULL) and road inclination (0%, 1%, 5%), with DVC and DTC implementation.
Figure 10.
Motor energy consumption as a function of speed, for various conditions of passenger load (EMPTY, FULL) and road inclination (0%, 1%, 5%), with DVC and DTC implementation.

Figure 11.
Mechanical–transport–load energy consumption as a function of speed, for various conditions of passenger load (EMPTY, FULL) and road inclination (0%, 1%, 5%), with DVC and DTC implementation.
Figure 11.
Mechanical–transport–load energy consumption as a function of speed, for various conditions of passenger load (EMPTY, FULL) and road inclination (0%, 1%, 5%), with DVC and DTC implementation.

Figure 12.
Inverter energy consumption as a function of speed, for different conditions of passenger load (EMPTY, FULL) and road inclination (0%, 1%, 5%), with DVC and DTC implementation.
Figure 12.
Inverter energy consumption as a function of speed, for different conditions of passenger load (EMPTY, FULL) and road inclination (0%, 1%, 5%), with DVC and DTC implementation.

Figure 13.
Trolleybus total energy consumption during acceleration from zero to a final speed, as a function of the final speed, for various conditions of passenger load (EMPTY, FULL), with DVC and DTC implementation.
Figure 13.
Trolleybus total energy consumption during acceleration from zero to a final speed, as a function of the final speed, for various conditions of passenger load (EMPTY, FULL), with DVC and DTC implementation.

Figure 14.
Trolleybus total energy consumption during acceleration from an initial to a final speed, as a function of speed, for various conditions of passenger load (EMPTY, FULL), with DVC and DTC implementation.
Figure 14.
Trolleybus total energy consumption during acceleration from an initial to a final speed, as a function of speed, for various conditions of passenger load (EMPTY, FULL), with DVC and DTC implementation.

Figure 15.
Energy consumed on braking resistance (energy recovery potential) during deceleration from maximum speed (65 km/h) to different speeds, as a function of the final speed, for different conditions of passenger load (EMPTY, FULL), with DVC and DTC implementation.
Figure 15.
Energy consumed on braking resistance (energy recovery potential) during deceleration from maximum speed (65 km/h) to different speeds, as a function of the final speed, for different conditions of passenger load (EMPTY, FULL), with DVC and DTC implementation.

Figure 16.
Energy consumed on braking resistance (energy recovery potential) during deceleration from an initial to a final speed, for various conditions of passenger load (EMPTY, FULL), with DVC and DTC implementation.
Figure 16.
Energy consumed on braking resistance (energy recovery potential) during deceleration from an initial to a final speed, for various conditions of passenger load (EMPTY, FULL), with DVC and DTC implementation.

Figure 17.
Energy consumed on braking resistance (energy recovery potential) as a function of speed, for various conditions of passenger load (EMPTY, FULL) and road inclination (−1%, −5%), with DVC and DTC implementation.
Figure 17.
Energy consumed on braking resistance (energy recovery potential) as a function of speed, for various conditions of passenger load (EMPTY, FULL) and road inclination (−1%, −5%), with DVC and DTC implementation.

Figure 18.
Operating area of the trolleybus asynchronous machine. In the blue area, DTC is more efficient, whereas in the pink area, DVC is more efficient. In the hatched area, the performance of these two driving methods is almost the same.
Figure 18.
Operating area of the trolleybus asynchronous machine. In the blue area, DTC is more efficient, whereas in the pink area, DVC is more efficient. In the hatched area, the performance of these two driving methods is almost the same.

Figure 19.
Diagram of considered trolleybus course, including road/travelling conditions under study.
Figure 19.
Diagram of considered trolleybus course, including road/travelling conditions under study.

Figure 20.
Proposed hybrid energy storage apparatus; points A, B refer to Figure 4.
Figure 20.
Proposed hybrid energy storage apparatus; points A, B refer to Figure 4.


Table 1.
Technical data of 8000-series Athens trolleybuses [1].
Table 1.
Technical data of 8000-series Athens trolleybuses [1].
| Technical Data of 8000-Series Athens Trolleybuses | |
|---|---|
| ig | 11.02 |
| Mv | 20,000 kg (max), 14,000 kg (min) |
| Af | 7.5 m2 |
| rw | 0.54 cm |
| Je,drive | 60 kg·m2 |
| Maximum linear velocity | 65 km/h |
| Maximum acceleration | 1.5 m/s2 |
| Maximum deceleration | 1.3 m/s2 |
Table 2.
Energy consumption of the trolleybus (considering maximum passenger load, Mv = 20,000 kg) in assumed routes, under low and heavy traffic congestion. Scenarios 1, 2, and 3.
Table 2.
Energy consumption of the trolleybus (considering maximum passenger load, Mv = 20,000 kg) in assumed routes, under low and heavy traffic congestion. Scenarios 1, 2, and 3.
| Type of Course | Initial/Final Speed (km/h) | Road Inclination (%)/Scenario 1/2/3 | Distance (km) | Times of Traveled Distance (Light/Heavy Traffic) |
|---|---|---|---|---|
| Acceleration | 0/20 0/30 0/40 0/50 20/30 30/40 40/50 | 0/0/0 | ignored | 20/60 40/120 20/60 20/60 20/60 40/120 20/60 |
| Deceleration | 30/20 40/30 50/40 | 0/0/0 | ignored | 20/60 40/120 20/60 |
| Constant Speed | 20, 30, 40, 50 | 0/0/0 | 0.5 | 1 |
| 20, 30, 40 | 1, 5, −1, −5/0, 1, −1, 0/0, 0, 0, 0 | 0.1 | 10 |
Table 3.
Energy consumption/recovery potential of the trolleybus (considering maximum passenger load, Mv = 20,000 kg) in assumed routes, under low and heavy traffic congestion. Scenarios 1, 2, and 3. DVC—direct vector control; DTC—direct torque control.
Table 3.
Energy consumption/recovery potential of the trolleybus (considering maximum passenger load, Mv = 20,000 kg) in assumed routes, under low and heavy traffic congestion. Scenarios 1, 2, and 3. DVC—direct vector control; DTC—direct torque control.
| Control Method/Traffic Case | Energy Consumption (kWh/km)/Recovery Potential (%) | ||
|---|---|---|---|
| Scenario 1 | Scenario 2 | Scenario 3 | |
| DVC, Light Traffic | 2.01/8.5 | 1.01/9.45 | 0.69/14.3 |
| DVC, Heavy Traffic | 2.74/13.46 | 1.8/15.55 | 1.42/20.9 |
| DTC, Light Traffic | 1.97/8.8 | 1.1/9.6 | 0.67/18.9 |
| DTC, Heavy Traffic | 2.69/14.2 | 1.82/17.22 | 1.39/24 |
© 2018 by the authors. Licensee MDPI, Basel, Switzerland. This article is an open access article distributed under the terms and conditions of the Creative Commons Attribution (CC BY) license (http://creativecommons.org/licenses/by/4.0/).
Share and Cite
MDPI and ACS Style
Apostolidou, N.; Papanikolaou, N. Energy Saving Estimation of Athens Trolleybuses Considering Regenerative Braking and Improved Control Scheme. Resources 2018, 7, 43. https://doi.org/10.3390/resources7030043
AMA Style
Apostolidou N, Papanikolaou N. Energy Saving Estimation of Athens Trolleybuses Considering Regenerative Braking and Improved Control Scheme. Resources. 2018; 7(3):43. https://doi.org/10.3390/resources7030043
Chicago/Turabian StyleApostolidou, Nena, and Nick Papanikolaou. 2018. "Energy Saving Estimation of Athens Trolleybuses Considering Regenerative Braking and Improved Control Scheme" Resources 7, no. 3: 43. https://doi.org/10.3390/resources7030043
Note that from the first issue of 2016, this journal uses article numbers instead of page numbers. See further details here.