Article

Impact of pH and Ionic Molar Ratios on Phosphorous Forms Precipitation and Recovery from Different Wastewater Sludges

by
Saba Daneshgar
1,
Armando Buttafava
2,3,
Doretta Capsoni
3,
Arianna Callegari
1 and
Andrea G. Capodaglio
1,*
1
Department of Civil Engineering and Architecture, University of Pavia, 27100 Pavia, Italy
2
UN.E.CO srl, Academic Spinoff of the University of Pavia, 27100 Pavia, Italy
3
Department of Chemistry, University of Pavia, 27100 Pavia, Italy
*
Author to whom correspondence should be addressed.
Resources 2018, 7(4), 71; https://doi.org/10.3390/resources7040071
Submission received: 31 August 2018 / Revised: 28 October 2018 / Accepted: 1 November 2018 / Published: 6 November 2018
(This article belongs to the Special Issue Renewable Resources, Clean Resources, Future Resources)

Abstract

:
Phosphorus is an essential nutrient for plants, which use it as a basic fertilizer component and is expected to increase significantly in the coming years due to higher food crops demand. Unfortunately, the available phosphorus natural reserves are not renewable, and estimates indicate their rapid decline in the future. Urban wastewater, due to its abundance and relatively high phosphorus content, is an excellent candidate for phosphorus recovery, while the element’s removal from urban effluents was introduced in the 1970′s to limit the undesired effects of eutrophication. In this study, the process of struvite (and related phosphorous compounds) crystallization was investigated for three different sludge types, and the results were compared. While most studies focus strictly on anaerobically digested sludge for high struvite precipitation efficiency, this study investigated the possibility of inducing precipitation on both aerobic (extended aeration) and anaerobic sludges produced by two wastewater treatment plants in northern Italy. Analysis of precipitates from sludge samples was compared, where the focus was on the aerobic sludge, and its potential for struvite recovery. The effect of different reaction parameters was studied under different operating conditions, and the use and effects of Ca(OH)2 addition as an inexpensive potential pH adjustment reagent was investigated.

1. Introduction

Phosphorus (P) is an essential nutrient for plants. While its use as a basic fertilizer for industrialized crop production is expected to increase significantly in the coming years, its available natural reserves are not renewable, and are predicted to decline rapidly in the future [1,2,3]. The current consumption pattern is not sustainable in the long run, and recycling or recovery of phosphorus from waste streams has been proposed as a possible solution for extending phosphorus resources duration, while also helping to reduce eutrophication of natural waters, a P-related undesired effect [4,5,6].
Wastewater from municipal treatment plants (WWTPs), due to its abundance, and relatively high phosphorus content, is an excellent candidate for phosphorus recovery [7,8]. Several technologies have been proposed to recover or remove phosphorus from such waste streams, whilst removal was introduced in the 1970’s to limit the undesired effects of eutrophication. It is carried out by chemical or biological methods, and it does not originate a readily usable product (mostly ferric or aluminum phosphates, not suitable as fertilizer components). The most interesting technologies for P recovery make use of magnesium or calcium precipitation processes, where phosphorus can be recovered as struvite, amorphous calcium phosphate, brushite, octacalcium phosphate, hydroxyapatite, and apatite [9,10]. The latter two are also normally considered ineffective as fertilizers due to their low solubility. However, inoculation with phosphate solubilizing microorganisms [11] or precipitation techniques of Nano-sized apatite [12] appear to be promising strategies for the reuse of even low-solubility phosphates. Kizito et al., [13] also investigated a study on phosphate recovery using slow pyrolyzed biochar, which could be considered as a valuable product in environmental remediation.
However, struvite precipitation remains one of the main methods of phosphorus recovery from wastewater treatment. Struvite, or magnesium ammonium phosphate hexahydrate, (MgNH4PO4·6H2O) is a white mineral that frequently precipitates within sewage treatment systems, when concentrations of ammonium and phosphate are relatively high. In uncontrolled conditions, it is considered as a potential problem causing clogging in pumps, pipes, etc. Nevertheless, under controlled conditions, it can be recovered from different stages of the treatment process [14], and due to its low solubility and high nutrients content (both nitrogen and phosphorus), it can be further reused as a suitable, slow-release fertilizer in agriculture [15,16].
Struvite precipitation occurs according to the following reactions:
  Mg 2 + +   NH 4 + +   PO 4 3   + 6 H 2 O     MgNH 4 PO 4 · 6 H 2 O  
  Mg 2 + +   NH 4 + +   HPO 4 2   + 6 H 2 O     MgNH 4 PO 4 · 6 H 2 O +   H +  
  Mg 2 + +   NH 4 + +   H 2 PO 4   + 6 H 2 O     MgNH 4 PO 4 · 6 H 2 O + 2 H +  
The reaction of HPO42− (Equation (2)) dominates in the pH range 7–11, in which struvite precipitation is likely to happen [17]. Different factors affect the process of struvite crystallization, such as pH, constituent ions (Mg2+, PO43− and NH4+) molar ratios, presence of other competitive ions such as Calcium (Ca2+), agitation rates, reaction retention time, etc.
The crystallization of struvite consists of three stages; Nucleation (crystal birth), crystal growth, and aggregation [18]. All these three mechanisms can be formulated as functions of the struvite supersaturation ratio, which is defined as the ratio of the ion activity product (IAP) of constituent ions in solution over its equilibrium solubility product or Ksp. Struvite saturation index (SI) (the logarithm of supersaturation ratio) [19], is an indicator of whether precipitation is likely to happen or not. If SI > 0, the solution is supersaturated, and precipitation may occur, if SI < 0, the solution is undersaturated, and there will be no precipitation. SI = 0 indicates an equilibrium condition.
  IAP =   { Mg 2 + } { NH 4 + } { PO 4 3 }  
  SI =   log ( IAP K sp )  
The presence of other competitive ions strongly affects the struvite precipitation process. The main solid phases that can precipitate alongside struvite are calcium phosphate compounds, magnesium phosphate compounds, and carbonates. Newberyite (MgHPO4·3H2O) and bobierrite (Mg3(PO4)·8H2O) are the two main magnesium phosphate compounds that may precipitate. However, their chance of forming a precipitate is highly dependent on operating conditions. Newberyite needs a high Mg2+/P ratio and a relatively low (compared to struvite) pH (less than 6) to precipitate in significant amounts [20,21]. Bobierrite precipitation, on the other hand, is very slow, and may take days to form a precipitate [22].
Calcium phosphate compounds, at least in some forms, and carbonates, also have a high possibility to co-precipitate with struvite. Among different calcium phosphate compounds, brushite (CaHPO4·2H2O), octacalcium phosphate (OCP, Ca8(HPO4)2(PO4)4·5H2O)) and amorphous calcium phosphate (ACP, Ca3(PO4)2·xH2O) are likely to precipitate first [19,23]. These can be further transformed to the more stable forms of hydroxyapatite (HAP, Ca5(PO4)3OH), monetite (DCP, CaHPO4), and tricalcium phosphate (TCP, Ca3(PO4)2). While the transformation to DCP is relatively fast, HAP and TCP demonstrate very slow kinetics, and could be well out of the typical temporal scale of WWTPs operating conditions [21,22]. Calcite (CaCO3) is the thermodynamically stable form of calcium carbonates, which has the greatest precipitation potential in alkaline environments. However, its precipitation is highly affected by the presence of Mg2+, phosphate, and dissolved organics [21]. Magnesite (MgCO3) is the stable form of magnesium carbonate compounds in a pH range less than 10.7; therefore, its reaction ought to be considered [21]. In addition, calcium hydroxide (Ca(OH)2) and brucite (magnesium hydroxide, Mg(OH)2) can precipitate at high (>9.5) pH [21]. Table 1 summarizes the possible reactions of P minerals precipitation in the process of struvite precipitation.
In this study, the process of struvite (and related P compounds) crystallization was investigated for three different sludge types, and results were compared. While most studies focus strictly on anaerobically digested sludge for high struvite precipitation efficiency, this study investigated the possibility of inducing precipitation on both aerobic (extended aeration) and anaerobic sludges produced by the wastewater treatment plants (WWTPs) of Nosedo (Milan, Italy) and Pavia (Italy), respectively. First, analysis of precipitates from different sludge samples and synthetic struvite was compared. Then, as the second part of the study, we focused mainly on the aerobic sludge, and on its potential for struvite recovery. The effect of different reaction parameters was studied under different operating conditions, and the use of Ca(OH)2 as an inexpensive pH adjustment reagent was also investigated.

2. Materials and Methods

2.1. Synthetic Struvite

Synthetic Struvite was initially produced as a comparative precipitate in the laboratory using phosphoric acid (H3PO4), ammonia (NH3), and magnesium chloride (MgCl2) with 1:1:1 molar ratio, in an alkaline environment. The precipitated struvite was then dried at room temperature for analysis in subsequent steps (Figure 1).

2.2. Sludge Characteristics

In this study, sludge samples were taken from the Nosedo WWTP near Milan, and from the municipal WWTP in Pavia (both in Italy). The samples were drawn from the (extended) oxidation tanks and the denitrification units at Nosedo, and from the dewatering phase following anaerobic digestion in Pavia. Table 2 summarizes the characteristics of the samples used in this study.
The average concentration of total phosphorus entering the Nosedo WWTP was 3.2 mg/L, with observed minimum and maximum of 1.0 and 6.2 mg/L, respectively. Generally, this concentration is not sufficiently high for achieving significant struvite precipitation. However, during the anaerobic denitrification stage of the activated sludge process, temporary release of phosphorus occurs, which is then followed by its “luxury uptake” in the aerobic zone. This increases the phosphorus content of the sludge to as high as 3–7% (dry basis) [32,33], with a high concentration of 37 mg/L in the extended oxidation tank and could make it potentially suitable for struvite precipitation.

2.3. Equipment and Analytical Tools

Experiments were conducted in 1-L Imhoff cone-shaped beckers (Figure 2) fitted with a tip-valve to extract the precipitate. Initially, pH was adjusted using a fish-tank aeration pump injecting air in the vessels with a tube, while later a NaOH solution was used as pH adjustment reagent. MgCl2 and NH4Cl were added to the vessels as sources of magnesium and ammonium, respectively. UV-Vis colorimetric (HP 8452A Diode Array Spectrophotometer, Hewlett Packard Corporation, Palo Alto, CA, USA) method using antimony-phospho-molybdate complex (EPA 365.3) [34] was applied for P concentration measurements. P concentration vs. absorbance levels curve was calibrated using standard phosphate solutions, and absorbance levels of the samples were measured at 712 nm according to standard.
Analyses of the final precipitates, and identification of different components, was performed with Fourier Transform Infrared Spectroscopy (FTIR) (Perkin Elmer 1600 series, Waltham, MA, USA) as the main method. Thermal gravimetric analysis (TGA) (Mettler Toledo TGA 1 STARe System, Columbus, OH, USA) combined with Quadrupolar Mass Spectroscopy (MS) and X-ray Diffraction (XRD) (Bruker D5005, Billerica, MA, USA) were also used to confirm the presence of different minerals in precipitates. Evaporated materials from TGA were fed to the MS to detect different components. Inductively Coupled Plasma Atomic Emission Spectroscopy (ICP-AES) was used for quantitative measurements of Ca2+, Mg2+, and P in the final precipitates, and Elemental Analysis was applied for determining N, H, and C contents.
The final part of the experiments included the study of the effect of using Ca(OH)2 as pH-adjustment reagent, and the results were compared with previous runs.

2.4. Chemical Equilibrium Modeling for SI Calculation

A chemical equilibrium model was used to calculate the Saturation Index (SI) values of different solid phases, and therefore, to evaluate the possibility of their precipitation in the specific experimental operating conditions. For this aim, the PHREEQC model (USGS) [35] was applied based on sample characteristics and initial conditions as the input values, and the optimization of PHREEQC’s database for accounting of precipitation processes specified in Table 1 were performed as specified in [14].

2.5. Extended-Aeration Sludge Experimental Setup

Precipitation experiments were conducted at three pH levels (8.5, 9.0, 9.5), adjusted with NaOH solution, at different Mg2+, NH4+, and P molar ratios, according to Table 3.
An additional test was also performed for comparison on the extended-aeration sludge without any Mg and NH4 additives, using only NaOH for pH adjustment. Two additional sets of experiments were also implemented to evaluate the possibility of using Ca(OH)2 for pH adjustment as a more cost-effective option. In these additional runs, Mg2+:NH4+:P ratios of 5:5:1 and 3:3:1 were used.

3. Results

3.1. Synthetic Struvite

The synthetic struvite obtained in the laboratory was subjected to FTIR, TGA, and MS analyses. In the FTIR spectrum prior to TGA, the associated bands of PO43−, H-N-H bonds, and water molecules at 1000–1100, 1400–1600, and 2200–3800 cm−1, respectively [36,37] can all be identified (Figure 3a). The TGA curve and its derivative, DTGA, (Figure 3b) show a weight loss around 150 °C, related to the loss of ammonia and water molecules based on reaction shown in Equation (6) [38]:
  MgNH 4 PO 4 · 6 H 2 O   NH 3 ,   H 2 O   MgHPO 4   H 2 O   0.5 Mg 2 P 2 O 7  
This is also confirmed by the MS result, showing high intensity values for peaks at 17 and 18 m/z (mass-to-charge ratio), associated to NH3+·H2O and H2O, respectively (Figure 3c).
FTIR was performed prior and after TGA analysis. The latter results (Figure 3a) show the absence of water and H-N-H bonds associated peaks, and the presence of P2O74− formed based on the second step of the above reaction in the latter test.
The theoretical weight loss of the struvite decomposition reaction was 54.64%, while an experimental value of 53.94% was determined, which could be considered quite accurate.
Figure 4 shows the XRD outcome of synthetic struvite. The black line represents the synthetic struvite sample, while red dots indicate struvite peaks based on JCPSD 071-2089 [39]. The behavior of synthetic lab-made struvite is sufficiently comparable to the reference one, since major struvite peaks are visible in XRD.

3.2. Analysis of Precipitates

3.2.1. Anaerobic Digestion Sludge

Magnesium was added in stoichiometric amount to the sludge samples following AD taken at the Pavia WWTP. Ammonium addition was not necessary, since AD sludge already contained high ammonium concentrations. Samples were adjusted to pH = 9 using aeration, as described in Section 2.3. Final precipitates were analyzed using FTIR, TGA, and MS.
Associated peaks of water molecules, PO43−, and H-N-H bonds are clearly visible in the FTIR of the final precipitates obtained from anaerobic digestion sludge (Figure 5a). This suggests the presence of struvite in the precipitates. Furthermore, bands related to carbonate groups (CO32−) at around 1440 and 1650 cm−1 [40] can also be seen in the graph (Figure 5a). In this case, TGA results (Figure 5b) show two big weight losses at around 150 and 800 °C. While the first one is related to the loss of H2O and NH3 (based on Equation (6)), the second is a typical carbon dioxide weight loss based on the reaction [41]:
  CaCO 3   CO 2   CaO  
This result has also been confirmed by MS (Figure 5c), as it can be seen by three intensity peaks: the first two (NH3+·H2O) are similar to those for synthetic struvite (Figure 3c), related to the presence of H2O and NH3 (peaks at 17 and 18 m/z, respectively), the third one is referring to CO2, with a mass-to-charge ratio of 44 m/z. The calculated weight loss values show that struvite and calcite comprised 45% and 47% of final precipitates, respectively.
FTIR following TGA shows the absence of struvite and carbonate associated peaks, and the presence of a P2O74− peak at 900–1200 cm−1 [42]. A small, sharp peak can also be observed at around 3600–3700 cm−1, associated to the OH group [37], and which can be related to the presence of hydroxyapatite in the precipitate. This can explain the nature of the remaining 8% (other than struvite and calcite) of the final precipitates, suggesting that it is related to the presence of ACP, transformed to hydroxyapatite at high temperature [40].
Anaerobic sludge precipitation has been studied for a long time, generally showing great potential for phosphorus recovery (80–85% at pH = 9). Significant amounts of struvite could precipitate, since it has relatively low calcium content (initial Ca2+:Mg2+ ratio of 1.07), and a very high amount of ammonium. Therefore, it has great potential for fertilizer production; however, in the case examined, the precipitation of calcite was significant at higher pH levels.

3.2.2. Denitrification Sludge

Magnesium and ammonium were added in stoichiometric amounts to the sludge samples from the Nosedo denitrification section. Samples were adjusted to pH = 9 using aeration, as described in Section 2.3. Final precipitates were analyzed using FTIR, TGA, and MS methods. The analyses of precipitates from the Nosedo denitrification sludge sample are summarized in Figure 6. The first notable presence is a HPO42− associated peak at around 900 cm−1 [43] in the pre-TGA sample (Figure 6a), which suggests precipitation of monetite (DCP) or brushite (DCPD). The weight loss at around 150 °C visible in both the TGA (Figure 6b) and MS (Figure 6c) graphs suggests the same phenomenon observed with synthetic struvite, related to loss of water molecules based on the reaction in Equation (8):
  2 CaHPO 4   H 2 O   Ca 2 P 2 O 7  
Post-TGA FTIR analysis confirms this result by showing peaks of P2O74− at around 900–1200 cm−1 (Figure 6a). The associated carbonate peak (CO32−) at around 1400 cm−1 in the same graph was related to formation of calcite through the same reaction in Equation (7). Three significant weight losses are visible in the TGA graph, in addition to the water loss: one is at around 450–500 °C, and the other at 900–1000 °C (Figure 6b). The MS graph (Figure 6c) shows that the second is related to the evolution of CO2, and thus can be an additional confirmation of the presence of HPO42− based on:
  2 HPO 4 2 +   CO 3 2     CO 2 + H 2 O + 2 PO 4 3  
The water loss, on the other hand, could be due the reaction of hydroxyapatite with CaO:
  Ca 10 ( PO 4 ) 6 ( OH ) 2   + 2 CaO     3 Ca 4 O ( PO 4 ) 2 +   H 2 O  
The post-TGA FTIR graph indicates a strong evolution of water reaction according to Equation (10), by showing peaks of OH around 3400–3500 cm−1 (Figure 6a).
Tests on the denitrification sludge suggested that this was not suitable for significant struvite precipitation. Although phosphorus removal was high (nearly 80% at pH = 9), it was mostly in the form of calcium phosphate compounds, such as monetite, brushite, and hydoxiapatie, which are not very efficient to be used as fertilizers.

3.2.3. Extended Aeration Sludge

The same procedure of analysis was applied to the aerobic sludge (Figure 7). This time the analysis did not provide satisfactory and easily comprehensible results on final precipitates. Based on the FTIR results (Figure 7a), the associated peaks of the phosphate group and water molecules are present at around 1000–1100 and 3500 cm−1. However, the peaks in the range of 1200–2000 cm−1 cannot directly identify the presence of struvite in the final precipitates. The peaks at around 1400–1500 cm−1 could be related to H-N-H bonds of struvite, but also to the carbonate groups. The peak at 1650 cm−1 could be assigned to the H-bonds of amorphous phases. It seems that the peaks at this range are formed based on a convolution of individual peaks of different groups. TGA analysis (Figure 7b) results show a weight loss at around 150°C that could be related to water, and possibly, ammonia. In addition, there were two other weight losses at around 650 and 800 degrees of °C, which could be related to carbonate. MS results (Figure 7c) confirm this by indicating the presence of carbon dioxide based on the graph with a mass-to-charge ratio of 44 m/z.
Consequently, it seems that higher levels of Mg2+ and NH4+ would be needed in the case of aerobic sludge, to achieve significant struvite precipitation directly detectable by analysis of precipitates. Phosphorus removal was around 80–85% at pH = 9, in this case, and the final precipitates were most probably a mix of struvite, ACP, and calcite. Further tests in the following sections investigate the possibility of using aerobic sludge for obtaining a precipitate that is suitable to be used as a fertilizer.

3.3. Effect of Different Reaction Parameters on Oxidation Sludge

3.3.1. Chemical Equilibrium Modeling

Results of PHREEQC modeling for extended aeration sludge samples showed positive SI values for four solid phases; Struvite, ACP, Calcite, and Monetite (DCP). This suggested that these solid phases had the possibility of precipitation in the operating conditions of the system, and ought to be taken into consideration for a likely composition of final precipitates. However, in almost all experiments, no signs of HPO42− in the precipitates were identified, based on obtained FTIR spectra, compared to the typical associated peaks of HPO42− (Figure 8) [40]. This suggested that struvite, ACP and calcite were the only three major solid phases precipitating in the process, and monetite (DCP) was not present in the final product despite the positive SI value.

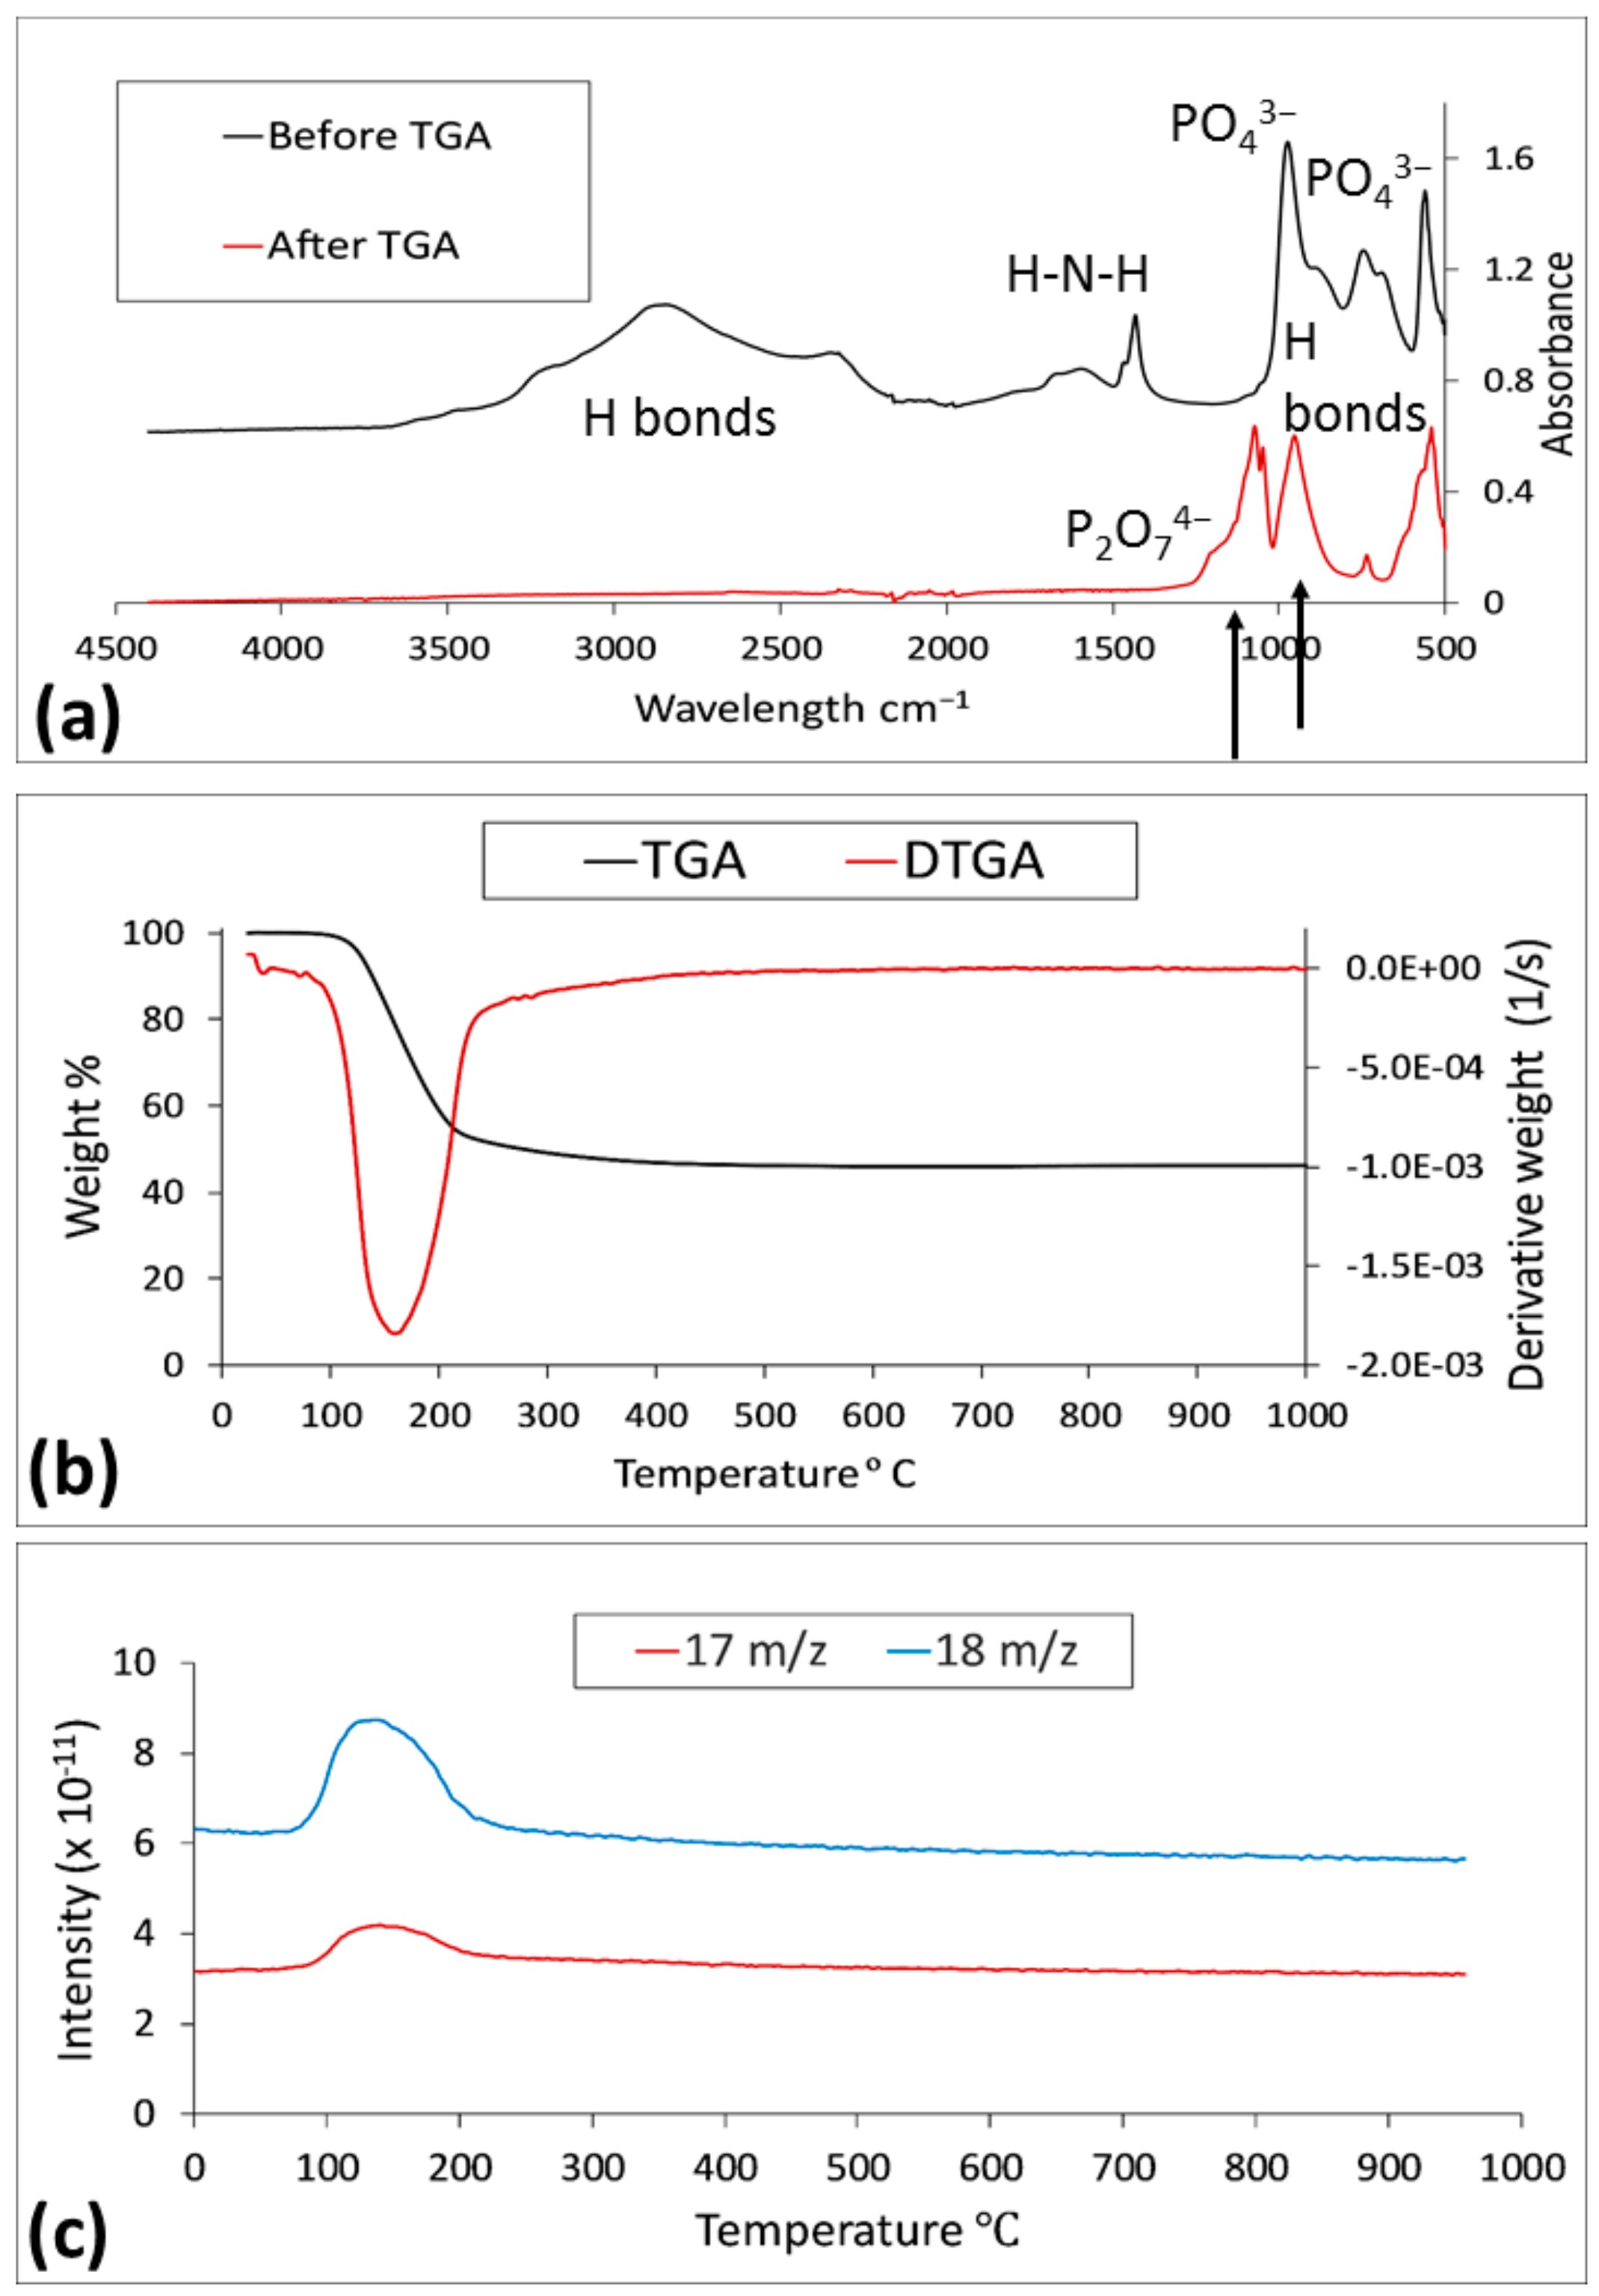
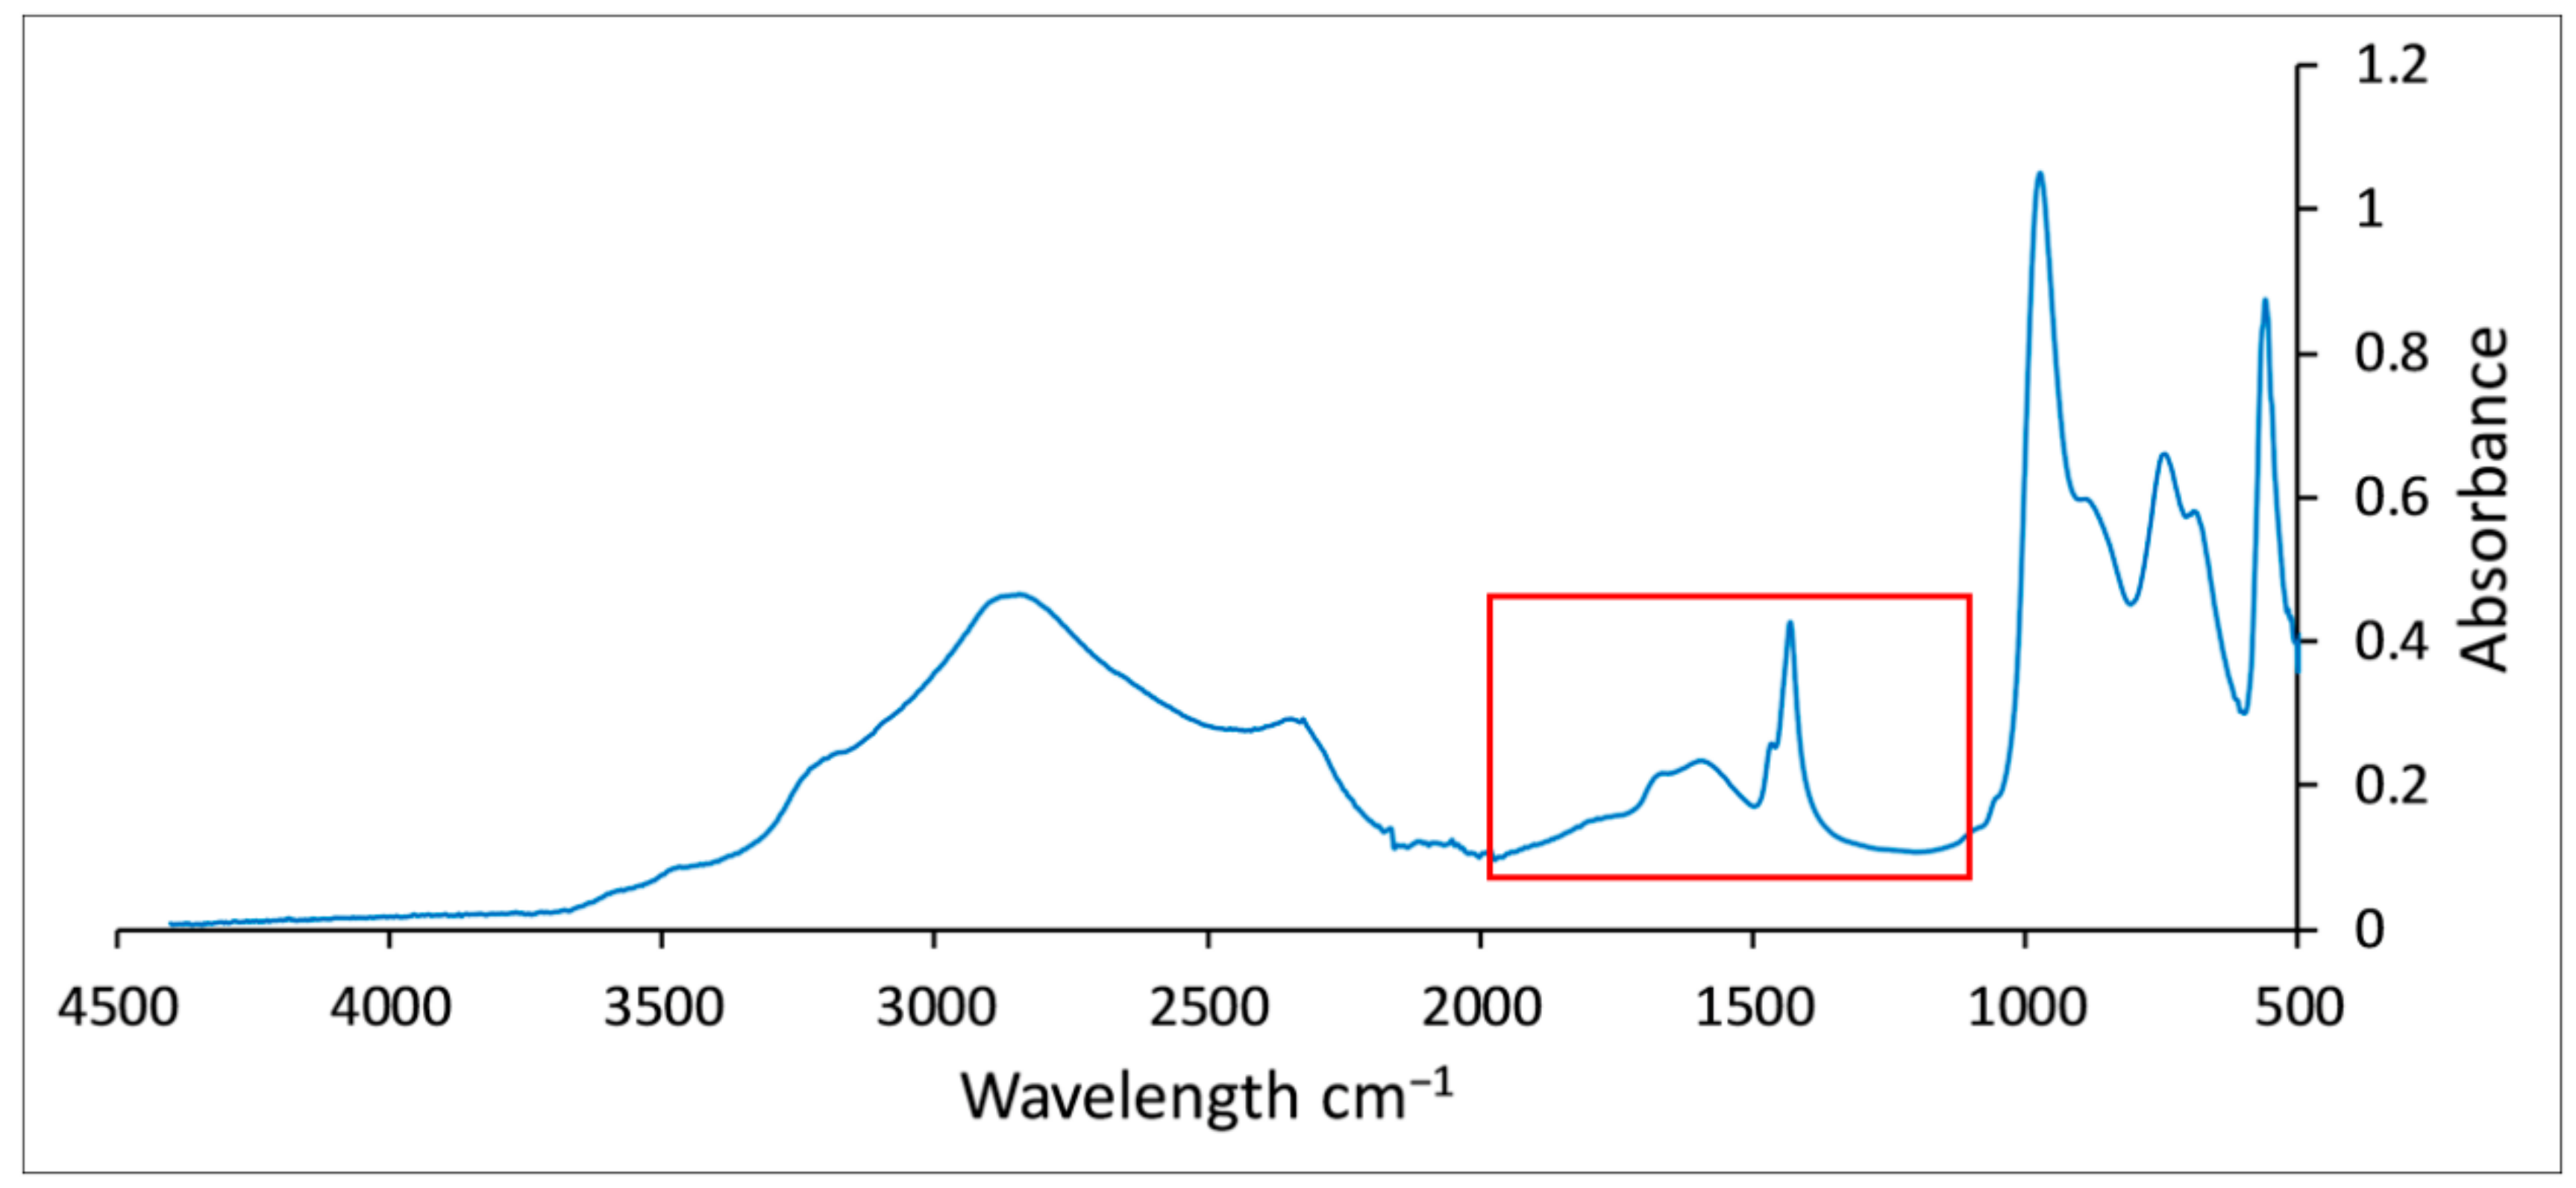
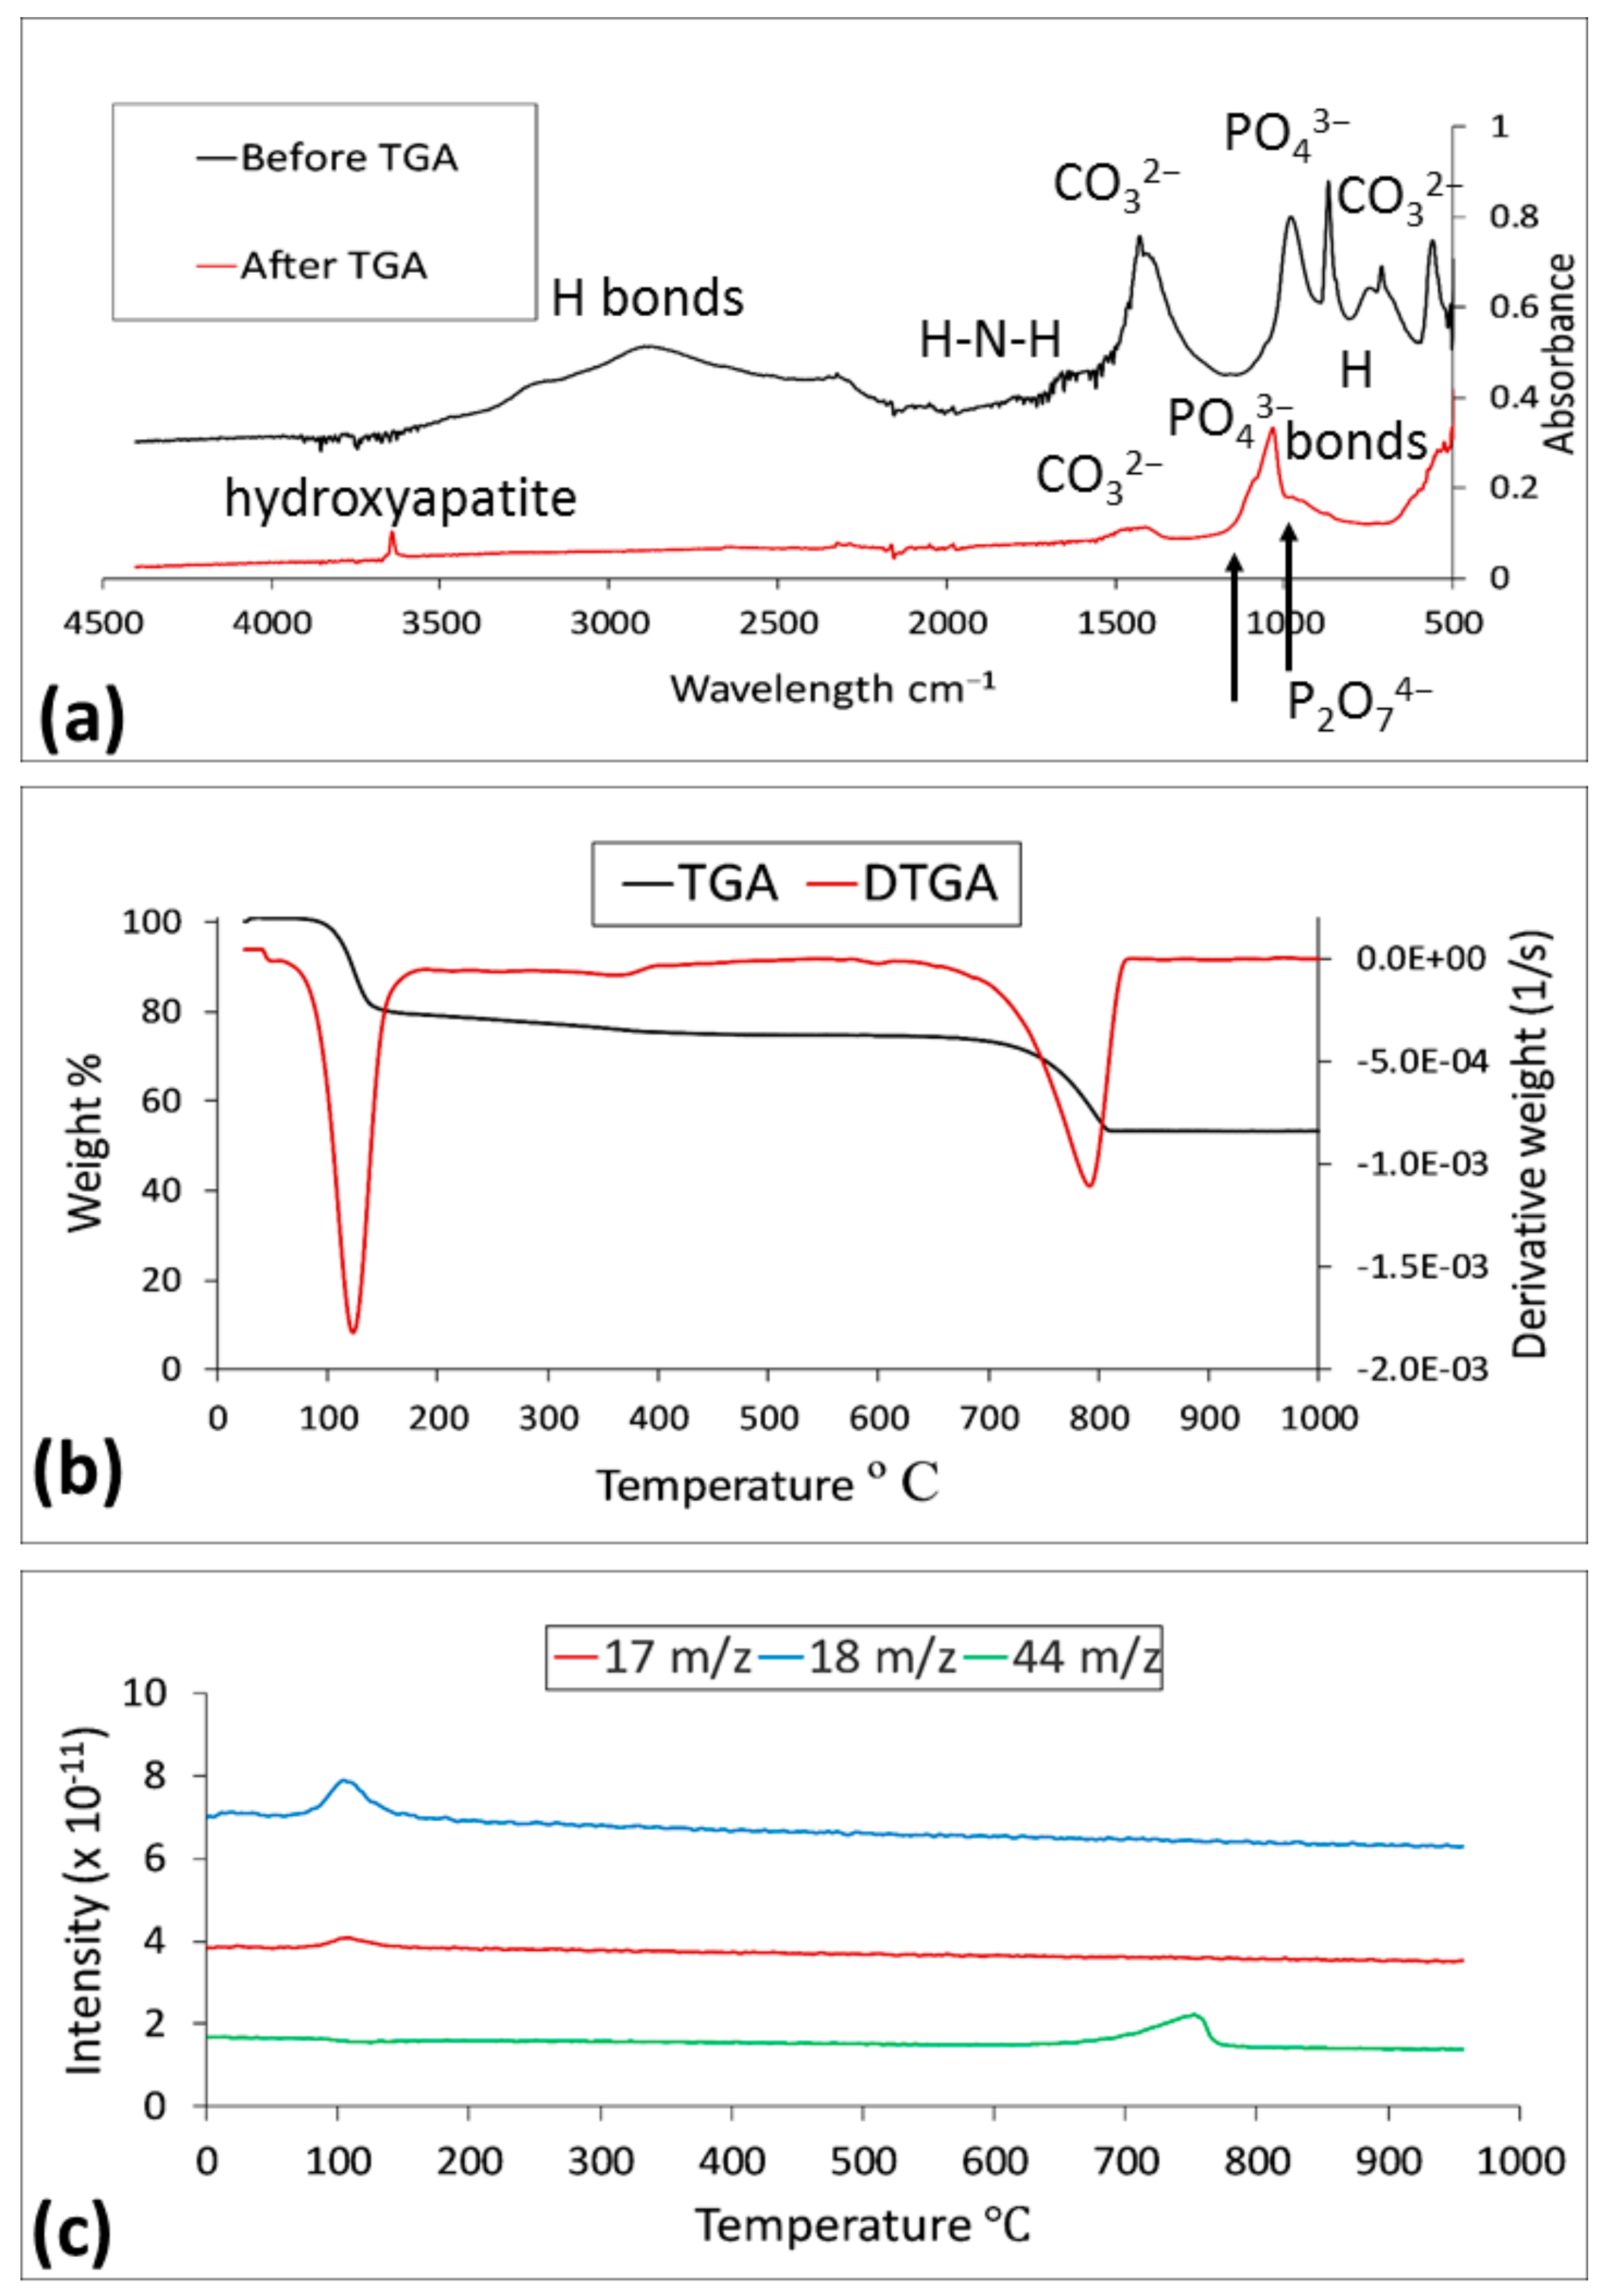
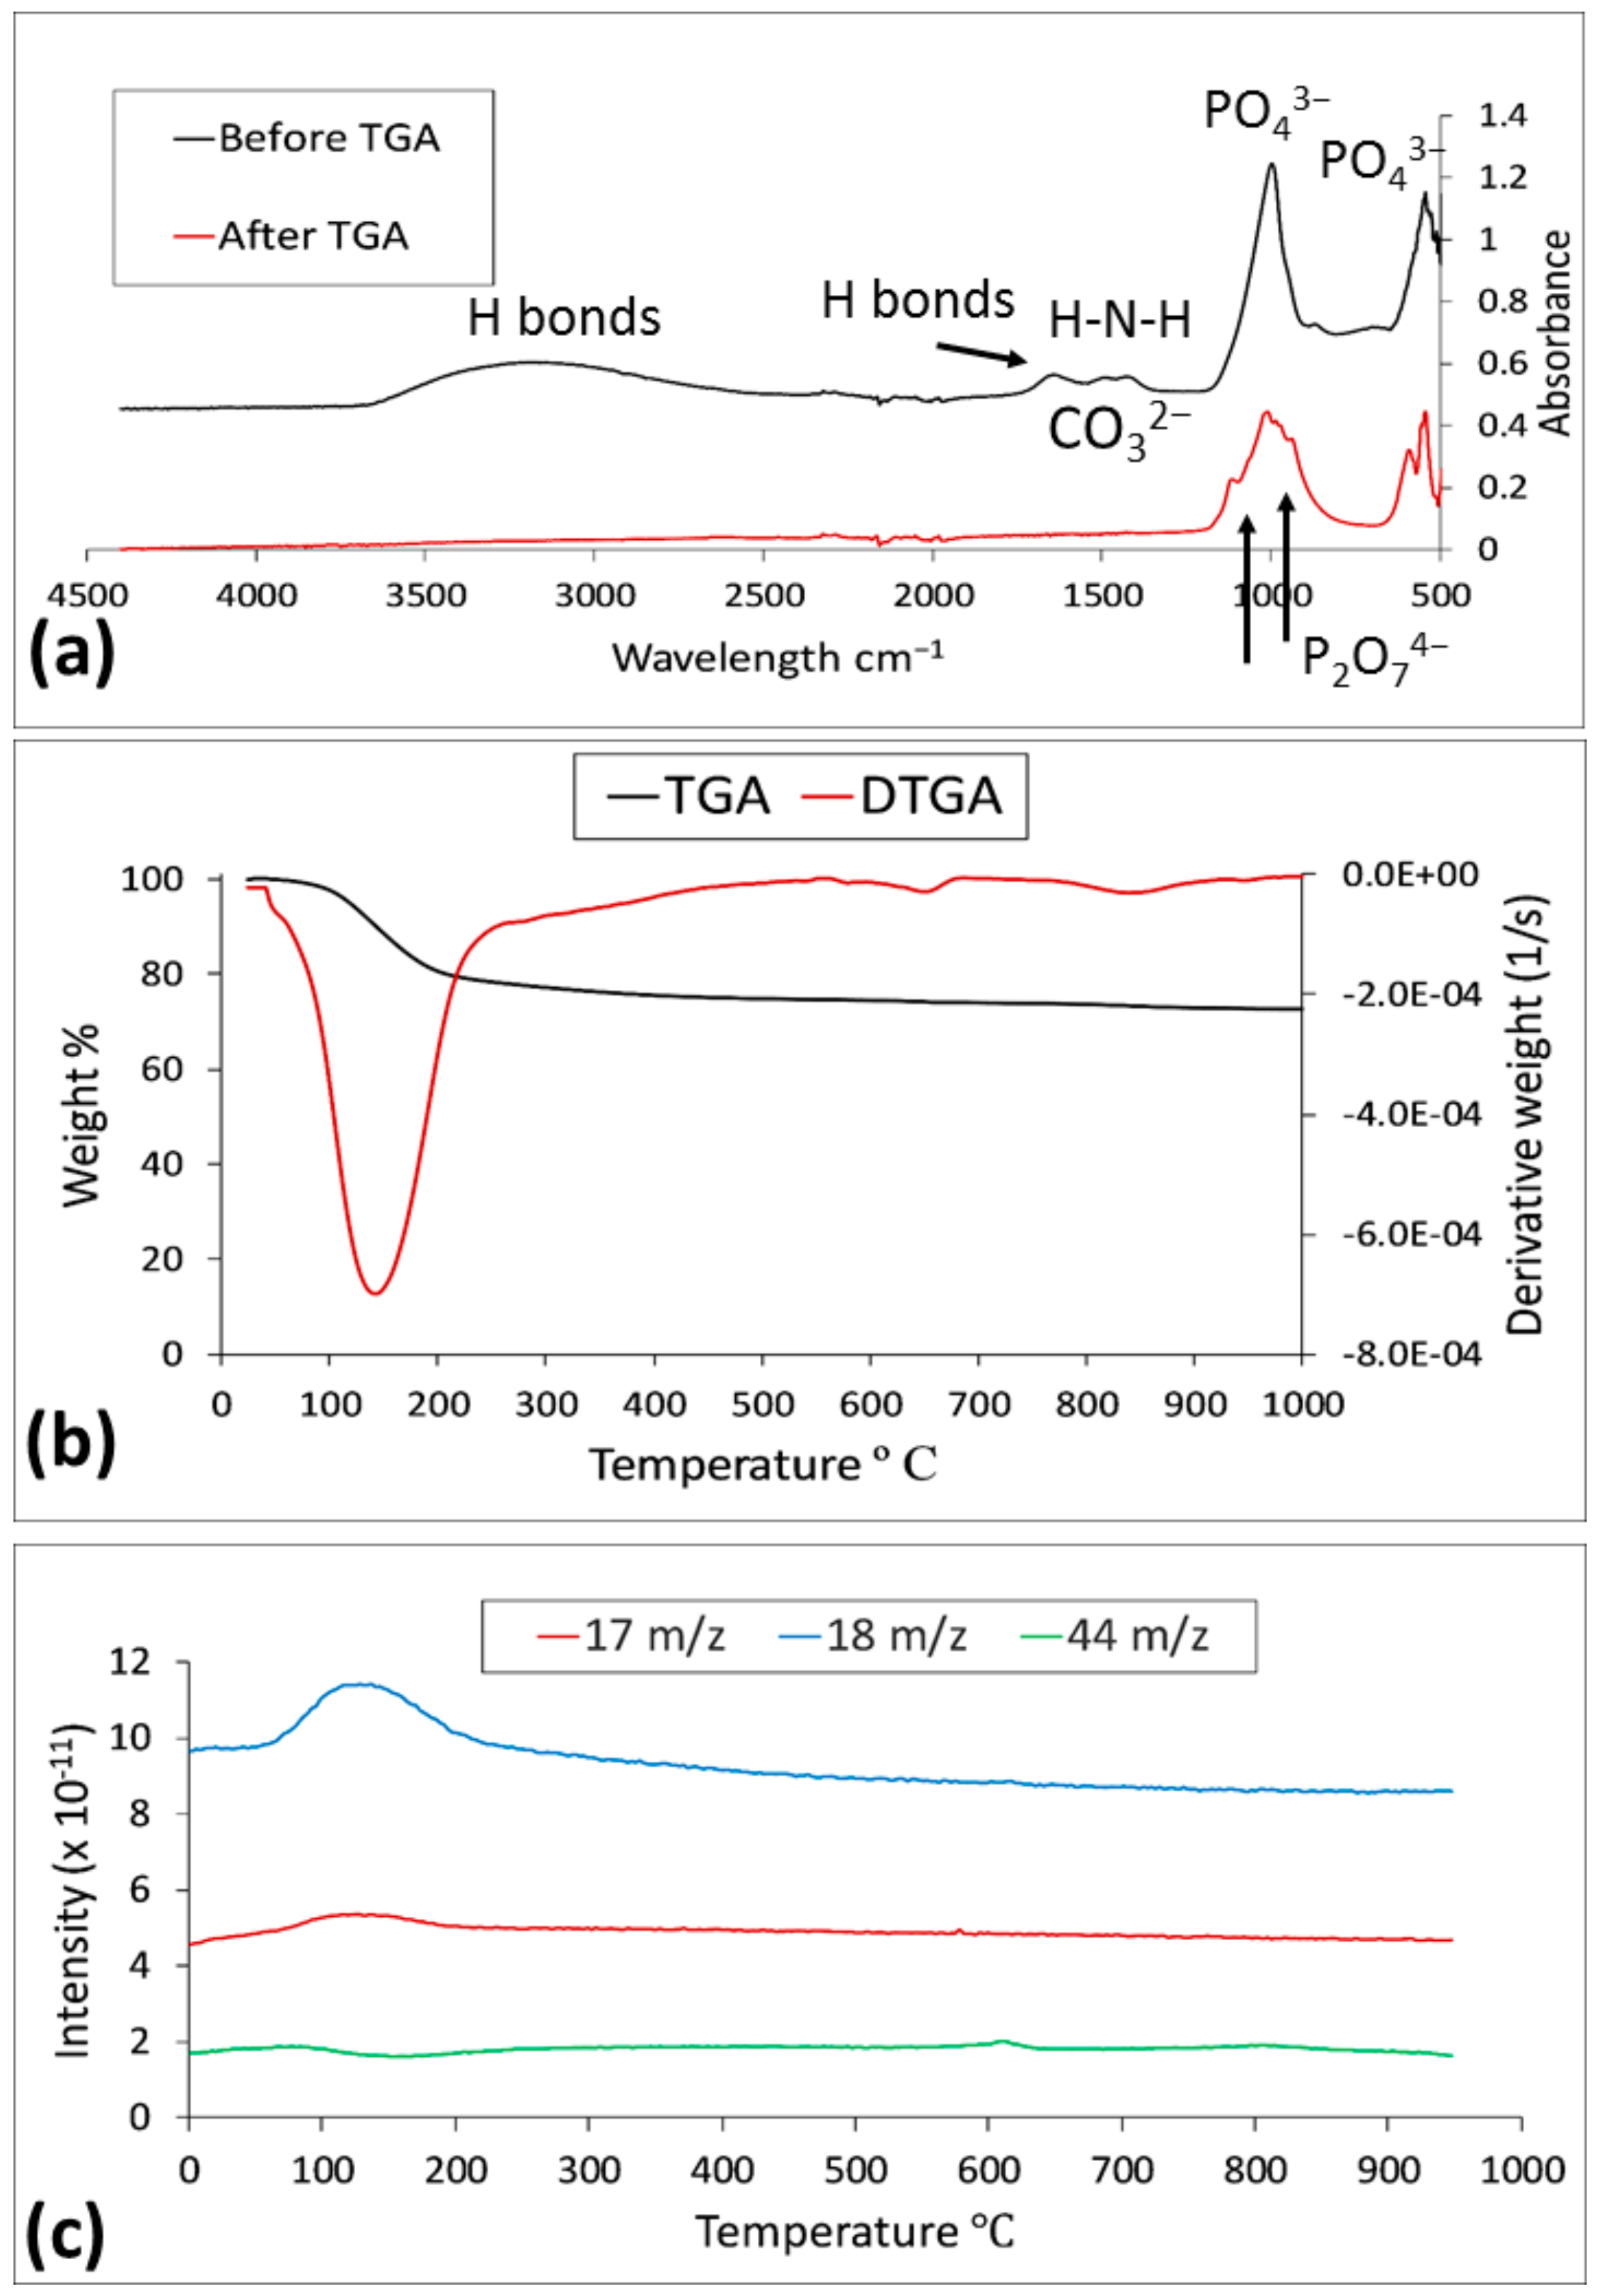
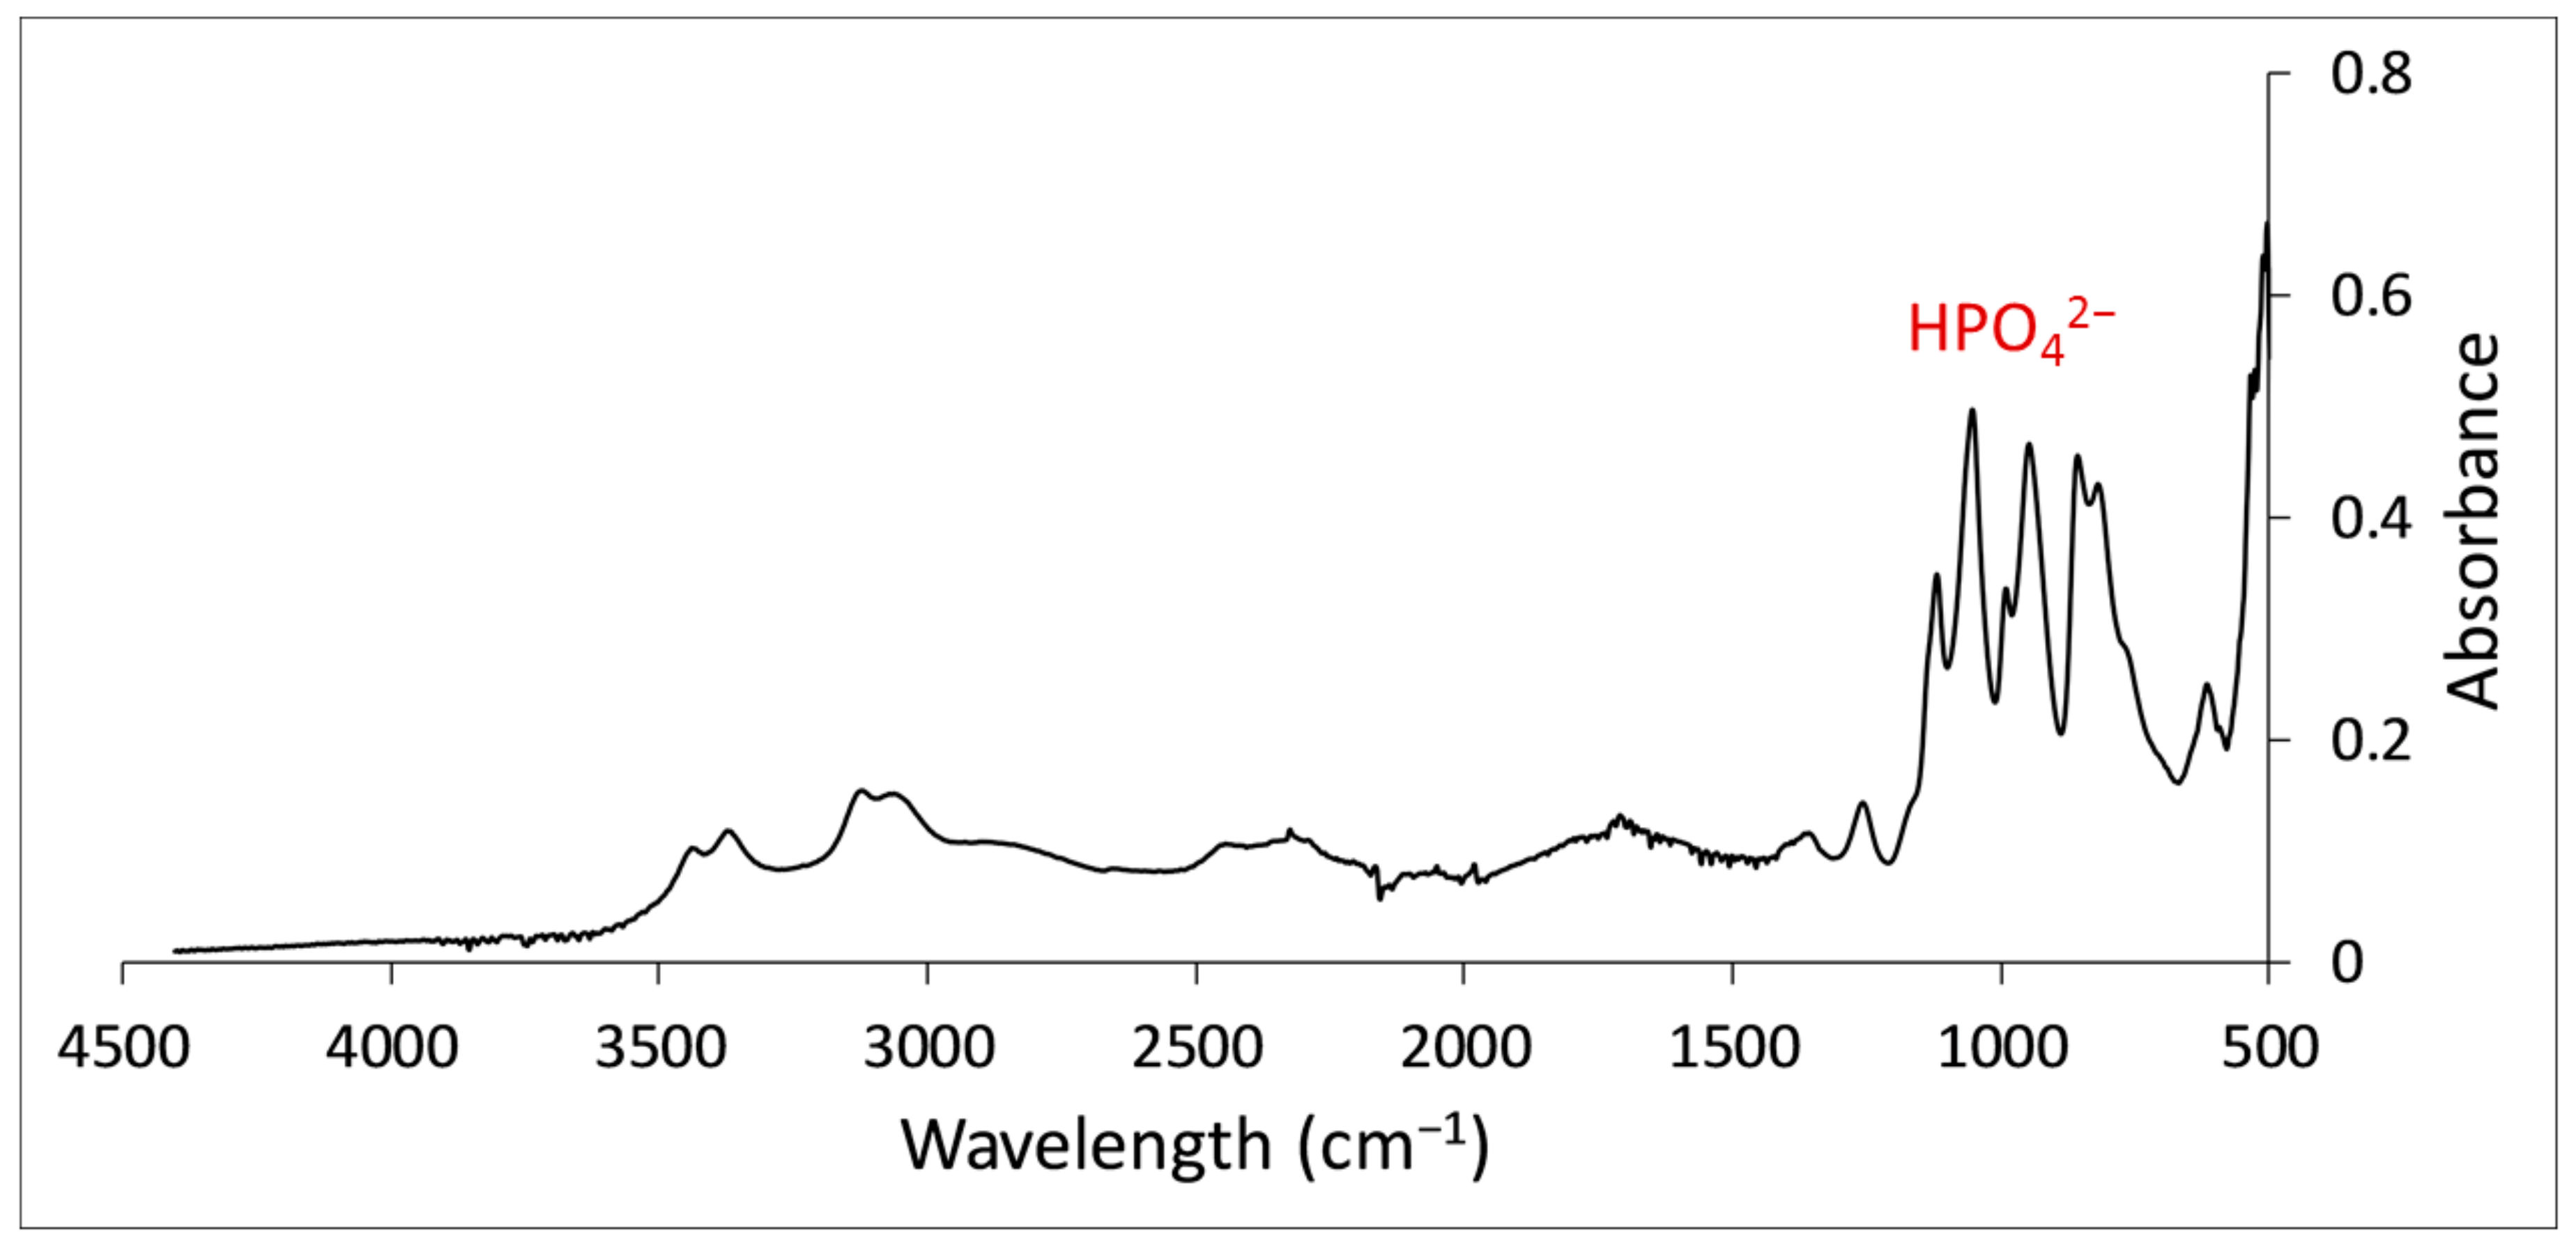
3.3.2. FTIR Analysis Results
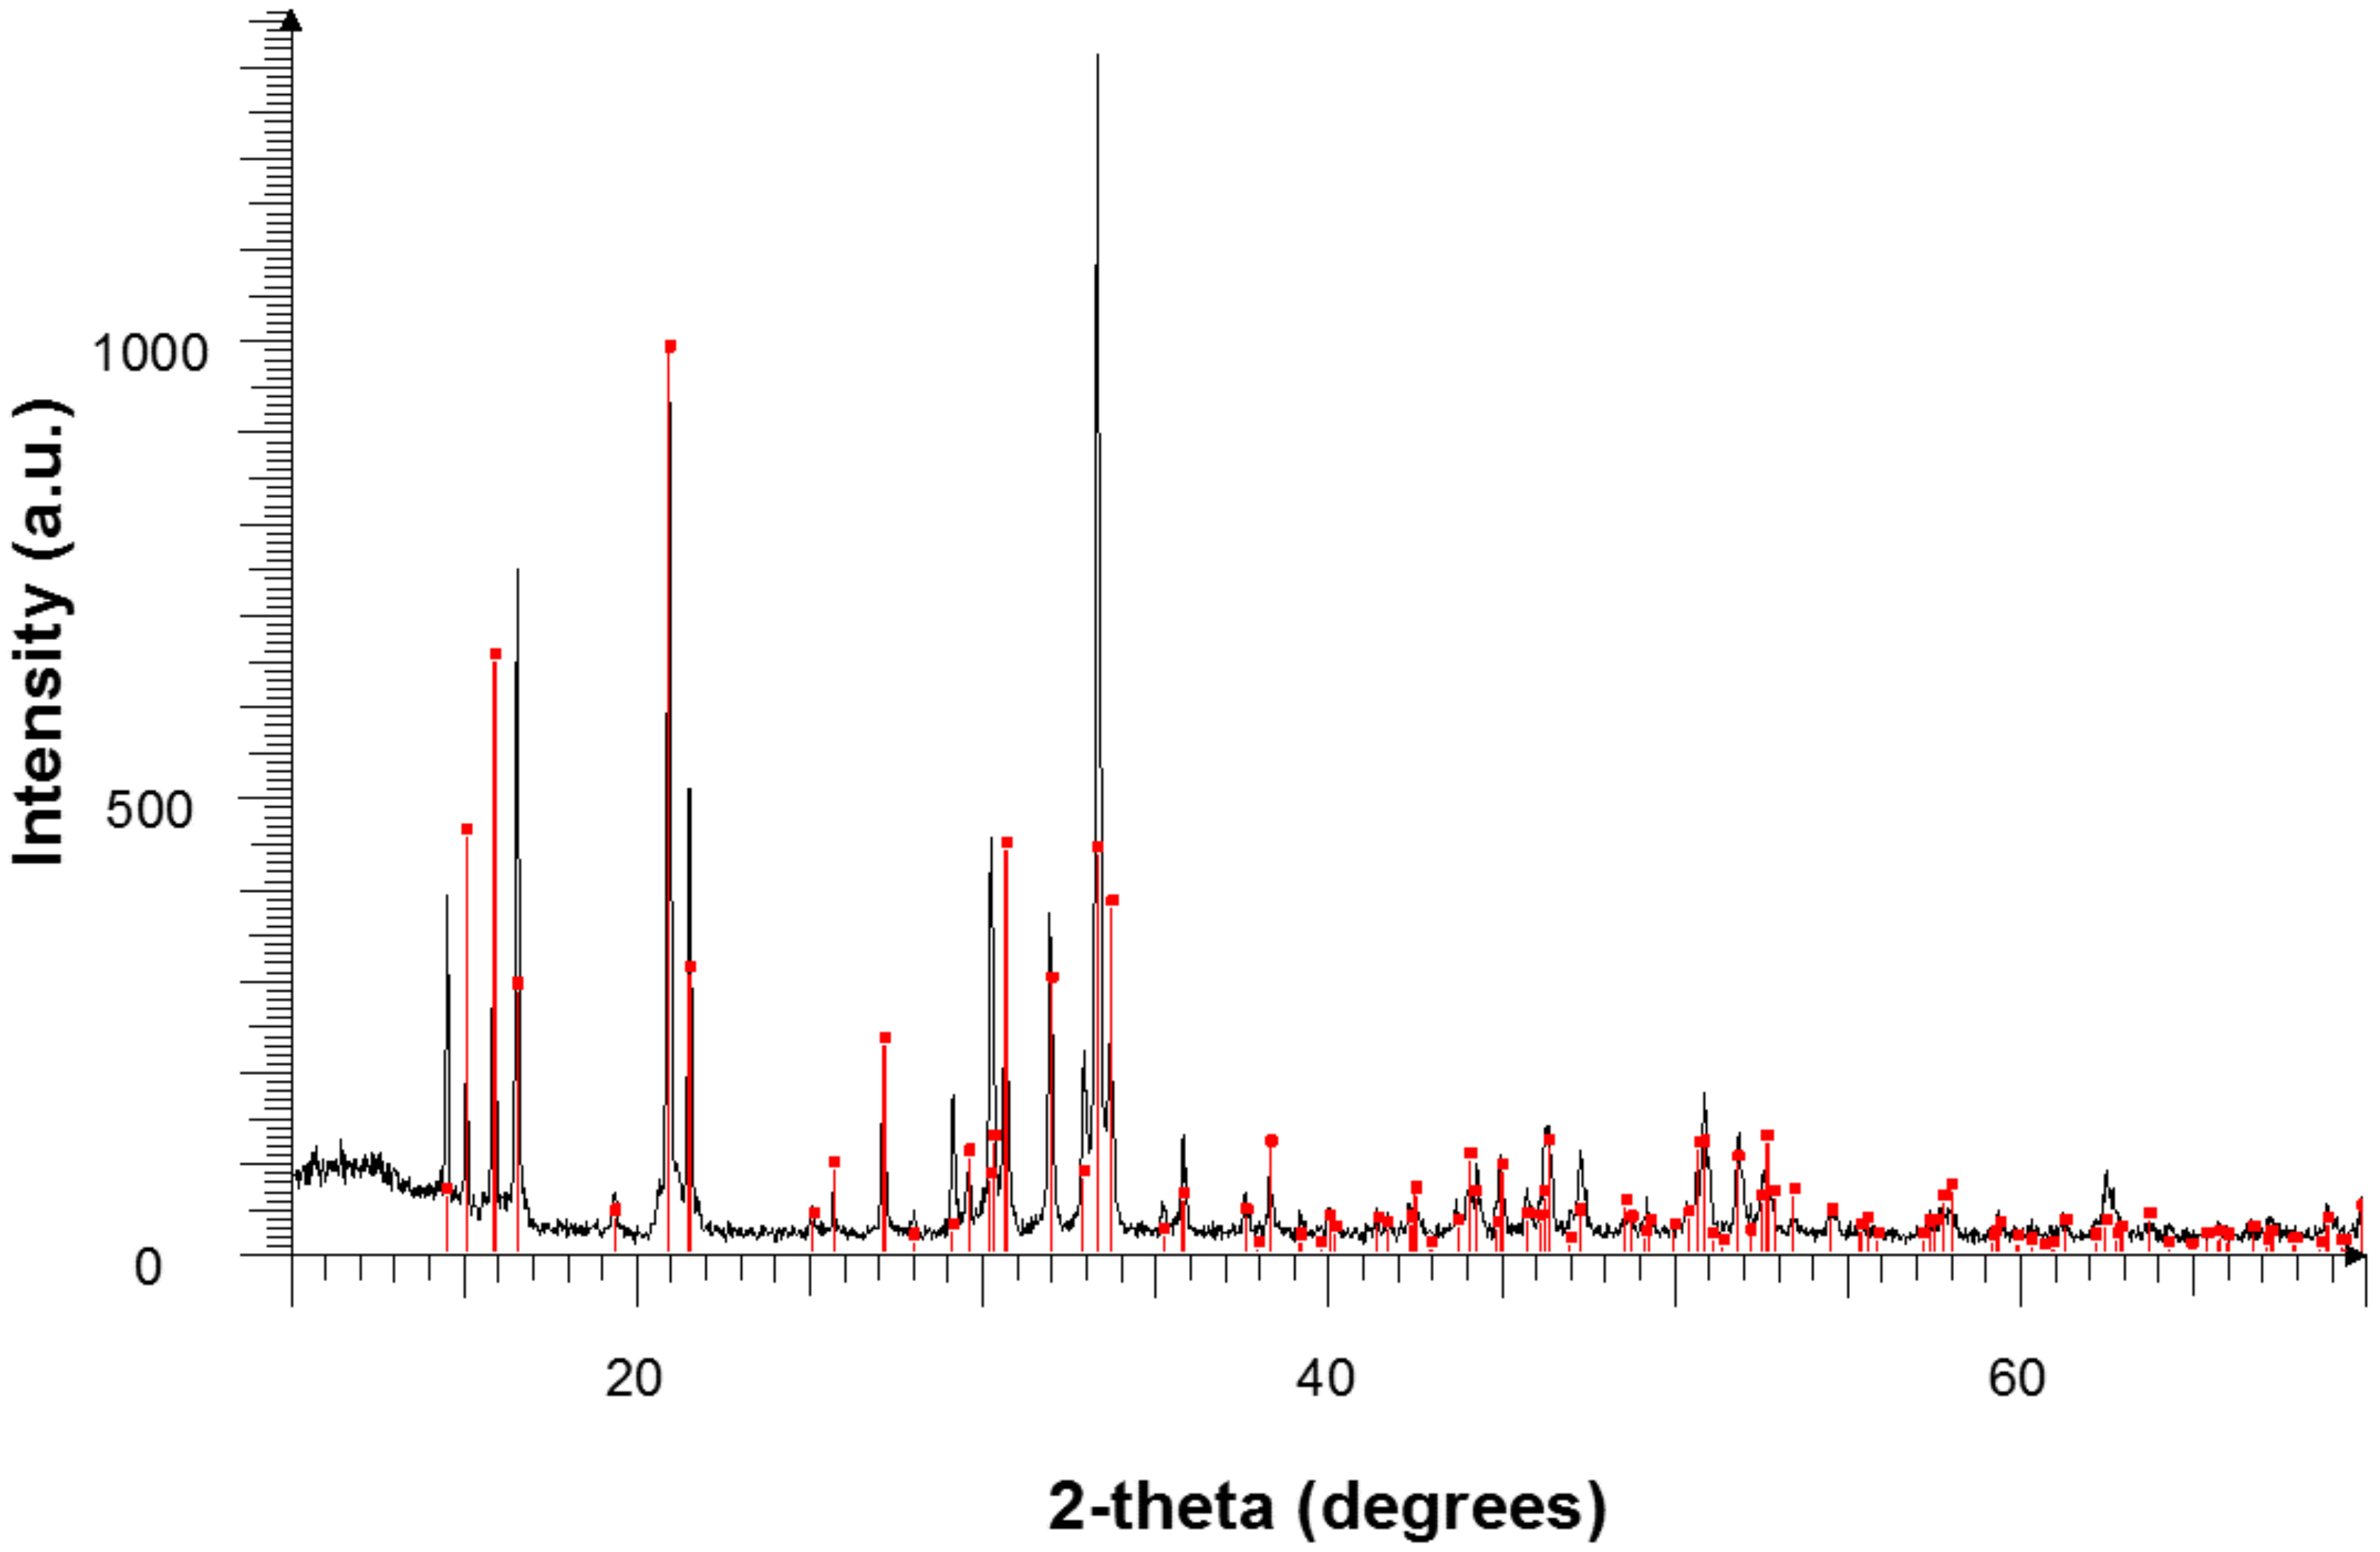
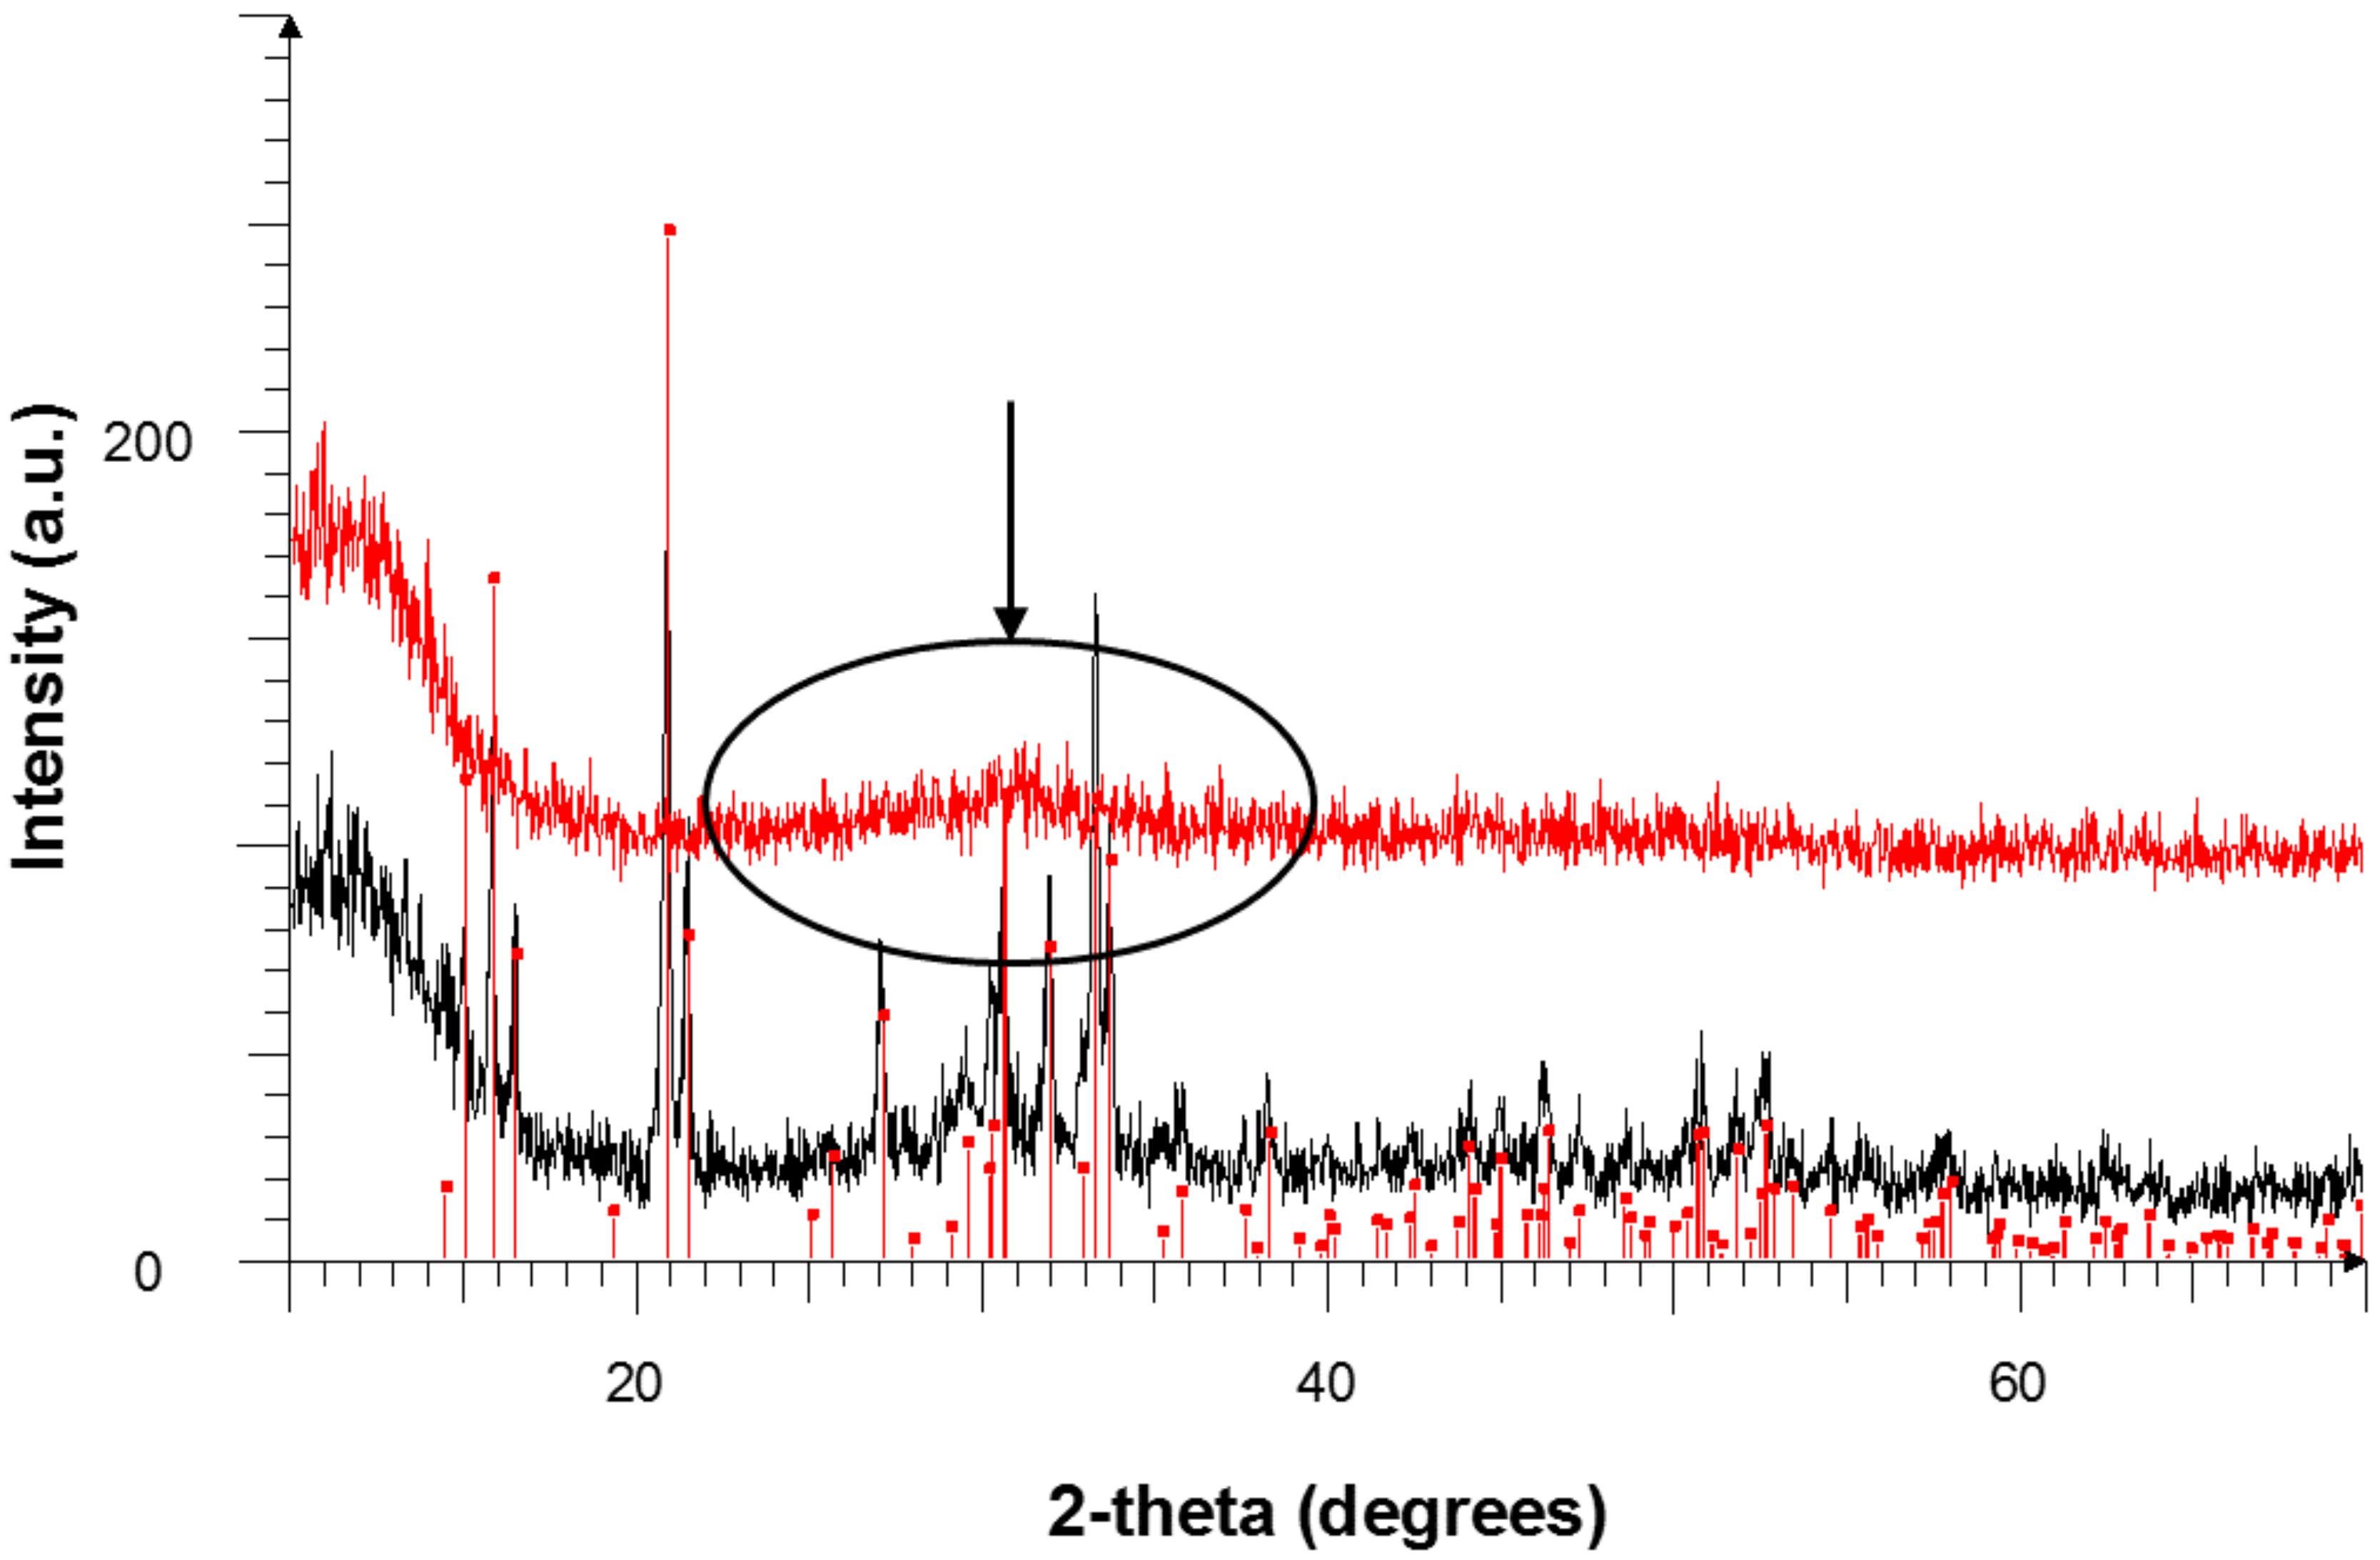
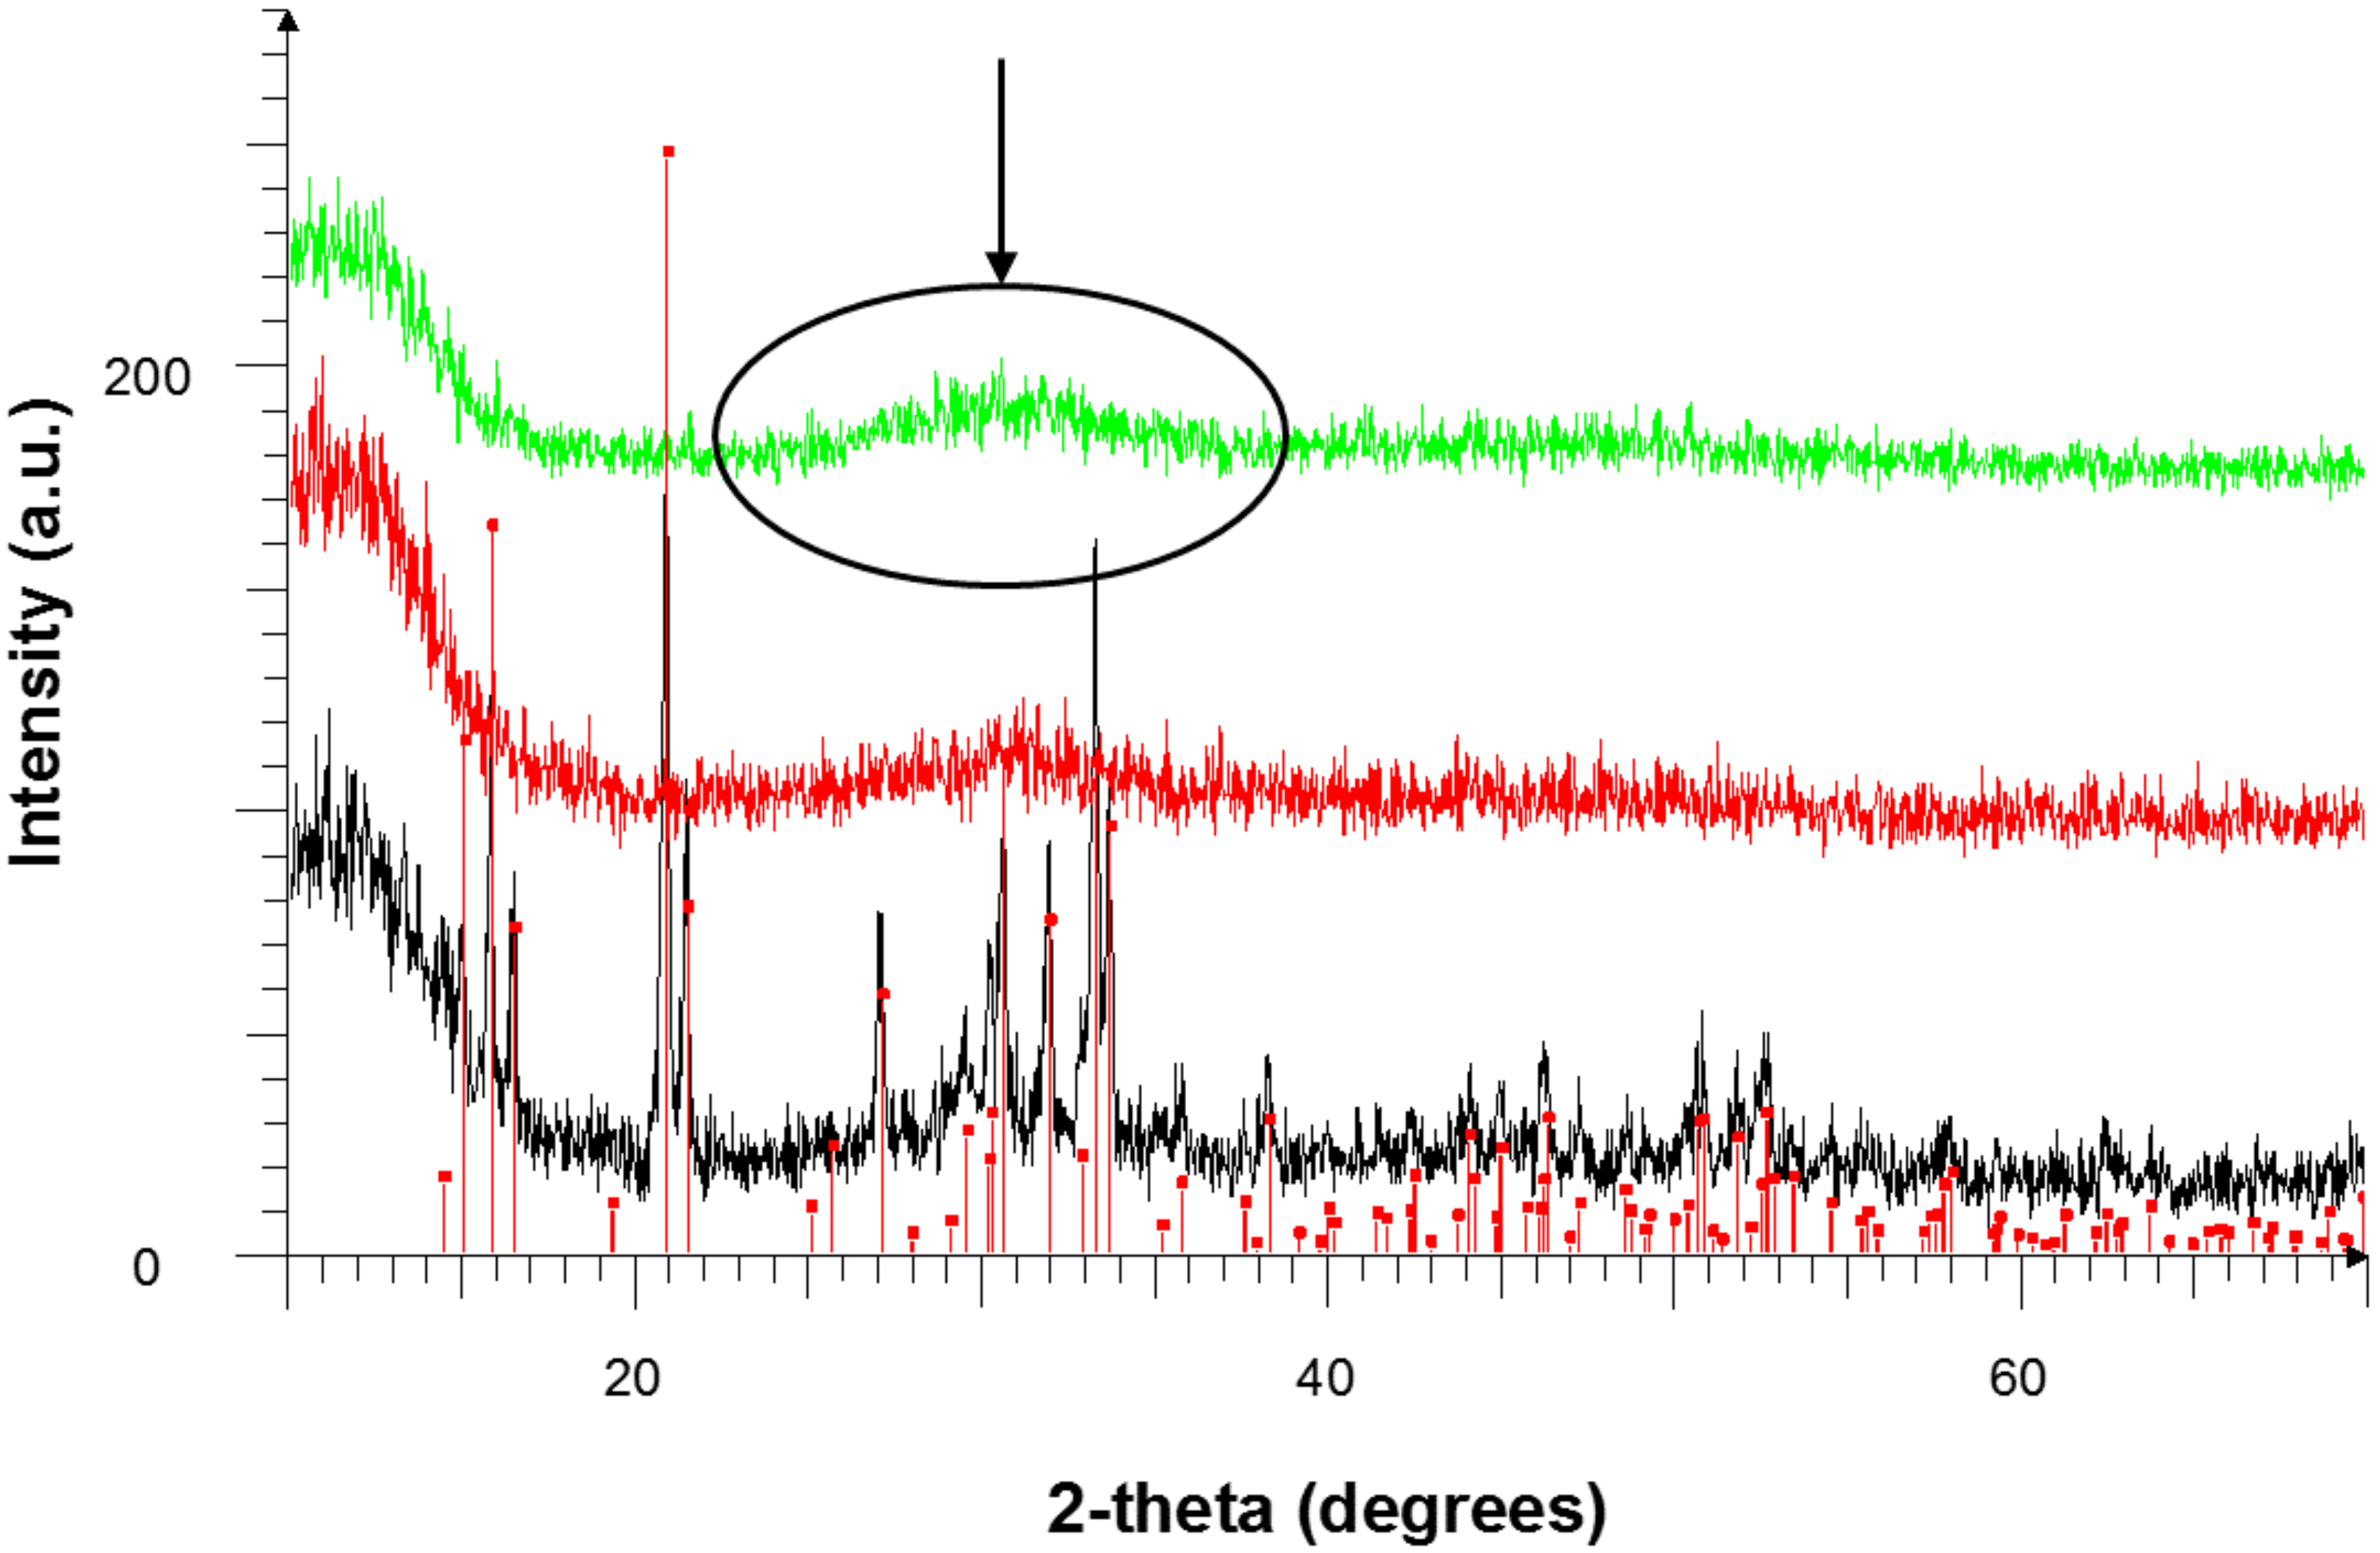
Between all the associated peaks of struvite constituents in an FTIR spectrum, those assigned to H-N-H bonds are the most important, as they can directly confirm the presence of struvite in final precipitates. This is because there is no other major solid phase containing the ammonium ion in the system, while phosphate peaks could be related to ACP as well. Therefore, at this point we focused on a very specific range of the FTIR spectrum between 1200 to 2000 cm−1 (Figure 9, red rectangle) to compare the results of different experiments.
Table 4 shows the FTIR spectra of precipitates from different runs of experiments at different pH levels and molar ratios. The phosphorus removal percentage for each test is also reported in the table. The only experiments resulting in direct evidence of struvite presence based on FTIR analysis between 1200 and 2000 cm−1 were those at pH 8.5 and 9.0, and ionic molar ratios of Mg2+:NH4+:P equal to 5:5:1. These experiments produced spectra quite similar to those of the synthetic struvite obtained initially. The highest P removal percentages were related to the experiments carried out at pH = 9.5; however, at this level of pH, there is no evidence of struvite precipitation based on FTIR analysis, which could suggest the possibility of obtaining a mix of struvite, ACP, and calcite precipitates. It can also be concluded that to obtain significant amounts of struvite in the final precipitates, identifiable directly from FTIR analysis spectra, addition of both Mg2+ and NH4+ sources was necessary. The results of the experiments with addition of only Mg2+ or only NH4+ did not suggest the presence of struvite.
FTIR results and P removal percentages for those sludge samples without additions of Mg2+ and NH4+ are summarized in Table 5. There is no direct evidence of struvite precipitation for any of the experiments, suggesting that the initial ionic molar ratios in the wastewater sludge are not sufficient for significant struvite precipitation. While at pH = 8.5 and 9, it can be concluded that final precipitates are a mix of struvite, ACP, and calcite, at pH = 9.5. FTIR analysis suggests that the major fraction of the precipitates could be calcite, due to the increased peaks of carbonate groups. Nonetheless, P removal percentage is increasing with the increase of pH, and P removal could reach up to 94%, even without the addition of Mg2+ and NH4+ sources to the sludge, although the final precipitates composition is not favorable in terms of struvite production.

3.3.3. XRD Results

Figure 10 shows the result of XRD analysis on final precipitates for four samples. The horizontal axis represents (2× theta), where theta is the angle between the incident beam and crystal plane. Red dots represent the peaks of synthetic struvite. The black line represents the results of the test with molar ratio 5:5:1 at pH = 8.5, where there was evidence of struvite precipitation. The line matches quite well the peaks of struvite shown by XRD, which is a further confirmation of struvite precipitation in this test. The red line is related to the test with molar ratio 3:3:1 at pH 8.5. The only obviously detectable detail in this line is the broad peak at around x = 30 (see circle in Figure 10), associated to the amorphous P forms (ACP) [44]. Representing peaks of struvite are not observable.

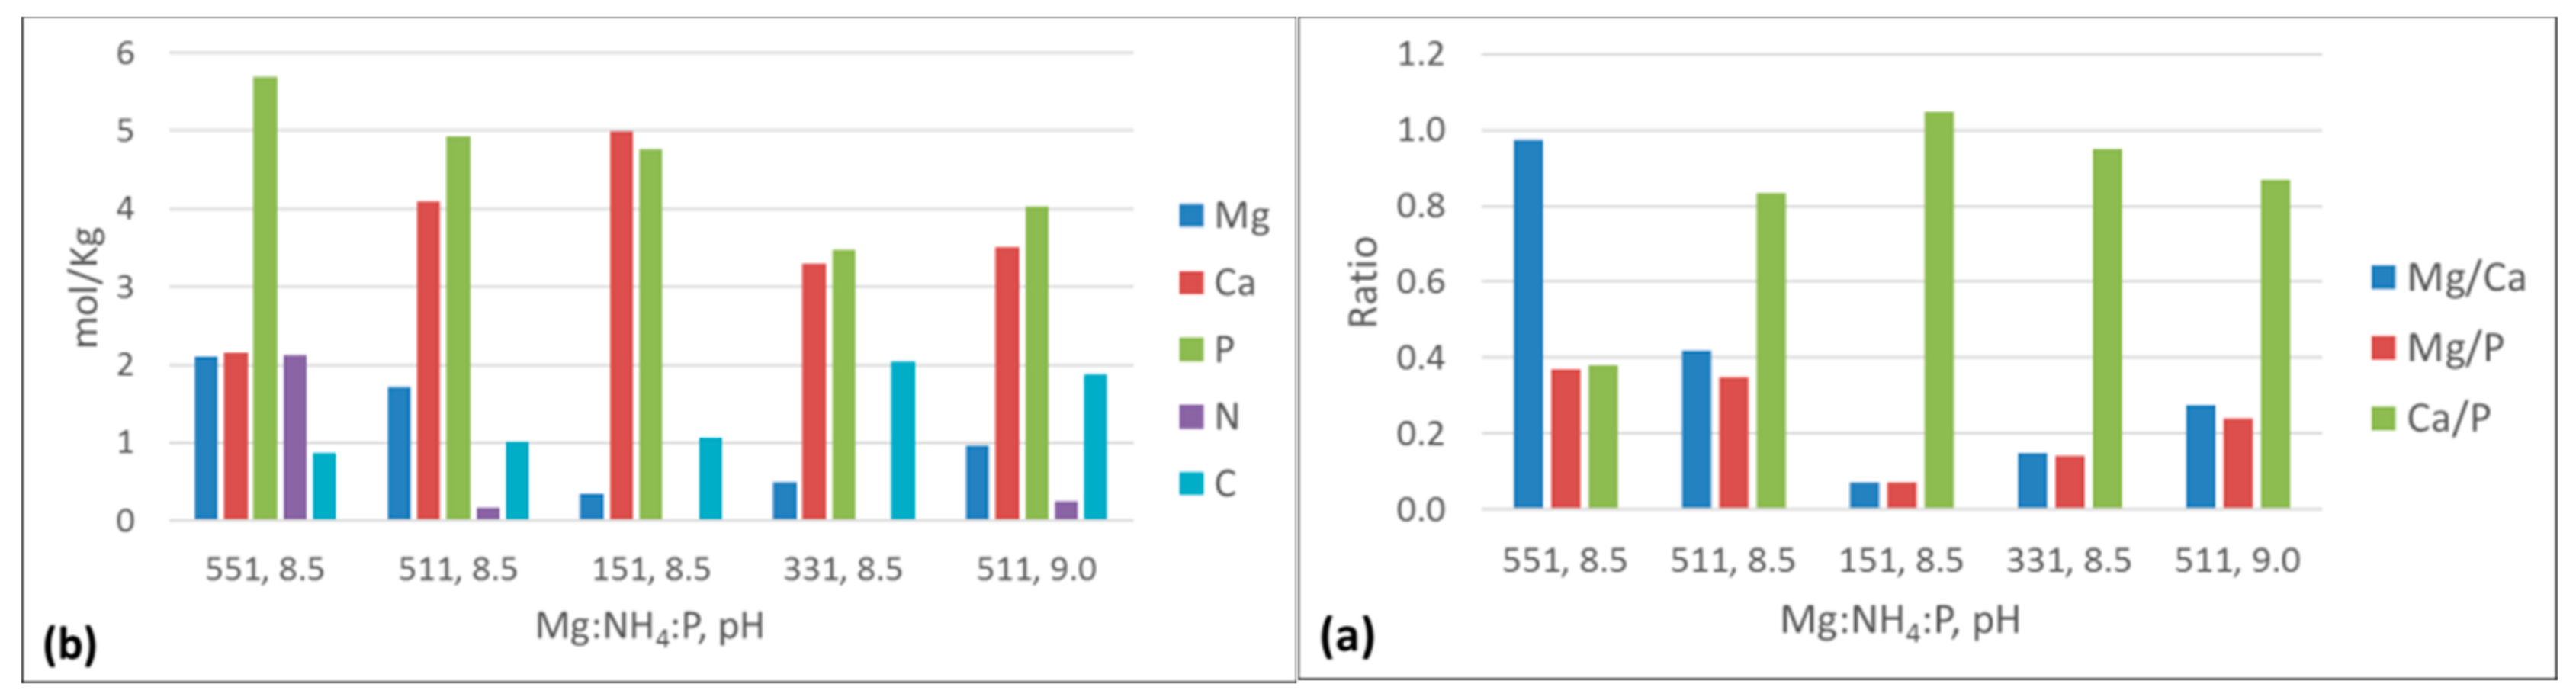
3.3.4. ICP-AES and Elemental Analysis Results

The results of the ICP-AES and elemental analysis are reported in terms of Mg2+, Ca2+, P, Nitrogen (N), and Carbon (C) molar contents. Figure 11 shows molar ratios (Figure 11a) and contents (Figure 11b) of the elements in the final precipitates for 5 selected experiments: the first three are those with the 5:5:1, 5:1:1, and 1:5:1 molar ratios at pH = 8.5, the fourth represents the one with 3:3:1 molar ratio (same pH), and the fifth one is for the 5:1:1 ratio at pH = 9. Comparing the first three, it can be seen that as we shift ratios from 5:5:1 to 1:5:1, there is a substantial decrease in Mg2+ content, which suggests a reduction in struvite precipitation, while there is little difference between tests with ratios 5:5:1 and 5:1:1. Since N content is very small for test 5:1:1, it can be concluded that the Mg2+ content in this precipitate is probably related to Mg2+ impurities (in the form of bobierrite or Newberyite), and is not due to significant struvite precipitation. This can be also confirmed by the fact that Mg2+:P ratios were very similar between the two experiments. Furthermore, as we moved to the 1:5:1 ratio test, a noticeable increase was visible for the Ca2+:P ratio, related to the calcite precipitation, also confirmed by the FTIR results. In conclusion, adding only NH4+ to the system was not very effective to induce struvite precipitation, as the major parts of the precipitates were ACP (high, similar Ca2+ and P molar content) and calcite (slightly higher Ca2+ with respect to P, and higher C molar content).
The comparison of experiments with 5:5:1 and 3:3:1 ionic rations at pH = 8.5 indicated that relatively high molar ratios are required for Mg2+ and NH4+, since there is little Mg, and nearly zero N content, substantially lower Mg2+:Ca2+, and higher Ca2+:P ratios in the test characterized by molar ratios 3:3:1. The second and fifth experiments, characterized by equal molar ratios of 5:1:1 and different pH levels of 8.5 and 9 were not very different. Obviously, as pH increased, there was lower Mg2+ content, thus lower struvite precipitation. Still, there were high P and Ca2+ contents in both situations, and higher C at pH = 9, which was due to greater calcite precipitation in this experiment.
ICP-AES results for experiments without any additives, and only NaOH dosage as pH adjustment (Figure 12), indicated that although the Mg2+ content increases from pH = 8.5 to pH = 9.5, it is still dramatically lower than P and Ca2+, and there is very little N component in all the precipitates. This suggests that struvite precipitation is almost non-existent in these conditions. Ca2+:P ratio increases with pH increase, and in all cases is higher than 1. This is due to calcite precipitation, also confirmed by FTIR results.
Le Corre et al. [45] suggested that to obtain effective struvite precipitation, the Ca2+:Mg2+ ratio must be below 1. In this system, struvite precipitation was observed in experiments with Mg2+:NH4+:P molar ratio equal to 5:5:1 at pH = 8.5 and 9.0, with Ca2+:Mg2+ ratio of 0.39. In the cases where only ammonium was added to the solution, this ratio was 1.95. Although, struvite precipitation was lower in these runs, it was still observed. This can explain the idea that struvite could be precipitated with sufficient amounts of ammonium even with higher Ca2+:Mg2+ ratios [46], as was the case in the mentioned experiments.

3.4. Using Ca(OH)2 as pH Adjustment Reagent

Table 6 shows the results of the experiments in which Ca(OH)2 was used as pH adjustment reagent: This is in fact less expensive than NaOH, and the possibility of routinely using it would not only make the process cheaper but would also be beneficial for struvite precipitation. As can be seen from Table 6, P removal percentages are notably higher in these tests, compared to the previous ones. At pH = 9.5, up to 99% P removal, could be reached, which is remarkable. This is because more Ca2+ in the system promotes calcium phosphate compounds precipitation; however, FTIR results indicate that there is no direct evidence of the presence of struvite in the precipitates. In fact, at pH = 9.5, there is substantial growth of carbonate groups peak intensity at around 1400–1500 cm−1, suggesting that the addition of Ca(OH)2 will lead to a mixture of struvite, ACP, and calcite precipitation (small amounts of struvite and calcite, and large amounts of ACP) at lower pH, and mostly calcite-rich precipitates at higher pH.
XRD analysis results confirm this, as can be seen in Figure 13. The green line is related to the final precipitates of the test with 5:5:1 molar ratios using Ca(OH)2 for pH adjustment to 8.5. Additionally, the only clearly visible pattern is the broad peak at around x = 30 degrees (circle in the Figure), related to the amorphous P form (ACP). The peaks associated to struvite are not present in the XRD, as it can be determined by comparing the former to the black line (5:5:1 at pH = 8.5 with NaOH), and the red struvite-related points where they are clearly visible.
An analysis of the composition of these precipitates using ICP-AES and elemental analysis proves the results obtained above. Figure 14 shows Mg2+, Ca2+, P, N, and C content for three of the experiments: the ones at Mg:NH4:P molar ratio 5:5:1 at pH = 8.5, the one at 5:5:1 molar ratio at pH = 9, and the one at 3:3:1 molar ratio and pH = 8.5. It can be concluded that the major fractions of the precipitates, in all these cases, are ACP and calcite, due to high P and Ca2+ content and a small amount of Mg2+. The amount of N was also very low or nearly zero in these tests. The second test showed higher Ca2+ content than P, this suggested that at higher pH levels there was a higher possibility of calcite precipitation. Mg2+:P and Mg2+:Ca2+ ratios were considerably low for all experiments comparing with the Ca2+:P ratio, due to lower precipitation of struvite in these runs.
It can be concluded that using Ca(OH)2 as a pH-control reagent is not favorable for struvite precipitation, since in none of the experiments significant struvite was obtained in the final precipitates. However, maintaining the pH level at 8.5 will result in a precipitate consisting of a small amount of struvite and a high ACP content. This could be considered as a positive, alternative solution, as ACP could still be used in the fertilizer industry due to their acceptable phosphate content, despite having lower solubility compared to pure struvite [47]. As the pH increases to 9 and beyond, calcite precipitation is highly affecting the impurity of the precipitates and their recycling potential.

4. Discussion

4.1. Effect of pH

Phosphorus removal by phosphate precipitation showed satisfactory results. This process was able to remove phosphorus from the liquid phase of an aerobic sludge by up to 94% at pH = 9.5, when using NaOH as pH adjustment reagent. However, at this level of pH, the process was highly affected by precipitation of solid phases other than struvite, and in one case at pH = 9.5, there was direct evidence of struvite precipitation. At pH = 9.0, up to 85.8% of P removal was observed using NaOH for pH adjustment, which is still a notable result. At pH = 8.5 and 9.0, experiments with 5:5:1 Mg:NH4:P molar ratio showed direct evidence of struvite precipitation. This showed that optimal pH value for struvite precipitation was likely in the range of 8.5–9.0, and that for pH > 9.0, the possibility of struvite precipitation, compared to the other salts, was significantly diminished. Although struvite precipitation was observed optimally, even at higher pH values in different studies [48,49,50,51], the optimal pH range was dependent on wastewater characteristics and other operating conditions [52,53]. While struvite precipitation is limited at higher pH values, phosphorus removal is always increasing with an increase of pH, and in all cases its concentration decreases rapidly after the reaction begins [54]. pH tends to diminish following the crystallization process due to the release of H+ in the solution, based on the crystallization reactions (Equations (2) and (3)) [45,52].

4.2. Effect of Ca:Mg and N:P Molar Ratios

Comparing these results to those for the anaerobic digestion sludge, showing instead presence of struvite in the final precipitates at stoichiometric molar ratios, it can be concluded that using aerobic sludge for phosphorus recovery in the form of struvite is not as effective as using anaerobic sludge, which has been the target of most previous studies. This is probably due to the considerably higher initial ammonium content of anaerobic sludge, and to its lower Ca:Mg ratio compared to the former (i.e., 1.1 compared to 2.5). The 2.5 Ca:Mg ratio in the aerobic sludge sample makes struvite precipitation very difficult to occur, since final precipitates will mainly contain calcium phosphate compounds [55]. P removal at pH = 8.5 increased from 49.7% to 65.1% by increasing the Mg:NH4:P molar ratios from 3:3:1 to 5:5:1. Higher Mg2+ content meant a lower Ca:Mg ratio. Any increase in the Ca:Mg ratio will lead to lower magnesium precipitation and higher calcium precipitation [54], and it leads to reaction of Ca2+ with phosphate and carbonate in the solution [45]. Higher N:P ratios also promote struvite precipitation instead of calcium phosphate [48]. A high NH4+ concentration increases the solution buffer capacity, thus improving struvite precipitation, since this happens at lower pH levels than that of calcium phosphate [48,56,57,58].

4.3. Using Ca(OH)2 for pH Adjustment

The need for dosing NaOH as pH buffer is one of the main obstacles that may render the struvite precipitation process not economically sustainable in full-scale applications. Instead, the use of the more economical Ca(OH)2 could be considered an alternative to implement P recovery with significantly lower cost, at the expense of obtaining a fertilizer product of lower efficiency. Switching to Ca(OH)2 as a more economic pH buffer proved not to be very efficient in terms of improving pure struvite precipitation. However, it led to the recovery of alternative precipitates, rich in ACP. Results showed great potential for ACP precipitation using Ca(OH)2:P, where recovery reached 99% at pH = 9.5, which, considering an initial Ca:P ratio of 1.95, was a result fully consistent with previous literature [59,60]. At pH below 9, recovery of 89.5% was achieved. If pH increased to more than 9, precipitation of calcite as an impurity significantly affected the quality of final precipitates. ACP is considered a fertilizer, with characteristics depending on specific wastewater conditions, and applicability depending on site of application soil properties. Muster et al. [61] suggested that at initial Ca:P ratio < 0.8, the ACP’s precipitation process retention time would significantly increase. Considering the initial Ca:P ratio in this study (=1.95), the ACP’s precipitation retention time would be very efficient, and phosphorus concentration reduces rapidly after the onset of this reaction. Based on ICP and elemental analysis results, the Ca:P ratio in the final precipitates was very close to 1, even at higher Mg:NH4:P (5:5:1) molar ratios. Interestingly enough, when this ratio was reduced to 3:3:1, the Ca:P ratio in the final precipitates was almost 1, and the amount of carbonate in the final precipitates was not strongly influenced. Therefore, this could mean that even at lower Mg and NH4 addition to the system, an ACP-rich precipitate could be obtained at pH = 8.5 using Ca(OH)2.

4.4. Use of Final Precipitates as Fertilizers

Struvite precipitation was highly affected by the presence of Ca2+ as a competitive ion, and particularly by the competition of calcium phosphate compounds (mainly ACP) and calcite precipitation. It was observed that, to achieve significant struvite precipitation in tests with aerobic sludge, high amounts of Mg2+ and NH4+ addition would be needed, which unfortunately would make the process economically inefficient. In addition, the cost of adding NaOH, needed for pH adjustment was also relatively high [62]. Moreover, the cost of struvite precipitation is also dependent on the initial phosphate concentration in wastewater and increases considerably with concentration below 200–300 mg/L [46,63]. In most of the reported experiments, the final precipitates obtained were a mixture of struvite, ACP, and calcite, with the highest content for ACP. It was also determined through ICP and Elemental Analysis that precipitating aerobic sludge would lead to an ACP-rich precipitate. Although studies showed that calcium phosphate minerals could be utilized as fertilizers as well, these turned out not to be as efficient as pure struvite [64], as their P-available content in soils was lower than the latter but was still acceptable [65]. Calcium phosphate compounds are also difficult to settle [60,66]. ACP, in time, will be transformed to more stable forms, such as hydroxyapatite (HAP). Owing to its low solubility and high P content, HAP could still be considered a fertilizer [65], although not widely used for this purpose. In terms of effects on soil, the Ca2+:Mg2+ ratio in final precipitates could impact its structure. Lower ratios imply higher struvite content in precipitates, and this would generally be considered a more favorable condition, depending on the specific soil characteristics of the application site. However, for some soils, a higher ratio would be considered more suitable, as it would improve their drainage properties [61]. Generally, the production cost of calcium phosphate fertilizers is lower than struvite fertilizers [8], since less added chemicals are needed. Therefore, an ACP-rich precipitate would significantly reduce the cost of fertilizer production, since ACP could still precipitate in significant amounts at very low values of Mg and NH4 molar ratios. However, the use of ACP-rich precipitate as fertilizer would depend on specific regulations on fertilizer quality by local authorities. Heavy metal impurities in calcium phosphate fertilizers are generally higher than in struvite fertilizers [67], where they are usually below the limits for heavy metal content [52]. Nevertheless, this is a situation that ought to be verified on a case-by–case basis. Furthermore, in municipal WWTPs, P recovery by precipitation showed great potential of reducing the amounts of final excess sludge to be further treated, estimated at 8 to 31% [15,68]. However, due to the very limited studies available on phosphate precipitation from aerobic sludges, it is hard to compare their potential reduction to that achievable with anaerobic digestion dewatered sludge.
The study showed that there is a great potential in using aerobic sludge for recovering phosphorus in the form of struvite or calcium phosphate. Since aerobic sludge contains generally less P than its AD counterpart, the former has long remained outside the focus of attention as far as phosphorus recovery through precipitation processes is concerned. Nonetheless, this study showed that obtaining a precipitate that is rich in calcium phosphate (ACP) with small quantities of struvite from aerobic sludge liquor is highly feasible. Struvite precipitation, despite sporting many advantages, such as fertilizer recovery, and reducing nutrients pollution by simultaneous N and P removal, is usually not an economically sustainable full-scale approach, even for anaerobic sludges, as the current market price of recovered struvite is still relatively low compared to other P-containing fertilizers [69]. As illustrated before, process economics are even worse in the case of aerobic sludge struvite precipitation, due to the significant requirements of Mg and NH4 addition. Obtaining a calcium phosphate-rich product as final precipitate could be considered as a way to move forward in future studies and practice on phosphorus recovery. For many WWTPs, such as Nosedo, lacking AD sludge processing, this study highlights alternative possibilities to implement economically feasible phosphate recovery. Optimization of biological treatment processes in such WWTPs (i.e., full implementation of Bio-P processes) could lead to optimum anaerobic phosphorus release that would enhance the efficiency of phosphate precipitation from liquid sludge.

5. Conclusions

P precipitation processes were investigated in this study on different sludge samples from extended aeration, denitrification volume, and post-AD processes obtained from two WWTPs in Italy. The study, based on the characterization of the obtained precipitates, showed great potential of struvite precipitation from anaerobic sludge, while denitrification sludge did not result in any struvite precipitation due to low P concentration. Extended aeration sludge, as the focus of this study, was investigated in more detail. Results showed that P removal/recovery efficiency increases with increasing pH, and that up to 94% P recovery using NaOH for pH buffer could be achieved at pH = 9.5 (99% when using Ca(OH)2). Nevertheless, precipitates obtained at high pH values were highly affected by the presence of ACP and calcite, mixed with struvite, decreasing their commercial value. To achieve significant struvite precipitation, considerable addition of both Mg2+ and NH4+ to the system would be necessary, decreasing the potential for economic sustainability of the process. However, at pH < 9, ACP-rich precipitates were obtained, which could be a suitable alternative to pure struvite compounds for fertilizer uses. The use of Ca(OH)2 as an economic pH-adjustment reagent showed not to be favorable to struvite precipitation. However, it yielded ACP-rich precipitates at pH = 8.5. Owing to its high phosphate content, ACP could still be used in the fertilizer industry as an alternative to pure struvite. Therefore, it could be concluded that using Ca(OH)2 as a significantly more economic pH-adjusting reagent (with pH strictly kept < 9) could be considered as an alternative means for P recovery in the fertilizer industry, instead of struvite.

Author Contributions

All authors discussed, conceived, and designed the manuscript outline; S.D. analyzed literature data and conducted the experimental work under guidance from A.B.; D.C. prepared and conducted X-ray diffraction analyses; A.C. contributed to the identification of analysis tools; A.B. and S.D. wrote the main body of the paper. A.G.C. coordinated the group work and edited the final version of the manuscript. All Authors contributed to its final version.

Funding

The work for this paper has been completed as part of the experimental activities under a project grant from Fondazione CARIPLO (Milan, Italy) to the University of Pavia.

Acknowledgments

Saba Daneshgar received full PhD Scholarship support from the grant. UNECO srl, academic spinoff of the University of Pavia, assisted in conducting field studies at the Nosedo (Milan, Italy) WWTP. The authors acknowledge the assistance of Nosedo WWTP’s, Vettabbia Scarl and its personnel (particularly Francesca Pizza and Roberto Mazzini), and of ASM Pavia’s WWTP, as well as UNECO’s Nadia Iazzi. Special thanks to Daniele Dondi, head of the Chemical Radiation Laboratory at the University of Pavia, for allowing the Authors to access his Laboratory to carry out some of the analyses performed.

Conflicts of Interest

The authors declare no conflicts of interest.

References

  1. Daneshgar, S.; Callegari, A.; Capodaglio, A.G.; Vaccari, D. The Potential Phosphorus Crisis: Resource Conservation and Possible Escape Technologies: A Review. Resources 2018, 7, 37. [Google Scholar] [CrossRef]
  2. Cordell, D.; Drangert, J.O.; White, S. The story of phosphorus: Global food security and food for thought. Glob. Environ. Chang. 2009, 19, 292–305. [Google Scholar] [CrossRef]
  3. Cooper, J.; Lombardi, R.; Boardman, D.; Carliell-Marquet, C. The future distribution and production of global phosphate rock reserves. Resour. Conserv. Recycl. 2011, 57, 78–86. [Google Scholar] [CrossRef]
  4. Bendoricchio, G.; Di Luzio, M.; Baschieri, P.; Capodaglio, A.G. Diffuse pollution in the Lagoon of Venice. Water Sci. Technol. 1993, 28, 69–78. [Google Scholar] [CrossRef]
  5. Capodaglio, A.G.; Muraca, A.; Becchi, G. Accounting for water quality effects of future urbanization: Diffuse pollution loads estimates and control in Mantua’s Lakes (Italy). Water Sci. Technol. 2003, 47, 291–298. [Google Scholar] [CrossRef] [PubMed]
  6. Pan, G.; Lyu, T.; Mortimer, R. Comment: Closing phosphorus cycle from natural waters: Re-capturing phosphorus through an integrated water-energy-food strategy. J. Environ. Sci. 2018, 65, 375–376. [Google Scholar] [CrossRef] [PubMed]
  7. Amann, A.; Zoboli, O.; Krampe, J.; Rechberger, H.; Zessner, M.; Egle, L. Environmental impacts of phosphorus recovery from municipal wastewater. Resour. Conserv. Recycl. 2018, 130, 127–139. [Google Scholar] [CrossRef]
  8. Egle, L.; Rechberger, H.; Krampe, J.; Zessner, M. Phosphorus recovery from municipal wastewater: An integrated comparative technological, environmental and economic assessment of P recovery technologies. Sci. Total Environ. 2016, 571, 522–542. [Google Scholar] [CrossRef] [PubMed]
  9. Desmidt, E.; Ghyselbrecht, K.; Zhang, Y.; Pinoy, L.; Van Der Bruggen, B.; Verstraete, W.; Meesschaert, B. Global phosphorus scarcity and full-scale P-recovery techniques: A review. Crit. Rev. Environ. Sci. Technol. 2015, 45, 336–384. [Google Scholar] [CrossRef]
  10. Morse, G.K.; Brett, S.W.; Guy, J.A.; Lester, J.N. Phosphorus removal and recovery technologies. Sci. Total. Environ. 1998, 212, 69–81. [Google Scholar] [CrossRef]
  11. Alori, E.T.; Glick, B.R.; Babalola, O.O. Microbial phosphorus solubilization and its potential for use in sustainable agriculture. Front. Microbiol. 2017, 8, 1–8. [Google Scholar] [CrossRef] [PubMed]
  12. Liu, R.; Lal, R. Synthetic apatite nanoparticles as a phosphorus fertilizer for soybean (Glycine max). Sci. Rep. 2014, 4, 1–6. [Google Scholar] [CrossRef] [PubMed]
  13. Kizito, S.; Luo, H.; Wu, S.; Ajmal, Z.; Lv, T.; Dong, R. Phosphate recovery from liquid fraction of anaerobic digestate using four slow pyrolyzed biochars: Dynamics of adsorption, desorption and regeneration. J. Environ. Manag. 2017, 201, 260–267. [Google Scholar] [CrossRef] [PubMed]
  14. Daneshgar, S.; Buttafava, A.; Callegari, A.; Capodaglio, A.G. Simulations and laboratory tests for assessing phosphorus recovery efficiency from sewage sludge. Resources 2018, 7, 54. [Google Scholar] [CrossRef]
  15. Le Corre, K.S.; Valsami-Jones, E.; Hobbs, P.; Parsons, S.A. Phosphorus Recovery from Wastewater by Struvite Crystallization: A Review. Crit. Rev. Environ. Sci. Technol. 2009, 39, 433–477. [Google Scholar] [CrossRef] [Green Version]
  16. Rahaman, M.S.; Mavinic, D.S.; Meikleham, A.; Ellis, N. Modeling phosphorus removal and recovery from anaerobic digester supernatant through struvite crystallization in a fluidized bed reactor. Water Res. 2014, 51, 1–10. [Google Scholar] [CrossRef] [PubMed]
  17. Doyle, J.D.; Parsons, S.A. Struvite formation, control and recovery. Water Res. 2002, 36, 3925–3940. [Google Scholar] [CrossRef]
  18. Galbraith, S.C.; Schneider, P.A.; Flood, A.E. Model-driven experimental evaluation of struvite nucleation, growth and aggregation kinetics. Water Res. 2014, 56, 122–132. [Google Scholar] [CrossRef] [PubMed]
  19. Parkhurst, D.L.; Appelo, C.A.J. Description of Input and Examples for PHREEQC Version 3—A Computer Program for Speciation, Batch-Reaction, One-Dimensional Transport, and Inverse Geochemical Calculations; U.S. Geological Survey Techniques and Methods; USGS: Denver, CO, USA, 2013; 497p. Available online: http://pubs.usgs.gov/tm/06/a43 (accessed on 30 October 2017).
  20. Çelen, I.; Buchanan, J.R.; Burns, R.T.; Bruce Robinson, R.; Raj Raman, D. Using a chemical equilibrium model to predict amendments required to precipitate phosphorus as struvite in liquid swine manure. Water Res. 2007, 41, 1689–1696. [Google Scholar] [CrossRef] [PubMed]
  21. Musvoto, E.V.; Wentzel, M.C.M.; Ekama, G.A.M. Integrated Chemical—Physical Processes Modelling II. Simulating Aeration Treatment of Anaerobic Digester Supernatants. Water Res. 2000, 34, 1868–1880. [Google Scholar] [CrossRef]
  22. Mamais, D.; Pitt, P.A.; Cheng, Y.W.; Loiacono, J.; Jenkins, D.; Wen, Y. Digesters Determination to control in anaerobic of ferric chloride precipitation digesters dose struvite sludge. Water Environ. Res. 2012, 66, 912–918. [Google Scholar] [CrossRef]
  23. Abbona, F.; Madsen, H.E.L.; Boistelle, R. The initial phases of calcium and magnesium phosphates precipitated from solutions of high to medium concentrations. J. Cryst. Growth 1986, 74, 581–590. [Google Scholar] [CrossRef]
  24. Taylor, A.W.; Frazier, A.W.; Gurney, E.L. Solubility products of magnesium ammonium and magnesium potassium phosphates. Trans. Faraday Soc. 1963, 59, 1580. [Google Scholar] [CrossRef]
  25. Battistoni, P.; Paci, B.; Fatone, F.; Pavan, P. Phosphorus removal from supernatants at low concentration using packed and fluidized-bed reactors. Ind. Eng. Chem. Res. 2005, 44, 6701–6707. [Google Scholar] [CrossRef]
  26. Lee, S.H.; Yoo, B.H.; Lim, S.J.; Kim, T.H.; Kim, S.K.; Kim, J.Y. Development and validation of an equilibrium model for struvite formation with calcium co-precipitation. J. Cryst. Growth 2013, 372, 129–137. [Google Scholar] [CrossRef]
  27. Lu, X.; Leng, Y. Theoretical analysis of calcium phosphate precipitation in simulated body fluid. Biomaterials 2005, 26, 1097–1108. [Google Scholar] [CrossRef] [PubMed]
  28. Johnsson, M.S.-A.; Nancollas, G.H. The Role of Brushite and Octacalcium Phosphate in Apatite Formation. Crit. Rev. Oral Boil. Med. 1992, 3, 61–82. [Google Scholar] [CrossRef]
  29. Stumm, W.; Morgan, J.J. Aquatic Chemistry; Wiley Interscience: New York, NY, USA, 1981. [Google Scholar]
  30. Nordstorm, D.K.; Plummer, N.L.; Langmuir, D.; Busenberg, E.; May, H.M.; Jones, B.F.; Parkhurst, D.L. Revised chemical and equilibrium data for major water-mineral reactions and their limitations. Chem. Model. Aqueous Syst. II 1990, 416, 398–413. [Google Scholar] [CrossRef]
  31. Murray, K.; May, P.M. Joint Expert Speciation System (JESS). An International Computer System for Determining Chemical Speciation and Non-Aqueous Environments; Supplied by Murdoch University, Murdoch 6150, Western Australia and the Division of Water Technology, CSIR, PO BOX 395; JESS: Pretoria, South Africa, 1996; Available online: http://jess.murdoch.edu.au/jess_home.htm (accessed on 5 November 2017).
  32. Levin, G.V.; Shapiro, J. Metabolic uptake of phosphorus by wastewater organism. J. Water Pollut. Control Fed. 1965, 37, 800–821. [Google Scholar]
  33. Barnard, J. A review of biological phosphorus removal in the activated sludge process. Water SA 1976, 2, 136–144. [Google Scholar]
  34. United States Environmental Protection Agency (EPA). Method 365.3: Phosphorus, All Forms (Colorimetric, Ascorbic Acid, Two Reagent). 1978. Available online: https://www.epa.gov/sites/production/files/2015-08/.../method_365-3_1978.pdf (accessed on 15 February 2016).
  35. US Geological Survey. PHREEQC (Version 3)—A Computer Program for Speciation, Batch-Reaction, One-Dimensional Transport, and Inverse Geochemical Calculations. Available online: https://wwwbrr.cr.usgs.gov/projects/GWC_coupled/phreeqc/) (accessed on 30 October 2017).
  36. Soptrajanov, B.; Stefov, V.; Lutz, H.D.; Engelen, B. Infrared and Raman Spectra of Magnesium Ammonium Phosphate Hexahydrate (struvite) and its Isomorphous Analogues. Spectrosc. Emerg. Mater. 2004, 689, 299–308. [Google Scholar]
  37. Stefov, V.; Abdija, Z.; Najdoski, M.; Koleva, V.; Petruševski, V.M.; Runčevski, T.; Soptrajanov, B. Infrared and Raman spectra of magnesium ammonium phosphate hexahydrate (struvite) and its isomorphous analogues. IX: Spectra of protiated and partially deuterated cubic magnesium cesium phosphate hexahydrate. Vib. Spectrosc. 2013, 68, 122–128. [Google Scholar] [CrossRef]
  38. Bhuiyan, M.I.H.; Mavinic, D.S.; Koch, F.A. Thermal decomposition of struvite and its phase transition. Chemosphere 2008, 70, 1347–1356. [Google Scholar] [CrossRef] [PubMed]
  39. Morris, M.C.; McMurdie, H.F.; Evans, E.H.; Paretzkin, B.; Parker, H.S.; Wong-Ng, W.; Gladhill, D.M. Standard X-ray Diffraction Powder Patterns Section 21—Data for 92 Substances; International Center for Diffraction Data: Newtown Square, PA, USA, 1985. [Google Scholar]
  40. Berzina-Cimdina, L.; Borodajenko, N. Research of Calcium Phosphates Using Fourier Transform Infrared Spectroscopy. Infrared Spectrosc. Mater. Sci. Eng. Technol. 2012, 6, 123–149. [Google Scholar] [CrossRef]
  41. Dubberke, W.; Marks, V.J. Thermogravimetric Analysis of Carbonate Aggregate; Transportation Research Board: Washington, DC, USA, 1992; pp. 38–43. Available online: http://trid.trb.org/view.aspx?id=370975 (accessed on 20 March 2018).
  42. Destainville, A.; Rolo, A.; Champion, E.; Bernache-Assollant, D. Synthesis and characterization of beta tricalcium phosphate. Key Eng. Mater. 2003, 240–242, 489–492. [Google Scholar] [CrossRef]
  43. Mandel, S.; Tas, A.C. Brushite (CaHPO4·2H2O) to Octacalcium Phosphate (Ca8(HPO4)2(PO4)4·5H2O) Transformation in DMEM Solutions at 36.5 °C. Mater. Sci. Eng. 2010, 30, 245–254. [Google Scholar] [CrossRef] [PubMed]
  44. Lam, E.; Gu, Q.; Swedlund, P.J.; Marchesseau, S.; Hemar, Y. X-ray diffraction investigation of amorphous calcium phosphate and hydroxyapatite under ultra-high hydrostatic pressure. Int. J. Miner. Met. Mater. 2015, 22, 1225–1231. [Google Scholar] [CrossRef]
  45. Le Corre, K.S.; Valsami-Jones, E.; Hobbs, P.; Parsons, S.A. Impact of calcium on struvite crystal size, shape and purity. J. Cryst. Growth 2005, 283, 514–522. [Google Scholar] [CrossRef] [Green Version]
  46. Crutchik, D.; Garrido, J.M. Struvite crystallization versus amorphous magnesium and calcium phosphate precipitation during the treatment of a saline industrial wastewater. Water Sci. Technol. 2011, 64, 2460–2467. [Google Scholar] [CrossRef] [PubMed]
  47. Ichihashi, O.; Hirooka, K. Removal and recovery of phosphorus as struvite from swine wastewater using microbial fuel cell. Bioresour. Technol. 2012, 114, 303–307. [Google Scholar] [CrossRef] [PubMed]
  48. Capdevielle, A.; Sýkorová, E.; Biscans, B.; Béline, F.; Daumer, M.L. Optimization of struvite precipitation in synthetic biologically treated swine wastewater-Determination of the optimal process parameters. J. Hazard. Mater. 2013, 244–245, 357–369. [Google Scholar] [CrossRef] [PubMed] [Green Version]
  49. Doyle, J.D.; Philp, R.; Churchley, J.; Parsons, S.A. Analysis of struvite precipitation in real and synthetic liquors. Process. Saf. Environ. Prot. 2000, 78, 480–488. [Google Scholar] [CrossRef]
  50. Uysal, A.; Yilmazel, Y.D.; Demirer, G.N. The determination of fertilizer quality of the formed struvite from effluent of a sewage sludge anaerobic digester. J. Hazard. Mater. 2010, 181, 248–254. [Google Scholar] [CrossRef] [PubMed]
  51. Huang, H.; Xu, C.; Zhang, W. Removal of nutrients from piggery wastewater using struvite precipitation and pyrogenation technology. Bioresour. Technol. 2011, 102, 2523–2528. [Google Scholar] [CrossRef] [PubMed]
  52. Muhmood, A.; Wu, S.; Lu, J.; Ajmal, Z.; Luo, H.; Dong, R. Nutrient recovery from anaerobically digested chicken slurry via struvite: Performance optimization and interactions with heavy metals and pathogens. Sci. Total Environ. 2018, 635, 1–9. [Google Scholar] [CrossRef] [PubMed]
  53. Huang, H.; Liu, J.; Wang, S.; Jiang, Y.; Xiao, D.; Ding, L.; Gao, F. Nutrients removal from swine wastewater by struvite precipitation recycling technology with the use of Mg3(PO4)2 as active component. Ecol. Eng. 2016, 92, 111–118. [Google Scholar] [CrossRef]
  54. Song, Y.; Yuan, P.; Zheng, B.; Peng, J.; Yuan, F.; Gao, Y. Nutrients removal and recovery by crystallization of magnesium ammonium phosphate from synthetic swine wastewater. Chemosphere 2007, 69, 319–324. [Google Scholar] [CrossRef] [PubMed]
  55. Yan, H.; Shih, K. Effects of calcium and ferric ions on struvite precipitation: A new assessment based on quantitative X-ray diffraction analysis. Water Res. 2016, 95, 310–318. [Google Scholar] [CrossRef] [PubMed]
  56. LopezValero, I.; GomezLorente, C.; Boistelle, R. Effects of sodium and ammonium ions on occurrence, evolution and crystallinity of calcium phosphates. J. Cryst. Growth 1992, 121, 297–304. [Google Scholar] [CrossRef]
  57. Szögi, A.A.; Vanotti, M.B. Removal of phosphorus from livestock effluents. J. Environ. Qual. 2009, 38, 576. [Google Scholar] [CrossRef] [PubMed]
  58. Vanotti, M.B.; Szogi, A.A.; Hunt, P. Extraction of soluble phosphorus from swine wastewater. Trans. ASAE 2003, 46, 1665–1674. [Google Scholar] [CrossRef]
  59. Hosni, K.; Ben Moussa, S.; Chachi, M.; Ben Amor, M. The removal of PO43− by calcium hydroxide from synthetic wastewater: Optimization of the operating conditions. Desalination 2008, 223, 337–343. [Google Scholar] [CrossRef]
  60. Da Cruz, S.G.; Monte, D.M.; Dutra, A.J.B. Electroflotation of precipitated phosphate from synthetic solution. Braz. J. Chem. Eng. 2017, 34, 821–830. [Google Scholar] [CrossRef] [Green Version]
  61. Muster, T.H.; Douglas, G.B.; Sherman, N.; Seeber, A.; Wright, N.; Guzukara, Y. Towards effective phosphorus recycling from wastewater: Quantity and quality. Chemosphere 2013, 91, 676–684. [Google Scholar] [CrossRef] [PubMed]
  62. Jaffer, Y.; Clark, T.A.; Pearce, P.; Parsons, S.A. Potential phosphorus recovery by struvite formation. Water Res. 2002, 36, 1834–1842. [Google Scholar] [CrossRef]
  63. Dockhorn, T. About the economy of phosphorus recovery. In International Conference on Nutrient Recovery from Wastewater Streams, Vancouver, Canada; IWA Publishing: London, UK, 2009; pp. 145–158. ISBN 9781843392323. [Google Scholar]
  64. Johnston, A.E.; Richards, I.R. Effectiveness of different precipitated phosphate as phosphorus source for plants. Soil Use Manag. 2003, 19, 45–49. [Google Scholar] [CrossRef]
  65. De-Bashan, L.E.; Bashan, Y. Recent advances in removing phosphorus from wastewater and its future use as fertilizer (1997–2003). Water Res. 2004, 38, 4222–4246. [Google Scholar] [CrossRef] [PubMed] [Green Version]
  66. Liu, J.C.; Chang, C.J. Precipitation flotation of phosphate from water. Colloids Surf. A Physicochem. Eng. Asp. 2009, 34, 215–219. [Google Scholar] [CrossRef]
  67. Forrest, A.L.; Fattah, K.P.; Mavinic, D.S.; Koch, F.A. Optimizing struvite production for phosphate recovery in WWTP. J. Environ. Eng. 2008, 134, 395–402. [Google Scholar] [CrossRef]
  68. Woods, N.C.; Sock, S.M.; Diagger, G.T. Phosphorus recovery technology modeling and feasibility evaluation for municipal wastewater treatment plants. Environ. Technol. 1999, 20, 743–748. [Google Scholar] [CrossRef]
  69. Mayer, B.K.; Baker, L.; Boyer, T.H.; Drechsel, P.; Gifford, M.; Hanjra, M.A.; Parameswaran, P.; Stoltzfus, J.; Westerhoff, P.; Rittmann, B.E. Total value of phosphorus recovery. Environ. Sci. Technol. 2016, 50, 6606–6620. [Google Scholar] [CrossRef] [PubMed]
Figure 1. Synthetic lab-produced Struvite.
Resources 07 00071 g001
Figure 2. Experimental setup of the struvite precipitation process.
Resources 07 00071 g002
Figure 3. Fourier Transform Infrared Spectroscopy (FTIR) (a), Thermal gravimetric analysis (TGA) (b), and Quadrupolar Mass Spectroscopy (MS) (c) analyses of synthetic struvite.
Resources 07 00071 g003
Figure 4. X-ray Diffraction (XRD) analysis pattern of synthetic struvite.
Resources 07 00071 g004
Figure 5. FTIR (a), TGA (b), and MS (c) of precipitates from AD sludge sample.
Resources 07 00071 g005
Figure 6. FTIR (a), TGA (b), and MS (c) analyses of precipitates from denitrification sludge sample.
Resources 07 00071 g006
Figure 7. FTIR (a), TGA (b), and MS (c) analyses of precipitates from aerobic sludge sample.
Resources 07 00071 g007
Figure 8. FTIR of Na2HPO4.
Resources 07 00071 g008
Figure 9. FTIR total spectral range, and details of spectrum used for the analysis (1200–2000 cm−1).
Resources 07 00071 g009
Figure 10. XRD pattern for the experiment with 5:5:1 of molar ratio at pH = 8.5 (black), with 3:3:1 of molar ratio at pH = 8.5 (red), compared to synthetic struvite (red dots), inside circle: broad peak associated to the amorphous phase.
Resources 07 00071 g010
Figure 11. Results of ICP-AES and Elemental Analysis, (a) Molar ratios, (b) Molar contents.
Resources 07 00071 g011
Figure 12. Results of ICP-AES and Elemental Analysis for the experiments without any additives, with only NaOH for pH adjustment, (a) Molar ratios, (b) Molar contents.
Resources 07 00071 g012
Figure 13. XRD pattern for experiments with 5:5:1 molar ratio at pH = 8.5 using Ca(OH)2 (green), comparing to the one using NaOH (black) and synthetic struvite (red dots), inside circle shows the broad peak associated to P amorphous phase.
Resources 07 00071 g013
Figure 14. Results of ICP-AES and Elemental Analysis for the experiments with Ca(OH)2 for pH adjustment, (a) Molar ratios, (b) Molar contents.
Resources 07 00071 g014
Table 1. Possible solid phases precipitating in the P recovery process.
Solid PhaseReactionConditionpKsp (25 °C)Reference
StruviteMg2+ + NH4+ + PO43− + 6H2O ↔ MgNH4PO4·6H2O7 < pH < 1113.26[24]
NewberyiteMg2+ + HPO42− +3H2O ↔ MgHPO4·3H2OHigh Mg2+/P, pH < 65.8[21]
Bobierrite3Mg2+ + 2PO43− + 8H2O ↔ Mg3(PO4)2·8H2ODays to precipitate25.2[21]
Hydroxyapatite (HAP)10Ca2+ + 6PO43− +2OH ↔ Ca10(PO4)6(OH)2Slow formation from ACP, DCPD58.62[25,26]
Tricalcium phosphate (TCP)3Ca2+ + 2PO43− ↔ Ca3(PO4)2Slow formation from ACP, DCPD32.63[21]
Octacalcium phosphate (OCP)8Ca2+ + 2HPO42− + 4PO43− ↔ Ca8(HPO4)2(PO4)4Hydrolysis of DCPD at pH = 5–636.48[27]
Monetite (DCP)Ca2+ + HPO42− ↔ CaHPO4Fast formation from ACP, DCPD6.81[28]
Brushite (DCPD)Ca2+ + HPO42− + 2H2O ↔ CaHPO4·2H2OpH < 76.6[29]
Amorphous calcium phosphate (ACP)3Ca2+ + 2PO43− + xH2O ↔ Ca3(PO4)2·xH2OpH > 625.46[21]
CalciteCa2+ + CO32− ↔ CaCO3Stable at 25 °C and atmospheric P8.42–8.22–8.48[21,29,30,31]
MagnesiteMg2+ + CO32− ↔ MgCO3Stable at pH < 10.77.46–8.2[29,31]
BruciteMg2+ + 2OH ↔ Mg(OH)2pH > 9.511.16[29,30]
Ca(OH)2Ca2+ + 2OH ↔ Ca(OH)2pH > 9.55.2[21,30]
Table 2. Sludge samples characteristics.
Constituent IonsExtended OxidationAfter Anaerobic DigestionDenitrification Pond
(mg/L)(mg/L)(mg/L)
Ca2+10130.966.4
Mg2+26.417.024.2
P378.1 ± 1.51.66 ± 0.3
NH4+32.61510 ± 3401.70 ± 0.38
Table 3. Different molar ratios for Mg2+:NH4+:P used in the study.
Mg2+:NH4+:P
3:3:13:1:11:3:1
5:5:15:1:11:5:1
Table 4. FTIR result curves and P removal percentage results for tests with ionic molar ratios indicated at different pH.
Mg:NH4:P
5:5:13:3:15:1:13:1:11:5:11:3:1
pHP rem.%FTIR 1200–2000 cm−1P rem.%FTIR 1200–2000 cm−1P rem.%FTIR 1200–2000 cm−1
8.565.1 Resources 07 00071 i00153.4 Resources 07 00071 i00251.2 Resources 07 00071 i003
49.7 Resources 07 00071 i00452.3 Resources 07 00071 i00541.2 Resources 07 00071 i006
9.085.8 Resources 07 00071 i00781.0 Resources 07 00071 i00876.2 Resources 07 00071 i009
78.5 Resources 07 00071 i01079.7 Resources 07 00071 i01176.9 Resources 07 00071 i012
9.593.2 Resources 07 00071 i01394.6 Resources 07 00071 i01490.2 Resources 07 00071 i015
91.8 Resources 07 00071 i01691.1 Resources 07 00071 i01786.3 Resources 07 00071 i018
Note: Text color in second row corresponds to line colors in the graphs.
Table 5. FTIR and P removal percentage results for experiments without any additives using only NaOH for pH adjustment.
Mg:NH4:P
Without Additives
pHP Removal %FTIR 1200–2000 cm−1
8.554.4 Resources 07 00071 i019
9.076.7 Resources 07 00071 i020
9.594.5 Resources 07 00071 i021
Table 6. FTIR and P removal percentage results for the experiments with Ca(OH)2 for pH adjustment.
Using Ca(OH)2
Mg:NH4:P
5:5:13:3:1
pHP Removal %FTIR 1200–2000 cm−1P Removal %FTIR 1200–2000 cm−1
8.568.1 Resources 07 00071 i02271.7 Resources 07 00071 i023
9.089.5 Resources 07 00071 i02488.4 Resources 07 00071 i025
9.599.2 Resources 07 00071 i02699.6 Resources 07 00071 i027
Note: Text color in the table corresponds to line colors in the graphs.

