3.1. Rheological Characterization of TSP vs. Hyaluronic Acid
The rheological properties of TSP aqueous solutions have been measured both in continuous and oscillatory flow conditions at different concentrations in the range 0.5%–5% w/w.
The viscosity trends as a function of shear rate of TSP solutions are shown in
Figure 1a.
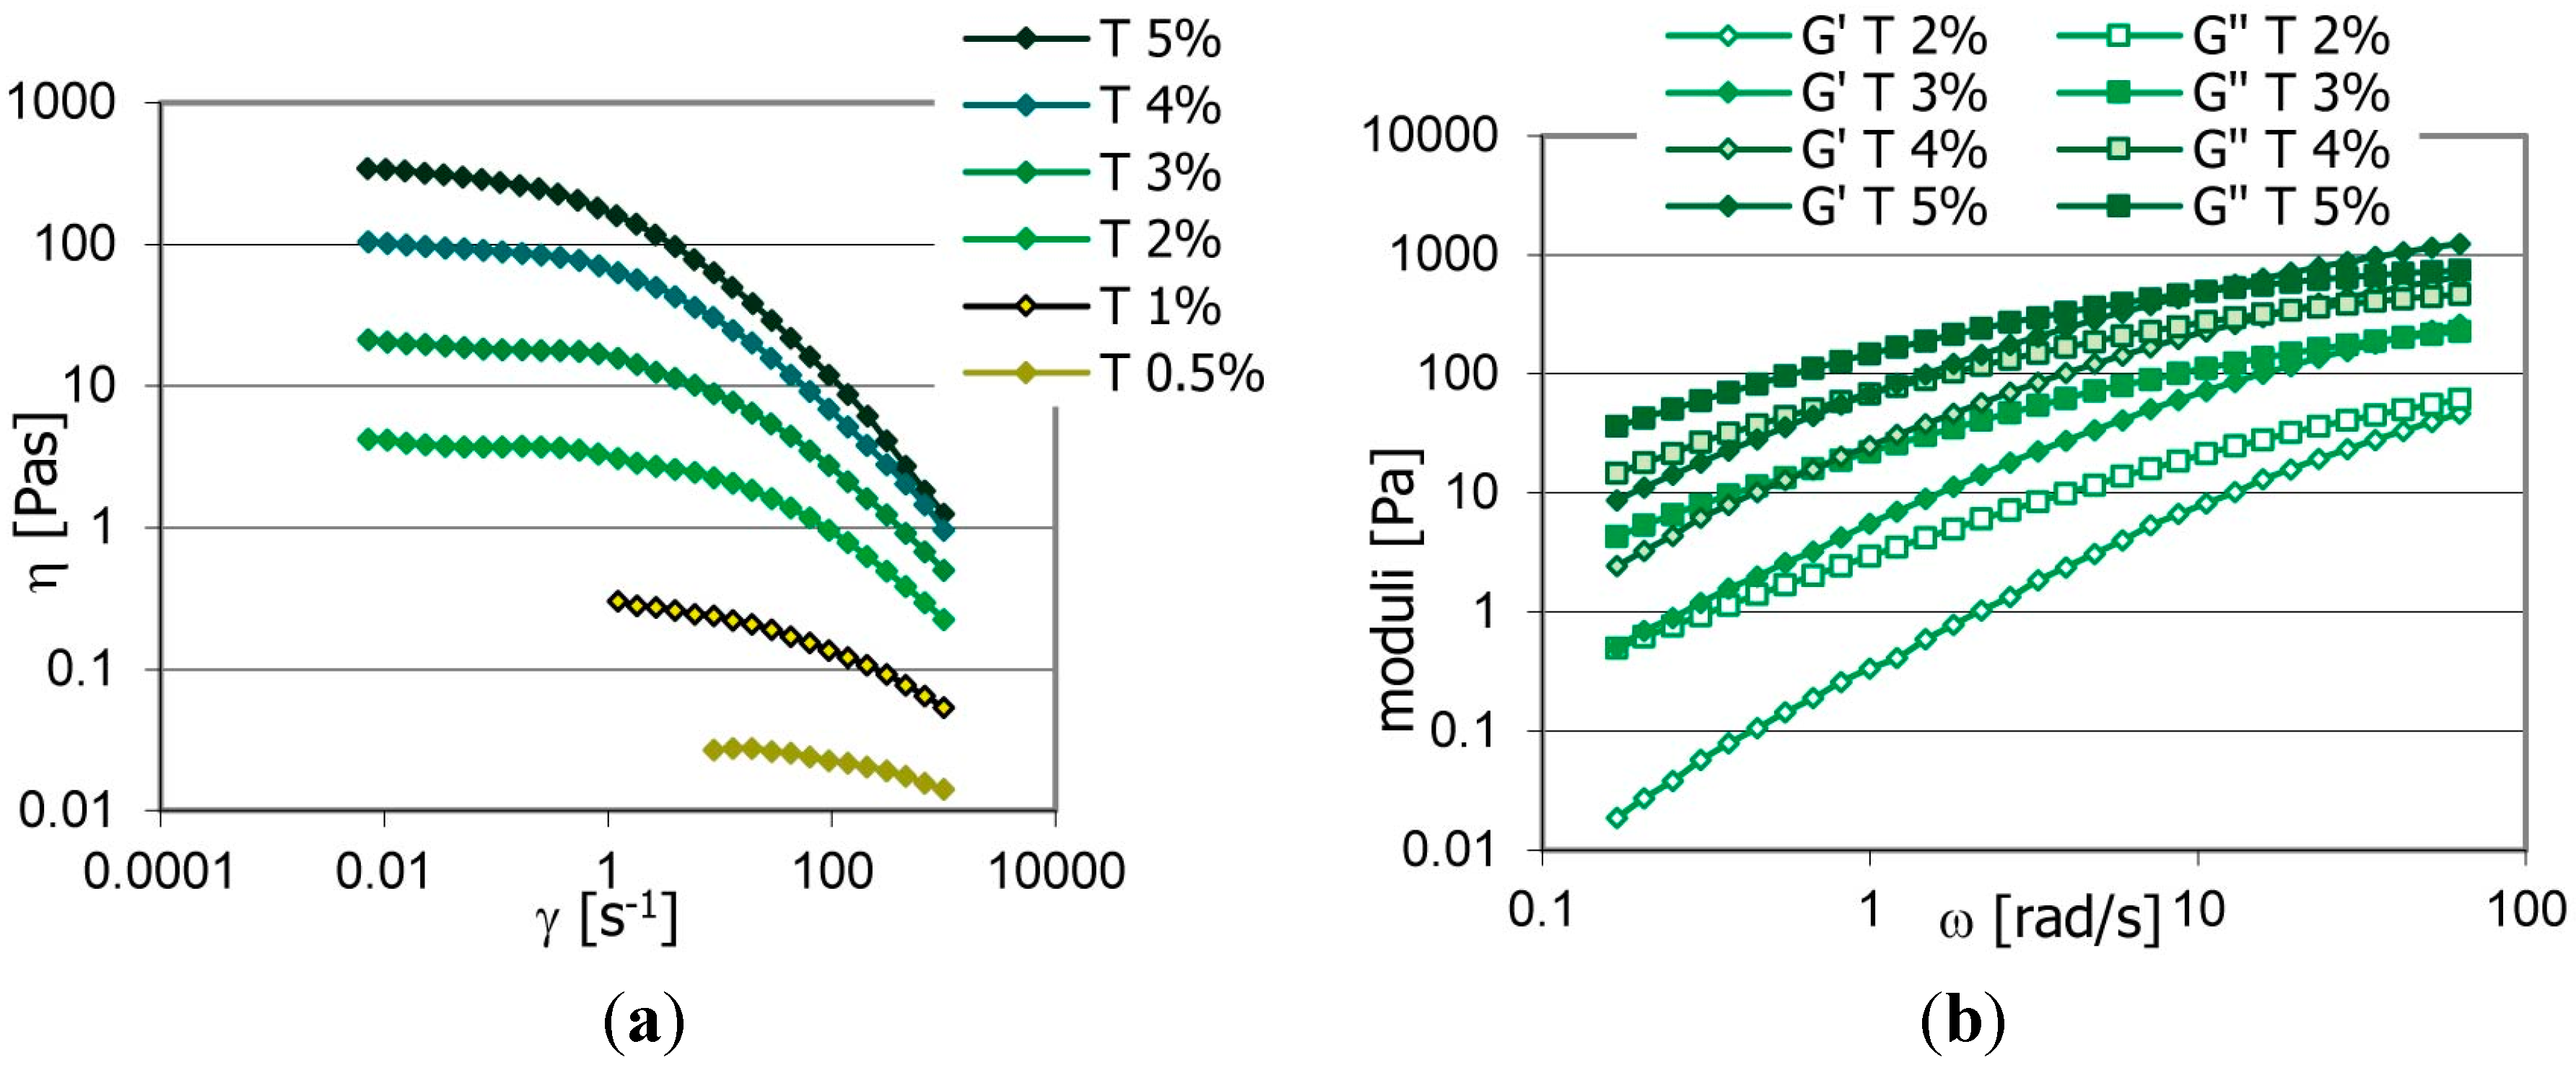
The viscosity of TSP solutions increased with the polymer concentration in conjunction with the shear-thinning behavior, as a result of firmer interactions between the polysaccharide chain and the solvent.
The viscoelastic properties as a function of frequency, using a fixed oscillation amplitude within the linear viscoelastic range, showed a sol-gel transition as a function of TSP concentration (
Figure 1b).
Figure 1.
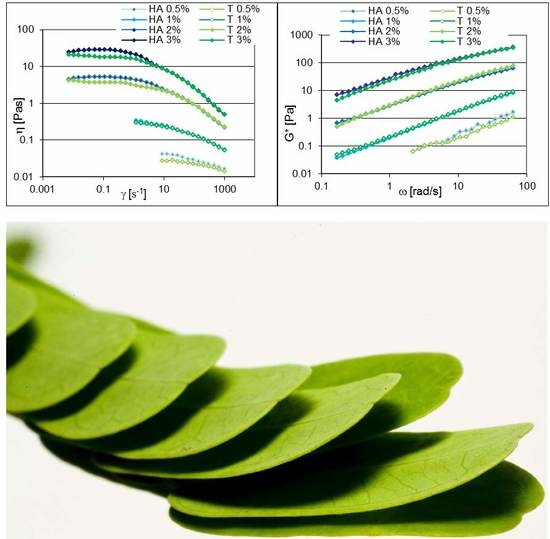
(a) Viscosity trends vs. shear rate; (b) G’ and G’’ trends as a function of the frequency of tamarind seed polysaccharide (T) samples at different concentrations.
Figure 1.
(a) Viscosity trends vs. shear rate; (b) G’ and G’’ trends as a function of the frequency of tamarind seed polysaccharide (T) samples at different concentrations.
TSP solutions of up to a 2% concentration showed a liquid-like behavior, with the viscous modulus G” greater than the elastic modulus G’, in all of the frequency ranges investigated, and both of the moduli significantly dependent on frequency. By increasing the polymer concentration, the elastic character of the systems increased, and G’, the elastic modulus, became higher than the viscous modulus, when high frequencies were applied.
The mechanical spectra of the TSP concentrated solutions (3%–5% w/w) showed a crossover point between the moduli patterns characteristic of the viscoelastic materials. As expected, the frequency value correspondent to the crossover point decreased by increasing the polymer concentration (crossover point-frequency values: T3% 40.4 rad/s, T4% 19.2 rad/s, T5% 10.5 rad/s).
The rheological properties of TSP were compared with those of hyaluronic acid using two different raw materials with different molecular weights: HA (400–1000 kDa) comparable with TSP, and HB (1800–2200 kDa).
In
Figure 2, the viscosity curve as a function of shear rate (continuous flow conditions) (
Figure 2a) and the viscoelastic properties (oscillatory flow conditions) (
Figure 2b) within the linear viscoelastic region of HA and TSP aqueous dispersions, prepared at the same concentrations, are compared.
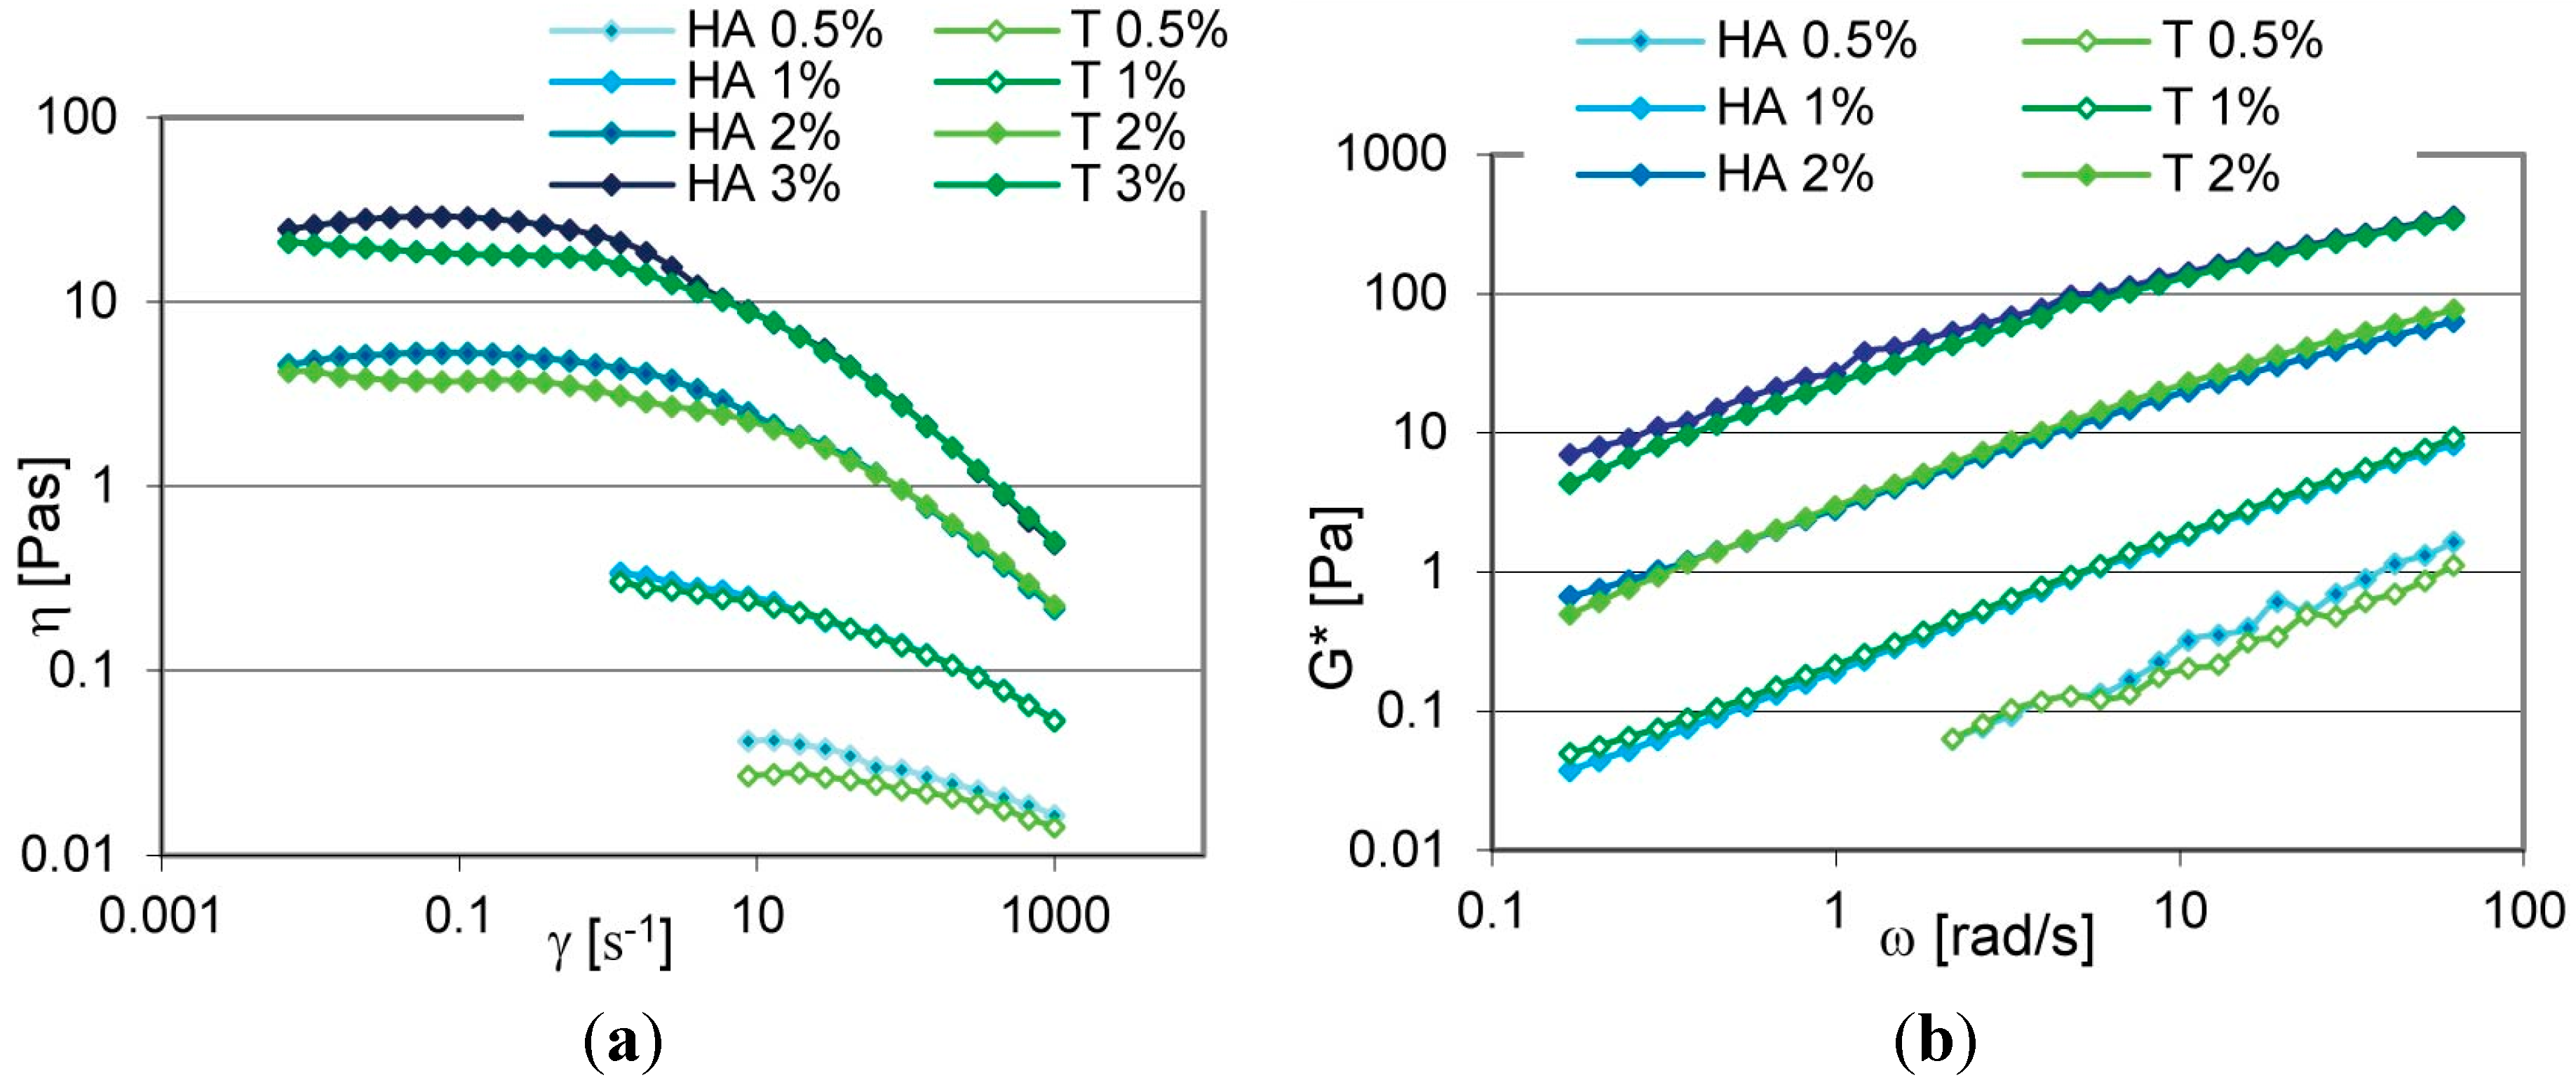
The flow curves showed an increase of viscosity and the shear-thinning behavior as a function of the concentration for both TSP and HA aqueous dispersions in the range 0.5%–3%
w/
w (
Figure 2a).
In oscillatory flow conditions, all of the samples presented a liquid-like behavior with similar absolute values of the complex modulus G* as a function of polymer concentration (
Figure 2b).
The G* patterns were dependent on the frequency, confirming the significant viscous character of the structures that both polysaccharides are able to form in water.
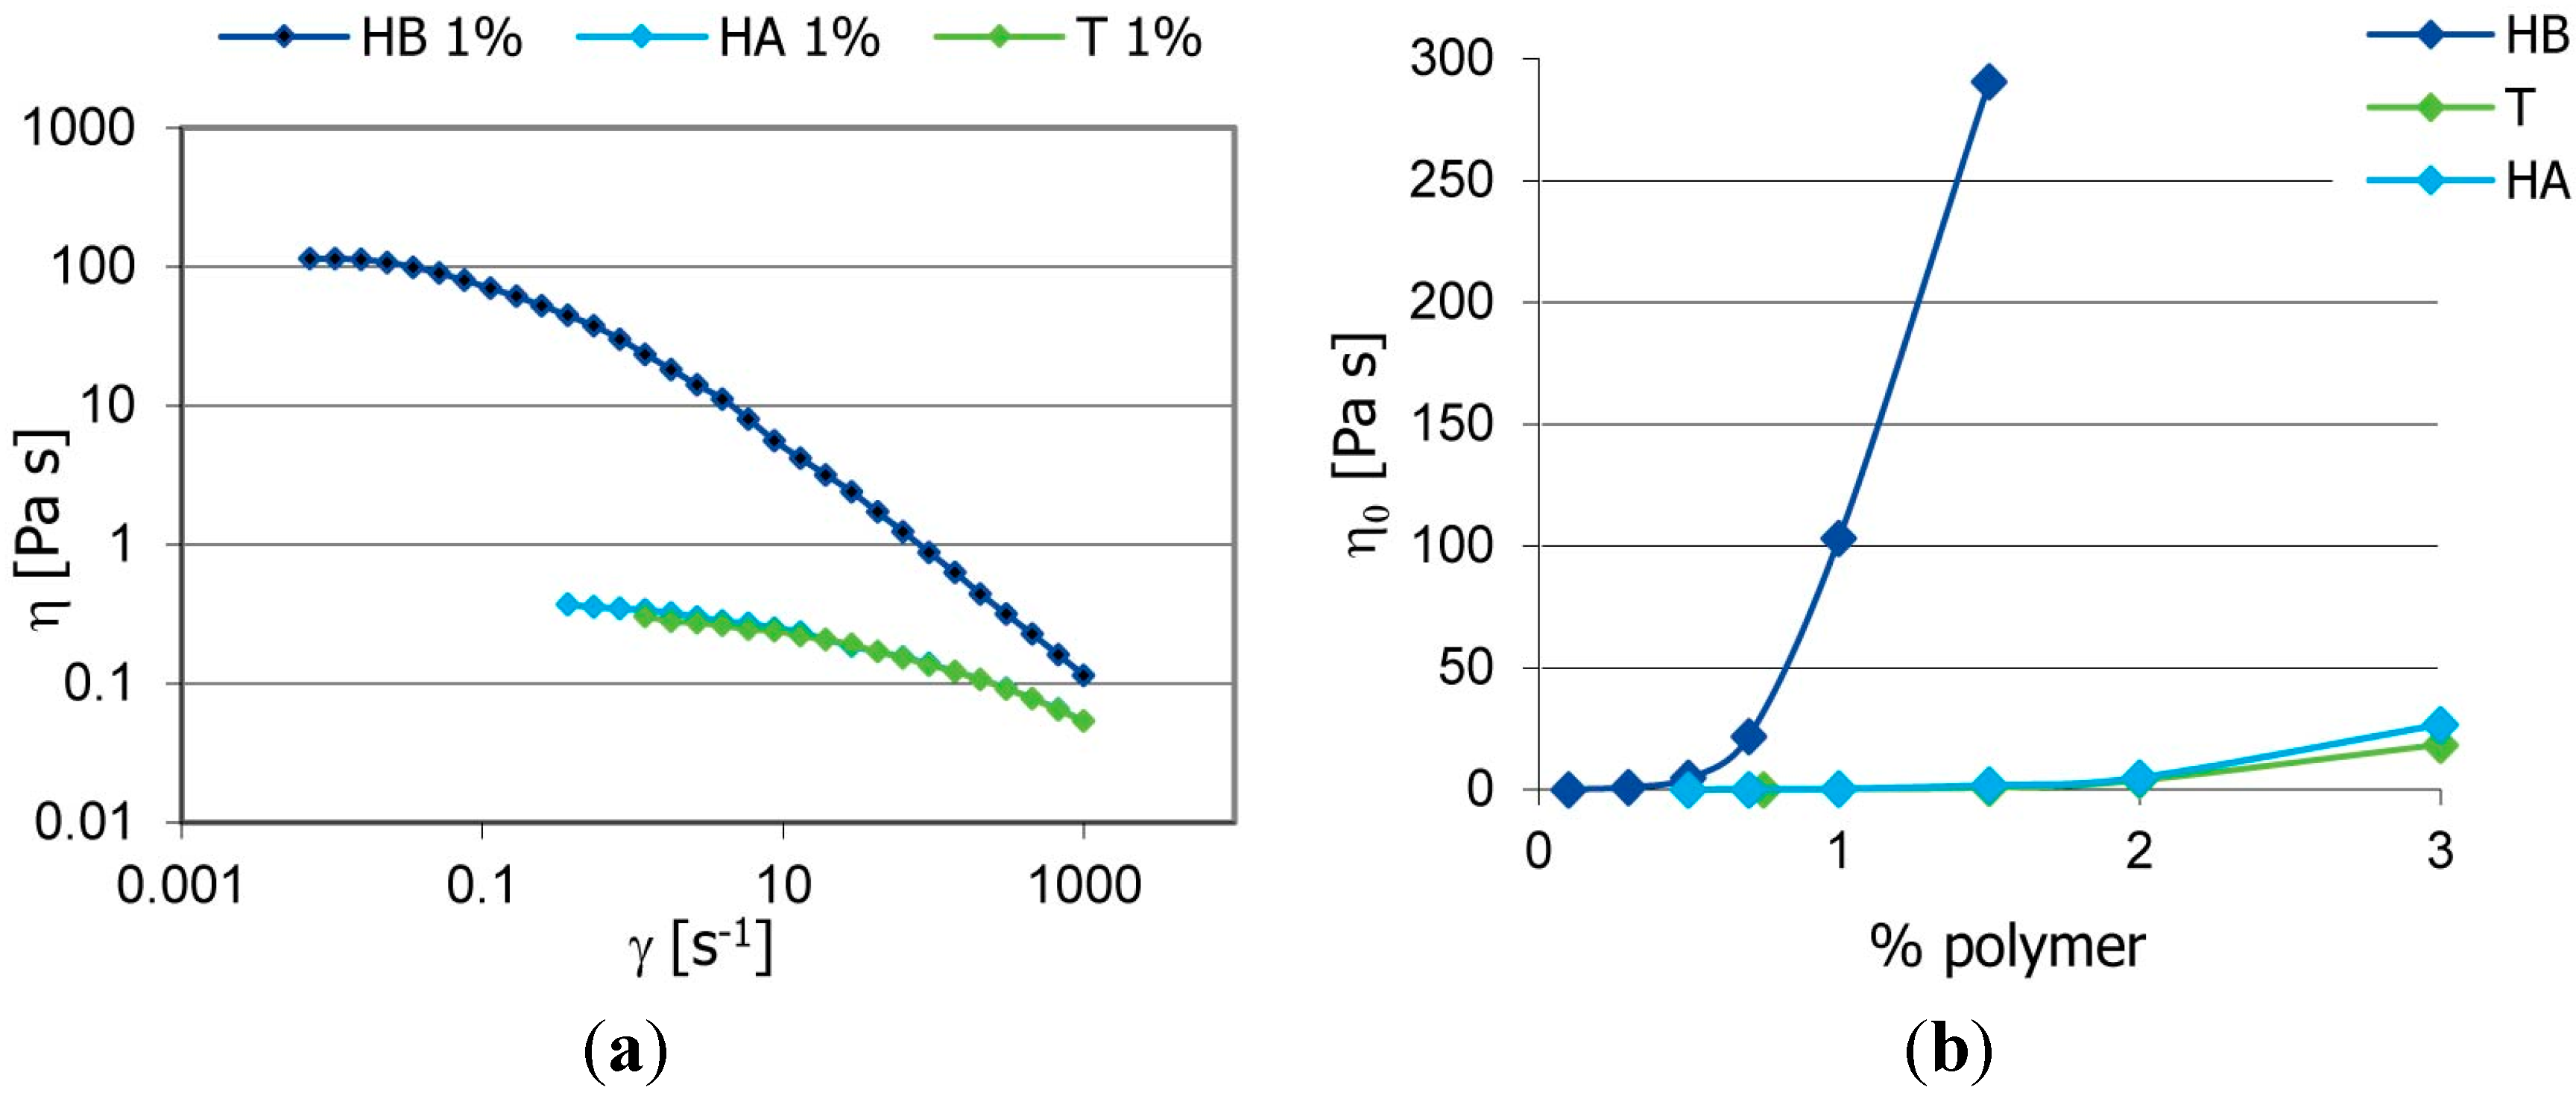
Figure 2.
(a) Viscosity trends vs. shear rate; and (b) G* trends as a function of the frequency of TSP and HA aqueous dispersions at different concentrations.
Figure 2.
(a) Viscosity trends vs. shear rate; and (b) G* trends as a function of the frequency of TSP and HA aqueous dispersions at different concentrations.
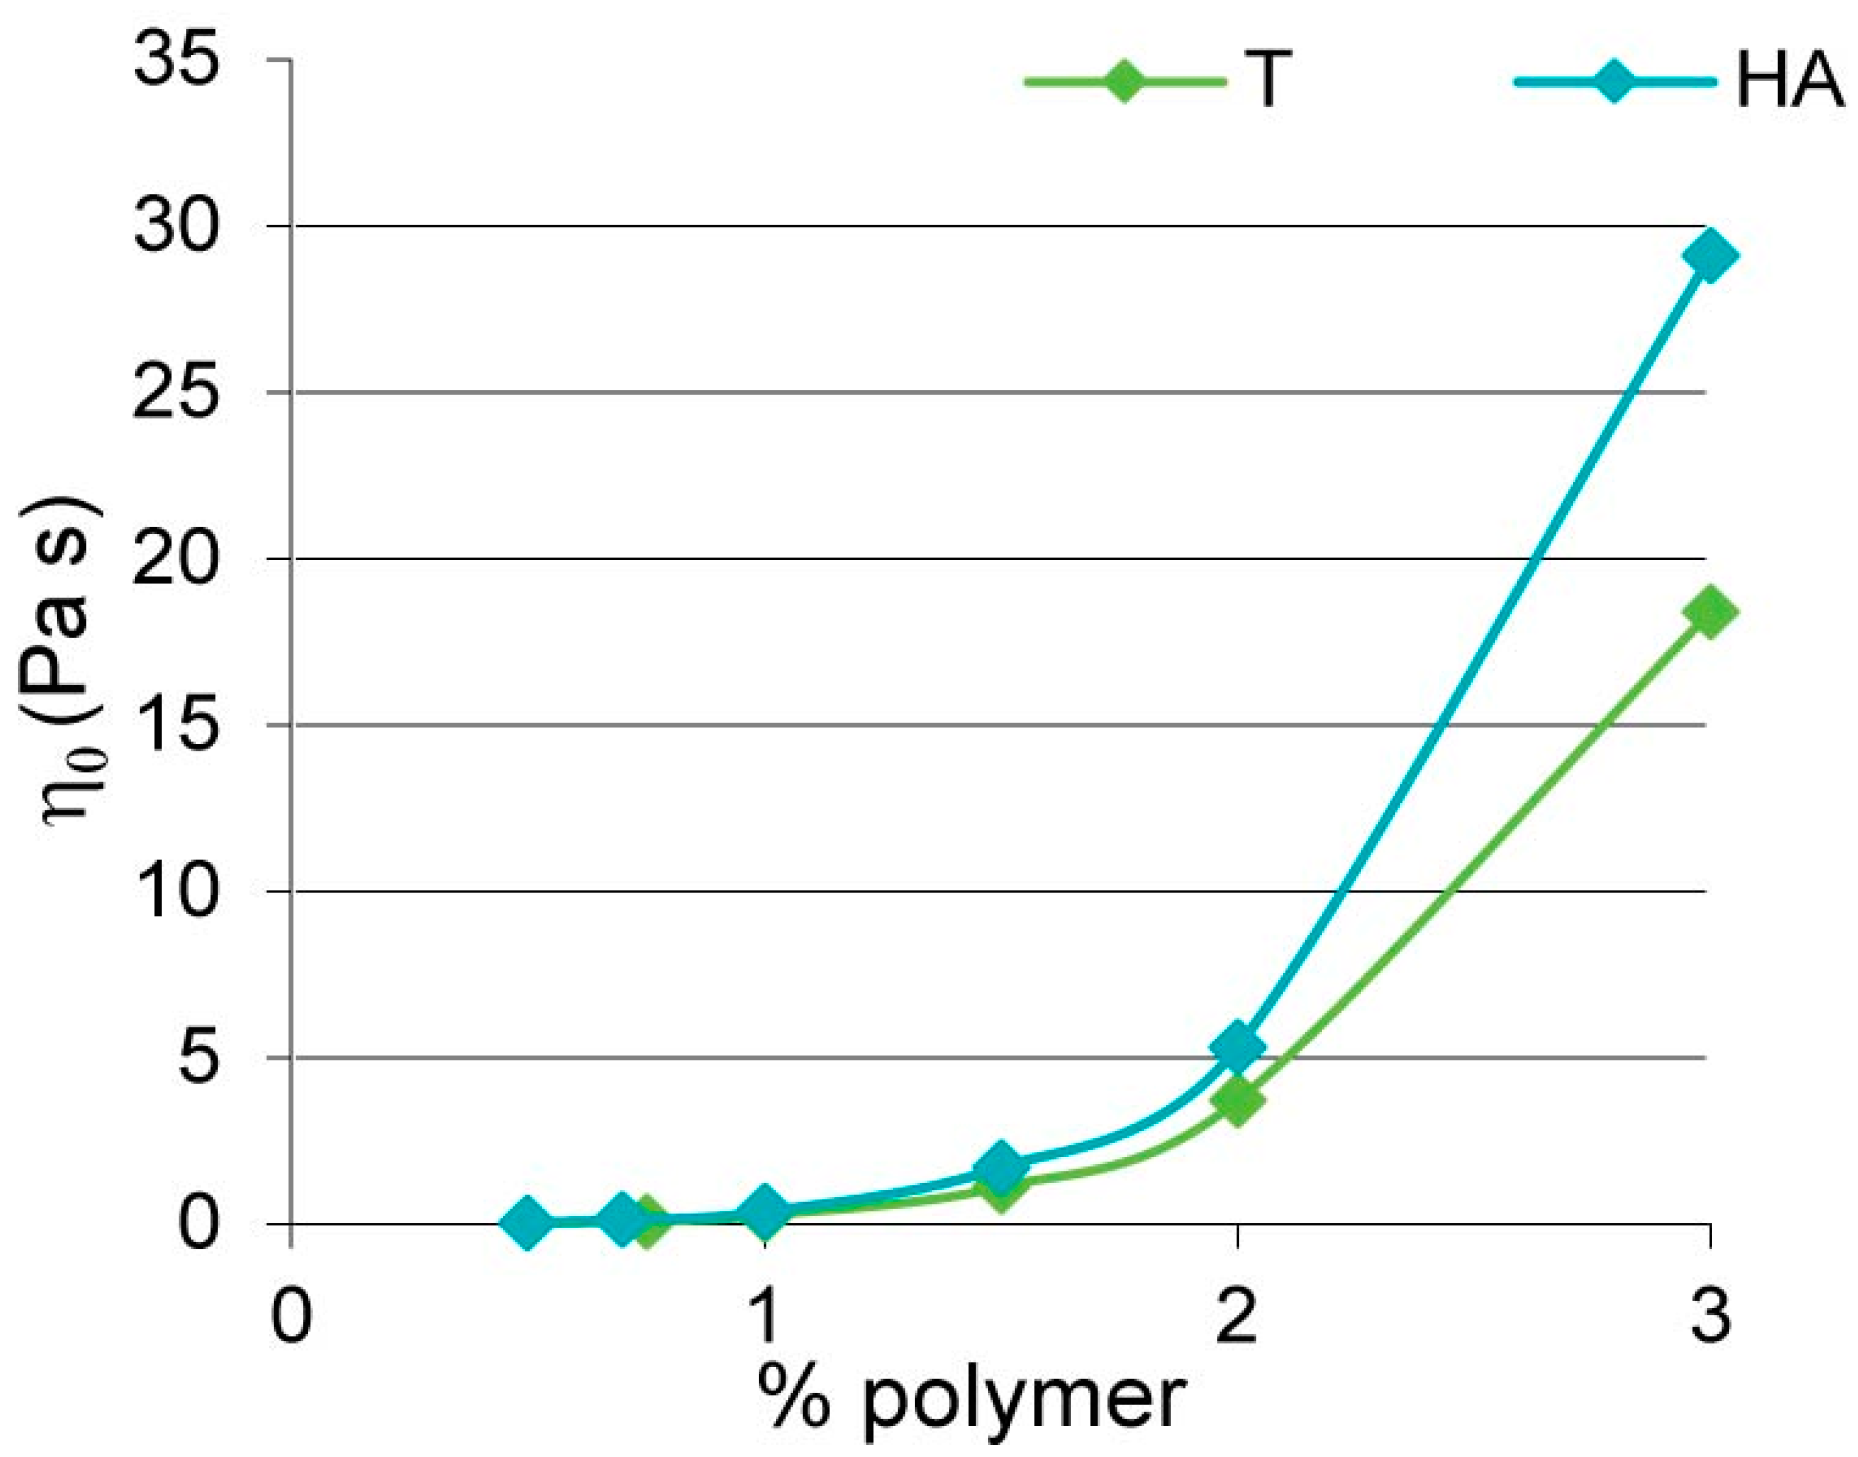
By plotting the viscosity at rest (η
0) values, calculated with the Carreau–Yasuda model [
9]
vs. polymer concentration (
Figure 3), we obtained similar trends (up to the 2%
w/
w) for the two polysaccharides.
Figure 3.
Viscosity at rest (η0) values as a function of polymer concentration.
Figure 3.
Viscosity at rest (η0) values as a function of polymer concentration.
At higher concentrations, HA aqueous dispersions were more viscous than those of TSP, suggesting a better swelling capability of hyaluronate, in concentrated water dispersions.
Even though hyaluronate and xyloglucan are polymers with different chemistries obtained from different sources (microbial and vegetal), the rheological properties of their solutions, in the concentration range investigated, were very similar, suggesting that the molecular weight represents the most relevant factor affecting their swollen structures. It is reasonable to think that the similarity in the rheology of the polysaccharides’ solution can produce comparable sensorial and moisturizing effects in personal care products. In
Figure 4a, the flow curves of TSP, HA and HB aqueous solutions (1%
w/
w) are compared. As expected, the rheological behavior of hyaluronic acid is significantly affected by the molecular weight. The HB sample shows an increment of viscosity at low shear rates, higher (two magnitude orders) than those of HA and TSP, together with a more marked shear thinning behavior.
Figure 4.
(a)Viscosity trends vs. the shear rate of HA, HB and TSP at 1% w/w; (b) η0 values as a function of polymer concentration.
Figure 4.
(a)Viscosity trends vs. the shear rate of HA, HB and TSP at 1% w/w; (b) η0 values as a function of polymer concentration.
By plotting the zero viscosity values, calculated with the Carreau–Yasuda model
vs. polymer concentration (
Figure 4b), the influence of the polysaccharide’s molecular weight in the rheology is more evident. HB water dispersions showed a more significant dependence on polymer concentration compared to TSP and HA samples.
3.2. TSP Association with Other Polysaccharides
It is well known that polysaccharide associations can be used in cosmetic formulations to improve the stability in time and to optimize the spreading properties of products. Both properties depend on the rheology of the systems. In fact, stability is strictly related to the elastic character of the material, while spreading is related to the viscous nature.
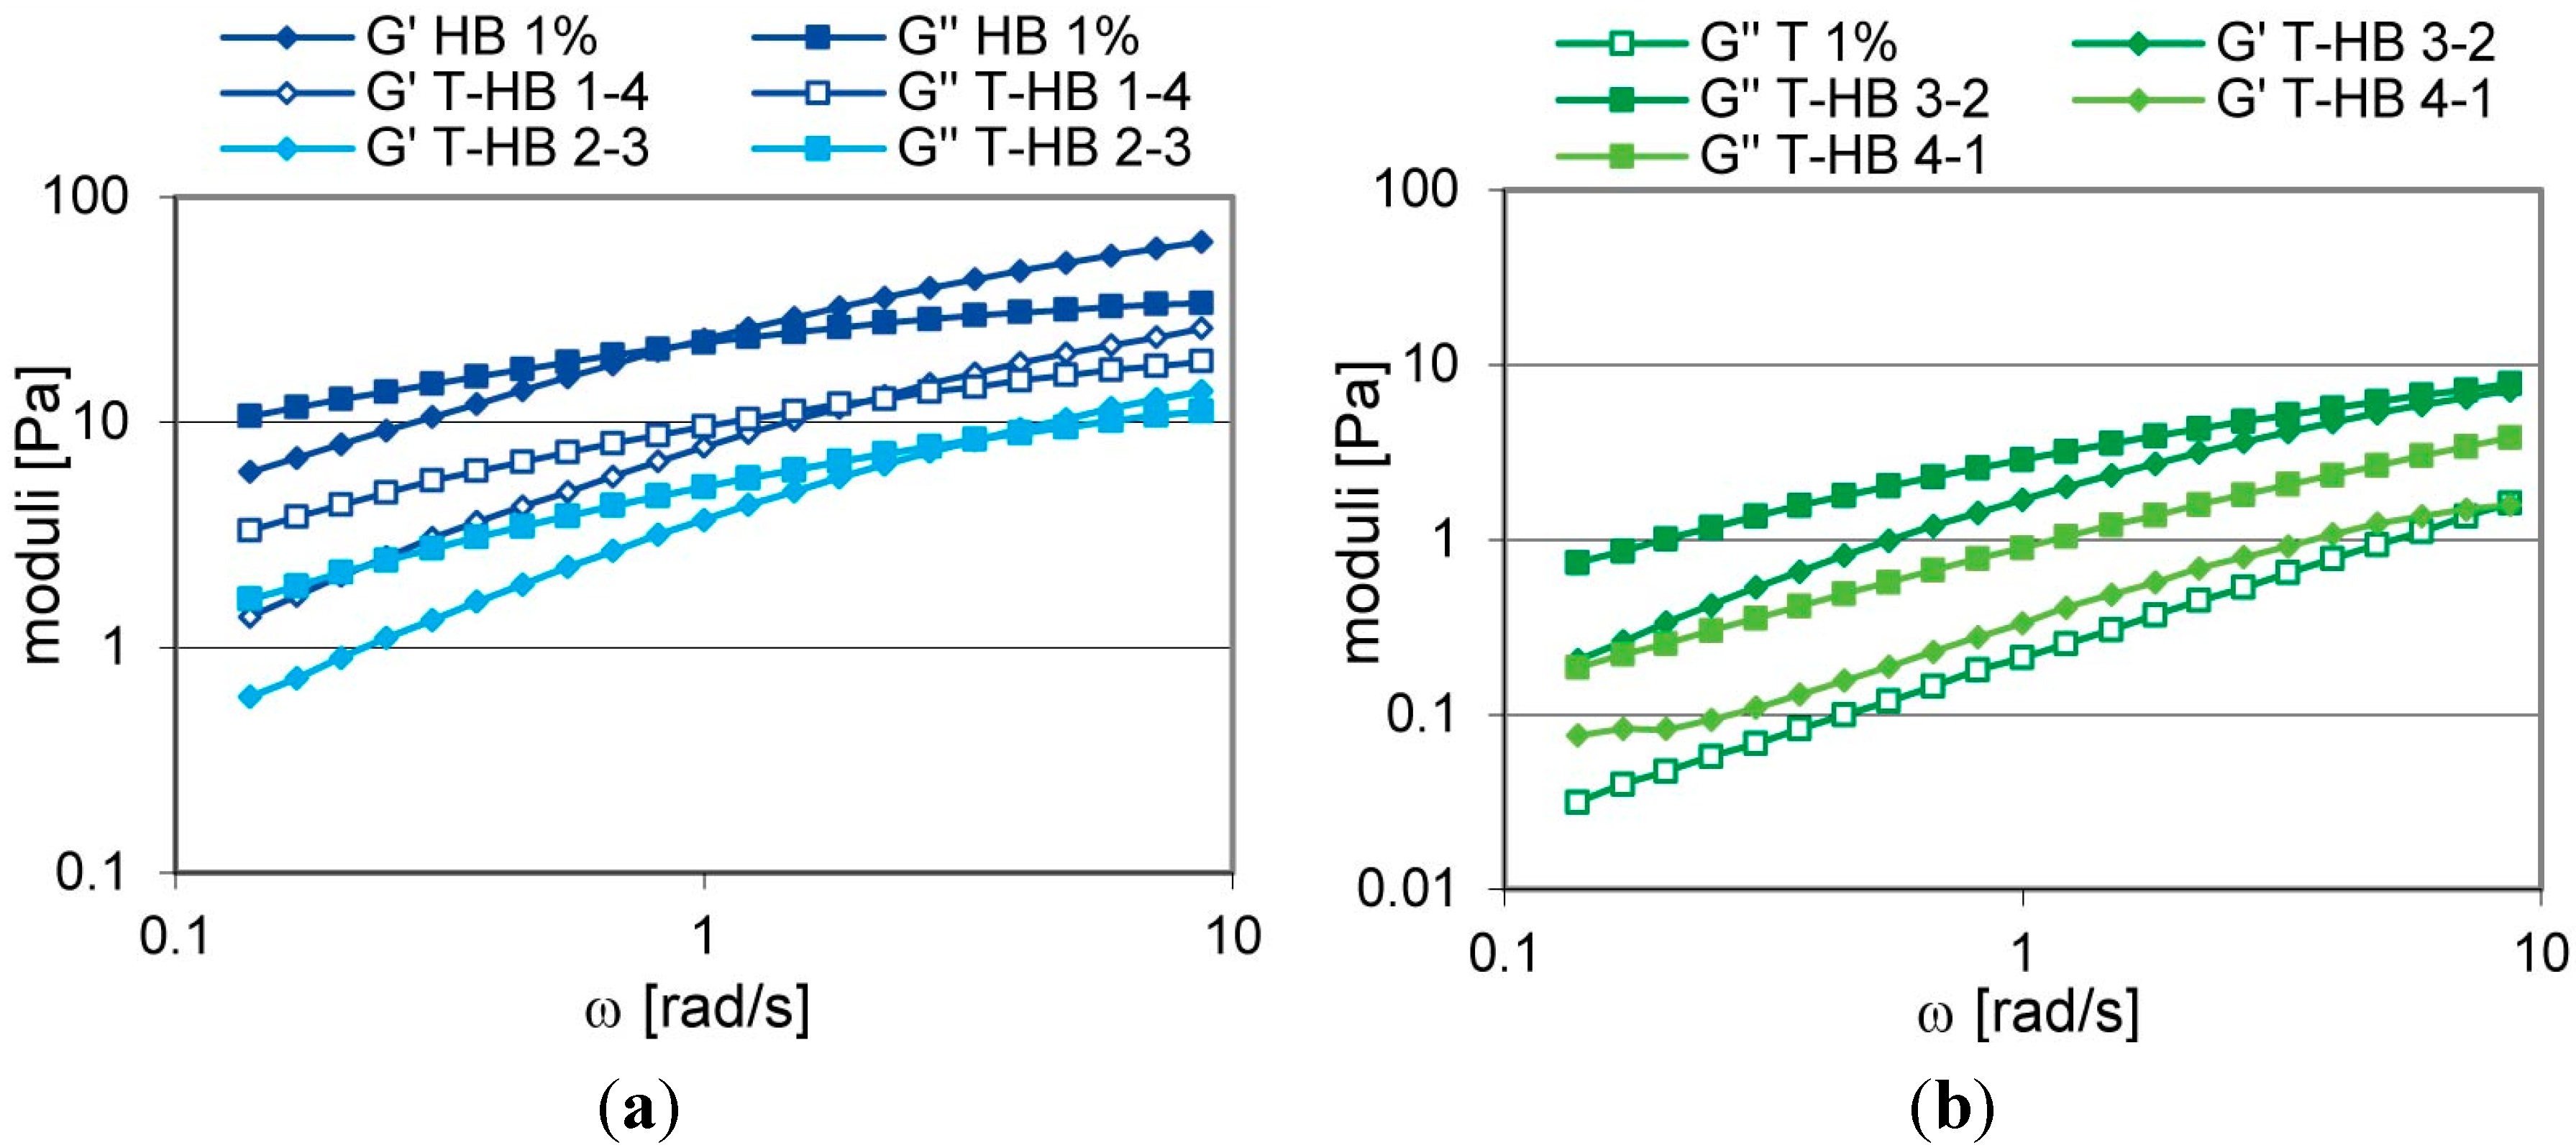
Figure 5 shows the moduli trends as a function of the frequency of 1% polymer solutions prepared using TSP-HB mixtures at different ratios, in comparison with those of each single polysaccharide (HB and TSP 1%).
It clearly appears that by mixing the two polysaccharides in different ratios, an interesting modulation of the viscoelastic properties can be easily obtained. All of the mixtures showed different viscoelastic properties, depending on the relative ratios of the two polysaccharides.
The mechanical spectra of the dispersions prepared using only TSP or HB represented the two boundary behaviors. TSP 1% solution had a relevant viscous character. By increasing the HB relative ratio in the mixture, the elastic character of the polymer dispersions progressively increased, HB 1% being the sample with a more evident viscoelastic character.
Figure 5.
G’ and G’’ trends as a function of the frequency of TSP-HB mixtures in different ratios: (a) 0:1, 1:4, 2:3; (b) 1:0, 3:2, 4:1 (1% w/w).
Figure 5.
G’ and G’’ trends as a function of the frequency of TSP-HB mixtures in different ratios: (a) 0:1, 1:4, 2:3; (b) 1:0, 3:2, 4:1 (1% w/w).
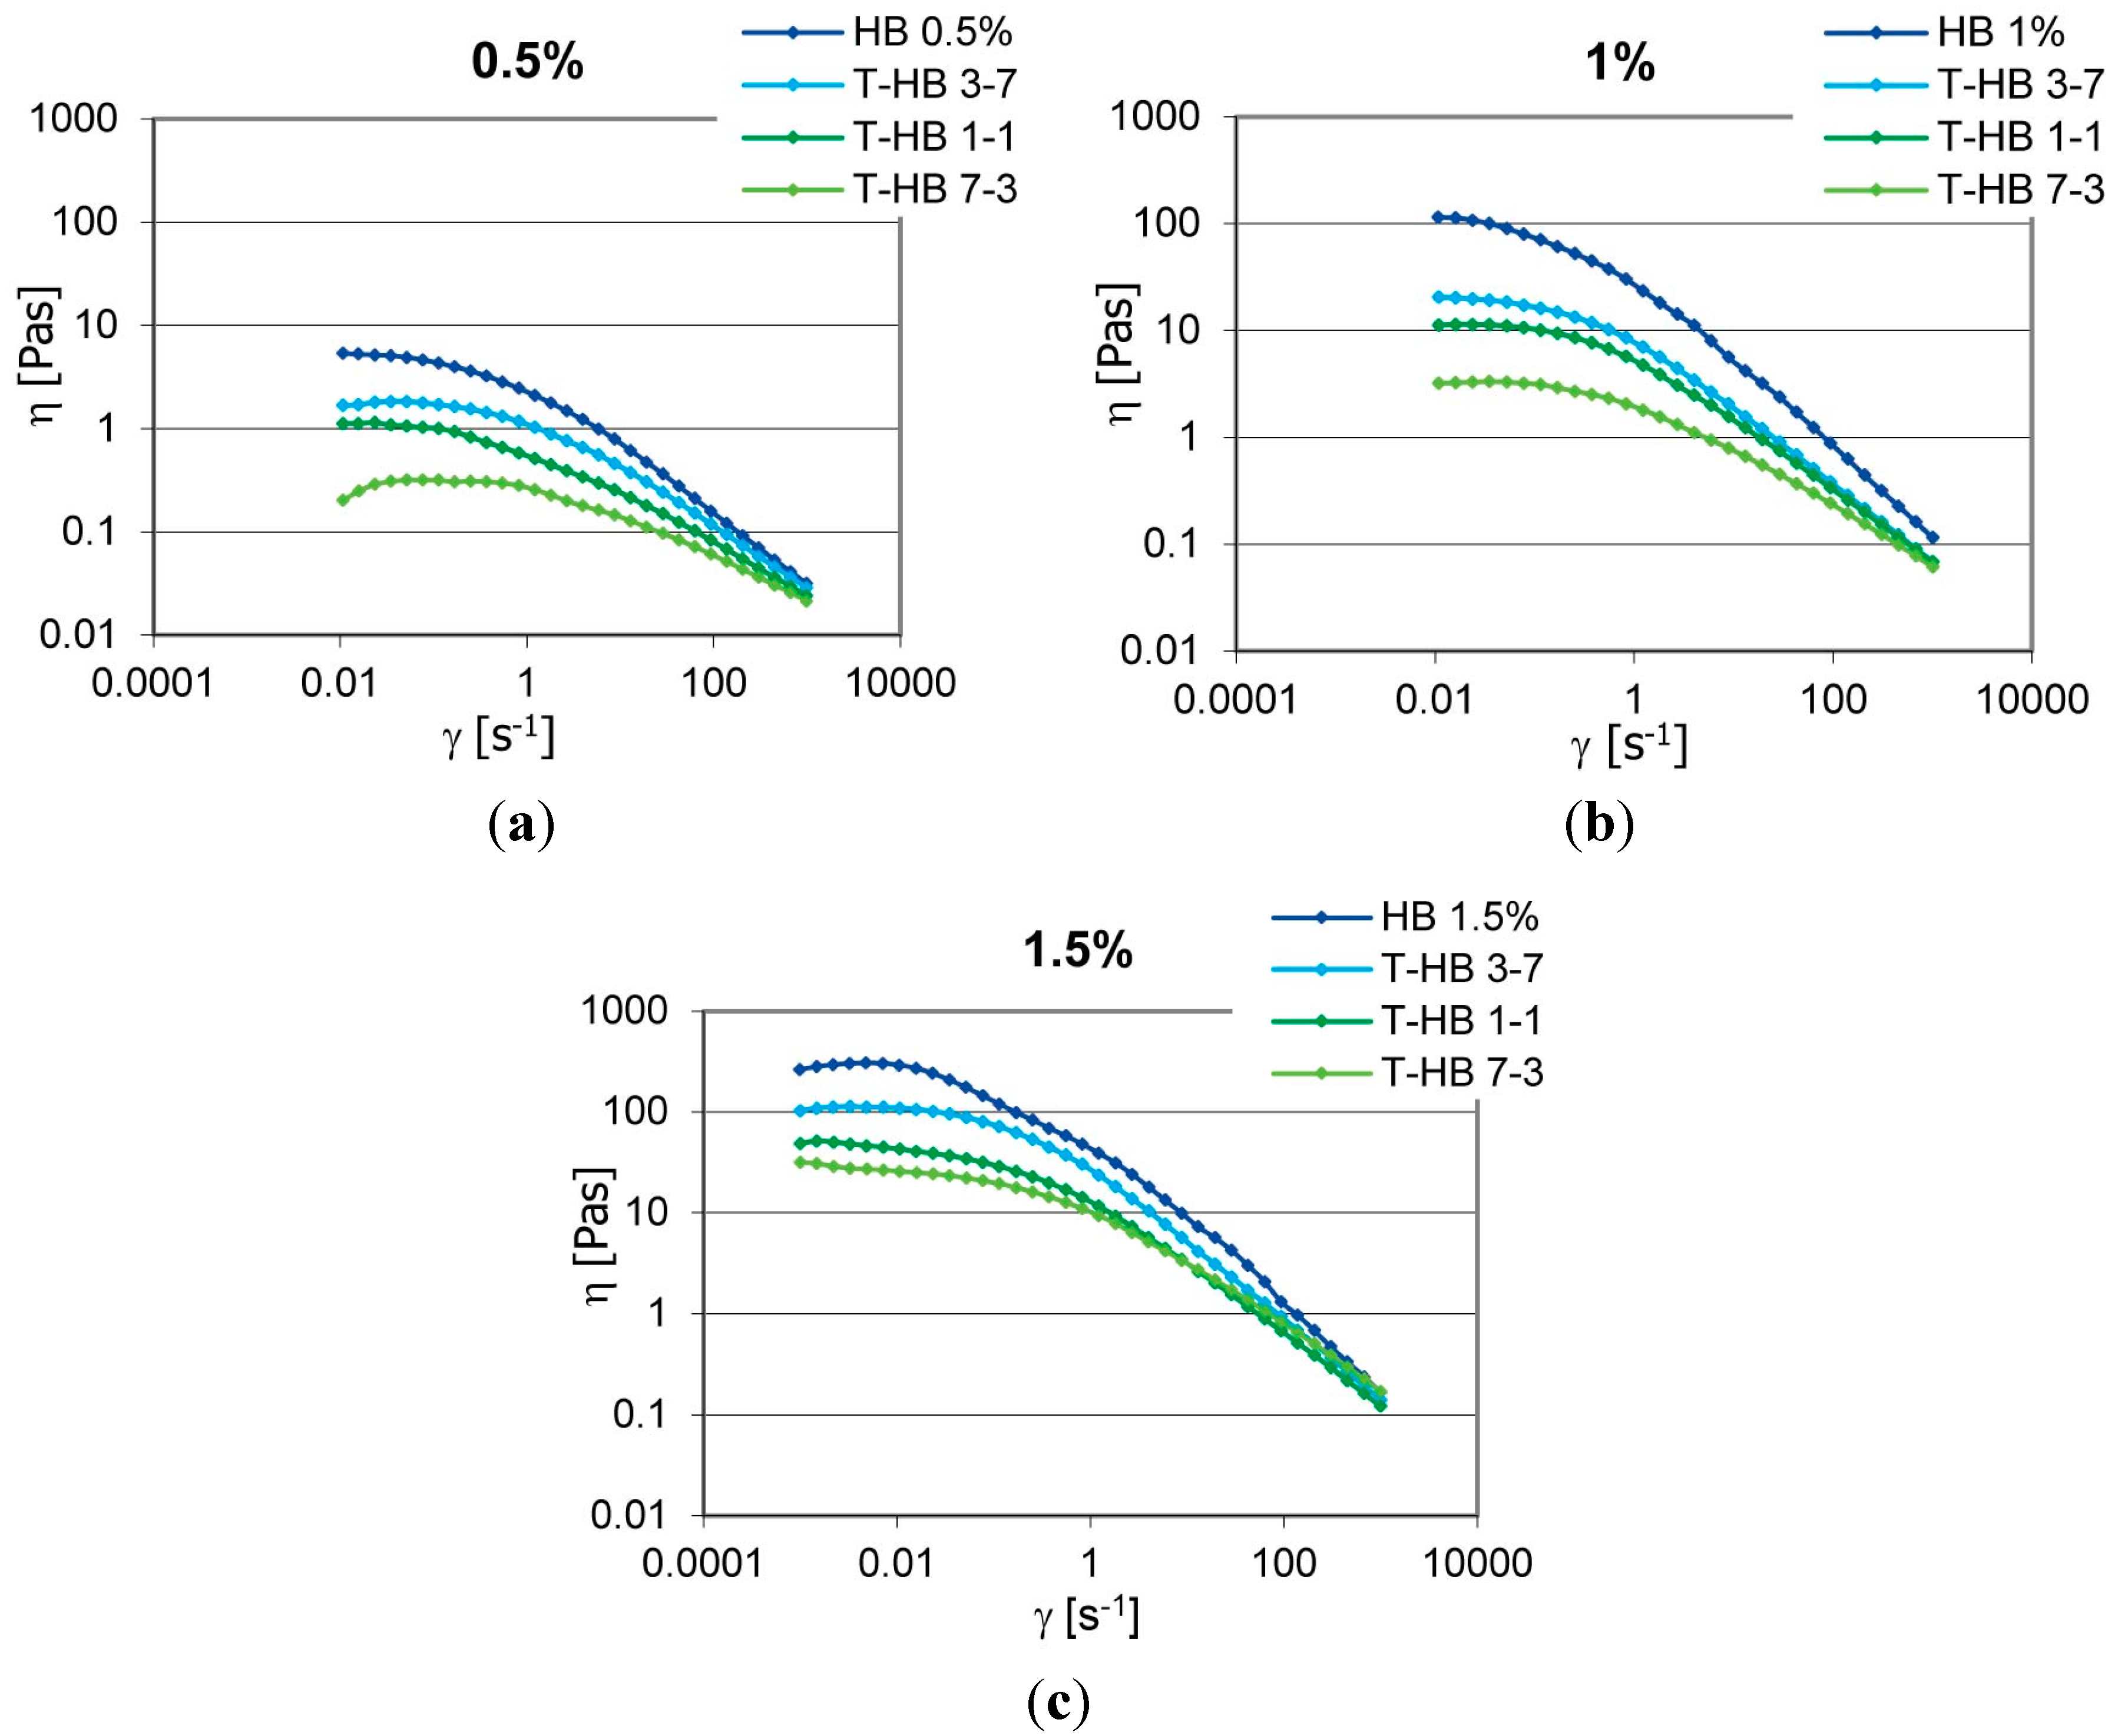
As expected, the association between TSP and HB can modulate also the flow properties of the gels. The viscosity trends as a function of the shear rate of various binary systems, prepared by mixing TSP and HB at different ratios (7:3, 1:1, 3:7), at different total polymer amounts (0.5%-1%-1.5%
w/
w), are reported in the following graphs (
Figure 6).
In order to improve the elastic character of the mixtures, we studied the rheological behavior of ternary polysaccharide mixtures formed by TSP, HB and dehydropolysaccharide gum (A). As a matter of fact, the increase of the elastic character improves the stabilizing properties of the polymer blend.
The flow curves and the viscoelastic properties of the TSP, HA, HB and A (1%
w/
w water dispersions) are shown in
Figure 7. Each polysaccharide had a peculiar and characteristic rheological pattern dependent on its swelling capability and on the nature and strength of its interactions with water molecules. The aqueous dispersion of dehydropolysaccharide gum (A) showed very high viscosity at rest (two magnitude orders higher than HB) and the most marked shear thinning behavior (a rapid decrease of viscosity with increasing shear rate) (
Figure 7a).
Figure 6.
Viscosity trends vs. the shear rate of T-HB mixtures at different polymer concentrations: (a) 0.5%; (b) 1%; (c) 1.5%.
Figure 6.
Viscosity trends vs. the shear rate of T-HB mixtures at different polymer concentrations: (a) 0.5%; (b) 1%; (c) 1.5%.
Figure 7.
(a) Viscosity trends vs. the shear rate; (b) G’ and G’’ trends as a function of frequency of A, HB, HA and TSP (1% w/w).
Figure 7.
(a) Viscosity trends vs. the shear rate; (b) G’ and G’’ trends as a function of frequency of A, HB, HA and TSP (1% w/w).
The mechanical spectra of sample A (
Figure 7b) showed an elastic modulus (G’) higher than the viscous modulus (G”) in all of the frequency ranges investigated, with trends of both moduli being slightly dependent on frequency. This pattern of the viscoelastic properties, typical of structured materials, such as gels, is known as “weak gel behavior” [
1].
These rheological data justify the different uses of the three polysaccharides in personal care products. The marked elastic character of A gels suggests a prevalent use as a stabilizer agent. The marked viscous character of TSP and HA water dispersions can improve both spreading and skin feel, while the viscoelastic behavior of HB gels in which there is a good balance between elastic and viscous properties can be used as thickening agent and also to improve the skin feel and spreading properties of cosmetics. Besides TSP or HA, HB and A can be used in combination in order to optimize the cosmetic properties.
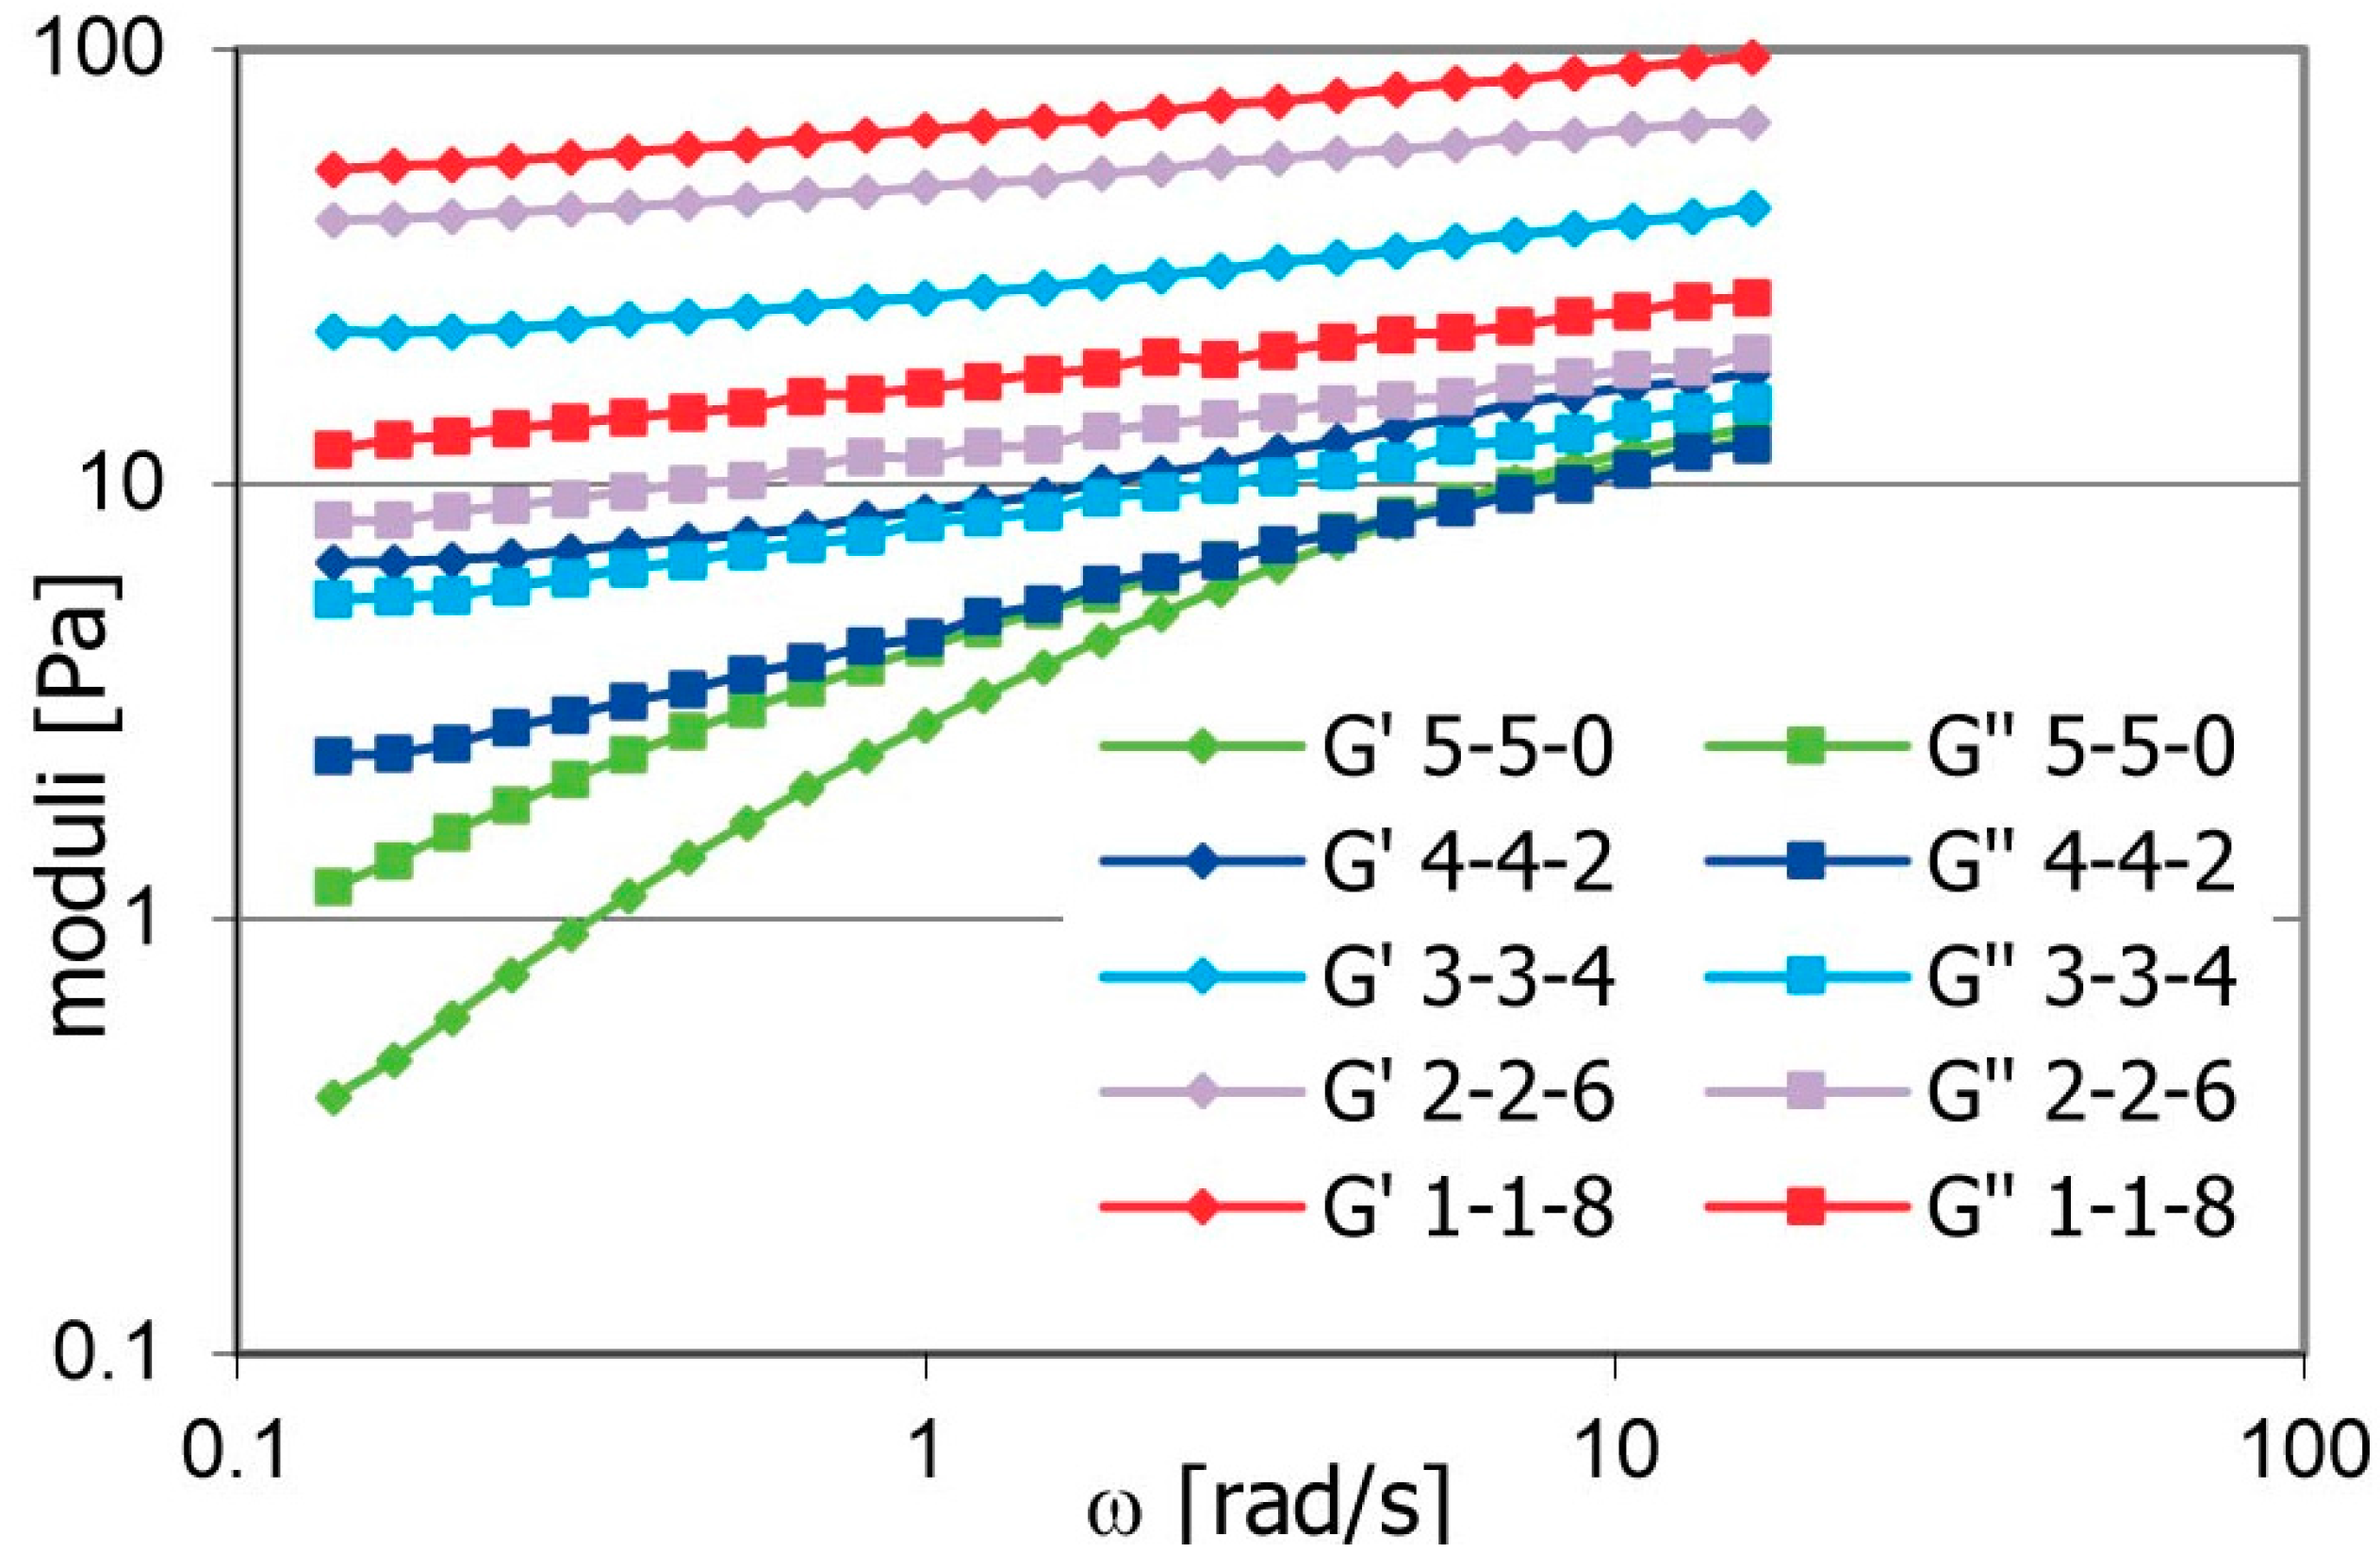
A series of ternary gels (1%
w/
w) was prepared by increasing the relative amount of A and keeping fixed the ratio of TSP and HB. The mechanical spectra of the different samples are shown in
Figure 8. As expected, the elastic character of the samples increased as a function of the dehydropolysaccharide gum (A) amount in the polymer mixture.
Figure 8.
G’, G” trends as a function of the frequency of ternary gels prepared with T-HB-A at different ratios (1% w/w).
Figure 8.
G’, G” trends as a function of the frequency of ternary gels prepared with T-HB-A at different ratios (1% w/w).
The mixture containing only TSP and HB (5-5-0) showed a liquid-like behavior, with both moduli strongly dependent on the frequency. All of the ternary mixtures presented a “weak gel” behavior with G’ and G” that became less dependent on the frequency as a function of the increasing concentration of A in the mixture. Furthermore, the absolute values of rheological parameters were consistent with the relative amount of A in the mixture, so that the mixture 1-1-8 showed the highest values of both elastic and viscous moduli.
We found good compatibility among the three polymers that can be easily associated with cosmetic formulations. The combinations of gels were clear and homogeneous and showed different rheological behaviors that can be used to optimize the sensorial and functional properties of the cosmetics, when the viscous properties are significant, and/or to improve their stability over time, when the elastic character is more marked.


