Abstract
As described in previous work, the use of synthetic chemical ingredients in modern cosmetics is postulated to be a cause of damage to the skin microbiome. The discovery that biodiversity on the human skin is currently the only reliable indicator of skin health, meant that for the first time, a mechanism to test for healthy skin was possible. Using this mechanism and in collaboration with The Medical University of Graz, who carried out the independent study, this work aimed to help answer whether modern day synthetic cosmetics are a main cause of long-term damage to the skin microbiome. Thirty-two human participants tested three different face washes for their effect on the skin’s microbial diversity, along with skin pH, moisture and TEWL (trans-epidermal water loss), washing twice-a-day for four weeks. The upper volar forearm of the volunteers was swabbed at the beginning, two weeks in and at the end of the four weeks. 16S rRNA sequencing was used. One leading ‘natural’ brand full of synthetic ingredients, a leading synthetic brand and a 100% natural face wash were used. Results give the first indications of a link between synthetic ingredients in a cosmetics product and its effect on skin microbiome biodiversity. It paves the way for future studies on the topic with a larger sample group, longer test period and standardised methodology to create a universal standard for testing the health of skin using benchmark diversity values. This can be used in the future to test the effectiveness of cosmetics or ingredients on skin health, leading to the restriction in cosmetics of products proven to harm the skin’s natural environment.
1. Introduction
1.1. The Skin Allergy Epidemic
Until now, the rapid growth of skin allergies and ill-health in the West has remained largely unexplained. In this paper we follow up previous work [1], where they discovered what was described as the first clear mechanism for measuring skin health. They observed that the same trait displayed across nature also applied to the skin. The higher the biodiversity in a specific environment, the healthier the ecosystem [2,3,4,5,6,7].
A catastrophic microbial diversity loss observed in the human gut microbiome in developed countries has been attributed to exposure to Western world practices [8]. Consequently, there has been a rapid increase in food allergies in the last 75 years. The same applies for skin allergies, where the rate of deterioration has accelerated in the past 5–10 years [9,10,11,12,13,14,15,16,17], leading to some labelling it a “skin allergy epidemic”. Multiple environmental factors are suggested to be contributing to this, but it has been increasingly linked to synthetic additives in cosmetics [18,19,20,21,22,23]. The exposure of normal, Western skin to twenty-first-century cosmetics, soap, antibiotics, steroids and showering/washing [24], does appear to have altered the natural microbiota environment of humans, especially in the developed world [11,25,26,27,28,29,30,31]. Natural ingredients, in the proportions found in nature, are not seen as “alien” to the skin’s natural environment unlike synthetic ingredients, which humans have only encountered in the last 60 years of their 200,000 years of existence [11]. This alteration, in many cases, has been linked to increased susceptibility to disease and infection [27,32,33]. Research into the skin microbiome lags far behind that of the gut [34,35], where it is common knowledge that unbalanced, non-diverse gut flora is causally linked with many health problems [36]. Preservation and encouragement, not destruction, of the intestinal microflora is now known to be essential for overall health [2,37]. The crucial role that the skin plays in overall health is only just being realised [26,38,39,40,41].
The discovery of the mechanism using biodiversity was inspired by the exceptionally high human microbial gut diversity found in rural Burkina Faso [42]. We uncovered a complete lack of conclusive evidence linking a particular dominating type of bacteria with skin health or disease, as humans display a high intra- and interpersonal variation in skin microbial composition [10,38,43,44] where each individual has a “virtually unique microbiota” [11,45,46].
When damaged or diseased, skin harbours a reduced diversity of microbial species compared to healthy or normal skin [10,15,47,48,49,50,51], which fits in with several studies that link high bacterial diversity with better host protection by an innovative and adaptive immune system [32,52,53]. The average skin microbial diversity, and consequently skin health, of healthy Western subjects was found to be much less than that of “perfect” or “caveman” skin on healthy subjects with little or no exposure to Western practices [47,48,49]. The diversity was lowered further still on Western subjects with skin ailments [10,38,50,54,55,56]. Acne was found to be a Western skin ailment, absent on skin from individuals in rural Papua New Guinea and Paraguay [57]. This is further evidence that an environmental factor in the Western world is causing a catastrophic ecosystem collapse on the skin.
1.2. The Role of Skin Microbiota
The majority of microbiota which inhabit the skin are harmless or beneficial [11,25,27,43,58], and crucial for host defence [32,53,59,60,61,62,63,64,65,66,67]. The relationship is “mutualistically symbiotic” meaning the host and microbes benefit [58,68,69].
Contrary to the common belief that some microbes are inherently harmful, pathogenicity only occurs when the balance of the ecosystem is disturbed, and diversity is decreased. This “perturbation” of the skin microbiome, or “dysbiosis”, is responsible for many skin conditions [70]. The difference between harmless bacteria and a pathogenic agent is due to the ability of the skin as a whole to resist disease and infection, not the built-in properties of the microbe [27,43].
Dysbiosis and decreased microbial biodiversity of the skin microbiome has been linked with many diseases, including acne, eczema [71], dermatitis [10], rosacea [72], Malassezia folliculitis [73], inflammation [74], psoriasis [75], general allergies [76], sunburn [77], athlete’s foot and ringworm [78], wound healing [79], diabetic skin [51], leishmaniasis [49], blepharitis and conjunctivitis [80], and skin cancer [81].
This paper uses the mechanism described in previous work [1] to evaluate three everyday cosmetics products for their effect on human skin microbiome diversity. The main objective was to begin the process of discovering whether a link existed between the amount of synthetic ingredients in applied products and their effect on skin microbiome diversity.
2. Methods
2.1. Study Design
The aim of the study was to compare the skin microbiome after application of three different face washes; two “everyday” products and one 100% natural product. This would be a first step in finding out whether a correlation exists between the amount of synthetic ingredients in a product and its effect on skin health. The products were applied twice-daily on the volar forearm of thirty-two human volunteers for four weeks.
Once they were assigned a product to use, to minimise the effect on the measurements by factors other than the products provided, the volunteers were instructed:
- Use as the only shower gel for the whole body once-a-day and apply it a second time on their forearm each day.
- To only use their assigned product when showering, and no others—no make-up, moisturisers, hand washes/sanitisers, shower gel, or creams. Using their normal shampoo was allowed providing they limited the amount contaminating the volar forearm area.
- In cases where they cannot avoid the use of another cleaning product (e.g., hand gel in the lab), to avoid getting the product on or near their volar forearm for the duration of the study.
- To not use the product on the day of sampling, until swabbing had taken place.
The entire project was carried out in collaboration with The Medical University of Graz in Austria, and run independently, supervised by the Professor for Interactive Microbiome Research at the Department of Internal Medicine. All study participants were recruited by The Medical University of Graz.
2.2. Products
The first product used was JooMo’s face wash. JooMo claim to have developed the world’s first 100% truly natural face and body wash. Their claims and ingredients are listed on their website, with their central point being that their definition of the word ‘natural’ is taken from food industry standards [82] rather than the cosmetics industry where there are no legal definitions. Every ingredient is sourced directly from nature, with no chemical or physical changes. The second product is a leading ‘natural’ brand, and the final product is a leading synthetic brand.
Appendix A.1, Appendix A.2 and Appendix A.3 list product ingredients. The ‘natural’ product was chosen because it is one of many products which is labeled “natural” but is not. Using the same definition of the word ‘natural’ taken from food industry standards, it contains twenty-three ingredients, sixteen of which are synthetic—70% of the total. This misuse of the word ‘natural’ is replicated throughout the industry. The product selected was a typical example of the synthetic ingredient proportions found in high-street brands which use this unregulated term. In comparison, the synthetic product contains twenty-eight ingredients, twenty-one of which are synthetic—75% of the total.
Several of the synthetic ingredients have been linked to potential harm, including methylisothiazolinone which is contained in the ‘natural’ product. Known as MI, it is linked to allergic reactions [83] and possible neurotoxicity [84]. Its use has been banned in Canada, regardless of whether it is used alone or in a mixture with methylchloroisothiazolinone (MCI) in leave-on cosmetics in the EU and had its limit in other cosmetics reduced from 100 ppm to 15 ppm. Both MCI and MI are present in the so-called ‘natural’ product.
2.3. Study Subjects and Skin Measurements
Thirty-six female volunteers between the ages twenty to forty-five were recruited for the study at the Medical University of Graz, however only thirty-two volunteers completed the study due to dropping out with illnesses. The subjects’ skin pH, moisture, and trans-epidermal water loss (TEWL) measurements were made at each time point, as well as DNA sequencing of their microbiome.
Skin measurements were done after the sampling, starting with the Tewameter TM300 (Courage + Khazaka GmbH, Cologne, Germany) measurement, for trans-epidermal water loss, followed by the Corneometer (CM825 Courage + Khazaka) for moisture, and the Skin-pH-Meter (PH905 Courage + Khazaka) measurement. All measurements were repeated 3 times (Tewameter 3 times 30 s), and the average was used for further interpretations.
Based on the instructions of Courage and Khazaka, the results were interpreted as follows: Tewameter (in g/hm2) 0–10 very healthy skin, 10–15 healthy skin, 15–25 normal skin, 25–30 stressed skin, >30 critical skin; Corneometer < 30 very dry, 30–40 dry, >40 adequately moist; pH-Meter 3.5–4.49 acid range, 4.5–5.5 normal range, and 5.51–7 alkaline range.
Participants were grouped together with regards to similarities in their skin measurements and then divided into the three groups. Each were assigned one product.
2.4. Sample Collection
The microbiome sampling (BBl culture swabs, Becton Dickinson) was performed three times; before product use (T1), after two weeks of product use (T2), and after 4 weeks of product use (T3). The upper part of the volar forearm of the non-dominant arm (3 right, 29 left) was swabbed with pre-moistened swabs (50 mM Tris (pH 7.2), 1 mM EDTA, 0.5% Tween20) in three different directions over the whole area for ~30 s. In addition to skin swab samples, we used negative controls, including PCR and sequencing controls, DNA extraction controls, swab controls for each sampling time point, and controls of each product to exclude the effect of possible contamination from laboratory reagents.
Human skin samples were taken non-invasively and handled with approval by and in accordance with the Ethics Commission at the Medical University of Graz. The Ethics Commission stated that no ethical concerns are raised by the methods applied and approved the following procedures without the need for an ethics vote. Informed verbal consent was obtained from each person prior to the study. Samples were treated anonymously, and human material was not the focus point of this study. Microbial samples or data derived cannot be linked to a certain individual. The process of the experimentation was agreed upon by The Medical University of Graz, and ACIB (The Austrian Centre of Biotechnology), a not-for-profit research organisation through whom the funding application was made.
2.5. DNA Extraction
After sampling, swabs were broken into DNA-free reaction tubes and then frozen at −80 °C until DNA extraction. For the DNA extraction, the swabs were transferred to Matrix E tubes with flamed tweezers. DNA extraction was performed using the Fast Spin DNA Extraction Kit with Matrix E tubes according to the manufacturer’s instructions with the following changes: 10 min shaking with a vortex device for the samples of the first two sampling time points; for the samples of the last sampling time point, a Magna Lyser from Roche with 2 × 30 s was used. The first centrifugation step was performed for 10 min [85].
The concentration of the DNA was determined with Qubit HS Kit and PCR was performed using 2 µL of extracted product, since the DNA concentration was below the detection limit in all samples. Primers for PCR were used as in earlier publications [86]. The PCR of four samples had to be repeated with 1 µL to get a visible product on the gel electrophoresis.
Electrophoresis was executed with a 1.5% agarose gel with Roti Gel Stain for 35 min at 70 V, with a Fastruler LR Ladder and tested bacterial DNA from Bacillus subtilis or Eschericia coli as positive controls. DNA extracts and PCR products were stored at −20 °C.
After DNA Extraction, the DNA of all samples were under the detection limit of 0.01 µg/mL. After PCR, there were visible bands in the gel electrophoresis in all samples. During sequencing, no samples or negative controls were lost because of too few reads. Reads observed up to a defined percentage in the negative controls (extraction controls, product controls etc.) were removed from the dataset.
2.6. Analysis
Library construction and NGS sequencing (Illumina MiSeq) were performed by the Core Facility Molecular Biology at ZMF, Medical University of Graz. Raw reads were obtained and processed with Qiime and the Greengenes database. Qiime was operated according to standard protocols. Output was filtered for chloroplast, mitochondria and chimeric sequences; against singletons (all <5 were removed) and unclassified reads; and sequences retrieved in controls (blanks) were removed when >1%.
16S rRNA gene biom table was analysed using Calypso, an online tool (found at http://cgenome.net/calypso/) [87]. For Calypso, the settings were as follows: square roots normalization and total-sum normalization (TSS) were used; no samples were removed, no taxa were removed; 0.005% cut off for rare taxa. All data was compared for alpha and beta diversity. Alpha diversity included both Chao1 and richness indices. For an explanation of the Chao1 index, see our previous paper [1] or previous work [87,88]. This was done for the different time points for all groups, the single groups and for the third sampling time point of all groups. The Alpha diversity graphs in Section 3.1.1 are displayed primarily as boxplots, which are each normalized to a different read depth, depending on the smallest sequence count of the data set considered. The data was also compared using an LEfSe algorithm to identify taxa which significantly differed in abundance between treatments [89]. PCoA plots were also included, which is a statistical technique that uses clusters of samples which have similar biological communities to assess differences in them [90].
The results of the skin measurements were statistically analysed using a paired T-Test in Excel and a two-way mixed ANOVA model with SPSS. For quality control, the data was also examined for standard distribution, variance and co-variance with the Levene test and the Box-test, and sphericity with the Mauchly test. The three outliers, which were defined by a studentised residual bigger ±3, were not excluded from the analysis. Values of p > 0.05 for the standard distribution, the Levene test and the Mauchly test and p > 0.001 for the Box-test were necessary to fulfill the requirement of equality. The Bonferroni correction was also used.
To check the results in this study can be replicated, please use the data in the ‘Supplementary Materials’.
3. Results
3.1. Microbiome Analysis
The results are shown in the following sections. Accompanying each figure is the read depth to which those samples were normalised (rarefied). They are included to explain what look like disparities in the same data when looking at different graphs, as different datasets were normalised to different read depths. We also note that samples were normalised to contain the smallest number of sequences found in the dataset, which can diminish the resolution of results.
3.1.1. Alpha Diversity
All groups displayed an increase in the α-diversity over time, as shown in Chao1 and richness indices with T1 sample points split for the three different groups (Figure 1 and Figure 2). The values for the Chao1 diversity quartiles shown in Figure 1 are shown in Table 1.
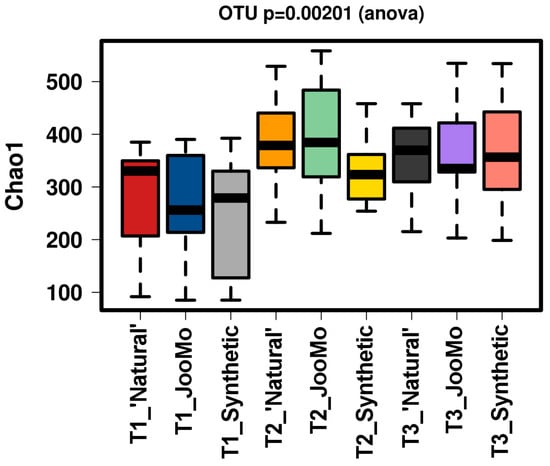
Figure 1.
Chao1 of the different time points per group. There is a significant increase in diversity in all groups over time. The samples were normalised to a read depth of 534 sequences.
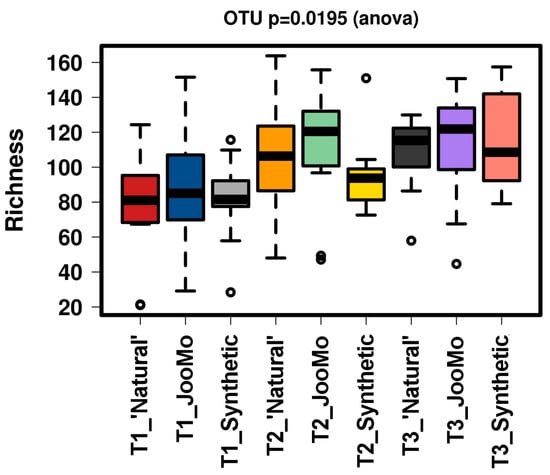
Figure 2.
Richness of the different time points per group. This figure shows a significant increase of richness. The samples were normalised to a read depth of 534 sequences.

Table 1.
Numerical values of diversity for Figure 1 box plots.
In all shown box plots, the black bar shows the mean. Using the mean values from Figure 1 and Figure 2, Figure 3 and Figure 4 were created. The accompanying Table 2 and Table 3 give the percentage change in each graph. The increasing diversity effect also appeared for product groups (Figure 5, Figure 6, Figure 7, Figure 8, Figure 9 and Figure 10C). Chao1 and Richness indices are also shown comparing only T1 with T2 and T1 with T3 (Figure 5, Figure 6, Figure 7, Figure 8, Figure 9 and Figure 10A,B). In these figures, a significant increase in Chao1 is observed in JooMo for both the compared time points, only for T1/T3 in the synthetic group, and only for T1/T2 in the ‘natural’ group. The increase in richness is significant for one of the two time point comparisons in the JooMo group, for both in the ‘natural’ group, and T1/T3 in the synthetic group.
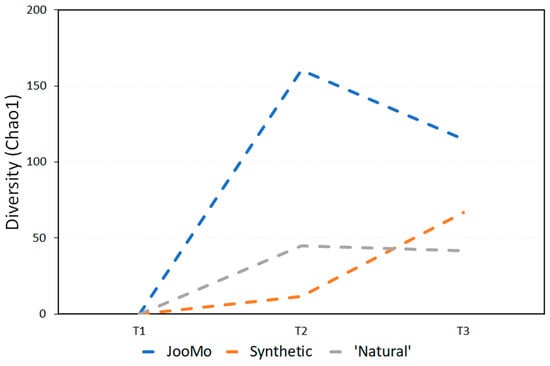
Figure 3.
Average change in biodiversity for all time periods, using the Chao1 index.
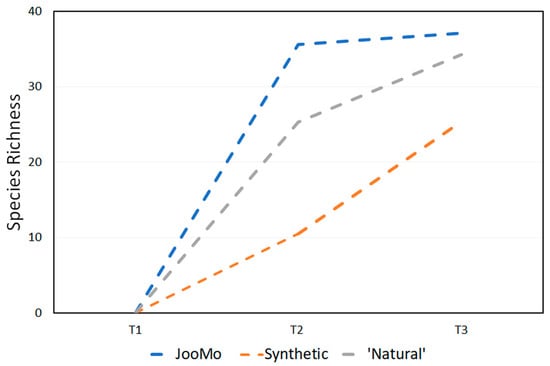
Figure 4.
Average change in species richness at every time point.
Table 2.
Percentage change in Chao1 diversity for all product groups.
Table 3.
Percentage change in richness for all product groups.
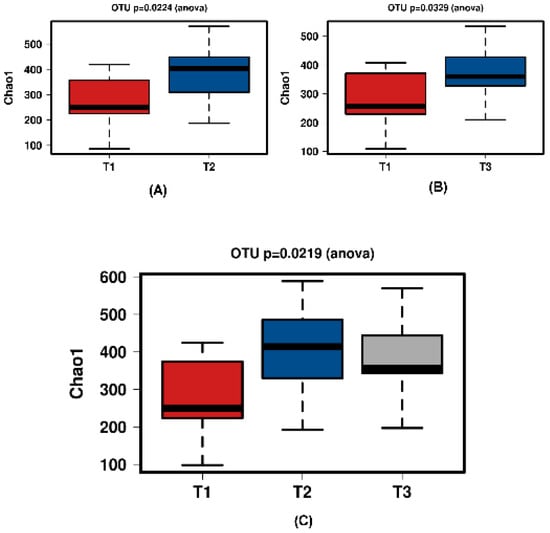
Figure 5.
Diversity using Chao1 index of all time points of the JooMo group samples. (A) shows T1 and T2 with a significant increase over time. Samples normalised to a read depth of 2364 sequences; (B) shows T1 and T3 with a significant increase over time. Samples normalised to a read depth of 2366 sequences; (C) shows T1, T2 and T3 with a significant increase in diversity. Samples were normalised to a read depth of 2361 sequences.
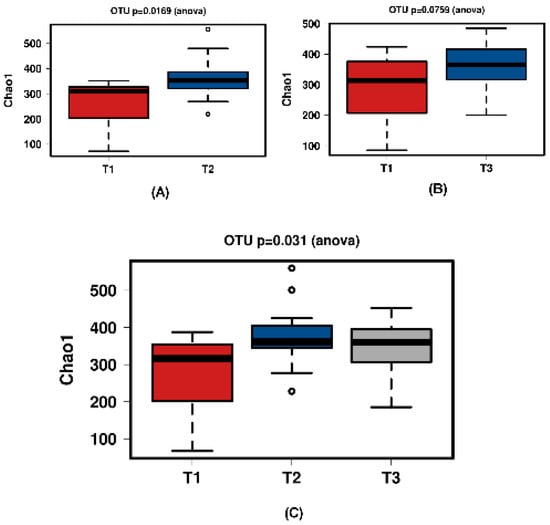
Figure 6.
Diversity using Chao1 index of all time comparisons of the ‘natural’ group samples. (A) shows T1 and T2 with a significant increase over time. Samples normalised to a read depth of 1163 sequences; (B) shows T1 and T3 with no significant increase over time. Samples normalised to a read depth of 1158 sequences; (C) shows T1, T2 and T3 with a significant increase in diversity. Samples normalised to a read depth of 1162 sequences.
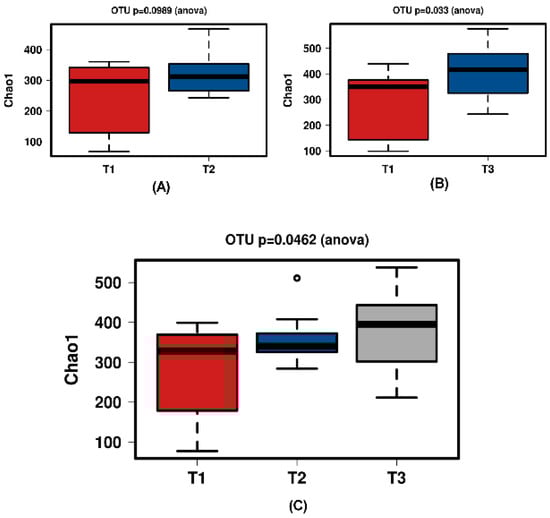
Figure 7.
Diversity using Chao1 index for the synthetic group samples. (A) shows T1 and T2 with no significant increase over time. Samples normalised to a read depth of 564 sequences; (B) shows T1 and T3 with a significant increase over time. Samples normalised to a read depth of 578 sequences; (C) shows T1, T2 and T3 with a significant increase in diversity. Samples normalised to a read depth of 559 sequences.
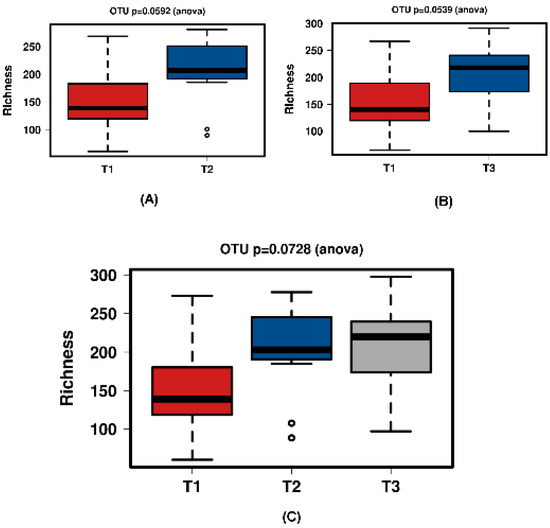
Figure 8.
Richness for the JooMo group samples. (A) shows T1 and T2 with a significant increase over time. Samples normalised to a read depth of 2364 sequences; (B) shows T1 and T3 with a significant increase over time. Samples normalised to a read depth of 2366 sequences; (C) shows T1, T2 and T3 with a non-significant increase over time. Samples normalised to a read depth of 2361 sequences.
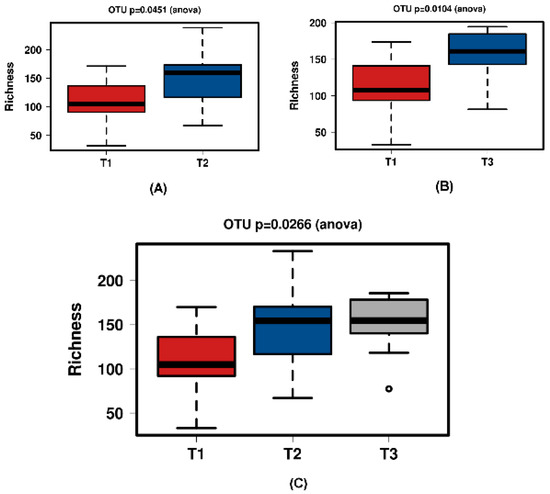
Figure 9.
Richness for the ‘natural’ group samples. (A) shows T1 and T2 with a significant increase over time. Samples normalised to a read depth of 1163 sequences; (B) shows T1 and T3 with a significant increase over time. Samples normalised to a read depth of 1158 sequences; (C) shows T1, T2 and T3 with a significant increase over time. Samples normalised to a read depth of 1162 sequences.
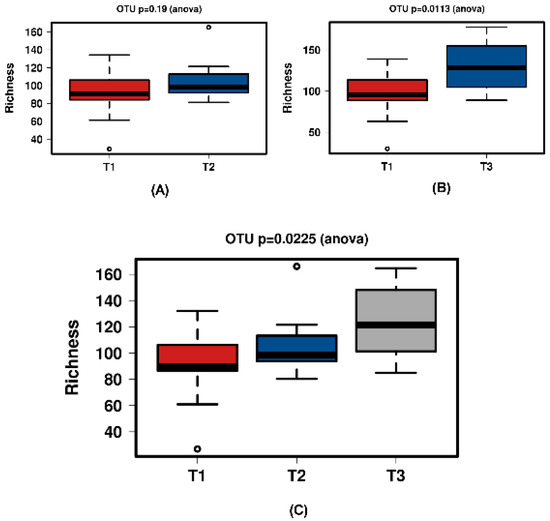
Figure 10.
Richness at all time points during the study of the synthetic group samples. (A) shows T1 and T2 with no significant increase over time. Samples normalised to a read depth of 564 sequences; (B) shows T1 and T3 with a significant increase over time. Samples normalised to a read depth of 578 sequences; (C) shows T1, T2 and T3 with a significant increase over time. Samples normalised to a read depth of 559 sequences.
3.1.2. Beta Diversity
Comparing the β-diversity of the different product groups over all time points with only time point three did not show any significance. An example for β-diversity is shown in the PCoA Plot from the different time points per group (Figure 11). This is shown again with T1 split between the product groups. The outlying T1 sample points moved towards the ‘crowd’ during product use (Figure A1).
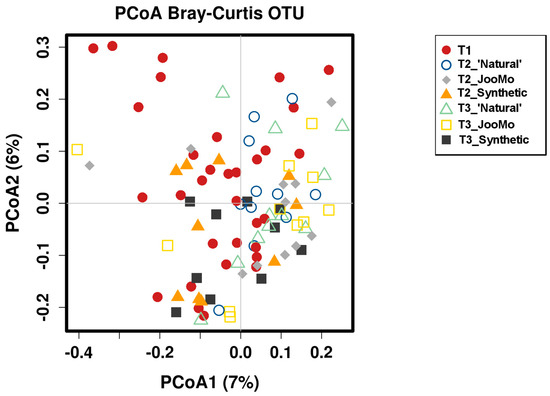
Figure 11.
PCoA plot of the different time points per group. Each point refers to one microbiome measurement. Shapes and colors indicate the different time points and the product group (see legend). No significant grouping.
Redundancy analysis (RDA -β-diversity) showed that the parameter ‘time’ had a significant effect on the grouping, suggesting that the skin microbial community structure changed during the experiment. However, the percentages of axes in the RDA are very low (x-and x%) and therefore explain only a minor share of the total variance of the dataset (Figure 12).
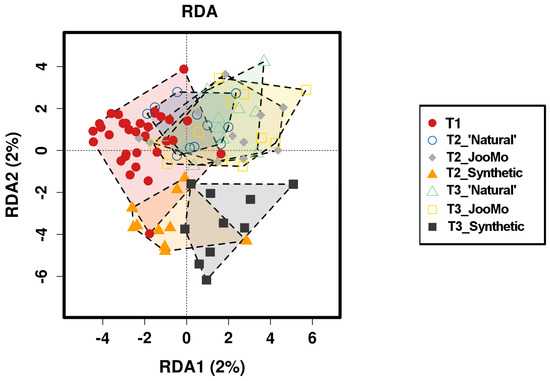
Figure 12.
Redundancy analysis (RDA) plot of the different time points per group and T1 as basic dataset before product use.
3.1.3. Rarefaction
3.2. Skin Measurement—General
The products’ pH is shown in Table 4. During the study, the skin physiology, as revealed via the skin measurements of trans-epidermal water loss (TEWL using the Tewameter), pH and moisture (using the Corneometer), changed significantly for all groups (Figure 13 and Figure 14; Table 5 and Table 6).
Table 4.
pH of all products.
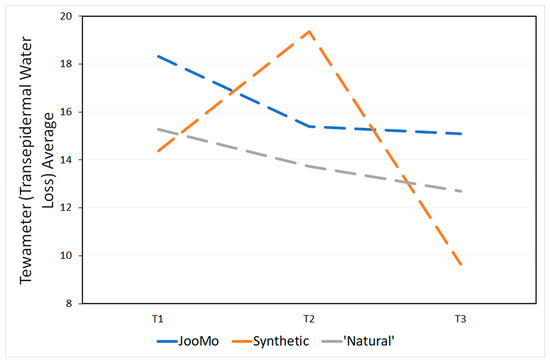
Figure 13.
Tewameter (TEWL) averages at all time points.
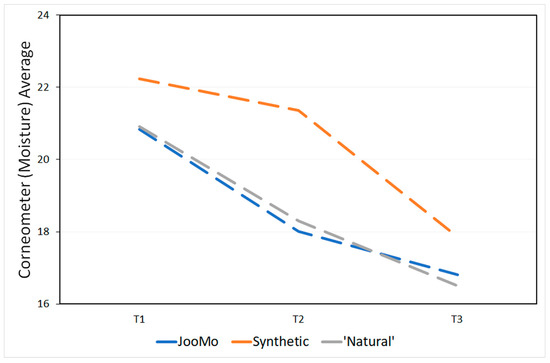
Figure 14.
Corneometer (moisture) averages at each time point.
Table 5.
Average percentage change in TEWL for all product groups.
Table 6.
Average percentage change in moisture on the skin for all product groups.
Over time the trans-epidermal water loss decreased and therefore more so-called “very healthy” skin types were detected (Table A1). The skin of the participants also became drier over time (Table A2). This effect was statistically significant, even if most of the values were in the range of “very dry” skin from the beginning of the study. No statistical effect was found for the pH values of the participants’ skin over time (Table A3).
3.3. Skin Measurement—Average Tewameter
3.4. Skin Measurement—Average Corneometer
4. Discussion
4.1. General
Samples were taken from the volar forearm which is dry and not sebaceous like the face, so it would harbour a characteristically more diverse bacterial community. On average, a lower diversity of microbes is found on “sebaceous” areas of the skin (forehead) compared to “dry” (forearm) and “moist” sites [26,39]. Previous research shows that the microbial community is heavily influenced by the sex of humans, across all body sites [91,92,93,94]. However, as all participants were women, the results would not have been affected in this paper, but it is important when comparing the results with another publication. Also mentioned is the age of the female participants, as a significantly more diverse microbiome is said to be found on younger human adults (age 25–35) compared to elderly and adolescent subjects [93].
4.2. Diversity Change
When looking at the results using the Chao1 index, all three groups display average increases in diversity over time. The slowest increase over two and four weeks is the synthetic and ‘natural’ product groups respectively. JooMo, with no synthetic ingredients, displayed the fastest average increase in both.
4.3. The Effect of Synthetic Ingredients on Biodiversity
Previous work describes how synthetic ingredients in cosmetics can alter the skin’s natural state, stripping it of essential bacteria [11]. The small increase in microbial biodiversity for the synthetic and ‘natural’ products (Figure 3 and Figure 4; Table 1 and Table 2) could appear to contradict this. This could be due to the volunteers’ instructions to stop using any other products, including make-up—they would have been using shower gels and soap or hand-wash at the least—other than the one provided. As all volunteers were women, they were likely to have had a much harsher prior skincare regime than men. Consequently, the amount of synthetic ingredients placed on the body of the participants (even in the ‘natural’ and synthetic groups) was likely to have decreased during the study.
This suggests the products containing the synthetic ingredients could be maintaining the already damaged microbiome, as they would have already had a depleted ‘Western’ microbial biodiversity profile. Even healthy ‘Western’ skin has a much lower biodiversity than agricultural societies [47,48,49]. It is not plausible to expect synthetic products to reduce biodiversity, a scenario only likely if these products happened to be particularly powerful. However, they were both very commonly used products.
Crucially, this suggests that as soon as the skin’s exposure to synthetic ingredients was decreased, the microbial diversity and richness increased. This could be the beginning of a link between exposure to chemicals and a repressed skin microbiome, but it would need to be further tested in future work.
Overall, the skin of the study participants in every group moved towards a more ‘healthy’ state, defined by the Medical University of Graz using TEWL, and increased in diversity over the testing period. While this might be slightly surprising, it helps add weight behind a main conclusion from our 2017 work: the higher the biodiversity, the healthier the skin.
4.4. TEWL, Moisture and pH
The moisture on the skin was expected to decrease quickly for the groups using the two products containing synthetic ingredients because they have a high pH which can dry out the skin [95] and strip it of its essential oils [11]. It was the group using JooMo that experienced the least moisture loss, when compared with the other two product groups. However, the difference was smaller than expected. To explain this, we again note the subjects were instructed not to use any products, including moisturisers, other than the one provided during the study. These could have affected the skin’s natural moisture regulation ability, meaning that there could be a period where the moisture levels of the skin would decrease after moisturisers ceased to be used [96].
In the long term, moisturisers have been shown to disrupt the skin barrier [96,97,98], with TEWL much higher during treatment. The heightened TEWL during moisturiser use could explain how, in this study, the TEWL decreased for all products during the four weeks, because the participants were instructed not to use their moisturisers during the study.
TEWL has been linked to skin barrier function, where an increase is associated with skin damage. However, conclusions should be made with caution due to it being affected by many other environmental factors, so it is an unreliable indicator. The large increase in TEWL in the first two weeks of the study for the synthetic product group may have been caused by an inflammatory/irritation response of the epidermis to the use of the product and its harsh synthetics [99].
A skin ailment often overlooked is premature ageing. In the human dermis, ageing is characterised by the loss of hydration. Increasing the pH speeds up the ageing process [100] and decreases the diversity [93].Common skincare products often have a pH of 5.5 or higher, which can lead to the skin drying out, leaving it prone to infections and premature ageing [95]. Both the synthetic and ‘natural’ products used in this study had a high pH of 6. Conversely, JooMo’s pH was measured at pH 4.5.
4.5. Future Work
To determine whether the alterations were directly related to the amount of synthetic chemicals in the products given, and not other factors, a larger sample size will be used along with a section detailing the exact skincare regime of the participants prior to the study. An increase from four to six or seven weeks should be considered to see how long it takes the microbiome to stabilize after using different products on the skin.
To be able to compare datasets, normalization was used to make each contain the same amount of sequences, or organisms detected. The graphs displaying Chao1 diversity and species richness in Section 3.1.1 are normalised to different amounts of sequences, so it is a challenge to compare them visually. For example, in Figure 6, the box plots for T1 have different values on each data point (whiskers, quartiles and mean). To mitigate against similar problems in data analysis, all datasets will be normalised to a same sequence level before being run through Calypso.
The effect of age should be further researched to help interpret the results. TEWL, as a reliable measure of skin health, should be tested, which could affect how groupings are made in future studies.
5. Conclusions
Using the mechanism defined in previous work [1], the first steps were made towards the aim of finding a link between synthetic ingredients and the effect on the skin microbiome. As a first ever study of its kind, not only did we strengthen the main conclusion from our previous work, that a higher biodiversity equates to healthier skin, but we observed changes in diversity, skin moisture and TEWL which appear to be caused in response to product use. The more synthetic ingredients contained in a product, the less of a positive effect on average biodiversity it appeared to have, especially within the first two weeks.
Future work will create one true universal standard for varying levels of skin health, with benchmark levels of diversity, to be used as a test of the effectiveness of products in laboratories across the world. Secondly, it should address the lack of background information on the participants’ previous skincare regime, meaning the effects observed can be attributed to certain product use. Finally, it will be conducted over a longer period to give insight into the length of time ecosystems such as the skin microbiome take to re-adjust to a healthier, more natural state, along with the effects of using probiotics or different ingredients.
Supplementary Materials
The following are available online at http://www.mdpi.com/2079-9284/6/1/2/s1.
Author Contributions
C.W.-R. was the main contributor. He conceived the idea for the experiment, planned, organised, helped with the analysis of data, and wrote it.
Funding
A FemTech grant for ‘women in science’ was organized and applied for through ACIB (Austrian Centre for Industrial Biotechnology). This was put towards the laboratory work.
Acknowledgments
This work was supported by Pavane Consultants Ltd. I would like to extend a thank you to The Medical University of Graz, who performed laboratory work, collected samples, and analysed data. I would also like to thank my twin, Sam Wallen Russell, whose knowledge of physical systems and how non-linear physics impacts on ecosystems was integral to the project; my mother, Linda Russell, whose help in data analysis and organisation of the project was priceless; and lastly my father, Nick Wallen, whose knowledge of cosmetic chemistry and statistical analysis within ecology was crucial to the success of the study.
Conflicts of Interest
Christopher Wallen-Russell is an employee of research and development company Pavane Consultants Ltd., who commissioned the paper, and director of JooMo Ltd. Skin health company, JooMo Ltd., holds the exclusive license for the manufacturing, marketing and sale of Pavane Consultant Ltd.’s products. As licence holder for the JooMo Ltd. range of skin health products, Pavane Consultants Ltd. are interested in determining how skin health can be measured and which products in the environment have caused the huge increase in skin allergy problems in the past 75 years.
Appendix A
Appendix A.1. JooMo Ingredients
Aqua, Saccharum Officinarum (Unrefined Sugar) Extract, Maris Sal (Organic Sea Salt), Saponins, Mel (Unprocessed Raw Honey), Citrus Aurantium Dulcis (Orange) Juice, Cyamopsis Tetragonoloba (Guar) Gum, Acacia Senegal Gum Extract, Citrus Aurantium Dulcis (Orange) Peel Oil, Eugenia Caryophyllus (Clove) Leaf Oil, Cinnamomum Zeylanicum (Cinnamon) Leaf Oil, Cinnamomum Cassia (Chinese Cinnamon) Leaf Oil.
Appendix A.2. Synthetic Product Ingredients
Aqua, Cocamidopropyl Betaine, Sodium Myreth Sulfate, Sodium Acrylates Copolymer, Glycerin, Glyceryl Glucoside, Tocopheryl Acetate, Nelumbium Speciosum Flower Extract, Panthenol, Propylene Glycol, Lauryl Glucoside, PEG-40 Hydrogenated Castor Oil, PEG-200 Hydrogenated Glyceryl Palmate, Polyquaternium-10, Benzophenone-4, Sodium Chloride, Phenoxyethanol, Methylparaben, Ethylparaben, Butylphenyl Methylpropional, Geraniol, Hydroxyisohexyl 3-Cyclohexene Carboxaldehyde, Benzyl Alcohol, Limonene, Linalool, Cinnamyl Alcohol, Parfum, CI 42090, CI 16035.
Appendix A.3. ‘Natural’ Product Ingredients
Aqua (Water), Sodium lauroyl methyl isethionate, Cocamidopropyl betaine, Lauric acid, Sodium chloride, Sodium methyl isethionate, Glycerin, Tetrasodium EDTA, Stearyl citrate, Lauryl glucoside, Zinc laurate, Parfum (Fragrance), Hibiscus sabdariffa flower extract, Dipropylene glycol, Citric acid, Magnesium nitrate, Benzoic acid, Phenoxyethanol, Methylchloroisothiazolinone, Magnesium chloride, Methylisothiazolinone, Dehydroacetic acid, Ethylhexylglycerin.
Appendix A.4. Skin Parameter Progression: Combined
Table A1.
Comparison of the percentage of different skin types throughout all study subjects based on the epidermal water loss measured with a Tewameter before product use (=T1), after 2 weeks of product use (=T2) and after 4 weeks of product use (=T3).
Table A1.
Comparison of the percentage of different skin types throughout all study subjects based on the epidermal water loss measured with a Tewameter before product use (=T1), after 2 weeks of product use (=T2) and after 4 weeks of product use (=T3).
| T1 | |||||
|---|---|---|---|---|---|
| Product Group | V Healthy | Healthy | Normal | Stressed | Critical |
| All | 28% | 41% | 13% | 9% | 9% |
| JooMo | 28% | 27% | 18% | 18% | 9% |
| ‘Natural’ | 27% | 46% | 18% | 0% | 9% |
| Synthetic | 30% | 50% | 0% | 10% | 10% |
| T2 | |||||
| V Healthy | Healthy | Normal | Stressed | Critical | |
| All | 19% | 53% | 16% | 0% | 12% |
| JooMo | 9% | 64% | 18% | 0% | 9% |
| ‘Natural’ | 18% | 55% | 27% | 0% | 0% |
| Synthetic | 30% | 40% | 0% | 0% | 30% |
| T3 | |||||
| V Healthy | Healthy | Normal | Stressed | Critical | |
| All | 44% | 37% | 13% | 0% | 6% |
| JooMo | 27% | 46% | 18% | 0% | 9% |
| ‘Natural’ | 46% | 36% | 9% | 0% | 0% |
| Synthetic | 60% | 30% | 10% | 0% | 0% |
Table A2.
Comparison of the percentage in each skin moisture group of the study subjects based on the Corneometer measurements before product use (=T1), after 2 weeks of product use (=T2) and after 4 weeks of product use (=T3).
Table A2.
Comparison of the percentage in each skin moisture group of the study subjects based on the Corneometer measurements before product use (=T1), after 2 weeks of product use (=T2) and after 4 weeks of product use (=T3).
| T1 | T2 | T3 | |||||||
|---|---|---|---|---|---|---|---|---|---|
| Product Group | V Dry | Dry | Adequately Moist | V Dry | Dry | Adequately Moist | V Dry | Dry | Adequately Moist |
| All | 91% | 9% | 0% | 94% | 3% | 3% | 97% | 3% | 0% |
| JooMo | 91% | 9% | 0% | 91% | 0% | 9% | 91% | 9% | 0% |
| ‘Natural’ | 91% | 9% | 0% | 100% | 0% | 0% | 100% | 0% | 0% |
| Synthetic | 90% | 10% | 0% | 90% | 10% | 0% | 100% | 0% | 0% |
Table A3.
Comparison of the pH of the participants’ skin based on the pH-meter measurement before product use (=T1), after 2 weeks of product use (=T2) and after 4 weeks of product use (=T3).
Table A3.
Comparison of the pH of the participants’ skin based on the pH-meter measurement before product use (=T1), after 2 weeks of product use (=T2) and after 4 weeks of product use (=T3).
| Product Group | T1 | T2 | T3 |
|---|---|---|---|
| JooMo | 5.72 | 5.94 | 5.92 |
| ‘Natural’ | 5.54 | 5.60 | 5.58 |
| Synthetic | 5.54 | 5.76 | 5.55 |
Appendix A.5. Beta Diversity

Figure A1.
PCoA Plot of the different time points per group. Each point refers to one microbiome measurement. Shapes and colors indicate the different time points and the product group (see legend). Red framed T1 points seem to move towards the rest during product use.
Appendix A.6. Rarefaction

Figure A2.
Rarefaction analysis based on OTU level, showing the sequencing potential for the different time points of the (A) JooMo (B) synthetic and (C) ‘natural’ group samples.

Figure A3.
Rarefaction analysis based on OTU level, showing the sequencing potential for the different group specific time points.
References
- Wallen-Russell, C.; Wallen-Russell, S. Meta Analysis of Skin Microbiome: New Link between Skin Microbiota Diversity and Skin Health with Proposal to Use This as a Future Mechanism to Determine Whether Cosmetic Products Damage the Skin. Cosmetics 2017, 4, 14. [Google Scholar] [CrossRef]
- Finlay, B.B.; Arrieta, M.-C. Let Them Eat Dirt. Saving Your Child from an Oversanitized World; Windmill Books: London, UK, 2016. [Google Scholar]
- Lefcheck, J.S.; Byrnes, J.E.K.; Isbell, F.; Gamfeldt, L.; Griffin, J.N.; Eisenhauer, N.; Hensel, M.J.S.; Hector, A.; Cardinale, B.J.; Duffy, J.E. Biodiversity enhances ecosystem multifunctionality across trophic levels and habitats. Nat. Commun. 2015, 6, 6936. [Google Scholar] [CrossRef] [PubMed]
- Balvanera, P.; Pfisterer, A.B.; Buchmann, N.; He, J.-S.; Nakashizuka, T.; Raffaelli, D.; Schmid, B. Quantifying the evidence for biodiversity effects on ecosystem functioning and services. Ecol. Lett. 2006, 9, 1146–1156. [Google Scholar] [CrossRef] [PubMed]
- Gamfeldt, L.; Hillebrand, H.; Jonsson, P.R. Multiple functions increase the importance of biodiversity for overall ecosystem functioning. Ecology 2008, 89, 1223–1231. [Google Scholar] [CrossRef] [PubMed]
- Thrupp, L.A. The importance of biodiversity in agroecosystems. J. Crop Improv. 2004, 12, 315–337. [Google Scholar] [CrossRef]
- Hooper, D.U.; Chapin, F.S.; Ewel, J.J.; Hector, A.; Inchausti, P.; Lavorel, S.; Lawton, J.H.; Lodge, D.M.; Loreau, M.; Naeem, S.; et al. Effects of biodiversity on ecosystem functioning: A consensus of current knowledge. Ecol. Monogr. 2005, 75, 3–35. [Google Scholar] [CrossRef]
- Martínez, I.; Stegen, J.C.; Maldonado-Gómez, M.X.; Eren, A.M.; Siba, P.M.; Greenhill, A.R.; Walter, J. The Gut Microbiota of Rural Papua New Guineans: Composition, Diversity Patterns, and Ecological Processes. Cell Rep. 2015, 11, 527–538. [Google Scholar] [CrossRef] [PubMed]
- Taylor, B.; Wadsworth, M.; Wadsworth, J.; Peckham, C. Changes in the reported prevalence of childhood eczema since the 1939-45 war. Lancet 1984, 324, 1255–1257. [Google Scholar] [CrossRef]
- Kong, H.H.; Oh, J.; Deming, C.; Conlan, S.; Grice, E.A.; Beatson, M.A.; Nomicos, E.; Polley, E.C.; Komarow, H.D.; NISC Comparative Sequence Program, N.C.S.; et al. Temporal shifts in the skin microbiome associated with disease flares and treatment in children with atopic dermatitis. Genome Res. 2012, 22, 850–859. [Google Scholar] [CrossRef]
- Blaser, M.J.; Falkow, S. What are the consequences of the disappearing human microbiota? Nat. Rev. Microbiol. 2009, 7, 887–894. [Google Scholar] [CrossRef]
- Simpson, C.R.; Newton, J.; Hippisley-Cox, J.; Sheikh, A. Trends in the epidemiology and prescribing of medication for eczema in England. J. R. Soc. Med. 2009, 102, 108–117. [Google Scholar] [CrossRef] [PubMed]
- Burd, R.M. Psoriasis: A general overview. Br. J. Hosp. Med. 2006, 67, 259–262. [Google Scholar] [CrossRef]
- Prescott, S.L.; Tang, M.L.K. The Australasian Society of Clinical Immunology and Allergy position statement: Summary of allergy prevention in children. Med. J. Aust. 2005, 182, 464–467. [Google Scholar] [PubMed]
- Srinivas, G.; Möller, S.; Wang, J.; Künzel, S.; Zillikens, D.; Baines, J.F.; Ibrahim, S.M. Genome-wide mapping of gene–microbiota interactions in susceptibility to autoimmune skin blistering. Nat. Commun. 2013, 4, 2462. [Google Scholar] [CrossRef] [PubMed]
- Asher, M.I.; Montefort, S.; Björkstén, B.; Lai, C.K.; Strachan, D.P.; Weiland, S.K.; Williams, H.; ISAAC Phase Three Study Group. Worldwide time trends in the prevalence of symptoms of asthma, allergic rhinoconjunctivitis, and eczema in childhood: ISAAC Phases One and Three repeat multicountry cross-sectional surveys. Lancet 2006, 368, 733–743. [Google Scholar] [CrossRef]
- Shaw, T.E.; Currie, G.P.; Koudelka, C.W.; Simpson, E.L. Eczema Prevalence in the United States: Data from the 2003 National Survey of Children’s Health. J. Invest. Dermatol. 2011, 131, 67–73. [Google Scholar] [CrossRef] [PubMed]
- Goossens, A. Contact-allergic reactions to cosmetics. J. Allergy 2011, 2011, 467071. [Google Scholar] [CrossRef] [PubMed]
- Salverda, J.G.W.; Bragt, P.J.C.; de Wit-Bos, L.; Rustemeyer, T.; Coenraads, P.J.; Tupker, R.A.; Kunkeler, L.C.M.; Laheij-de Boer, A.-M.; Stenveld, H.J.; van Ginkel, C.J.W.; et al. Results of a cosmetovigilance survey in The Netherlands. Contact Dermat. 2013, 68, 139–148. [Google Scholar] [CrossRef]
- Heisterberg, M.V.; Menné, T.; Johansen, J.D. Contact allergy to the 26 specific fragrance ingredients to be declared on cosmetic products in accordance with the EU cosmetics directive. Contact Dermat. 2011, 65, 266–275. [Google Scholar] [CrossRef]
- Warshaw, E.M.; Buchholz, H.J.; Belsito, D.V.; Maibach, H.I.; Fowler, J.F.; Rietschel, R.L.; Zug, K.A.; Mathias, C.G.T.; Pratt, M.D.; Sasseville, D.; et al. Allergic patch test reactions associated with cosmetics: Retrospective analysis of cross-sectional data from the North American Contact Dermatitis Group, 2001–2004. J. Am. Acad. Dermatol. 2009, 60, 23–38. [Google Scholar] [CrossRef]
- Berne, B.; Tammela, M.; Färm, G.; Inerot, A.; Lindberg, M. Can the reporting of adverse skin reactions to cosmetics be improved? A prospective clinical study using a structured protocol. Contact Dermat. 2008, 58, 223–227. [Google Scholar] [CrossRef] [PubMed]
- Berne, B.; Boström, A.; Grahnén, A.F.; Tammela, M. Adverse effects of cosmetics and toiletries reported to the Swedish Medical Products Agency 1989-1994. Contact Dermat. 1996, 34, 359–362. [Google Scholar] [CrossRef]
- Rocha, L.A.; Ferreira de Almeida e Borges, L.; Gontijo Filho, P.P. Changes in hands microbiota associated with skin damage because of hand hygiene procedures on the health care workers. Am. J. Infect. Control 2009, 37, 155–159. [Google Scholar] [CrossRef] [PubMed]
- Holland, K.T.; Bojar, R.A. Cosmetics: What is their influence on the skin microflora? Am. J. Clin. Dermatol. 2002, 3, 445–449. [Google Scholar] [CrossRef] [PubMed]
- Costello, E.K.; Lauber, C.L.; Hamady, M.; Fierer, N.; Gordon, J.I.; Knight, R. Bacterial Community Variation in Human Body Habitats Across Space and Time. Science 2009, 326. [Google Scholar] [CrossRef]
- Cogen, A.L.; Nizet, V.; Gallo, R.L. Skin microbiota: A source of disease or defence? Br. J. Dermatol. 2009, 158, 442–455. [Google Scholar] [CrossRef] [PubMed]
- Belkaid, Y.; Segre, J.A. Dialogue between skin microbiota and immunity. Science 2014, 346, 954–959. [Google Scholar] [CrossRef]
- Stingley, R.L.; Zou, W.; Heinze, T.M.; Chen, H.; Cerniglia, C.E. Metabolism of azo dyes by human skin microbiota. J. Med. Microbiol. 2010, 59, 108–114. [Google Scholar] [CrossRef]
- Turnbaugh, P.J.; Ley, R.E.; Hamady, M.; Fraser-Liggett, C.M.; Knight, R.; Gordon, J.I. The Human Microbiome Project. Nature 2007, 449, 804–810. [Google Scholar] [CrossRef]
- Staudinger, T.; Pipal, A.; Redl, B. Molecular analysis of the prevalent microbiota of human male and female forehead skin compared to forearm skin and the influence of make-up. J. Appl. Microbiol. 2011, 110, 1381–1389. [Google Scholar] [CrossRef]
- Grice, E.A.; Snitkin, E.S.; Yockey, L.J.; Bermudez, D.M.; Comparative, N.; Program, S.; Liechty, K.W.; Segre, J.A. Longitudinal shift in diabetic wound microbiota correlates with prolonged skin defense response. Proc. Natl. Acad. Sci. USA 2010, 33107, 14799–14804. [Google Scholar] [CrossRef] [PubMed]
- Belkaid, Y.; Hand, T.W. Role of the microbiota in immunity and inflammation. Cell 2014, 157, 121–141. [Google Scholar] [CrossRef] [PubMed]
- Eckburg, P.B.; Bik, E.M.; Bernstein, C.N.; Purdom, E.; Dethlefsen, L.; Sargent, M.; Gill, S.R.; Nelson, K.E.; Relman, D.A. Diversity of the human intestinal microbial flora. Science 2005, 308, 1635–1638. [Google Scholar] [CrossRef] [PubMed]
- O’Hara, A.M.; Shanahan, F. The gut flora as a forgotten organ. EMBO Rep. 2006, 7, 688–693. [Google Scholar] [CrossRef] [PubMed]
- Marrs, T.; Flohr, C. The role of skin and gut microbiota in the development of atopic eczema. Br. J. Dermatol. 2016, 175, 13–18. [Google Scholar] [CrossRef] [PubMed]
- Kelly, D.; Conway, S.; Aminov, R. Commensal gut bacteria: Mechanisms of immune modulation. Trends Immunol. 2005, 26, 326–333. [Google Scholar] [CrossRef] [PubMed]
- Gao, Z.; Tseng, C.; Pei, Z.; Blaser, M.J. Molecular analysis of human forearm superficial skin bacterial biota. Proc. Natl. Acad. Sci. USA 2007, 104, 2927–2932. [Google Scholar] [CrossRef] [PubMed]
- Grice, E.A.; Kong, H.H.; Conlan, S.; Deming, C.B.; Davis, J.; Young, A.C.; NISC Comparative Sequencing Program; Bouffard, G.G.; Blakesley, R.W.; Murray, P.R.; et al. Topographical and temporal diversity of the human skin microbiome. Science 2009, 324, 1190–1192. [Google Scholar] [CrossRef] [PubMed]
- Ley, R.E.; Hamady, M.; Lozupone, C.; Turnbaugh, P.J.; Ramey, R.R.; Bircher, J.S.; Schlegel, M.L.; Tucker, T.A.; Schrenzel, M.D.; Knight, R.; et al. Evolution of mammals and their gut microbes. Science 2008, 320, 1647–1651. [Google Scholar] [CrossRef] [PubMed]
- NIH HMP Working Group; Peterson, J.; Garges, S.; Giovanni, M.; McInnes, P.; Wang, L.; Schloss, J.A.; Bonazzi, V.; McEwen, J.E.; Wetterstrand, K.A.; et al. The NIH Human Microbiome Project. Genome Res. 2009, 19, 2317–2323. [Google Scholar]
- De Filippo, C.; Cavalieri, D.; Di Paola, M.; Ramazzotti, M.; Poullet, J.B.; Massart, S.; Collini, S.; Pieraccini, G.; Lionetti, P. Impact of diet in shaping gut microbiota revealed by a comparative study in children from Europe and rural Africa. Proc. Natl. Acad. Sci. USA 2010, 107, 14691–14696. [Google Scholar] [CrossRef] [PubMed]
- Grice, E.A.; Kong, H.H.; Renaud, G.; Young, A.C.; Bouffard, G.G.; Blakesley, R.W.; Wolfsberg, T.G.; Turner, M.L.; Segre, J.A. A diversity profile of the human skin microbiota. Genome Res. 2008, 18, 1043–1050. [Google Scholar] [CrossRef] [PubMed]
- Perez Perez, G.I.; Gao, Z.; Jourdain, R.; Ramirez, J.; Gany, F.; Clavaud, C.; Demaude, J.; Breton, L.; Blaser, M.J. Body Site Is a More Determinant Factor than Human Population Diversity in the Healthy Skin Microbiome. PLoS ONE 2016, 11, e0151990. [Google Scholar] [CrossRef] [PubMed]
- Ley, R.E.; Lozupone, C.A.; Hamady, M.; Knight, R.; Gordon, J.I. Worlds within worlds: Evolution of the vertebrate gut microbiota. Nat. Rev. Microbiol. 2008, 6, 776–788. [Google Scholar] [CrossRef] [PubMed]
- Pei, Z.; Bini, E.J.; Yang, L.; Zhou, M.; Francois, F.; Blaser, M.J. Bacterial biota in the human distal esophagus. Proc. Natl. Acad. Sci. USA 2004, 101, 4250–4255. [Google Scholar] [CrossRef] [PubMed]
- Clemente, J.C.; Pehrsson, E.C.; Blaser, M.J.; Sandhu, K.; Gao, Z.; Wang, B.; Magris, M.; Hidalgo, G.; Contreras, M.; Noya-Alarcón, Ó.; et al. The microbiome of uncontacted Amerindians. Sci. Adv. 2015, 1, e1500183. [Google Scholar] [CrossRef] [PubMed]
- Blaser, M.J.; Dominguez-Bello, M.G.; Contreras, M.; Magris, M.; Hidalgo, G.; Estrada, I.; Gao, Z.; Clemente, J.C.; Costello, E.K.; Knight, R. Distinct cutaneous bacterial assemblages in a sampling of South American Amerindians and US residents. ISME J. 2013, 7, 85–95. [Google Scholar] [CrossRef]
- Salgado, V.R.; de Queiroz, A.T.L.; Sanabani, S.S.; de Oliveira, C.I.; Carvalho, E.M.; Costa, J.M.L.; Barral-Netto, M.; Barral, A. The microbiological signature of human cutaneous leishmaniasis lesions exhibits restricted bacterial diversity compared to healthy skin. Mem. Inst. Oswaldo Cruz 2016, 111, 241–251. [Google Scholar] [CrossRef]
- Hoffmann, A.R.; Patterson, A.P.; Diesel, A.; Lawhon, S.D.; Ly, H.J.; Stephenson, C.E.; Mansell, J.; Steiner, J.M.; Dowd, S.E.; Olivry, T.; et al. The skin microbiome in healthy and allergic dogs. PLoS ONE 2014, 9. [Google Scholar]
- Gardiner, M.; Vicaretti, M.; Sparks, J.; Bansal, S.; Bush, S.; Liu, M.; Darling, A.; Harry, E.; Burke, C.M. A longitudinal study of the diabetic skin and wound microbiome. PeerJ 2017, 5, e3543. [Google Scholar] [CrossRef]
- Grice, E.A.; Segre, J.A. The skin microbiome. Nat. Rev. Microbiol. 2011, 9, 244–253. [Google Scholar] [CrossRef]
- Kong, H.H.; Segre, J.A. Skin microbiome: Looking back to move forward. J. Invest. Dermatol. 2012, 132, 933–939. [Google Scholar] [CrossRef] [PubMed]
- Gontcharova, V.; Youn, E.; Sun, Y.; Wolcott, R.D.; Dowd, S.E. A comparison of bacterial composition in diabetic ulcers and contralateral intact skin. Open Microbiol. J. 2010, 4, 8–19. [Google Scholar] [CrossRef] [PubMed]
- Dekio, I.; Hayashi, H.; Sakamoto, M.; Kitahara, M.; Nishikawa, T.; Suematsu, M.; Benno, Y. Detection of potentially novel bacterial components of the human skin microbiota using culture-independent molecular profiling. J. Med. Microbiol. 2005, 54, 1231–1238. [Google Scholar] [CrossRef] [PubMed]
- Bek-Thomsen, M.; Lomholt, H.B.; Kilian, M. Acne is not associated with yet-uncultured bacteria. J. Clin. Microbiol. 2008, 46, 3355–3360. [Google Scholar] [CrossRef] [PubMed]
- Cordain, L.; Lindeberg, S.; Hurtado, M.; Hill, K.; Eaton, S.B.; Brand-Miller, J. Acne Vulgaris. Arch. Dermatol. 2002, 138, 1584–1590. [Google Scholar] [CrossRef]
- Noble, W.C. Staphylococci on the skin. In The Skin Microflora and Microbial Skin Disease; Noble, W.C., Ed.; Cambridge University Press: London, UK, 2004; pp. 135–152. [Google Scholar]
- Pamer, E.G. Immune responses to commensal and environmental microbes. Nat. Immunol. 2007, 8, 1173–1178. [Google Scholar] [CrossRef] [PubMed]
- Sanford, J.A.; Gallo, R.L. Functions of the skin microbiota in health and disease. Semin. Immunol. 2013, 25, 370–377. [Google Scholar] [CrossRef] [PubMed]
- Barnard, E.; Li, H. Shaping of cutaneous function by encounters with commensals. J. Physiol. 2016, 595, 437–450. [Google Scholar] [CrossRef]
- Christensen, G.J.M.; Brüggemann, H. Bacterial skin commensals and their role as host guardians. Benef. Microbes 2014, 5, 201–215. [Google Scholar] [CrossRef]
- Park, B.; Iwase, T.; Liu, G.Y. Intranasal Application of S. epidermidis Prevents Colonization by Methicillin-Resistant Staphylococcus aureus in Mice. PLoS ONE 2011, 6, e25880. [Google Scholar] [CrossRef]
- Rosebury, T. Microorganisms Indigenous to Man; McGraw Hill: New York, NY, USA, 1962. [Google Scholar]
- Mackowiak, P.A. The Normal Microbial Flora. N. Engl. J. Med. 1982, 307, 83–93. [Google Scholar] [CrossRef] [PubMed]
- Smith, K.; McCoy, K.D.; Macpherson, A.J. Use of axenic animals in studying the adaptation of mammals to their commensal intestinal microbiota. Semin. Immunol. 2007, 19, 59–69. [Google Scholar] [CrossRef] [PubMed]
- Gordon, H.A.; Pesti, L. The gnotobiotic animal as a tool in the study of host microbial relationships. Bacteriol. Rev. 1971, 35, 390–429. [Google Scholar] [PubMed]
- Katsuyama, M.; Ichikawa, H.; Ogawa, S.; Ikezawa, Z. A novel method to control the balance of skin microflora: Part 1. Attack on biofilm of Staphylococcus aureus without antibiotics. J. Dermatol. Sci. 2005, 38, 197–205. [Google Scholar] [PubMed]
- Lambers, H.; Piessens, S.; Bloem, A.; Pronk, H.; Finkel, P. Natural skin surface pH is on average below 5, which is beneficial for its resident flora. Int. J. Cosmet. Sci. 2006, 28, 359–370. [Google Scholar] [CrossRef]
- Myles, I.A.; Williams, K.W.; Reckhow, J.D.; Jammeh, M.L.; Pincus, N.B.; Sastalla, I.; Saleem, D.; Stone, K.D.; Datta, S.K. Transplantation of human skin microbiota in models of atopic dermatitis. JCI Insight 2016, 1. [Google Scholar] [CrossRef]
- Baviera, G.; Leoni, M.C.; Capra, L.; Cipriani, F.; Longo, G.; Maiello, N.; Ricci, G.; Galli, E. Microbiota in healthy skin and in atopic eczema. Biomed. Res. Int. 2014, 2014, 436921. [Google Scholar] [CrossRef]
- Zaidi, A.K.; Spaunhurst, K.; Sprockett, D.; Thomason, Y.; Mann, M.W.; Fu, P.; Ammons, C.; Gerstenblith, M.; Tuttle, M.S.; Popkin, D.L. Characterization of the facial microbiome in twins discordant for rosacea. Exp. Dermatol. 2018, 27, 295–298. [Google Scholar] [CrossRef]
- Velegraki, A.; Cafarchia, C.; Gaitanis, G.; Iatta, R.; Boekhout, T. Malassezia Infections in Humans and Animals: Pathophysiology, Detection, and Treatment. PLoS Pathog. 2015, 11, e1004523. [Google Scholar] [CrossRef]
- Prescott, S.L.; Larcombe, D.-L.; Logan, A.C.; West, C.; Burks, W.; Caraballo, L.; Levin, M.; Van Etten, E.; Horwitz, P.; Kozyrskyj, A.; et al. The skin microbiome: Impact of modern environments on skin ecology, barrier integrity, and systemic immune programming. World Allergy Organ. J. 2017, 10, 29. [Google Scholar] [CrossRef]
- Manasson, J.; Reddy, S.M.; Neimann, A.L.; Segal, L.N.; Scher, J.U. Cutaneous Microbiota Features Distinguish Psoriasis from Psoriatic Arthritis. Arthritis Rheumatol. 2016, 68 (Suppl. 10). [Google Scholar]
- Huang, Y.J.; Marsland, B.J.; Bunyavanich, S.; O’Mahony, L.; Leung, D.Y.M.; Muraro, A.; Fleisher, T.A. The microbiome in allergic disease: Current understanding and future opportunities-2017 PRACTALL document of the American Academy of Allergy, Asthma; Immunology and the European Academy of Allergy and Clinical Immunology. J. Allergy Clin. Immunol. 2017, 139, 1099–1110. [Google Scholar] [CrossRef]
- Sherwani, M.A.; Tufail, S.; Muzaffar, A.F.; Yusuf, N. The skin microbiome and immune system: Potential target for chemoprevention? Photodermatol. Photoimmunol. Photomed. 2018, 34, 25–34. [Google Scholar] [CrossRef] [PubMed]
- Findley, K.; Oh, J.; Yang, J.; Conlan, S.; Deming, C.; Meyer, J.A.; Schoenfeld, D.; Nomicos, E.; Park, M.; Kong, H.H.; et al. Topographic diversity of fungal and bacterial communities in human skin. Nature 2013, 498, 367–370. [Google Scholar] [CrossRef] [PubMed]
- Misic, A.M.; Gardner, S.E.; Grice, E.A. The Wound Microbiome: Modern Approaches to Examining the Role of Microorganisms in Impaired Chronic Wound Healing. Adv. Wound Care 2014, 3, 502–510. [Google Scholar] [CrossRef] [PubMed]
- Lu, L.J.; Liu, J. Human Microbiota and Ophthalmic Disease. Yale J. Biol. Med. 2016, 89, 325–330. [Google Scholar]
- Nakatsuji, T.; Chen, T.H.; Butcher, A.M.; Trzoss, L.L.; Nam, S.-J.; Shirakawa, K.T.; Zhou, W.; Oh, J.; Otto, M.; Fenical, W.; et al. A commensal strain of Staphylococcus epidermidis protects against skin neoplasia. Sci. Adv. 2018, 4, eaao4502. [Google Scholar] [CrossRef]
- FSA. Criteria for the Use of the Terms Fresh, Pure, Natural etc. in Food Labelling. 2017. Available online: https://admin.food.gov.uk/sites/default/files/multimedia/pdfs/markcritguidance.pdf (accessed on 21 August 2018).
- Scherrer, M.A.R.; Rocha, V.B.; Andrade, A.R.C. Contact dermatitis to methylisothiazolinone. An. Bras. Dermatol. 2015, 90, 912–914. [Google Scholar] [CrossRef]
- Burnett, C.L.; Bergfeld, W.F.; Belsito, D.V.; Klaassen, C.D.; Marks, J.G.; Shank, R.C.; Slaga, T.J.; Snyder, P.W.; Alan Andersen, F. Final Report of the Safety Assessment of Methylisothiazolinone. Int. J. Toxicol. 2010, 29, 187S–213S. [Google Scholar] [CrossRef]
- MP Biomedicals. MP Biomedicals: FastDNA® SPIN Kit. Available online: https://www.mpbio.com/includes/technical/fastdna spin.pdf (accessed on 5 February 2018).
- Caporaso, J.G.; Lauber, C.L.; Walters, W.A.; Berg-Lyons, D.; Lozupone, C.A.; Turnbaugh, P.J.; Fierer, N.; Knight, R. Global patterns of 16S rRNA diversity at a depth of millions of sequences per sample. Proc. Natl. Acad. Sci. USA 2011, 108, 4516–4522. [Google Scholar] [CrossRef]
- Calypso. Available online: http://cgenome.net/wiki/index.php/Calypso (accessed on 26 December 2018).
- Chao, A. Nonparametric Estimation of the Number of Classes in a Population Nonparametric Estimation of the Number of Classes in a Population. Scand. J. Stat. 1984, 11, 265–270. [Google Scholar]
- Colwell, R.K.; Coddington, J.A. Estimating terrestrial biodiversity through extrapolation. Philos. Trans. R. Soc. Lond. Ser. B Biol. Sci. 1994, 345, 101–118. [Google Scholar]
- Segata, N.; Izard, J.; Waldron, L.; Gevers, D.; Miropolsky, L.; Garrett, W.S.; Huttenhower, C. Metagenomic biomarker discovery and explanation. Genome Biol. 2011, 12, R60. [Google Scholar] [CrossRef] [PubMed]
- SanMiguel, A.; Grice, E.A. Interactions between host factors and the skin microbiome. Cell. Mol. Life Sci. 2015, 72, 1499–1515. [Google Scholar] [CrossRef]
- Giacomoni, P.U.; Mammone, T.; Teri, M. Gender-linked differences in human skin. J. Dermatol. Sci. 2009, 55, 144–149. [Google Scholar] [CrossRef] [PubMed]
- Ying, S.; Zeng, D.-N.; Chi, L.; Tan, Y.; Galzote, C.; Cardona, C.; Lax, S.; Gilbert, J.; Quan, Z.-X. The Influence of Age and Gender on Skin-Associated Microbial Communities in Urban and Rural Human Populations. PLoS ONE 2015, 10, e0141842. [Google Scholar] [CrossRef] [PubMed]
- Fierer, N.; Hamady, M.; Lauber, C.L.; Knight, R. The influence of sex, handedness, and washing on the diversity of hand surface bacteria. Proc. Natl. Acad. Sci. USA 2008, 105, 17994–17999. [Google Scholar] [CrossRef]
- Jung, Y.C.; Kim, E.J.; Cho, J.C.; Suh, K.D.; Nam, G.W. Effect of skin pH for wrinkle formation on Asian: Korean, Vietnamese and Singaporean. J. Eur. Acad. Dermatology Venereol. 2013, 27, e328–e332. [Google Scholar] [CrossRef]
- Buraczewska, I.; Berne, B.; Lindberg, M.; Törmä, H.; Lodén, M. Changes in skin barrier function following long-term treatment with moisturizers, a randomized controlled trial. Br. J. Dermatol. 2007, 156, 492–498. [Google Scholar] [CrossRef]
- Lodén, M. Role of topical emollients and moisturizers in the treatment of dry skin barrier disorders. Am. J. Clin. Dermatol. 2003, 4, 771–788. [Google Scholar] [CrossRef]
- Held, E.; Sveinsdóttir, S.; Agner, T. Effect of long-term use of moisturizer on skin hydration, barrier function and susceptibility to irritants. Acta Derm. Venereol. 1999, 79, 49–51. [Google Scholar] [PubMed]
- Munehiro, A.; Murakami, Y.; Shirahige, Y.; Nakai, K.; Moriue, T.; Matsunaka, H.; Yoneda, K.; Kubota, Y. Combination effects of cosmetic moisturisers in the topical treatment of acne vulgaris. J. Dermatolog. Treat. 2012, 23, 172–176. [Google Scholar] [CrossRef] [PubMed]
- Farage, M.A.; Miller, K.W.; Elsner, P.; Maibach, H.I. Functional and physiological characteristics of the aging skin. Aging Clin. Exp. Res. 2008, 20, 195–200. [Google Scholar] [CrossRef] [PubMed]
© 2018 by the author. Licensee MDPI, Basel, Switzerland. This article is an open access article distributed under the terms and conditions of the Creative Commons Attribution (CC BY) license (http://creativecommons.org/licenses/by/4.0/).