
Assessment of Machine Learning Techniques in IoT-Based Architecture for the Monitoring and Prediction of COVID-19

College of Computer Engineering and Sciences, Prince Sattam Bin Abdulaziz University, Al-Kharj 16278, Saudi Arabia
Electronics 2021, 10(15), 1834; https://doi.org/10.3390/electronics10151834
Submission received: 30 May 2021
/
Revised: 22 July 2021
/
Accepted: 26 July 2021
/
Published: 30 July 2021
(This article belongs to the Special Issue Deep Learning, Reconfigurable Computing and Machine Learning in Healthcare)
Abstract
:From the end of 2019, the world has been facing the threat of COVID-19. It is predicted that, before herd immunity is achieved globally via vaccination, people around the world will have to tackle the COVID-19 pandemic using precautionary steps. This paper suggests a COVID-19 identification and control system that operates in real-time. The proposed system utilizes the Internet of Things (IoT) platform to capture users’ time-sensitive symptom information to detect potential cases of coronaviruses early on, to track the clinical measures adopted by survivors, and to gather and examine appropriate data to verify the existence of the virus. There are five key components in the framework: symptom data collection and uploading (via communication technology), a quarantine/isolation center, an information processing core (using artificial intelligent techniques), cloud computing, and visualization to healthcare doctors. This research utilizes eight machine/deep learning techniques—Neural Network, Decision Table, Support Vector Machine (SVM), Naive Bayes, OneR, K-Nearest Neighbor (K-NN), Dense Neural Network (DNN), and the Long Short-Term Memory technique—to detect coronavirus cases from time-sensitive information. A simulation was performed to verify the eight algorithms, after selecting the relevant symptoms, on real-world COVID-19 data values. The results showed that five of these eight algorithms obtained an accuracy of over 90%. Conclusively, it is shown that real-world symptomatic information would enable these three algorithms to identify potential COVID-19 cases effectively with enhanced accuracy. Additionally, the framework presents responses to treatment for COVID-19 patients.
1. Introduction
Nearly 185,390,254 cases of COVID-19 have been confirmed in 222 countries as of July 2021 since its discovery in late December 2019 (Source: https://www.worldometers.info/coronavirus (accessed on 30 May 2021)). Furthermore, an increase of 2% every day has been shown [1]. In these, nearly 4,009,218 deaths have been registered, which represents a 4% mortality rate [2,3]. The novel coronavirus was classified by the World Health Organization (WHO) as a pandemic in March 2020 [4,5]. As of July 2021, the vaccination procedure is ongoing, and it will take a long time to induce herd immunity globally [6,7]. Currently, by following procedures including regular hand washing, adhering to social distancing, and wearing face masks, the control of COVID-19 is achieved by reducing the progress of new mutants such as Delta and Delta+ [8,9].
The purpose of this research is to investigate the impact of IoT-based technologies and machine learning in tracking and battling COVID-19 in three phases: early diagnosis, evaluation, and recovery. Early identification and diagnosis can result in fewer infections and, as a result, better health care for those who are sick. Isolating sick persons from others, quarantining proven or suspected cases, and imposing lockdowns can help reduce the number of COVID-19 infections. While this disease has a significant risk of spreading quickly when compared to other coronavirus infections, there are several ongoing initiatives and extensive research to limit the transmission of the virus. IoT technology has been demonstrated to be a safe and effective means of dealing with the COVID-19 pandemic in this setting. Following up on COVID-19 patients after they have recovered will aid in the monitoring of recurrence of symptoms and the infectivity of these recovered individuals.
1.1. Theoretical Background
Technology for the real-time detection, identification, and tracking of novel events could help delay the spread of disease [10,11]. These tools include in-depth analysis at the fog–cloud level, as well as the incorporation of captured remote tracking information, namely through mobile healthcare, and the continued monitoring of the health condition of patients [12,13]. Figure 1 shows the layered architecture of IoT–fog–cloud computing. This paper suggests a tracking and monitoring system for COVID-19 that would gather information from IoT sensors in a time-sensitive manner [14,15]. The current research presents the incorporation of eight data prediction models—Neural Network, Support Vector Machine (SVM), Deep Neural Network, K-Nearest Neighbor (K-NN), OneR, Naive Bayes, Decision Table, and Long Short-Term Memory (LSTM)—to rapidly classify possible coronavirus instances from real-time data [16]. An IoT framework that can track all potential and confirmed outbreaks, along with the recovery statuses of COVID-19 sufferers who have recovered from the infection, may be introduced using this identification and tracking system [17,18]. This method will lead to a better understanding of the existence of COVID-19 by capturing, reviewing, and storing data in addition to conducting time-sensitive monitoring [19,20]. The suggested framework comprises five important aspects:
- (1)
- Data collection of real-time symptoms (using IoT devices);
- (2)
- Quarantine/isolation center medication and result information;
- (3)
- Data processing center using Artificial Intelligent techniques;
- (4)
- Health caregivers and doctors; and
- (5)
- Cloud visualization.
Figure 2 shows the detailed COVID-19 symptoms for acute and post-follow-up cases.
1.2. Novel Contribution
The goal of the presented model is to minimize death rates using early diagnoses, follow-up information from recovered patients, and improved knowledge of the disease. Specifically, the main contributions of the presented study are as follows:
- Incorporating an IoT–fog–cloud platform for the analysis of COVID-19 cases over geographical distribution patterns;
- Presenting a fog computing environment for the prediction of the disease spread of COVID-19;
- Analyzing state-of-the-art prediction techniques for the assessment of the disease spread of COVID-19 in real-time with a fog computing platform;
- Delivering real-time information to relevant doctors and caregivers for time-sensitive precautionary decision-making;
- Validating the proposed model to assess the overall performance enhancement in comparison to the state-of-the-art prediction models.
Specifically, this paper experiments on a real dataset to validate these eight machine learning algorithms. The findings indicate that more than 90% accuracy was achieved by five of these eight algorithms. Based on time-sensitive data values, the use of these five algorithms enables the efficient and reliable prediction and detection of possible COVID-19 events. Figure 3 demonstrates the conceptual overview and layered architecture of the proposed IoT system.
2. Related Work
There are numerous significant works on the utilization of the IoT to provide healthcare; several works are presented here that indicate the incorporation of the IoT in the healthcare industry. Moreover, a subsection presents the machine learning approaches used by researchers in the healthcare field.
2.1. IoT in Healthcare
A comprehensive literature analysis of the utilization of IoT in healthcare services was performed by Usak et al. [21]. The work also included a focus on the key difficulties of incorporating IoT for provisioning healthcare delivery with categorization presented in the literature. A hybrid IoT protection and health control scheme was suggested by Wu et al. [22]. The aim was to increase safety outdoors. The framework comprises two modules: the first module captures patient information and the second module is utilized over the Internet to compile the collected data. To acquire reliable attributes in the ambient environment and patient healthcare data, wearable devices were used. To guarantee the privacy and protection of health records, Hamidi [23] analyzed the authorization of healthcare data values. The research suggested the use of technology for biometric-based authentication. In urban areas, Rath and Pattanayak [24] suggested a smart health care hospital utilizing smart appliances. Concerns regarding the hygiene, safeness, and prompt care of COVID-19 sufferers were addressed in the VANET region. Simulators such as NS2 and NetSim were used to test the proposed method. A Cloud–IoT-Health model that combined cloud computing and IoT technology for healthcare, based on the related literature, was suggested by Darwish et al. [25]. As well as emerging developments in Cloud–IoT-Health, the paper addressed the complexities of the incorporation of this technology. These challenges can be split into three layers: infrastructure, connectivity and networking, and intelligence. During physical exercises, Zhong et al. [26] researched the tracking of graduates in the university. The proposed model concentrated on a model of social events identification and tracking, requiring the pre-assessment of data. Several classifiers were evaluated and debated including Decision Trees, Neural Networks, and SVM. An IoT-based smart health tracking and control architecture was suggested by Din and Paul [27]. The architecture consisted of three layers: (1) generating data from and processing battery-powered bio-devices, (2) processing Hadoop, and (3) device layers. The work focused on the energy efficacy technique by utilizing piezoelectric instruments connected physically to a human, because of the poor ability of batteries to fuel the sensors. An IoT-inspired framework for the time-sensitive regulation of diabetes was developed by Otoom et al. [5]. Statistical models based on ARIMA and Markov were used to assess sufficient doses of insulin.
2.2. Machine Learning in Healthcare
An IoT-empowered gadget for detecting heart-related disease was introduced by Alshraideh et al. [28]. Many machine learning algorithms have been used for disease detection. Nguyen [29] provided a review of the techniques of machine learning used in coronavirus analysis. These approaches were categorized into many groups, incorporating the utilization of IoT technology. Maghdid et al. [30] recommended that sensors on smartphones be used to gather health data, such as temperature. To classify potential COVID-19 cases, Rao and Vazquez [31] suggested the utilization of deep-learning mechanisms. Learning is carried out on user data obtained from literature on the Internet that is accessible from smart devices. Allam and Jones [32] addressed the requirement, inspired by the outbreak of COVID-19, to create common protocols to exchange data between smart cities in pandemics. For example, to classify potential COVID-19 cases, artificial intelligence techniques are extended to matrices obtained from thermal cameras deployed in intelligent regions. An IoT-based technique for the detection of coronavirus cases was suggested by Fatima et al. [33]. The method was inspired by the fuzzy inference technique. A distinction was made between MERS, SARS, and COVID-19 by Peeri et al. [34], using the available literature. They proposed the use of the IoT to track the distribution of infections. To our knowledge, a full system for detecting and tracking COVID-19 using IoT technology has not been established. Table 1 shows the comparative analysis of the presented study with related works.
3. Proposed Approach
To turn appliances into intelligent devices, the IoT incorporates networking and sensing technology, as well as widespread computing [35,36]. This helps smart programs to be provided to consumers to boost the quality of their lives. There are primarily three levels of IoT architecture: physical, network, and application layers [37]. To capture heterogeneous data, physical structures are fitted with sensors [38]. There is restricted computing power and a limited lifespan for these sensors [11]. The more knowledge they gather, the more helpful the options provided [39]. The difficulty of data processing, however, is becoming a bottleneck. Connectivity can be used to work with these sensors’ restricted computing capacity. Several various networking systems, including Bluetooth, RFID, IEEE 802.15.4, 6LoWPAN, and Near Field Communication, have been used [11]. In research, networking is not only utilized to upload accumulated information but is utilized at the physical level to promote contact between heterogeneous IoT objects. In doing so, as the number of artifacts grows, the network layer can enable scalability with interface exploration and context awareness. More importantly, it can provide IoT devices with protection and privacy. It is possible to thoroughly analyze the data uploaded from the IoT units to allow effective decision-making. Deep/machine learning techniques are utilized, and such effective techniques are replacing more conventional methods. There are a wide variety of areas, including power grids, agriculture, healthcare, and smart houses, in which the IoT can be used efficiently. In healthcare, the Internet of Medical Things (IoMT) is often referred to as the IoT. Orthodox approaches based on ICT, such as telemedicine or telehealth, have been increasingly replaced. More sophisticated functionality than these conventional approaches can be provided by the IoMT. For instance, while conventional approaches can allow patients to communicate remotely with medical doctors, the IoMT also supports machine–human and machine–machine interaction, such as AI-based diagnosis. The balance between data privacy/security and patient protection is one significant concern in the design of the IoMT. Eavesdropping on contact networks (to sell the gathered data), interference, interruption, or even the alteration of the service are examples of cyber attacks that threaten those designs. Nevertheless, in contexts such as those of COVID-19 patients, it might be appropriate to breach such security precautions to assess IoT data to provide effective curative services. To aid in the assessment of this equilibrium, deep/machine learning approaches can be used.
3.1. Fundamentals of Deep/Machine Learning Approaches
To build a predictive model, this work used a pre-processed dataset to test our method of detection (or prediction). This model aims to estimate the probability that COVID-19 would infect a given organism. There have been many learning techniques used for this reason, which can be categorized into various categories. The WEKA software categorizes classifiers into six classes: (1) Dense Neural Network, (2) Decision Tables, LSTM and OneR, (3) K-Nearest Neighbors, (4) Support Vector Machines, (5) Naïve Bayes, and (6) Neural Networks. This work directly contrasts the efficiency of eight algorithms. The WEKA program was utilized in this work to execute prediction models. For each of the eight algorithms, the default attribute measures were utilized. A brief overview of the eight algorithms is given below.
3.1.1. Support Vector Machine (SVM)
The Support Vector Machine is an effective method of supervised learning. With given instances of labeled data, with each data point, the instance is associated with a positive and negative class, and the SVM predicts the separation of the instances from every category and enhances the margin between the hyperplane and the measured value. This is utilized to associate a predicted class with a novel data class.
3.1.2. Artificial Neural Network (ANN)
The Artificial Neural Network is a methodology of learning with supervised functions. The prediction mechanisms seek to replicate the prediction capacity of the human brain. Several node layers are bound by layers for this purpose. Numerical weights are represented as the edges that link between the nodes. Each node’s output is evaluated in terms of the computed input-sum. The ANN predicts mathematical measures that best identify the instances of each category with training data instances that are classified as positive and negative. For the association of a category, the presented framework is utilized. The test example drives the inputs to the initial layer. The threshold value is added to the final layer outputs to decide the mark for that instance of the test.
3.1.3. Naive Bayes
The Naive Bayes approach is a tool for guided prediction. A probabilistic approach parallels the learning process; it utilizes the probability theorem to measure parameters for the framework. The Naive Bayes approach calculates several parameters, including the likelihood of each category mark existing, given a series of training instances that are labeled. To predict a category for any specific test case, these parameters are then used. This is achieved by measuring the probability of each of the potential class labels to be applied to the test case. The mark of that test instance is determined by the highest value of these probabilities.
3.1.4. K-Nearest Neighbors (K-NN)
K-NN is a guided method of learning based on instances. A lazy approach is accompanied by the learning process. K-NN measures the distances between a given test data sets and all the training data sets, given a series of training illustrations that are labeled. These distances are utilized to associate class marks for the test data set. This is achieved by applying the class labels to the evaluation instance.
3.1.5. Decision Table
The Decision Table is a supervised learning strategy. This approach develops a model by creating a Decision Table, given a series of training instances that are labeled. A set of criteria and subsequent acts comprise the table. If any feasible accumulation of input examples is considered for the circumstances, the table is complete and prescribes the necessary behavior for each of them.
3.1.6. Dense Neural Network
A Dense Neural Network is a supervised learning technique. This approach computes a model by constructing a neural network, with a unique node, given a set of training illustrations that are labeled. In other words, using only one function of that case, a prediction for specific data is estimated. This role is calculated by determining the knowledge gain for all functions over all training cases, choosing the one with the highest value to obtain information.
3.1.7. One Rule (OneR)
OneR is a methodology for supervised learning. This approach creates a model by generating a specific function in the data set, given a set of training illustrations that are labeled. It then chooses the illustration with the minimum total error.
3.1.8. Long Short-Term Memory (LSTM) Technique
LSTM is a methodology of deep learning. This procedure creates a model by using only the goal function (i.e., class) while ignoring all other attributes, given a series of training examples that are labeled. It is known as the easiest method of classification. It assigns the plurality class to every new test case. Typically, it is used to assess baseline efficiency as a benchmark.
3.2. Research Methodology
With the advantages of the IoT and machine learning technologies in data analysis, the prediction of the spread of COVID-19 can be determined. However, the assessment of several techniques in real-time remains an open question that needs to be addressed. Moreover, the detection of an optimal technique for COVID-19 data analysis is another important concern that has to be explored. This segment introduces and addresses our planned IoT-based system that could be used in real-time to detect and classify (or predict) possible cases of coronaviruses. This equally significant structure may be used to forecast the therapeutic response of reported cases and understand the effect of the coronavirus. Table 2 shows some of the popular symptoms of COVID-19 patients in comparison to West Nile and Japanese Virus. It comprises five key modules, including the compilation and transmission of symptom data, a quarantine center, review repository, and a mobile application for doctors for visualization, in which each module is linked via a cloud platform. Specifically, the presented model uses an IoT–fog–cloud-based framework for the assessment of COVID-19 data. Fog computing acts as the intermediate for the real-time analysis of data segments for the prediction of disease spread. The visualization module is appended to display the result to relevant doctors or caregivers. Figure 4 presents a layered view of the proposed methodology. The detailed functionality is presented below.
3.2.1. Data Accumulation
The purpose of the data accumulation module is to gather data on symptoms in real-time through a series of wearable sensors on the body of the patient. In our earlier study, based on COVID-19 data instances, the most important symptoms of COVID-19 were identified, including sore throat, fever, cough, shortness of breath, and exhaustion. Many biosensors are available to detect these symptoms. For example, for the identification of fever, temperature-based sensors may be used. Utilizing voice-inspired devices with aerodynamics and different techniques, cough and acoustic classifications for various ages can be used for symptom identification. For fatigue detection, movement-focused and heartbeat sensors have been utilized. An image-based classification method can be used to diagnose a sore throat. Finally, it is possible to use oxygen-based sensors to identify respiration rates. Additionally, data can be gathered via ad-hoc networks of mobile applications with a travel history of 28 days.
3.2.2. Quarantine Center
A quarantine center gathers information on patients in a healthcare center that have been quarantined or segregated. Both essential and non-essential details are included in these documents. Each data point contains temporal patterns of the aforementioned parameters for essential data, while every instance includes travel history over the past 28 days and non-essential details including chronic illnesses, gender, age, and related information, including illness in the family. The treatment response for each case would ultimately also require each record.
3.2.3. Data Analytics
Data processing and machine learning algorithms are hosted by the data center. These techniques have been utilized to construct a framework for coronavirus detection and display the processed data with a real-time dashboard. Based on time-sensitive information gathered and submitted by users, the presented framework can then be used to rapidly classify or forecast future COVID-19 events. The model can also forecast the therapeutic response of a patient. Over time, valuable knowledge about the nature of the disease can be provided by the proposed framework, which is built from the acquired information. For data analysis, a fog computing platform has been incorporated. The detailed data flow over the fog computing platform is depicted in Figure 5. The various components interact in a coordinated manner with the fog computing node in the proposed paradigm. Initially, IoT data are collected indiscriminately from sensors placed in the body-area network of the individual. Based on the acquired data, the parametric data are delivered to the linked Raspberry Pi (fog computing device). The fog device is equipped with an ARM Cortex-A53 quadcore CPU running at 2.1 GHz and with 2 GB LPDDR2 SDRAM; it is equipped with the Raspbian Stretch operating system and Apache HTTP server 2.4.34. The data are sent via the ZigBee protocol, which is based on the IEEE 802.15.4 data communication standard. The fog node performs real-time local computations on the obtained data and sends a warning alert signal to doctors for susceptible ambient factors that might affect healthcare. Furthermore, the fog computing node uses HTTP RESTful APIs to connect with cloud services. It uploads input data and downloads results using the HTTP POST method. The data transfer is carried out utilizing the IEEE 802.11 WiFi protocol, which is widely available and easy to implement. Furthermore, Microsoft Network Monitor 3.4 is used to track network bandwidth use. Amazon EC2 cloud with 1vCPU, 2 GB RAM, 3 GB SSD, and Windows Server 2016 is used for cloud-based data processing. Monitoring authorities can conduct two key functions at the cloud level: first, regularized ambient environment monitoring may be done in real-time from remote locations to analyze data. Software APIs created with the OS-SDK supplied with the device can be used to create the visualization. Second, prediction is implemented over a large number of datasets, with an automatic assessment of healthcare.
3.2.4. Medical Doctors
Doctors can track suspicious data that are uploaded in real-time and suggest a potential infection by our proposed identification/prediction model focused on machine learning. By conducting the additional clinical examination required to validate the situation, the doctors would then be able to respond rapidly to these suspicious cases. This will help confirmed cases to be isolated and for proper health care to be provided.
3.2.5. Cloud Data Repository
The cloud technology is integrated through the Internet, which (1) allows each user to upload real-time symptom data, (2) holds personal health information, (3) communicates forecast reports, (4) communicates doctor advice, and (5) preserves data.
- Via wearable devices and sensors, the framework seamlessly captures time-sensitive information. A sore throat, cough, fever, exhaustion, and a low respiration rate are the most significant symptoms. The users also submit information about living in (or commuting to) contaminated areas through a smartphone application, as well as their potential interactions with people infected with COVID-19. The quarantine center presents information daily from its segregated patients. The context of the information is identical to the data obtained by users in real-time;
- Via the cloud infrastructure, intercepted COVID-19 data are submitted to the information processing module with the aid of smart devices. Via the cloud platform, automated documents from the hospitals can be periodically submitted to the data processing center. Deep learning techniques are used that constantly refine the models using the data obtained from the health care center. Based on the time-sensitive information acquired from each individual, the models are then used to classify possible events. The data are processed and presented on a time-sensitive dashboard. The dashboard can provide insights about the existence of the virus for doctors;
- The relevant specialists are contacted to check up with the patient if a possible case is found. For medical examinations with a Polymerase Chain Reaction, used to detect positive cases, the patient will be advised to attend the medical care center. The patient will be separated if the case is confirmed, and all connections will be contacted and quarantined.
The use of the same smartphone program to advise consumers is a parallel and integral part of this structure, providing practical knowledge about how users can mitigate disease and how to prevent exposure to the virus.
3.2.6. Visualization
For real-time decision modeling, this layer serves as a presentation layer. This layer’s major role is to show the expected outcome on a user’s hand-held device. The result is displayed to the user in real-time on a liquid crystal panel (LCD) or a smartphone for efficiency. In addition, the Self-Organized Mapping (SOM) approach enhances the visualization with an alert warning rather than presenting the numeric value of the parameters. SOM is a useful technique for locating disease hotspots. The goal of this layer is to use Geographical Information System (GIS) tools to investigate the spatial distribution of disease-endemic regions and find COVID-19 hot-spots utilizing spatial cluster analysis techniques such as Getis-Ord Gi* and SOM. Mapping is done using ArcGIS 10.2 software and the SOM approach to enable a dynamic display based on the color-coding scheme to undertake a GIS-based study of the geographical distribution of COVID-19. A cell phone is used to register each user with the system. Upon registration, the user is assigned a unique user identification number that will be used for all future interactions. It contains each COVID-19 diagnosis, as well as the categorization findings and medical data gathered. The findings and information recorded here are accessible to registered medical staff, users, hospitals, and healthcare providers. Users and approved agencies can access medical records at any time and from any location. Similarly, an alarm message regarding a person’s presence is kept on cloud storage for expert analysis so that fast action and preventative measures may be taken.
3.3. Case Prediction Analysis
The deep/machine learning techniques used in the data processing module of the presented IoT-inspired framework are further explored in this section. Specifically, a simulation was carried out to explore the feasibility of incorporating machine learning techniques to easily classify (or predict) possible infections with COVID-19. This experimental setup is described in the remainder of this section.
Data Instances
In total, 15,324 data instances of confirmed COVID-19 cases were acquired from the CORD-19 repository. There were various forms of details about each case in the data. The current research focuses on healthcare signs including fever, headache, cough, chills, and other symptoms concerning COVID-19 patients. The data were acquired in the form of (0,1), where 0 means non-vulnerable and 1 indicates vulnerable. However, or several of the instances documented in the database, some of this material was incomplete. The data were also not well organized for use by machine learning algorithms.
3.4. Data Pre-Processing
The data were pre-processed and organized in the current work to be the best fit for machine learning. The acquired data culminated in an 80-symptom list. Many of these signs are redundant. The number of symptoms was, however, limited to 19. The synthesis of COVID-19 parameters was carried by two medical doctors in an ad-hoc fashion. For some, the symptoms “anorexia” and “loss of appetite” were mixed. The relative value of these 19 signs was also calculated. The following six separate, statistically dependent feature selection algorithms were used to rate the 19 signs based on their respective significance: inter-quartile range, spectral measure, Pearson correlation, knowledge measure, and weighted variance-based feature. In addition to ranking symptoms, weights were associated with each of them. The five most significant symptoms (ordered from most important to least important) were cough, fever, tiredness, sore throat, and respiration rate. This study used the five most significant signs. Moreover, two new attributes were included: sense and touch. The first attribute reflected whether the user could sense, traveled to, or went through a potentially contaminated environment or not. The second attribute referred to whether the individual was considered to be in communication with an infectious individual or not. This culminated in total data records from a pre-processed dataset.
3.4.1. Performance Assessment
Four performance measurements were used to assess the effectiveness of the eight techniques: root mean square error, accuracy, ROC area, and estimation. Uncertainty matrix and cross-validation approaches could be used to compute these steps.
3.4.2. Confusion Matrix
By generating a two-by-two matrix, the confusion matrix was used to visualize the output of a binary (two-class) supervised learning problem. Each row in the matrix represented the instances in the expected (or computed) class, while the instances in the real class were presented in each column. Four values made up the resulting matrix.
- True positive (TP): Total instances defined as positive and currently positive (using the statistical model);
- False positive (FP): Total instances labeled as positive (using the statistical model) but that are negative;
- False negative (FN): Total instances defined as negative (using the statistical model) that are positive;
- True negative (TN): Total instances defined as negative (using the predictive model) that are negative.
3.4.3. Cross-Validation
Cross-validation is a mathematical approach used to assess learning efficiency and methods of classification. This is achieved by separating the available instances of guided information into k-folds. One of those folds was used for research, and the other was used for preparation. Ten-fold cross-validation was used in this work. Instances of data were broken into 10 folds. One fold was used for 11 iterations for verification and 10 folds for preparation, such that testing was conducted in each iteration.
Accuracy
A classifier’s accuracy was measured as the number of instances correctly identified out of the total instances.
Root Mean Square Error
The root mean square error (RMSE) was measured as the average square root of square differences between the expected and the real groups (or labels).
F-Measure
The F-measure was determined by integrating the two accuracy and recall tests:
ROC Curve
Another means of calculating the output of a classifier was the receiver operational characteristics (ROC). The true positive rate was plotted against the false positive rate to achieve this. Then, the region under the resulting ROC curve was used to calculate the classifier’s accuracy. The nearer the region was to 1, the more accurate the classifier was.
and
4. Results and Discussion
4.1. Confusion Matrix
The uncertainty matrices arising from the implementation of 10-fold cross-validation for the eight chosen classifiers are seen in Figure 6. High numbers of these matrices represent positive scores in the upper-left and lower-right boxes. Large numbers of these matrices represent poor scores in the lower-left and upper-right boxes.
4.2. Performance Measures
Figure 7 displays the ROC curves that resulted from the eight chosen classifiers after 10-fold cross-validation and shows the comparison of the algorithms’ results. The figure displays each algorithm’s precision, root mean square error, F-measure, and ROC field, which was measured using the well-known 10-fold cross-validation method. The findings of Table 3 and Figure 8 indicate that the models developed using the SVM, Neural Network, Naïve Bayes, K-NN, and Decision Table algorithms were successful in predicting verified and possible COVID-19 events. This indicates that a mixture of these five powerful frameworks may be used by our suggested IoT-based system. This may be achieved by aggregating, depending on plurality votes, the outcomes of these five learned models.
5. Conclusions
An IoT–fog–cloud-based prediction and data analysis framework to reduce the spread of COVID-19 diseases has been presented. The proposed framework incorporates machine and deep learning-based predictive models for COVID-19 monitoring, as well as providing information to doctors with knowledge about possible COVID-19 cases and clinical data of reported COVID-19 cases. Moreover, the presented framework enables the real-time classification of infected patients for the detection of the spread of COVID-19. An experiment was performed on a real COVID-19 dataset to test eight machine/deep learning algorithms: (1) Support Vector Machine, (2) Neural Network, (3) Naive Bayes, (4) K-Nearest Neighbor (KNN), (5) Decision Table, (6) Dense Neural Network, (7) OneR, and (8) LSTM. The results show that, except for Dense Neural Network, OneR, and LSTM, all algorithms obtained less than 90% accuracy. Thus, the efficient and reliable detection of possible cases of COVID-19 can be provided with the use of deep/machine learning techniques. With early case identification, the use of the proposed real-time fog platform could theoretically reduce the effects of the spread of COVID-19 as well as mortality rates. In the future, research can be performed considering the security aspects of the proposed model.
Funding
This research received no external funding.
Conflicts of Interest
The authors declare no conflict of interest.
References
- Birhane, M.; Bressler, S.; Chang, G.; Clark, T.; Dorough, L.; Fischer, M.; Watkins, L.F.; Goldstein, J.M.; Kugeler, K.; Langley, G.; et al. COVID-19 Vaccine Breakthrough Infections Reported to CDC—United States, January 1–April 30, 2021. Morb. Mortal. Wkly. Rep. 2021, 70, 792–793. [Google Scholar]
- Singh, R.P.; Javaid, M.; Haleem, A.; Suman, R. Internet of things (IoT) applications to fight against COVID-19 pandemic. Diabetes Metab. Syndr. Clin. Res. Rev. 2020, 14, 521–524. [Google Scholar] [CrossRef]
- Ding, W.; Levine, R.; Lin, C.; Xie, W. Corporate immunity to the COVID-19 pandemic. J. Financ. Econ. 2021, 141, 802–830. [Google Scholar] [CrossRef]
- He, W.; Zhang, Z.J.; Li, W. Information technology solutions, challenges, and suggestions for tackling the COVID-19 pandemic. Int. J. Inf. Manag. 2021, 57, 102287. [Google Scholar] [CrossRef] [PubMed]
- Otoom, M.; Otoum, N.; Alzubaidi, M.A.; Etoom, Y.; Banihani, R. An IoT-based framework for early identification and monitoring of COVID-19 cases. Biomed. Signal Process. Control 2020, 62, 102149. [Google Scholar] [CrossRef] [PubMed]
- Javaid, M.; Khan, I.H. Internet of Things (IoT) enabled healthcare helps to take the challenges of COVID-19 Pandemic. J. Oral Biol. Craniofac. Res. 2021, 11, 209–214. [Google Scholar] [CrossRef] [PubMed]
- Jung, Y.; Agulto, R. A Public Platform for Virtual IoT-Based Monitoring and Tracking of COVID-19. Electronics 2021, 10, 12. [Google Scholar] [CrossRef]
- Mukherjee, R.; Kundu, A.; Mukherjee, I.; Gupta, D.; Tiwari, P.; Khanna, A.; Shorfuzzaman, M. IoT-cloud based healthcare model for COVID-19 detection: An enhanced k-Nearest Neighbour classifier based approach. Computing 2021, 1–21. [Google Scholar] [CrossRef]
- Sapkal, G.; Yadav, P.D.; Sahay, R.R.; Deshpande, G.; Gupta, N.; Nyayanit, D.A.; Patil, D.Y.; Kumar, S.; Abraham, P.; Panda, S.; et al. Neutralization of Delta variant with sera of Covishield vaccinees and COVID-19 recovered vaccinated individuals. bioRxiv 2021. [Google Scholar] [CrossRef]
- Ramallo-González, A.P.; González-Vidal, A.; Skarmeta, A.F. CIoTVID: Towards an Open IoT-Platform for Infective Pandemic Diseases such as COVID-19. Sensors 2021, 21, 484. [Google Scholar] [CrossRef] [PubMed]
- Bhatia, M.; Kaur, S.; Sood, S.K. IoT-Inspired Smart Toilet System for Home-Based Urine Infection Prediction. ACM Trans. Comput. Healthc. 2020, 1, 1–25. [Google Scholar] [CrossRef]
- Singh, V.; Chandna, H.; Kumar, A.; Kumar, S.; Upadhyay, N.; Utkarsh, K. IoT-Q-Band: A low cost internet of things based wearable band to detect and track absconding COVID-19 quarantine subjects. EAI Endorsed Trans. Internet Things 2020, 6. [Google Scholar] [CrossRef] [Green Version]
- Khan, P.I.; Razzak, I.; Dengel, A.; Ahmed, S. Understanding Information Spreading Mechanisms During COVID-19 Pandemic by Analyzing the Impact of Tweet Text and User Features for Retweet Prediction. arXiv 2021, arXiv:2106.07344. [Google Scholar]
- Qayyum, A.; Razzak, I.; Tanveer, M.; Kumar, A. Depth-wise dense neural network for automatic COVID19 infection detection and diagnosis. Ann. Oper. Res. 2021, 1–21. [Google Scholar] [CrossRef]
- Alhasan, A.; Audah, L.; Ibrahim, I.; Al-Sharaa, A.; Al-Ogaili, A.S.; Mohammed, J.M. A case-study to examine doctors’ intentions to use IoT healthcare devices in Iraq during COVID-19 pandemic. Int. J. Pervasive Comput. Commun. 2020. [Google Scholar] [CrossRef]
- Ghimire, A.; Thapa, S.; Jha, A.K.; Kumar, A.; Kumar, A.; Adhikari, S. AI and IoT Solutions for Tackling COVID-19 Pandemic. In Proceedings of the 2020 4th International Conference on Electronics, Communication and Aerospace Technology (ICECA), Coimbatore, India, 5–7 November 2020; pp. 1083–1092. [Google Scholar]
- Razzak, I.; Naz, S.; Rehman, A.; Khan, A.; Zaib, A. Improving coronavirus (COVID-19) diagnosis using deep transfer learning. MedRxiv 2020. [Google Scholar] [CrossRef] [Green Version]
- Jaafari, S.; Alhasani, A.; Alghosn, E.; Alfahhad, R.; Almutairi, S.M. Certain Investigations on IoT system for COVID-19. In Proceedings of the 2020 International Conference on Computing and Information Technology (ICCIT-1441), Tabuk, Saudi Arabia, 9–10 September 2020; pp. 1–4. [Google Scholar] [CrossRef] [Green Version]
- Vedaei, S.S.; Fotovvat, A.; Mohebbian, M.R.; Rahman, G.M.; Wahid, K.A.; Babyn, P.; Marateb, H.R.; Mansourian, M.; Sami, R. COVID-SAFE: An IoT-Based System for Automated Health Monitoring and Surveillance in Post-Pandemic Life. IEEE Access 2020, 8, 188538–188551. [Google Scholar] [CrossRef]
- Kumar, S.; Raut, R.D.; Narkhede, B.E. A proposed collaborative framework by using artificial intelligence-internet of things (AI-IoT) in COVID-19 pandemic situation for healthcare workers. Int. J. Healthc. Manag. 2020, 13, 337–345. [Google Scholar] [CrossRef]
- Usak, M.; Kubiatko, M.; Shabbir, M.S.; Viktorovna Dudnik, O.; Jermsittiparsert, K.; Rajabion, L. Health care service delivery based on the Internet of things: A systematic and comprehensive study. Int. J. Commun. Syst. 2020, 33, e4179. [Google Scholar] [CrossRef]
- Wu, F.; Wu, T.; Yuce, M.R. An internet-of-things (IoT) network system for connected safety and health monitoring applications. Sensors 2019, 19, 21. [Google Scholar] [CrossRef] [Green Version]
- Hamidi, H. An approach to develop the smart health using Internet of Things and authentication based on biometric technology. Future Gener. Comput. Syst. 2019, 91, 434–449. [Google Scholar] [CrossRef]
- Rath, M.; Pattanayak, B. Technological improvement in modern health care applications using Internet of Things (IoT) and proposal of novel health care approach. Int. J. Hum. Rights Healthc. 2019, 12, 148–162. [Google Scholar] [CrossRef]
- Darwish, A.; Hassanien, A.E.; Elhoseny, M.; Sangaiah, A.K.; Muhammad, K. The impact of the hybrid platform of internet of things and cloud computing on healthcare systems: Opportunities, challenges, and open problems. J. Ambient. Intell. Humaniz. Comput. 2019, 10, 4151–4166. [Google Scholar] [CrossRef]
- Zhong, C.L.; Li, Y.-L. Internet of things sensors assisted physical activity recognition and health monitoring of college students. Measurement 2020, 159, 107774. [Google Scholar] [CrossRef]
- Din, S.; Paul, A. Smart health monitoring and management system: Toward autonomous wearable sensing for internet of things using big data analytics. Future Gener. Comput. Syst. 2019, 91, 611–619. [Google Scholar] [CrossRef]
- Alshraideh, H.; Otoom, M.; Al-Araida, A.; Bawaneh, H.; Bravo, J. A web based cardiovascular disease detection system. J. Med. Syst. 2015, 39, 1–6. [Google Scholar] [CrossRef]
- Nguyen, T.T. Artificial intelligence in the battle against coronavirus (COVID-19): A survey and future research directions. arXiv 2020, arXiv:2008.07343. [Google Scholar]
- Maghded, H.S.; Ghafoor, K.Z.; Sadiq, A.S.; Curran, K.; Rawat, D.B.; Rabie, K. A novel AI-enabled framework to diagnose coronavirus COVID-19 using smartphone embedded sensors: Design study. In Proceedings of the 2020 IEEE 21st International Conference on Information Reuse and Integration for Data Science (IRI), Las Vegas, NV, USA, 11–13 August 2020; pp. 180–187. [Google Scholar]
- Rao, A.S.S.; Vazquez, J.A. Identification of COVID-19 can be quicker through artificial intelligence framework using a mobile phone–based survey when cities and towns are under quarantine. Infect. Control Hosp. Epidemiol. 2020, 41, 826–830. [Google Scholar] [CrossRef] [Green Version]
- Allam, Z.; Jones, D.S. On the coronavirus (COVID-19) outbreak and the smart city network: Universal data sharing standards coupled with artificial intelligence (AI) to benefit urban health monitoring and management. Healthcare 2020, 8, 46. [Google Scholar] [CrossRef] [Green Version]
- Fatima, S.A.; Hussain, N.; Balouch, A.; Rustam, I.; Saleem, M.; Asif, M. IoT enabled smart monitoring of coronavirus empowered with fuzzy inference system. Int. J. Adv. Res. Ideas Innov. Technol 2020, 6. [Google Scholar] [CrossRef]
- Peeri, N.C.; Shrestha, N.; Rahman, M.S.; Zaki, R.; Tan, Z.; Bibi, S.; Baghbanzadeh, M.; Aghamohammadi, N.; Zhang, W.; Haque, U. The SARS, MERS and novel coronavirus (COVID-19) epidemics, the newest and biggest global health threats: What lessons have we learned? Int. J. Epidemiol. 2020, 49, 717–726. [Google Scholar] [CrossRef] [PubMed] [Green Version]
- Bhatia, M.; Sood, S.K. A comprehensive health assessment framework to facilitate IoT-assisted smart workouts: A predictive healthcare perspective. Comput. Ind. 2017, 92, 50–66. [Google Scholar] [CrossRef]
- Bhatia, M.; Sood, S.K. Game theoretic decision making in IoT-assisted activity monitoring of defence personnel. Multimed. Tools Appl. 2017, 76, 21911–21935. [Google Scholar] [CrossRef]
- Bhatia, M.; Sood, S.K. Internet of Things based activity surveillance of defence personnel. J. Ambient. Intell. Humaniz. Comput. 2018, 9, 2061–2076. [Google Scholar] [CrossRef]
- Bhatia, M.; Sood, S.K. Exploring temporal analytics in fog-cloud architecture for Smart Office HealthCare. Mob. Netw. Appl. 2019, 24, 1392–1410. [Google Scholar] [CrossRef]
- Bhatia, M.; Sood, S.K.; Kaur, S. Quantumized approach of load scheduling in fog computing environment for IoT applications. Computing 2020, 1–19. [Google Scholar] [CrossRef]
Figure 1.
IoT–fog–cloud layered architecture.

Figure 2.
COVID-19 symptoms.

Figure 3.
Conceptual framework of early prediction of COVID-19.

Figure 4.
Layered architecture of proposed model.

Figure 5.
Fog computing-based data analysis.
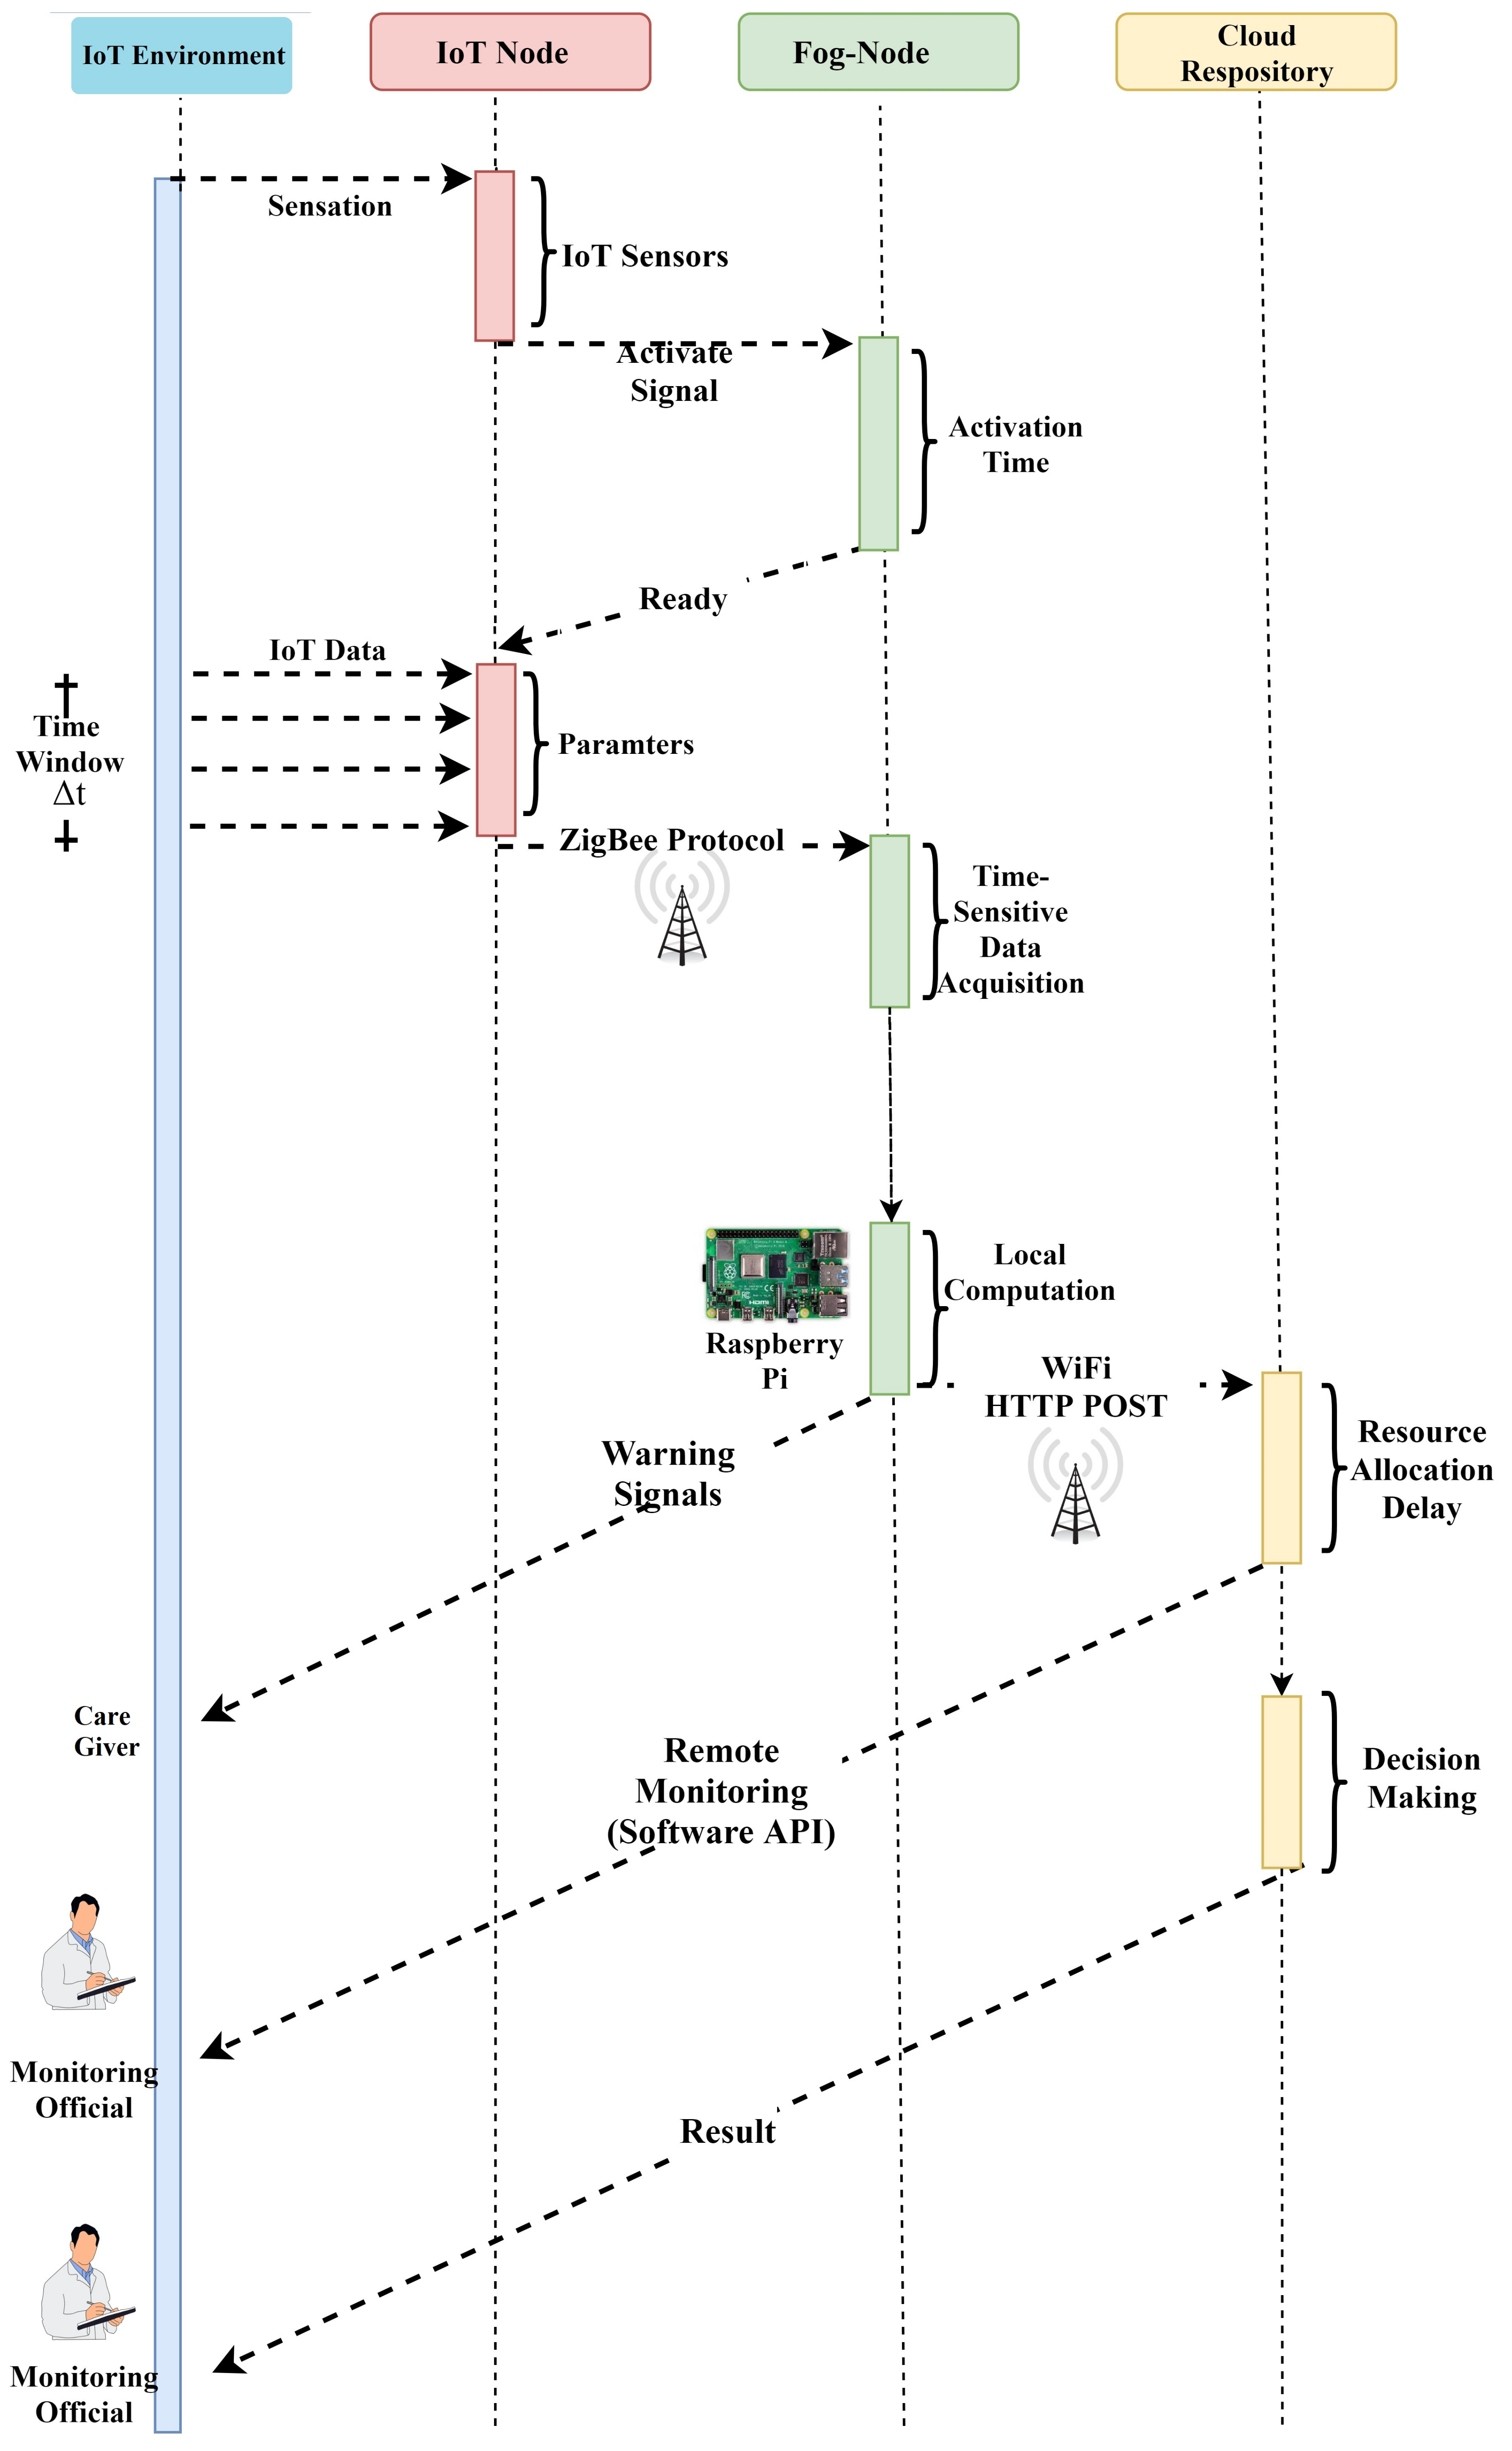
Figure 6.
(a-h) Confusion matrix.

Figure 7.
ROC curves for prediction models.

Figure 8.
Performance measures.


Table 1.
Comparative analysis with state-of-the-art work (Y: yes, N: no).
| Parameters | Hamidi (2020) | Rath and Pattanayak (2020) | Otoom et al. (2020) | Usak et al. (2020) | Wu et al. (2020) | Proposed Work |
|---|---|---|---|---|---|---|
| Application domain (AD) | Medical emergency | Distant monitoring system | Smart healthcare model for COVID-19 | Healthcare assessment framework | Monitoring healthcare framework | Novel system for healthcare framework |
| Major contribution (MC) | Medical healthcare system | Customized health assessment | Technique for prediction and monitoring of COVID-19 | Monitoring mosquito-borne disease | Healthcare system for monitoring heart disease | COVID-19 healthcare system |
| IoT | Wearable sensor devices | Android application | Sensors | RFID | Wearable sensors | IoT |
| Cloud computing (CC) | N | Y | Y | N | Y | Y |
| Fog computing (FC) | N | Y | Y | N | Edge computing | Y |
| Alert generation (AT) | N | Y | N | Y | N | Alert Based |
| Prediction model (PM) | NA | N | Hybrid | NA | N | T-RNN |
| Data storage (DS) | Local | Cloud | NA | Cloud | Local | cloud |
| Data mining technique (DMT) | N | NA | Hybrid | RAKE technology | NA | Spatio-temporal |
| Security mechanism (SM) | Y | Y | N | N | N | Y |
| Visualization (VsL) | Y | Y | N | Y | N | Y |
Table 2.
Symptoms-based analysis.
| Symptoms | West Nile | Japanese Virus | COVID-19 |
|---|---|---|---|
| Fever | ↑↑↑ | ↑↑↑(High fever) | Sudden onset of high fever |
| Saturation Drop | ↑↑↑ | ↑↑↑ | ↑↑↑ |
| Head ache | ↑↑↑ | ↑↑↑ | ↑↑↑ |
| Muscle and joint pain | ↑↑ | ↑↑ | ↑↑↑(severe) |
| Nausea or Vomiting | ↑↑↑ | ↑↑↑ | ↑↑↑ |
| Seizures | ↓ | ↑↑ | ↑↑ |
| Loss of memory | ↓ | ↑↑ | ↑↑ |
| Coma | ↑↑↑ | ↑↑↑ | ↑↑↑ |
| Drowsiness | ↑↑↑ | ↑↑↑ | ↑↑↑(Extreme tiredness) |
| Paralysis | ↑↑↑ | ↑↑↑ | ↑↑↑ |
| Tremors | ↑↑↑ | ↑↑↑ | ↓ |
| Neck stiffness | ↑/↓ | ↑/↓ | ↑ |
| Unconsciousness | ↑/↓ | ↑↑ | ↑↑ |
| Aversion of bright light | ↓ | ↓ | ↑ |
| Problem with speech or hearing | ↓ | ↑/↓ | ↑↑ |
Table 3.
Performance results.
| Models | Accuracy | RMSE | F-Measure | ROC |
|---|---|---|---|---|
| SVM | 93.23 | 25.25 | 93.12 | 92.59 |
| Neural Network | 93.16 | 21.26 | 93.26 | 95.45 |
| Naive Bayes | 89.26 | 32.15 | 91.48 | 94.65 |
| K-NN | 88.14 | 29.56 | 93.21 | 93.56 |
| Decision Table | 87.14 | 2648 | 93.65 | 94.12 |
| DNN | 93.25 | 12.26 | 92.26 | 92.65 |
| OneR | 90.26 | 65.25 | 69.26 | 70.25 |
| LSTM | 92.25 | 12.66 | 90.48 | 91.69 |
Publisher’s Note: MDPI stays neutral with regard to jurisdictional claims in published maps and institutional affiliations. |
© 2021 by the author. Licensee MDPI, Basel, Switzerland. This article is an open access article distributed under the terms and conditions of the Creative Commons Attribution (CC BY) license (https://creativecommons.org/licenses/by/4.0/).
Share and Cite
MDPI and ACS Style
Aljumah, A. Assessment of Machine Learning Techniques in IoT-Based Architecture for the Monitoring and Prediction of COVID-19. Electronics 2021, 10, 1834. https://doi.org/10.3390/electronics10151834
AMA Style
Aljumah A. Assessment of Machine Learning Techniques in IoT-Based Architecture for the Monitoring and Prediction of COVID-19. Electronics. 2021; 10(15):1834. https://doi.org/10.3390/electronics10151834
Chicago/Turabian StyleAljumah, Abdullah. 2021. "Assessment of Machine Learning Techniques in IoT-Based Architecture for the Monitoring and Prediction of COVID-19" Electronics 10, no. 15: 1834. https://doi.org/10.3390/electronics10151834
Note that from the first issue of 2016, this journal uses article numbers instead of page numbers. See further details here.