
An Adaptive Heart Rate Monitoring Algorithm for Wearable Healthcare Devices


1
Department of Electrical Engineering, National Chung Hsing University, Taichung 407, Taiwan
2
Department of Internal Medicine, Taichung Veterans General Hospital, Taichung 407, Taiwan
3
Department of Medical Laboratory Science and Biotechnology, Central Taiwan University of Science and Technology, Taichung 407, Taiwan
4
Bachelor Program of Electrical Engineering and Computer Science, National Chung Hsing University, Taichung 407, Taiwan
5
Innovation and Development Center of Sustainable Agriculture (IDCSA), National Chung Hsing University, Taichung 407, Taiwan
*
Author to whom correspondence should be addressed.
Electronics 2021, 10(17), 2092; https://doi.org/10.3390/electronics10172092
Submission received: 30 June 2021
/
Revised: 24 August 2021
/
Accepted: 24 August 2021
/
Published: 29 August 2021
(This article belongs to the Special Issue Electronic Devices on Intelligent IoT Applications)
Abstract
:This paper focuses on developing an adaptive heart rate monitoring algorithm for wrist-based rehabilitation systems. Due to the characteristics of the wrist, the heartbeat measurements are unstable. To improve the preprocessing efficiency and perform measurement calibration, a novel joint algorithm incorporating automatic multiscale-based peak detection and fuzzy logic control (AMPD-Fuzzy) is proposed. The monitoring approach consists of two phases: (1) Preprocessing and (2) Detection and Calibration. Phase 1 explores the parameter settings, threshold, and decision rules. Phase 2 applies fuzzy logic control and the Laplacian model to provide signal reshaping. Experimental results show that the proposed algorithm can effectively achieve heart rate monitoring for wearable healthcare devices.
1. Introduction
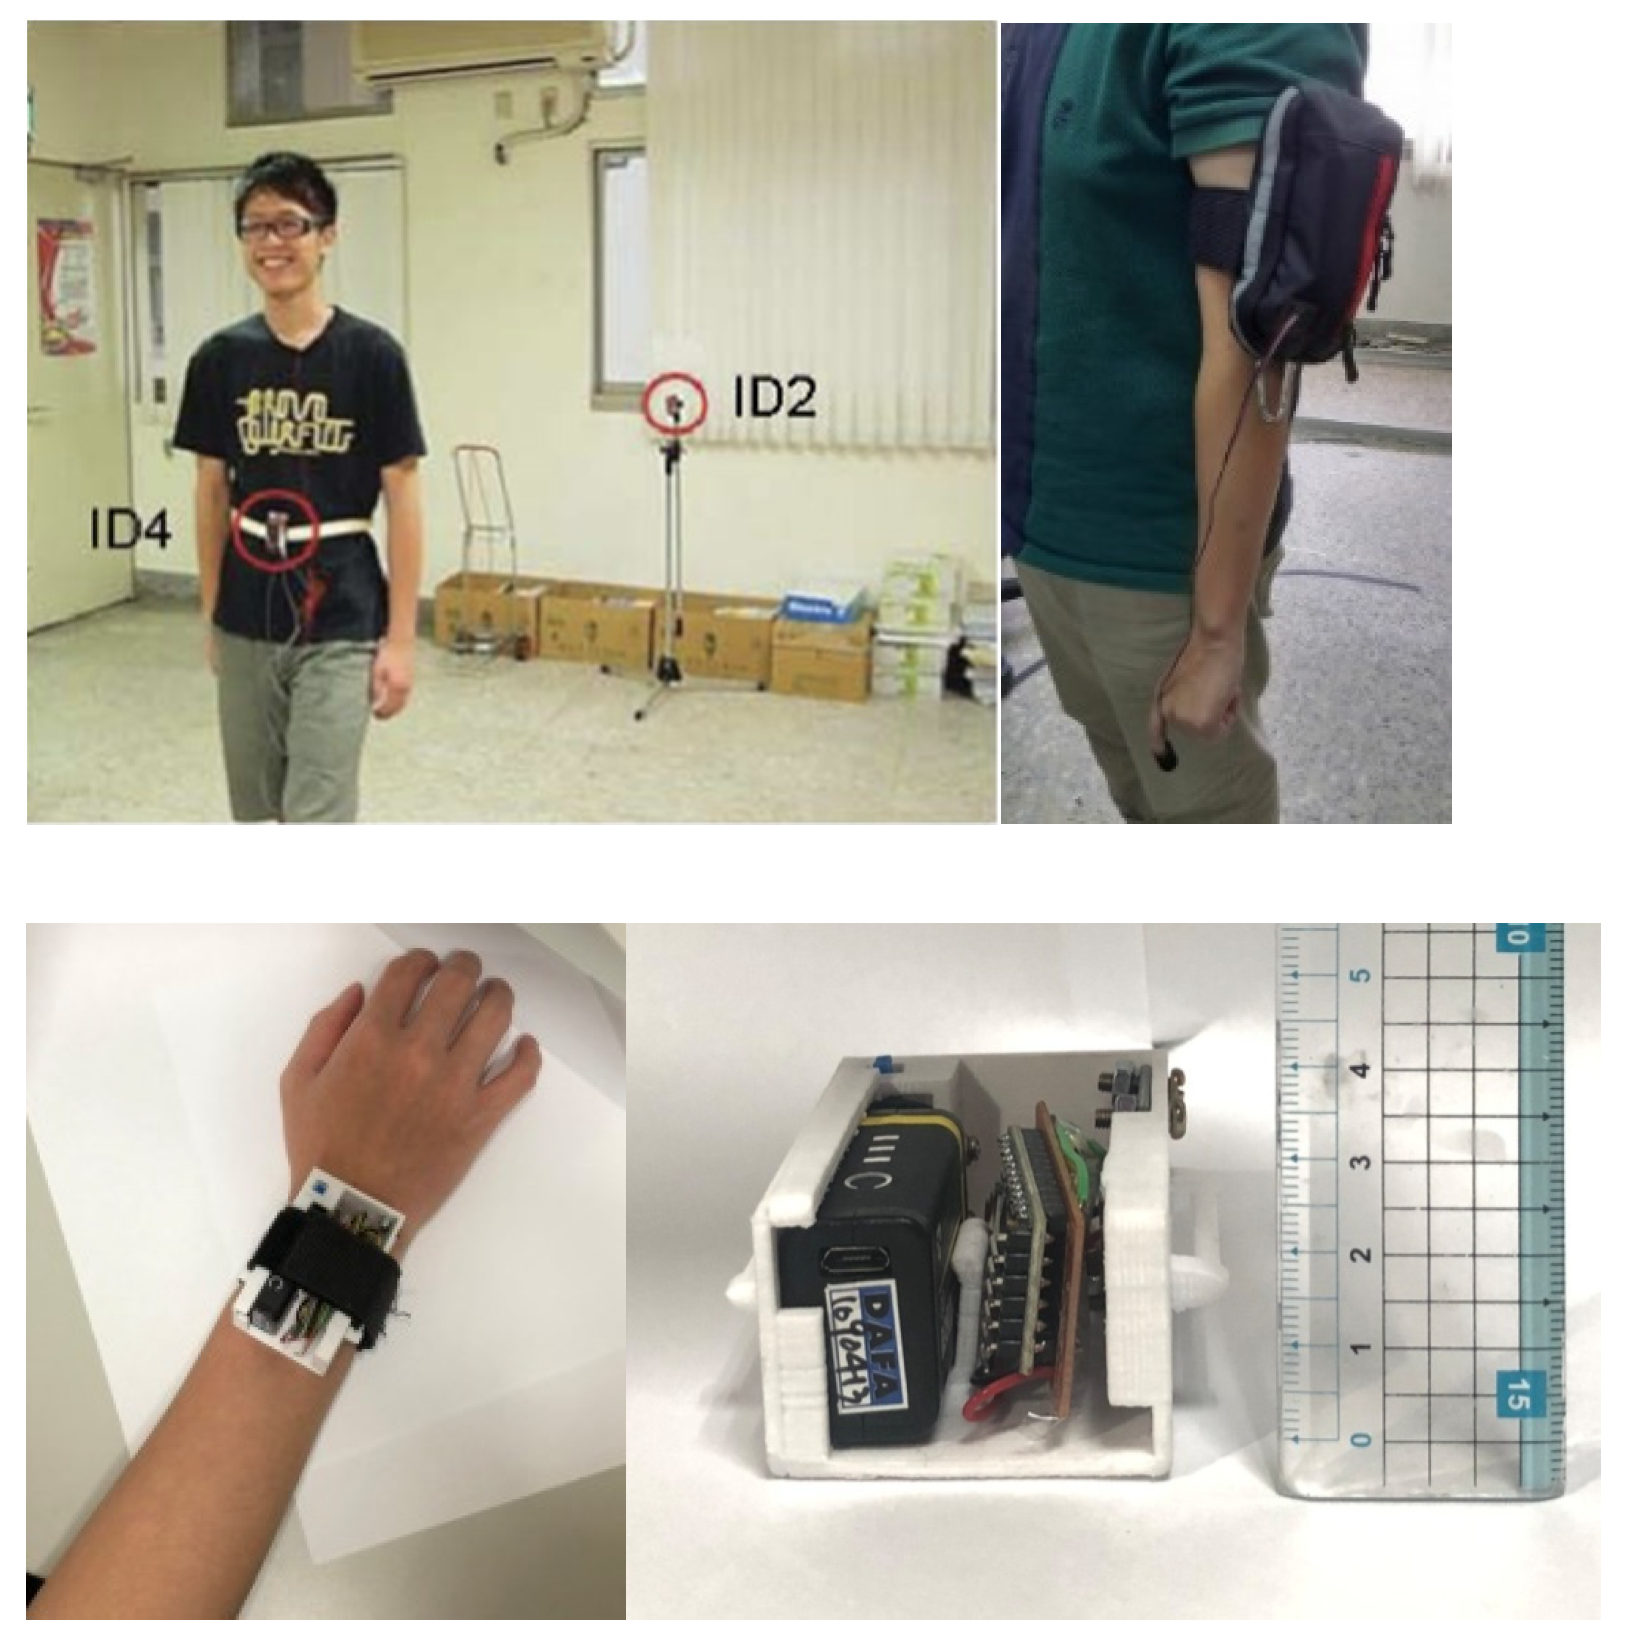
The use of photoplethysmography (PPG)-based systems is widespread in clinical applications of heart rate (HR) tracking. In comparison to the various types of PPG-based HR monitoring devices, the wristband-type PPG is considered the most popular and preferred device [1]. The reason for its popularity is partly due to its remarkable properties such as being inexpensive, highly portable, and very convenient to wear by its users. Esfahani [2] presented that for the placement of an inertial measurement unit (IMU), the wrist is one of the most frequently selected locations, with 55.6 percent preference. Accordingly, the features of wristband-type placement may be utilized to design more convenient and comfortable healthcare systems. Following this concept, we developed a pulmonary rehabilitation (PR) system, evolving from a biosensor module-based approach (Figure 1 (left)) [3] to an arm bag-based way (Figure 1 (right)) [4] to a wrist-based wearable system (Figure 1 (bottom)). Note that PR is widely regarded as an effective therapy [5,6] for patients with pulmonary disease, considering the overload principle (e.g., the training intensity) and safety concerns (e.g., heart rate). Since the heart rate measurement is critical in the PR operation, this work focuses on the HR monitoring.
Figure 2a–c show the finger and wrist PPG signals. Observe that the wrist measurements are unstable. Even with a heartbeat bracelet on the market [7], Figure 2d shows the fluctuation of PPG signals on the dynamic wrist. This is because the measurement accuracy is subject to noise introduced by the variation of skin contact on the patient, device movement, or environmental conditions [8]. Therefore, this work aims to develop an HR tracking mechanism for healthcare applications with wrist-based wearable devices.
Heart rate tracking from a wrist-type PPG signal during physical activities is a challenge. The commonly used motion artifact rejection methods are incapable of achieving satisfactory tracking performance. To solve the above problem, several algorithms have been developed to refine the heart rate estimates, such as adaptive filtering [9], wavelet-based denoising [10], independent component analysis [11], empirical mode decomposition [12], time frequency analysis, and signal decomposition [13]. However, their performances are highly dependent on heuristic thresholds or parameters tuned for specific scenarios, which makes them impractical in natural environments where a user performs a wide range of physical activities in daily life [14].
In consideration of tackling the above challenge, the major contributions and features of this work are as follows: (1) the proposition of a novel HR monitoring algorithm, integrating the properties of automatic multiscale-based peak detection (AMPD) [15] and fuzzy logic control (AMPD-Fuzzy); (2) the development of parameter settings, thresholds, and decision rules to improve the preprocessing efficiency; (3) the construction of a fuzzy logic control to determine the value of an adaptive parameter for adjusting the signal index range of overlap and calibration; (4) the use of the Laplacian model to perform periodic offset calibration and remove noise interference. The performance comparison of the existing and proposed systems is detailed in Section 2.4.
2. Background and Related Work
This section introduces background information and related work, including the wristband-type PPG-based devices, the sources of measurement inaccuracy, the learning models, and the time-frequency analysis.
2.1. Wristband-Type PPG-Based Devices
Although the wristband-type PPG is considered the most popular and preferred device, these devices have their own limitations [16] related to signal quality. Lee [17] presented a wristwatch PPG probe positioned on the ulnar and radial arteries around the patient’s wrist instead of the blood capillaries, which is the common measurement site. The proposed device improved sensitivity and accuracy of the PPG signal by using an array of sensors, IR-LEDs, and photo transistors. Thomas [18] proposed a method to mitigate the effects of motion artifacts on the quality of the PPG signal with an inertial sensor along with green LEDs.
2.2. Sources of Inaccuracy—Motion Artifacts
Due to the high probability of the proximity of HR and motion artifact spectral peaks and spectral peak randomness, the removal of motion artifacts is an important preprocessing step in classical signal processing to calculate the HR from PPG. In [19], HR calculations were divided into four phases, including pre-filtering, motion artifact removal, peak detection, and peak tracking. Zong [20] addressed the HR tracking problem in two distinct stages: pre-filtering and peak tracking. The pre-filtering stage focused on noise and movement artifact removal. The peak tracking stage contained the peak detection and tracking operations. Sources of inaccuracy in wearable optical heart rate sensors were further investigated in [21,22].
2.3. Learning Models
Very recently, several deep-learning-based approaches have been proposed to estimate the HR from contaminated PPG signals, such as CorNET [23] and Deep PPG [24], which were trained for each different individual and rely on the HR derived from electrocardiography (ECG) signals as the labels. Chang [14] proposed DeepHeart, an approach for HR estimation from contaminated PPG signals using deep-learning-based denoising and spectrum analysis, which generated clean PPG signals from ECG signals based on a training data set. DeepHeart applied deep convolutional neural networks ensemble for denoising the PPG signals. To obtain the labels of the contaminated PPG signals, a method to generate clean PPG signals from ECG signals was designed. With the contaminated PPG signals and their labels, denoising convolutional neural networks were trained for denoising. As a result, most of the motion artifacts were removed from the contaminated PPG signals. Then, a spectrum-analysis-based HR calibration algorithm was applied to the processed PPG signals.
2.4. Time-Frequency Analysis
Cicone [25] argued that despite the popularity of the noninvasive, economic, comfortable, and easy-to-install PPG, it was still lacking a mathematically rigorous and stable algorithm which can simultaneously extract information from a single-channel PPG signal. Two nonlinear time-frequency analysis techniques, the de-shape short time Fourier transform and the synchrosqueezing transform, were applied to extract the instantaneous physiological information from the PPG signal in a reliable way. Masinelli [26] proposed a spectral peak recovery algorithm for the pulsewave reconstruction of PPG signals, exploiting the local semiperiodicity of the pulsewave signal, together with the information about the cardiac rhythm provided by an available simultaneous ECG.
In the frequency domain, Temko [27] used Wiener filtering to filter the motion artifacts noise of the three-axis acceleration in motion, refined the estimated heart rate data through a phase vocoder, used linear regression for instance calibration, and finally performed the post-processing through a Viterbi decoder. Yang [28] applied an adaptive spectrum noise cancellation algorithm to estimate the heart rate data. However, the complicated operations made the algorithm not suitable for wearable systems. In the time domain, the AMPD-BL algorithm in [29], jointly integrating the AMPD [15] and Bayesian learning (BL) approaches, was used to estimate the heart rate data.
Considering the capabilities of the wearable device, this work adopts the AMPD-based scheme for heart rate monitoring. For the purpose of performance comparison, the AMPD-BL algorithm is used to explore the feasibility of the proposed AMPD-Fuzzy algorithm. To provide background on peak detection, the following subsection explores the characteristics of heartbeat signals and briefly describe the AMPD algorithm, considering the Laplacian distribution and the Bayesian learning scheme.
Table 1 depicts the performance comparison of existing and proposed systems, considering features and limitations of time-frequency analysis. Most of the existing methods applied pre/post-processing techniques to remove noise interference to recover the signal peak, which may lead to limitations and challenges ranging from device architecture, time consumption, and computational operations to data acquisition methods. In contrast, the proposed AMPD-Fuzzy is able to perform noise filtering, adaptive parameter setting, and real-time heart rate monitoring, which achieves heart rate monitoring for wearable healthcare devices with a low intensity activity.
2.5. Background-AMPD Schemes
This section introduces the background information, including on the AMPD and Bayesian learning (BL) approaches.
2.5.1. Heart Rate Detection
The standard unit for calculating heart rate is beats per minute (BPM). With the duration of 60 s, one alternative for calculating the BPM is to divide 60 by the timestamp difference of two adjacent detected peaks, , as described in Equation (1). Thus, we reshape the problem to finding the timestamps of the detected peaks of the heartbeat signal as follows:
Note that the sampling period of the PPG signal is set to be 0.1 s. Similar to the operations of the AMPD algorithm, a window size (e.g., 15 samples) is used for the control of data blocks, considering the minimum detectable heart rate value 40 BPM. Accordingly, Equation (2) describes the relationship between the window size and the heart rate BPM, which yields:
where is the sample index difference of two adjacent detected peaks.
2.5.2. AMPD Algorithm
This subsection briefly introduces the AMPD algorithm, which aims to detect the peak positions in a heartbeat signal. Denote as a vector to record periodic or quasi-periodic peaks in a sampled signal, and let the moving window length be a tunable parameter to calculate the local maxima scalogram, where and is the ceiling function that rounds up z to an integer.
By comparing the neighboring samples in the moving window, we can determine whether is a local maximum, which suggests that with the varied scale k of the signal, we can detect the maximum PPG signal in different BPMs. Given , the operations of Equation (3) result in an k × N matrix M with element , as follows:
Afterwards, the probability of is given by dividing the sum of the elements in column i with L, which yields the probability that point i is the peak:
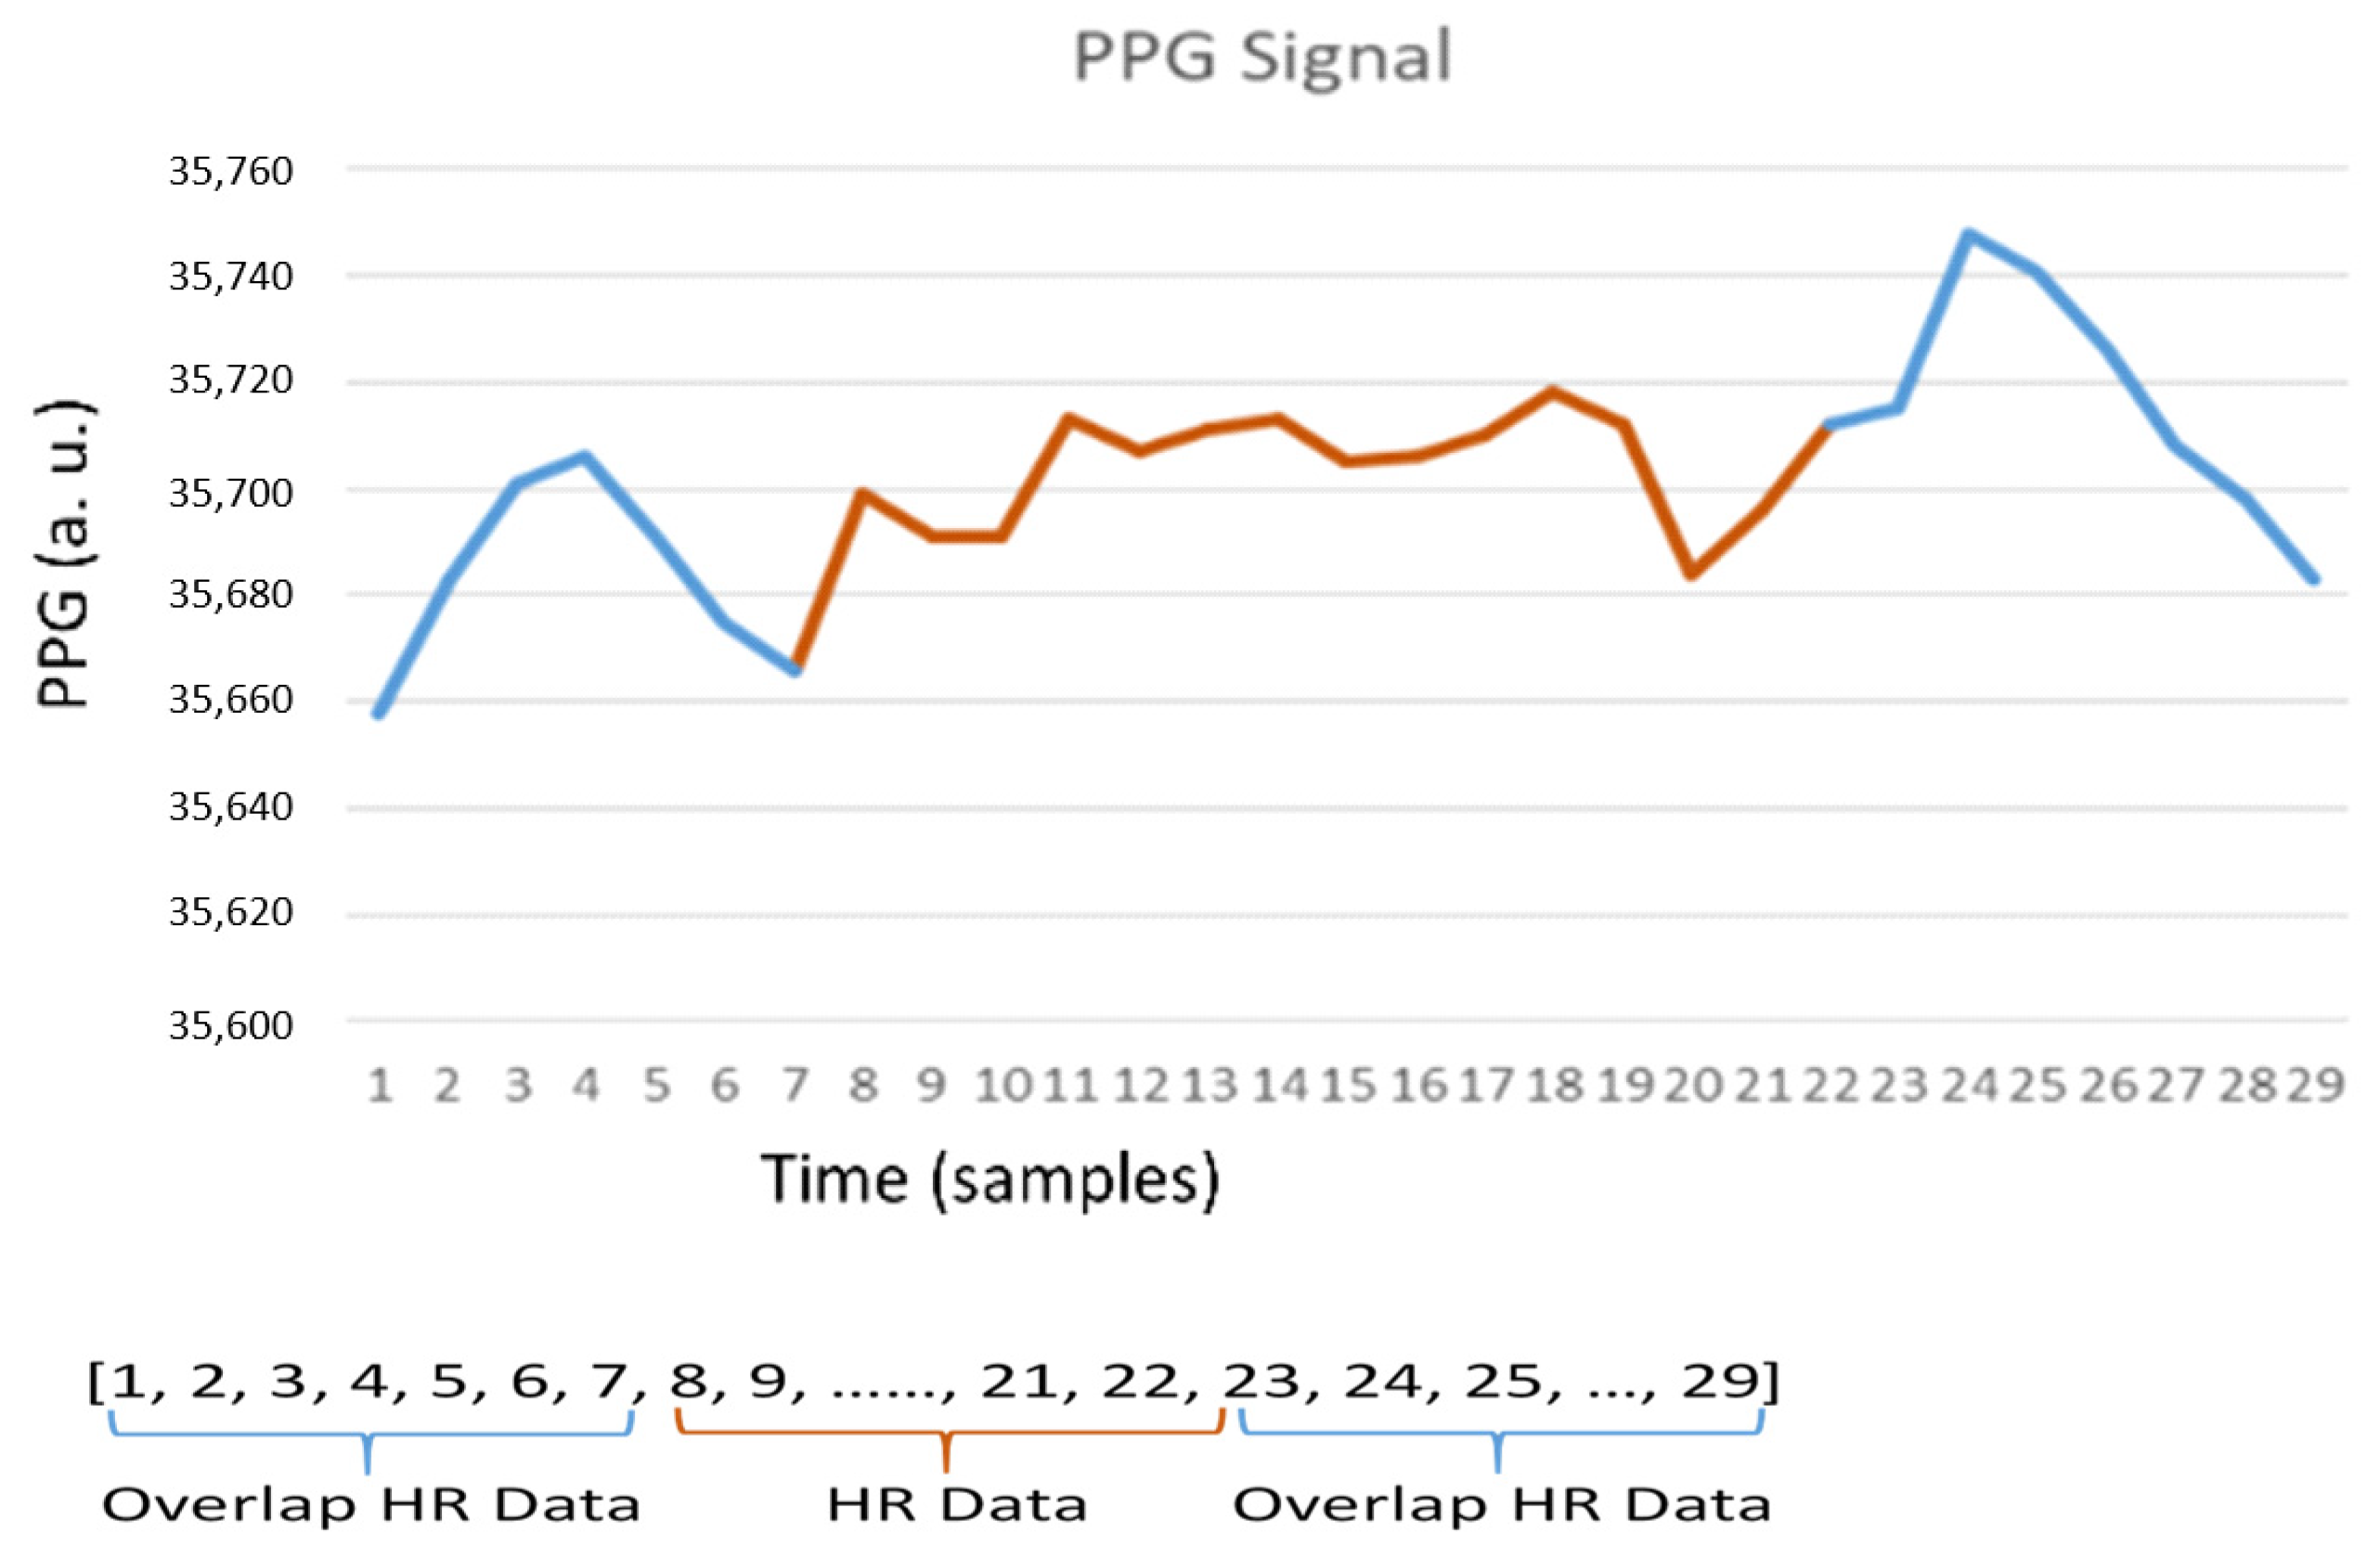
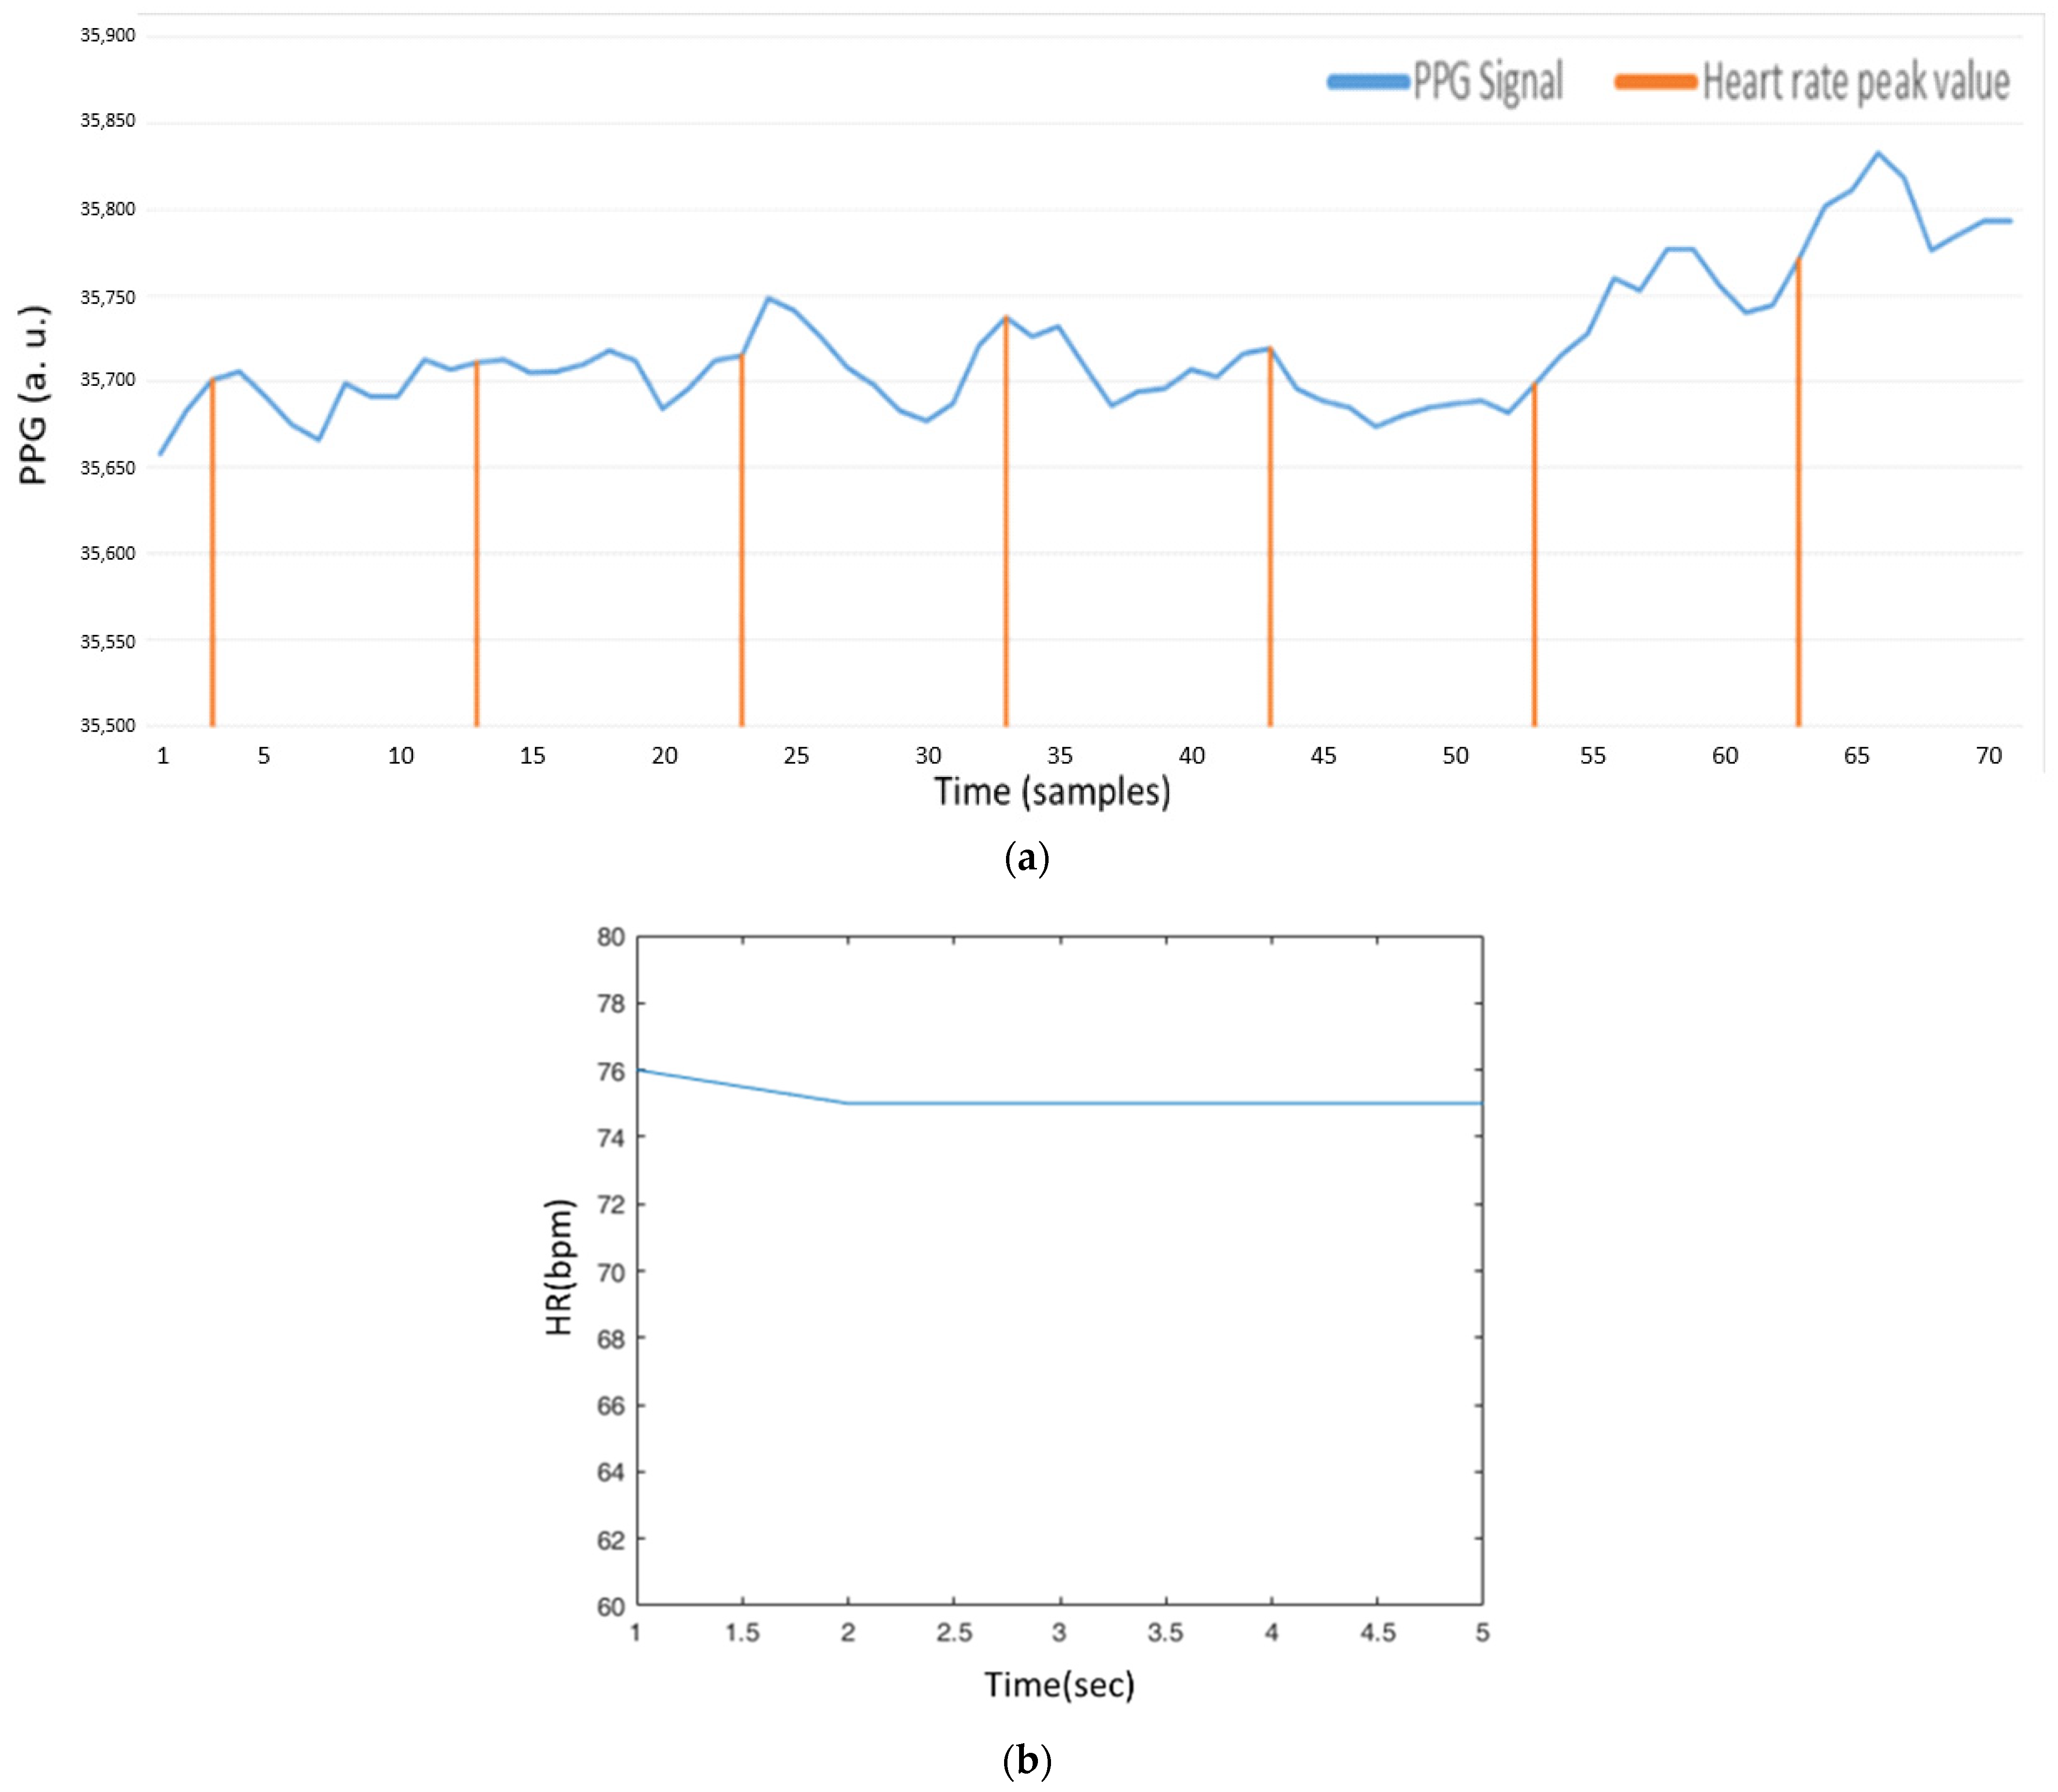
Figure 3 shows a PPG signal, which is further applied to form a signal vector for heart rate detection. Observe that the signal vector in the moving window consists of overlapping and non-overlapping peaks. Referring to the operations of Equation (3), the matrix M is calculated from the PPG signal vector. A typical example is shown in Equation (5), which provides a way to describe the relationship among the sample point i and its neighboring samples. Accordingly, based on the probability (Figure 4 (left)), an appropriate threshold can be determined for signal preprocessing. Equation (5) is calculated as follows:
2.5.3. Laplacian Distribution
Since a heartbeat is a periodic continuous-time signal, Quer [30] proved that the Laplacian model could be used to analyze the heart rate data for predicting the next peak of the signal. Denote as the mth instant of time corresponding to a heartbeat. The process is defined by the timestamp difference of two adjacent detected peaks, which is calculated as:
Moreover, define process d as the timestamp difference between consecutive peak intervals, which is:
Ismail [19] showed that the Laplacian model exhibited the best fit for analyzing the d process. Based on the analytical results, the probability density function is given by the following:
where , represents the difference between sample i and the last detected peak, represents the last recorded timestamp difference of two adjacent detected peaks from the last window cycle, μ is defined as the median, and the parameter b is:
where is the number of records of the process d. Note that in the PPG signal, we can reasonably let be zero. Since a heartbeat is periodic, this leads to a smaller value of b and a larger value of Figure 4 (right) shows the Laplacian probability of the PPG signal, as depicted in Figure 5. Observe that in Figure 4 (right), since a peak is detected in sample i = 4, the value turns to zero in sample i = 5. The calculation process is detailed in Section 3.
2.5.4. AMPD-BL Algorithm
With probabilities and , a probability value adjustment may be applied by a Bayesian learning approach, integrating the AMPD and Laplacian algorithms, to refine the possibility of sample point i for being a local peak. Assume that the probability of having a peak at sample i is , which can be initially calculated using Equation (9). Since the adjusted probability is related to the output of the AMPD (i.e., = 1 or 0) and the probability density function , the adjusted probability can be written as:
Alqaraawi [29] addressed that the Beta function can be used to model that initially considers the probability computed in Equation (8) as the expected value for this distribution, which is given by:
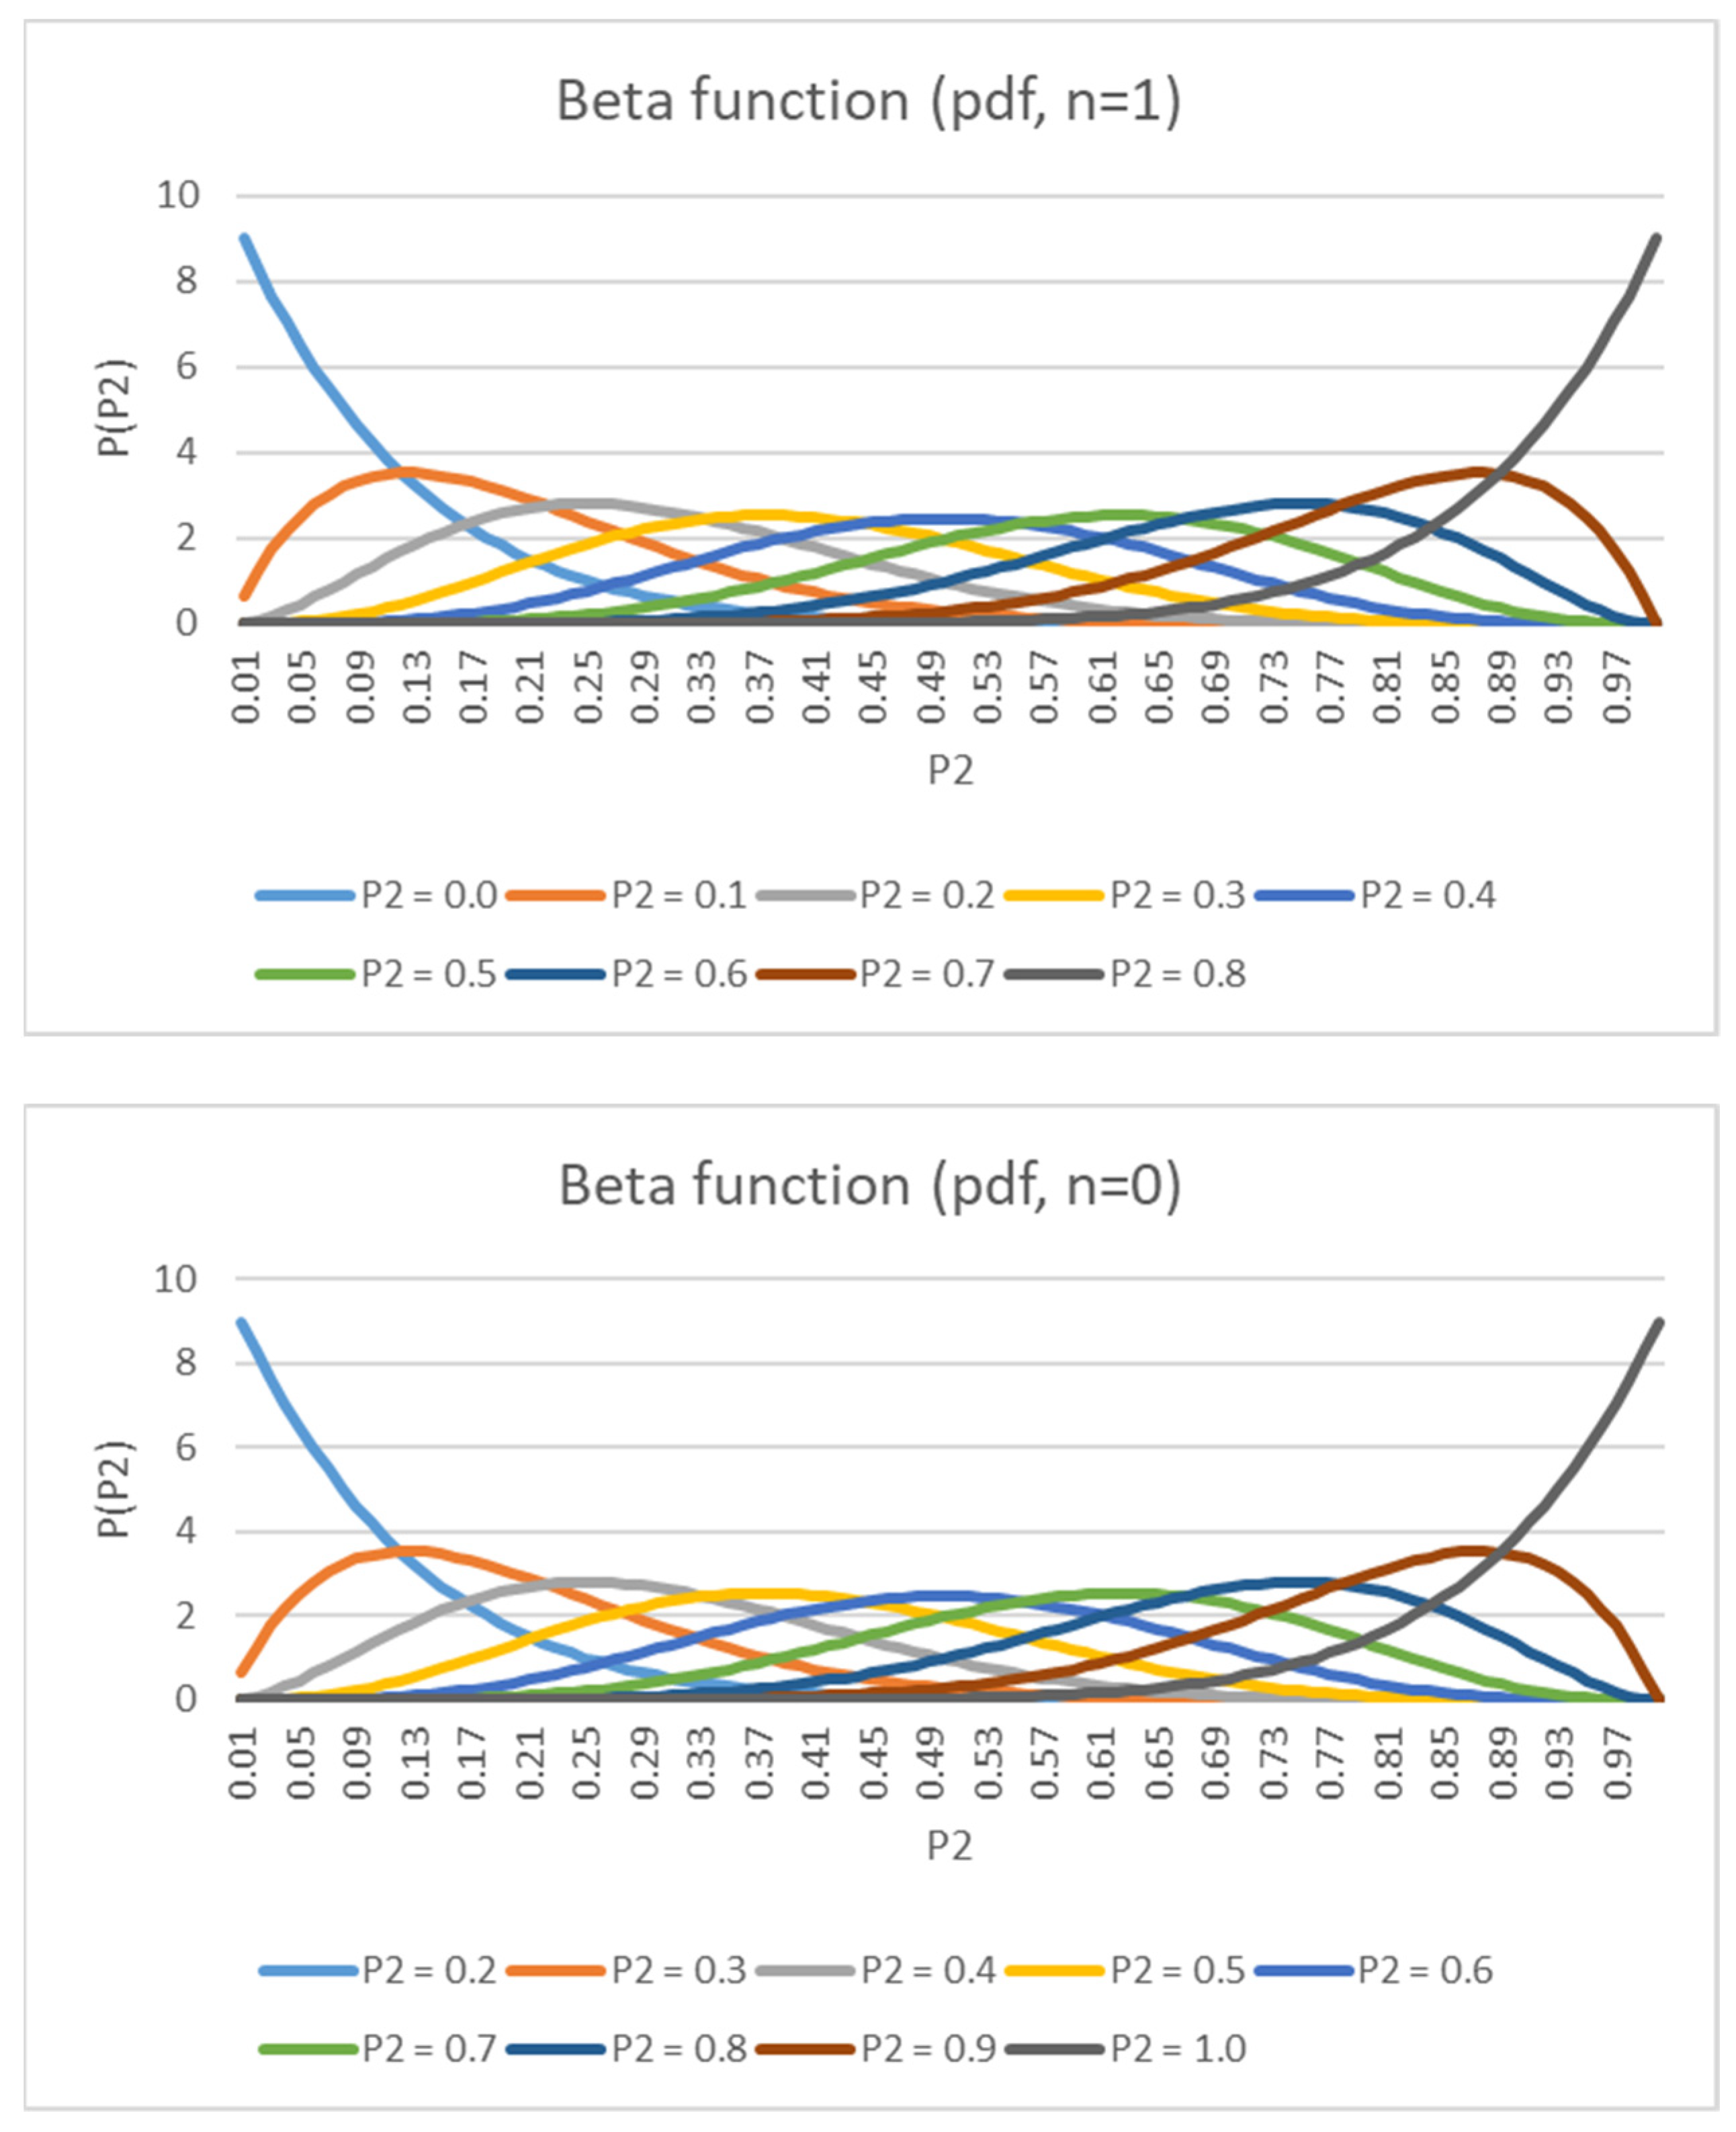
with , where the symbol Γ is Gamma function and is a normalized constant to ensure that the total probability integrates to 1. and are hyper-parameters that control the shape of the distribution. Assume that is a constant, and set the expectation value to be . Therefore, to obtain the desired parameters α and β for sample i, we have with . As shown in Figure 6, a small value of generates a positively skewed probability distribution and a gradually increasing value of generates a negatively skewed probability distribution. This output is consistent with the heartbeat signal.
Based on the threshold setting and the output of AMPD, can be further set to 1 and 0 (i.e., if is greater than the threshold, change it to 1; otherwise, change it to 0), which implies that the output of the AMPD can be considered as a Bernoulli experiment. Therefore, is given by:
Substituting Equations (11) and (12) into Equation (10) yields:
In Equation (13), as AMPD’s output equals to , let and , having the Beta distribution close to the negatively skewed probability distribution (i.e., sample i is close to the next expected peak). On the other hand, when AMPD’s output equals to , let and , having the Beta distribution close to the positively skewed probability distribution (i.e., sample i is close to the last detected peak). Accordingly, we integrate the adjusted probability from the threshold to 1 to obtain the probability of the peak , which is:
Note that the threshold is based on the AMPD output. Based on the above analysis, the peak position is determined by the index with the maximum value of the product of and for all samples within the index range of a window, which is given by:
2.5.5. Performance Discussion
Figure 8a shows the heart rate measurements by using a static fingertip. Observe that the thin skin on the fingers, which causes less interference, leads to good detection performance with the AMPD-BL approach. However, when measuring the PPG signal on the dynamic or static wrist (the symbol “b” in Figure 7), Figure 8b,c show the performance degradation due to the much larger effect of interference in wrist PPG measurement. As shown in Figure 8d, the peak values are calibrated to better positions with the AMPD-BL the symbol “c” in Figure 7, but a part of the peak values are missing or calibrated to the wrong positions. To resolve the above problem, this work aims to develop a novel joint algorithm, incorporating the concepts of automatic multiscale-based peak detection and fuzzy logic control, for adjusting the signal index range of overlap and performing offset calibration.
3. The Adaptive Heart Rate Detection System
This section describes the proposed AMPD-Fuzzy algorithm, incorporating the AMPD algorithm with fuzzy logic control. Due to the measurement interference of the wrist PPG signal (e.g., movement or swinging of the hand), a data processing operation is implemented. Moreover, since the heartbeat is a continuous instant signal, considerably reducing the calculations is essential for balancing the overall system computing time. The following subsections describe the design principles of the proposed AMPD-Fuzzy algorithm, including a window protocol, data processing, the fuzzy control mechanism, and the signal calibration. Figure 9 shows the block diagram of the proposed AMPD-Fuzzy algorithm.
3.1. Design of a Sliding Window Protocol
Based on the AMPD, the design of a sliding window protocol and the method of data overlap are developed. In the proposed scheme, the parameter L for sample comparison in Section 2.2 is set to 1, which means that sample only compares the previous and the next samples. Referring to the description of the AMPD in Section 2, if the sample is greater than the previous and the next samples, then the sample is compared with the entire vector such that the probability of for being a local maximum can be calculated (Equations (16) and (17)). In contrast, in order to reduce the data processing time, the probability of for being a local maximum is calculated only when the sample is larger than the previous and the next samples. Equations (16) and (17) are calculated as follows:
where Window_length = HR_data + HR_fuzzy.
Figure 10 shows that a window (previous HR_Fuzzy = 6, HR_Fuzzy = 8) consists of two parts: (1) the range of sample indices for HR_Data, including the range of sample indices determined by the previous HR_Fuzzy parameter, and the range of sample indices for heart rate samples, which is equal to a fixed size (e.g., 15 heart rate samples, ranging from to in Figure 10) and (2) the range of sample indices for latest heart rate samples (i.e., the updated HR_Fuzzy value). Accordingly, the window length is equal to the sum of the range of sample indices of HR_Data and the value of the HR_Fuzzy parameter, which makes the window length adaptive. Given the heart rate samples within a window, if sample is larger than the previous and the next samples, the heart rate samples (i.e., the heart rate samples within the sliding window) are applied to generate a signal vector for calculating .
Because of the characteristics of the sensor, the baseline level of a PPG signal is varied. Based on the above window structure, the value can be calculated for determining a peak position. The procedures of data processing and the selection of the HR_Fuzzy parameter are detailed in Section 4.2.
3.2. Principle of Signal Overlapping and Data Processing
Under normal circumstances, a peak rarely appears within the next few samples after detecting a peak. Hence, based on the sampling rate and the BPM, denote the parameter HR_Fuzzy as the range of sample indices that no peaks are detected. For example, if a patient’s current average heart rate is 60 bpm, it is rare for his/her average heart rate to jump to 100 bpm suddenly. Note that the peak interval of 60 bpm is 10 samples, and the peak interval of 100 bpm is 6 samples, which means that, as a peak is detected, a signal peak may not occur in the next 6 samples. Because of that, the sampled signals are overlapped and cascaded in the heart rate vector.
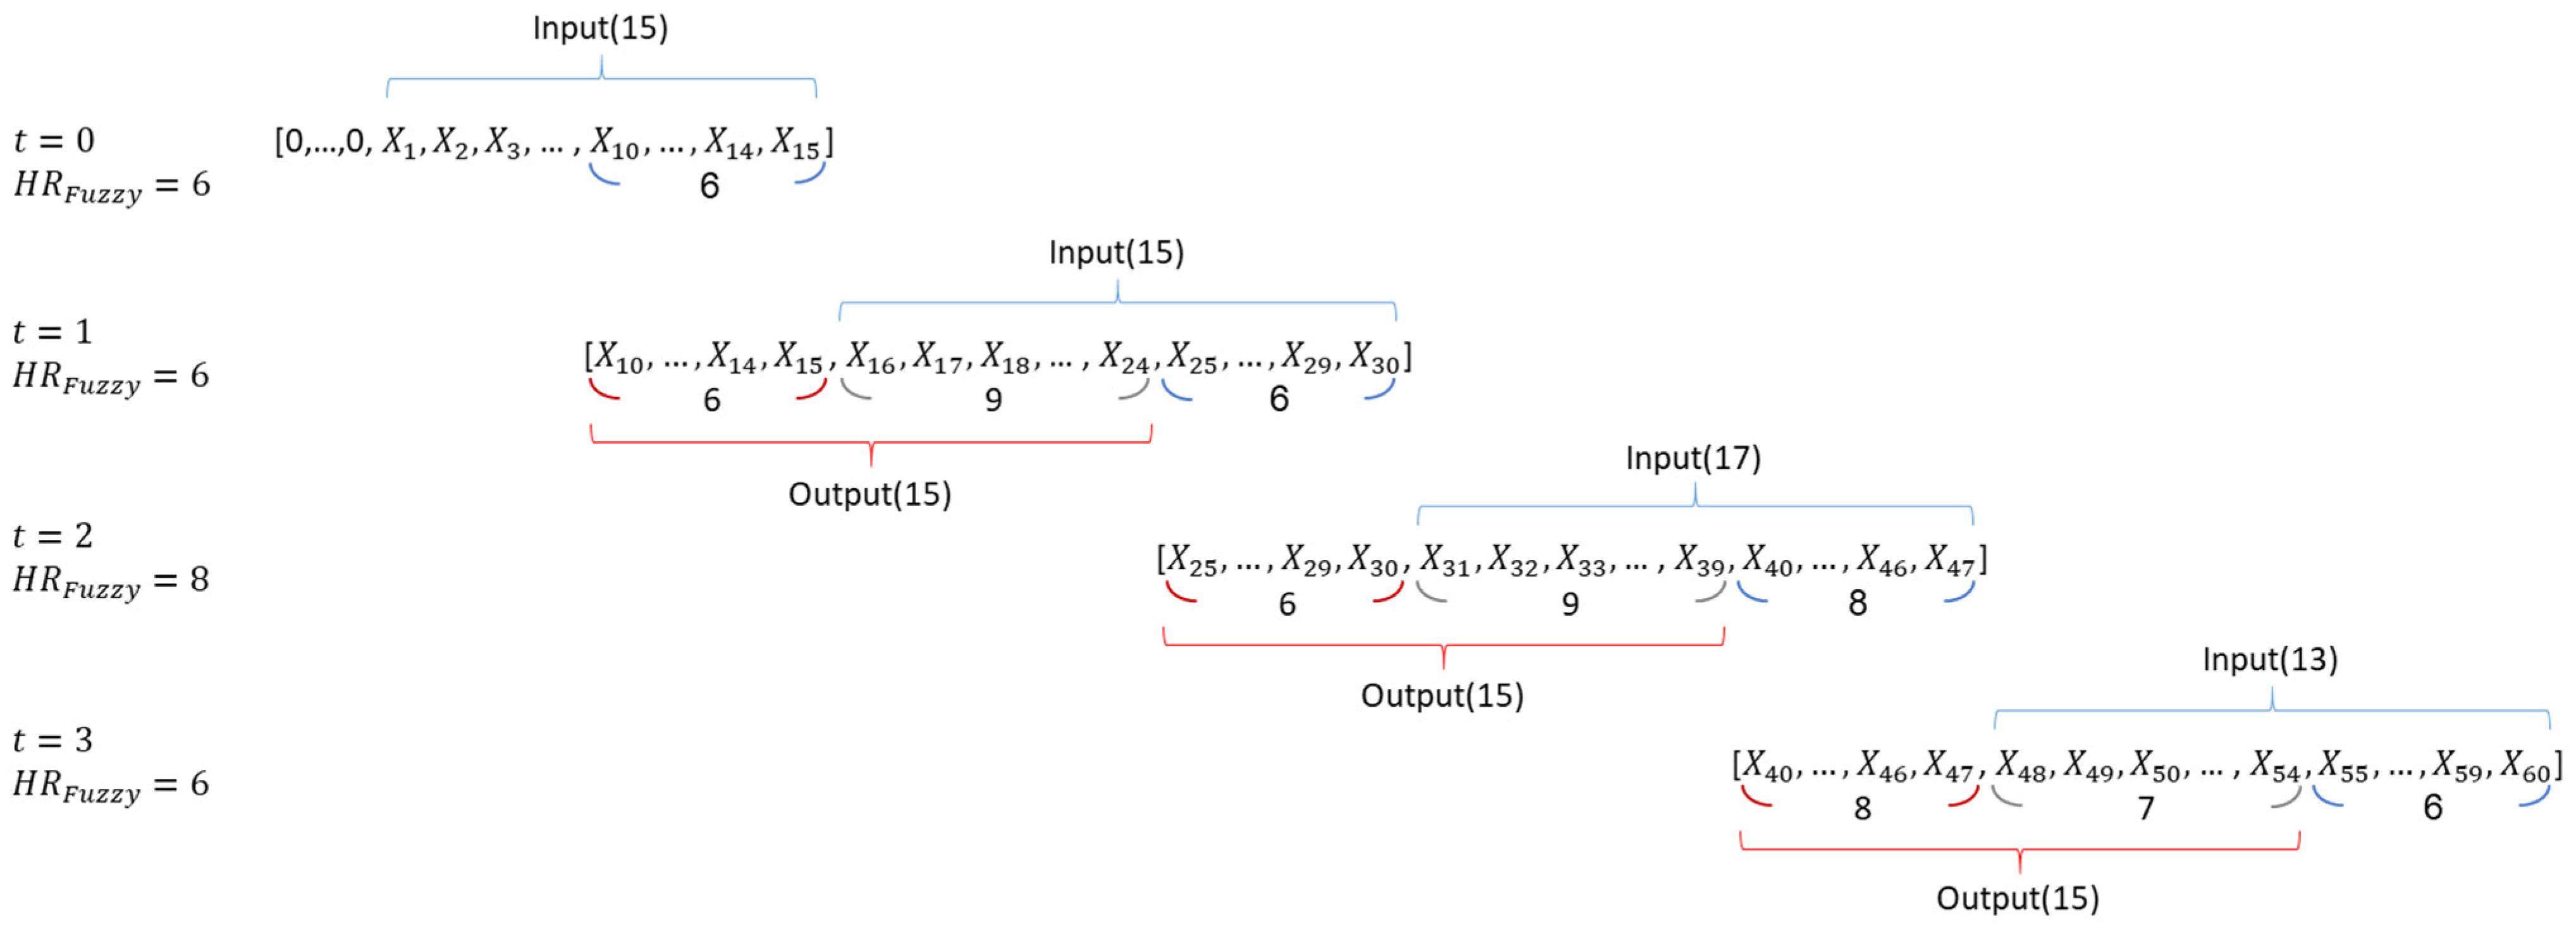
According to the above principle, Figure 11 shows a sequence diagram of signal overlapping and data processing with a heart rate vector. Observe that the samples in the output sub-window are applied for the calculation process (detailed in Section 3.4) and the samples in the input sub-window are used to determine the HR_Fuzzy data for the next window cycle.
Considering the HR_Fuzzy = 6, Figure 12 (left) shows the signal vector with the initial setting of the previous HR_Fuzzy samples zero. Similarly, Figure 12 (right) shows the second window with HR_Fuzzy = 6, where the first 6 samples of the heart rate vector are set to be the last 6 samples of the previous window cycle. After briefly describing the principle of signal overlapping, the fuzzy control mechanism for determining the value of the HR_Fuzzy parameter is presented in Section 3.3.
3.3. Fuzzy Control Mechanism
This section describes the fuzzy control logic for adaptively determining the value of the HR_Fuzzy parameter with two fuzzy inputs, the current heart rate and the trend of the heart rate.
3.3.1. Fuzzy Inputs
Fuzzy input 1 is based on the current heart rate, where the membership functions of different heart rate ranges are shown in Table 2. The classification criterion is based on the heart rate value calculated by the peak interval. Compared with a high heart rate (say, 120~140 bpm), a change of the peak interval causes an obvious change of the heartbeat with a low heart rate (say, 60~80 bpm), as shown in Figure 13 (left). Therefore, with a lower heart rate, the corresponding triangular membership function is narrower.
Fuzzy input 2 considers the heart rate tendency through the change of latest heart rates and the maximum difference of the previous k heart rates. Table 3 describes the relationship between heart rate and peak interval. Denote the Difference Ratio (DR) as the ratio of the change of latest heart rates, , to the maximum difference of the previous k heart rates, , which yields:
The membership function of the DR is depicted in Figure 13 (right).
3.3.2. Fuzzy Output
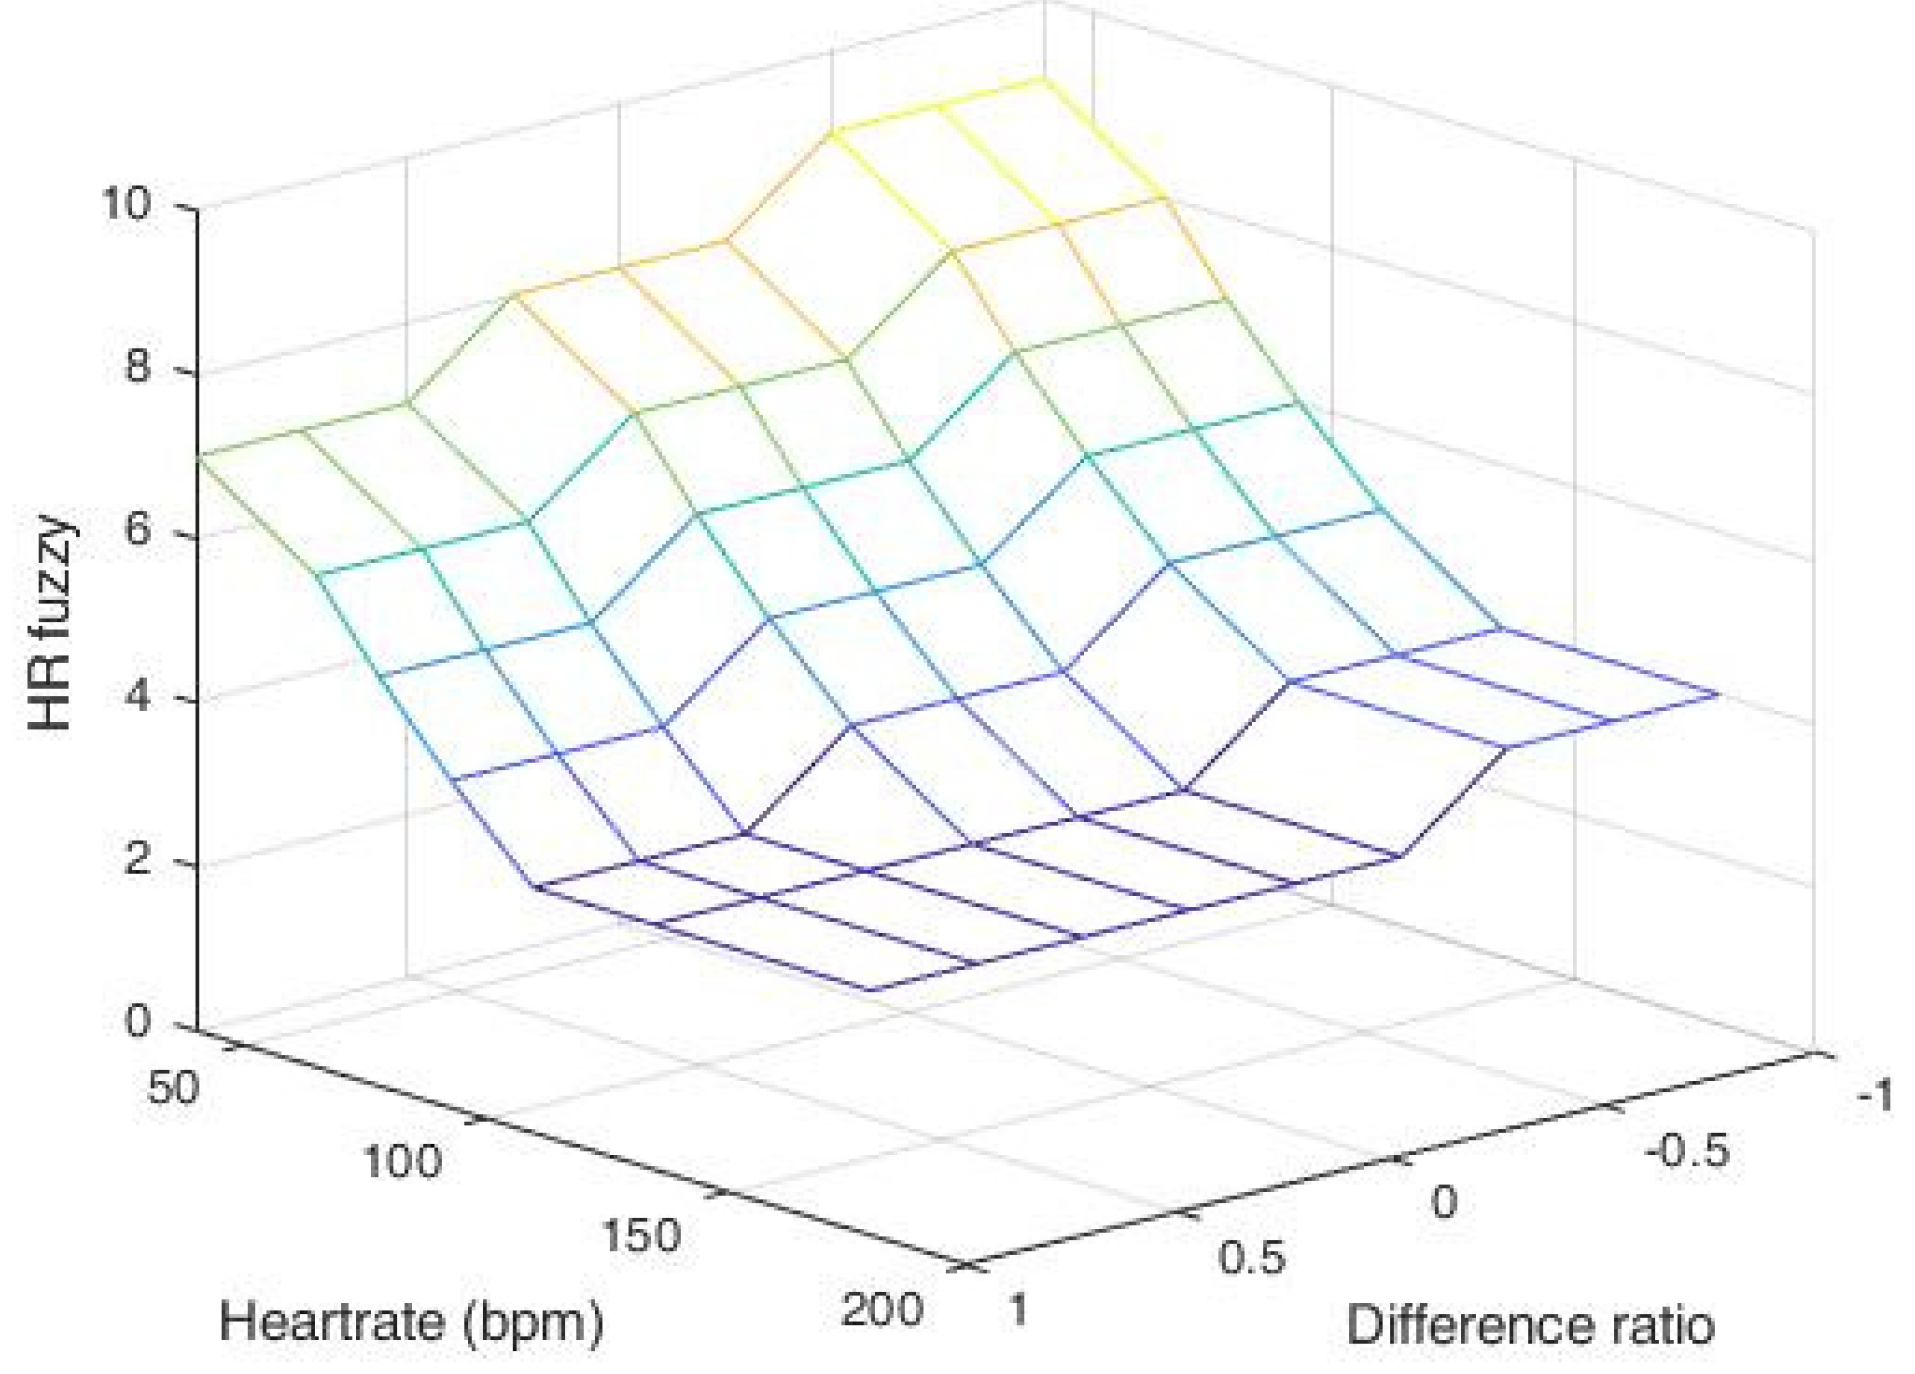
A fuzzy rule-based model is defined with fuzzy conditional statements. Table 4 summarizes the proposed fuzzy rule-based system to determine the value of the HR_Fuzzy, which is associated with 18 rules, considering heart rate and difference ratios (DR). Note that since the heart rate rarely jumps or drops 2 or more intervals in 1.5 s, a single-interval adjustment is performed for setting the value of the HR_Fuzzy. Figure 14 shows the output of the center of area (COA) defuzzification method.
3.4. Detection Threshold
Under the above circumstance, the threshold of is dynamically adjusted according to the current heartbeat value. Observe that although the baseline is varied, the peak value is set to be the local maximum sample of the heartbeat signal and the sample index difference from two adjacent peaks is at least the value of HR_Fuzzy. That is, the adjacent peaks are at least the value of HR_Fuzzy away in the sample index. Thus, the threshold is given by:
That is:
Through the characteristics of the peak, the peak value is larger than the previous and the next samples. Moreover, because the heartbeat value is examined in units of windows, it may make the first and last data incomparable. To solve this problem, we apply the parameter HR_Fuzzy to include part of the data in the previous window and process the HR_Data to increase the detection accuracy.
Accordingly, Equation (22) shows a new generated vector AMPD_Out, which completes the preprocessing procedure after sample comparison. As shown in Figure 15a, the desired heartbeat output vector is formed for detection.
Similar to the sliding window protocol in Section 3.1, the AMPD_Out vector consists of two parts: AMPD_Out[HR_Data] and AMPD_Out[HR_Fuzzy]. Note that the AMPD_Out[HR_Fuzzy] obtained in the first window cycle is applied to construct the AMPD_Out vector of the second window cycle. Figure 15b shows the AMPD_Out vector of the second window cycle with HR_Fuzzy = 8. The preprocessing and threshold determination procedures of the AMPD-Fuzzy are depicted in Algorithm 1.
| Algorithm 1. Comparison procedures of the AMPD-Fuzzy. |
|
3.5. Calibration and Detection
Referring to the description of Y and d processes in Section 2, the Laplacian analysis is summarized in Algorithm 2. Note that Laplacian distribution’s parameter b and the HR_Fuzzy parameter play key roles for describing the measurement characteristics and detection mechanism. Through these two parameters, the preprocessed vector AMPD_Out can be applied for further calibration. Note that the output vector in the current window cycle consists of two sub-vectors, the AMPD_Out[HR_Data] and the AMPD_Out[HR_Fuzzy], for the next processing window.
During the operation procedure, when AMPD_Out[i] = 1, the index of the sample i will be multiplied by the weight, , which can be derived by the Laplacian analysis in Algorithm 2. Similarly, weight the sampled signals with AMPD_Out = 1 and add them up. Then, divide this summed value by the sum of and use the round function to obtain a new index (Equation (23)). Since the calibration is a window-based operation, the peak position of the heartbeat may run into the index range of the sub-vector AMPD_Out [HR_Fuzzy], which carries this peak information to the next window cycle as the part of data overlap:
where A = , B = , and [ ] is a floor function.
Figure 16a shows of each sample point. With a new peak in , observe that when , the reduces to 0. Figure 16b shows a typical example AMPD_Out with HR_Fuzzy = 6. As shown in Figure 16c, since the noise has been filtered, samples are removed and sample is carried over into the AMPD[HR_Fuzzy] vector. Therefore, this peak will be considered and calibrated in the next cycle heart rate calculation with next HR_Fuzzy samples. Figure 16d shows that based on the next cycle of AMPD_Out, the previous calibrated AMPD_Out[HR_Fuzzy] will be used in the next cycle.
| Algorithm 2. Laplacian distribution procedure. |
|
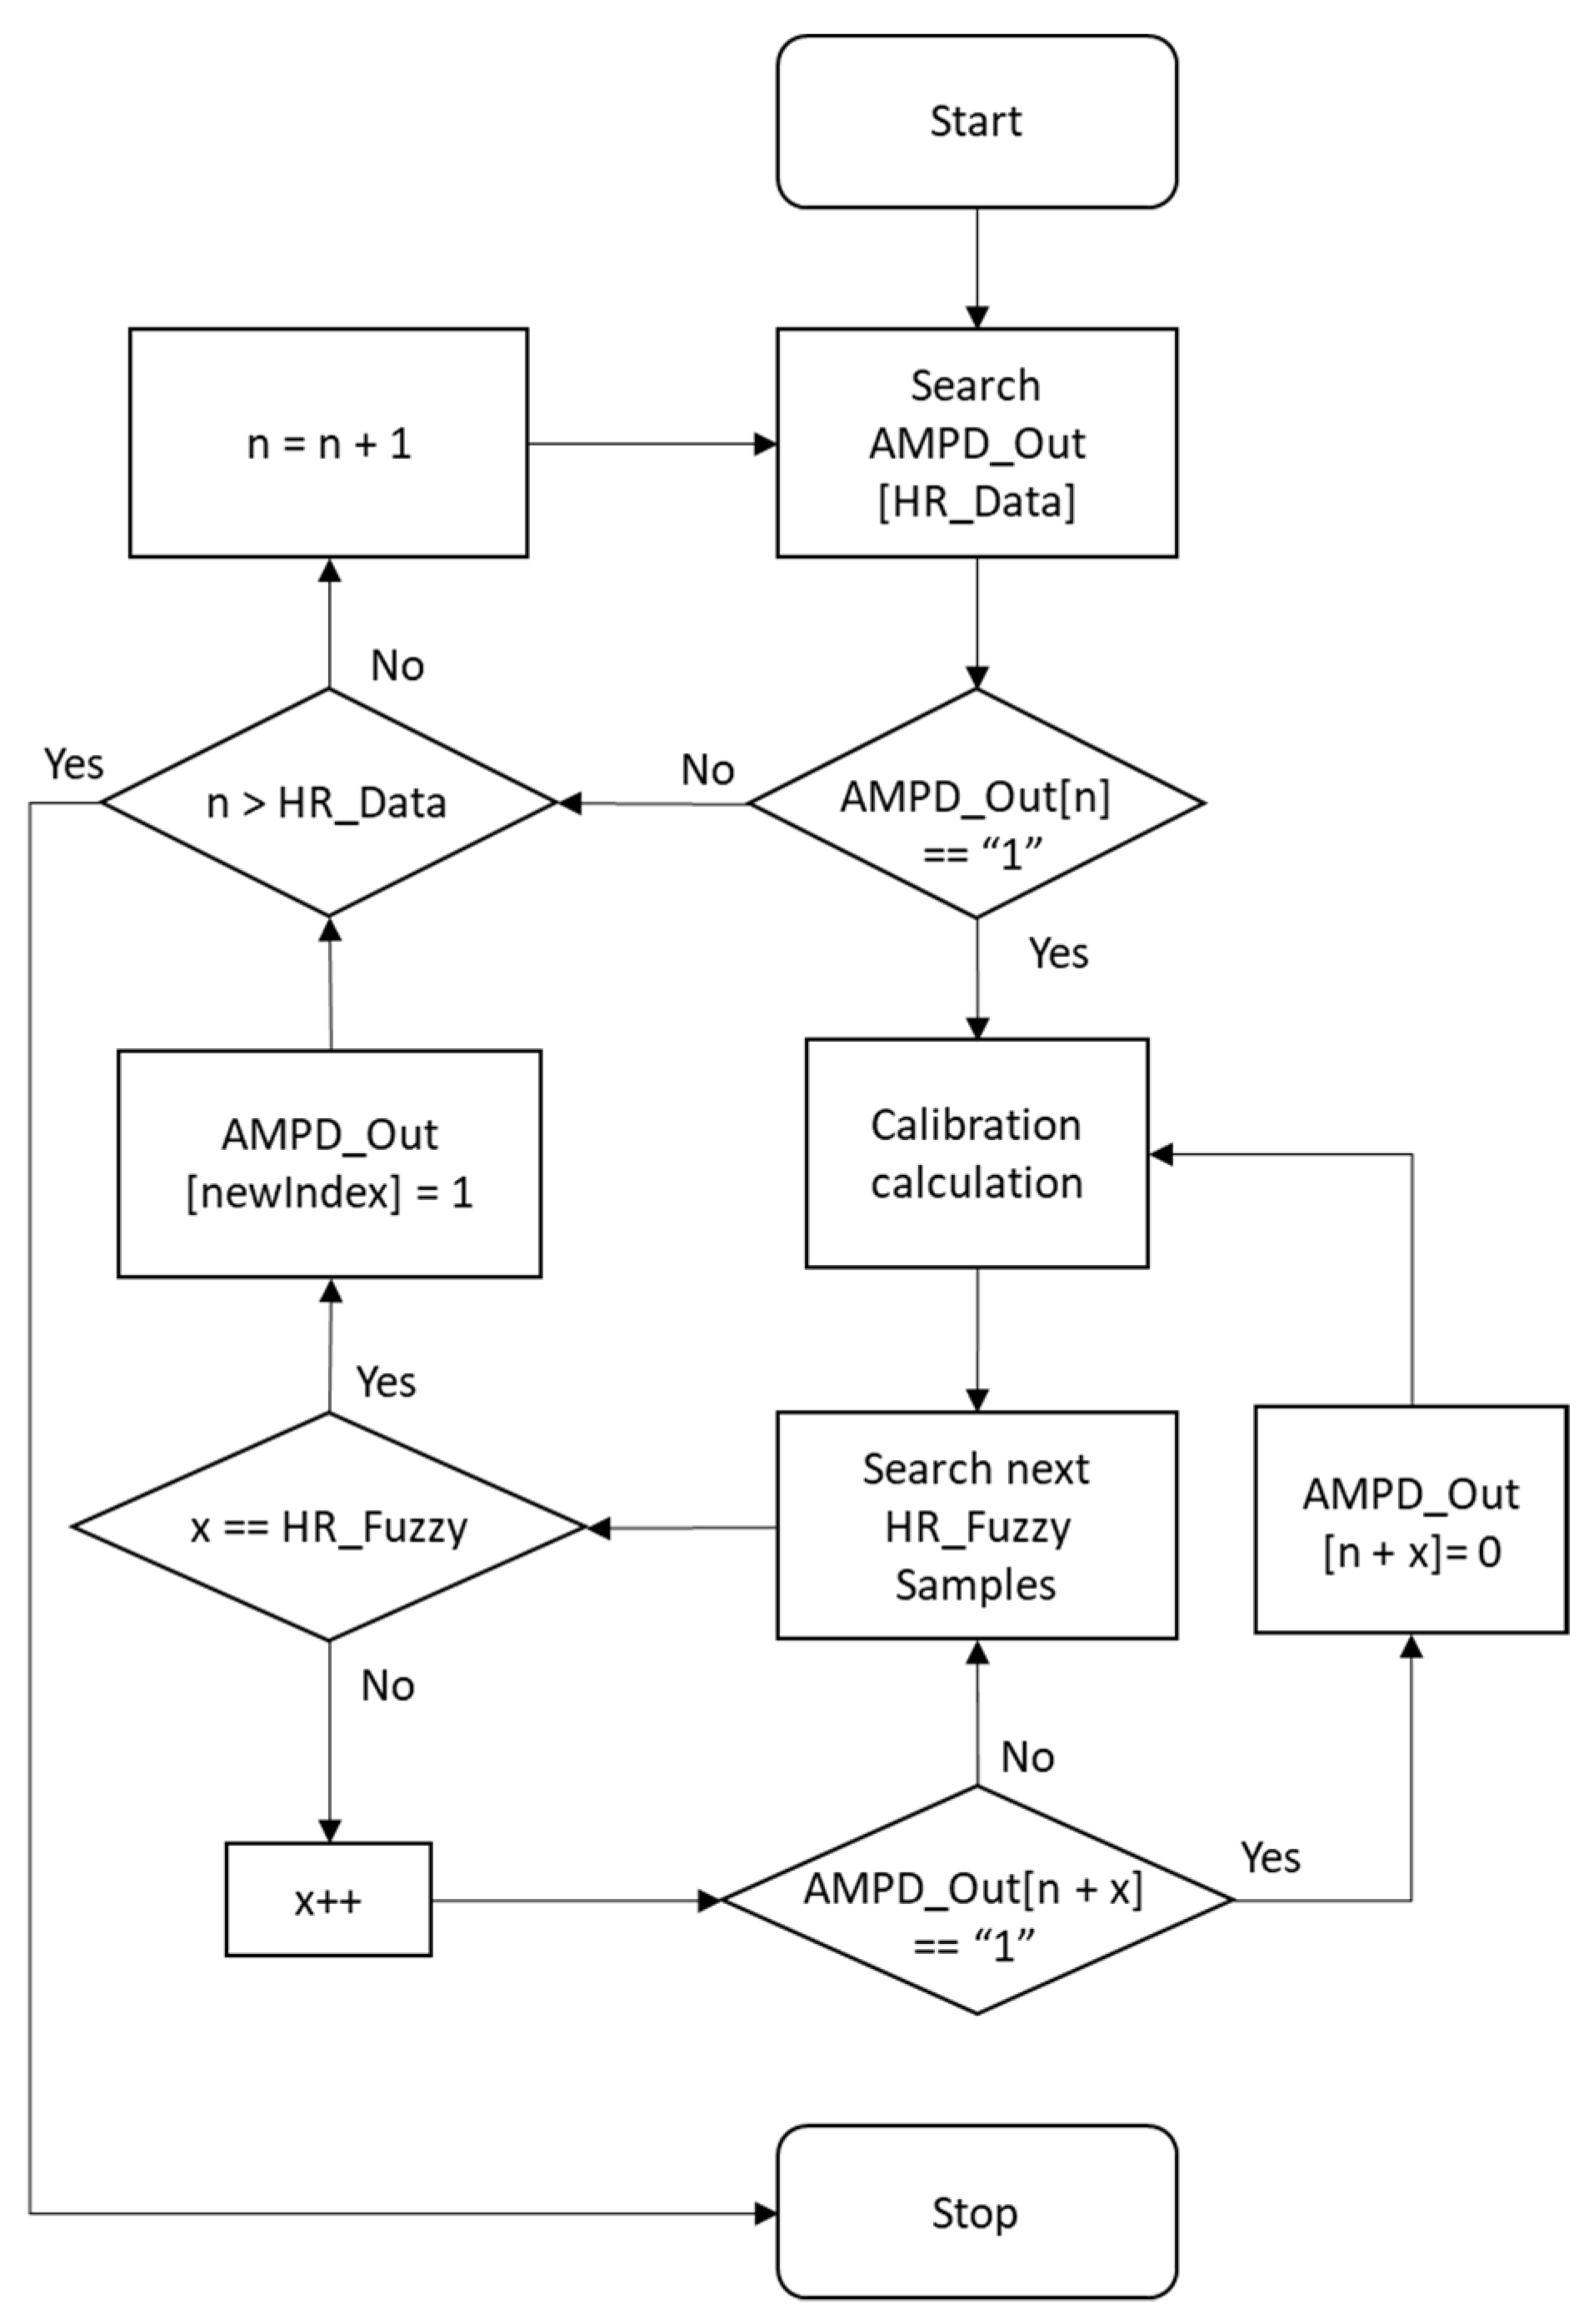
Figure 17 shows the flow chart of calibration, calibrating the AMPD_Out data within the range of HR_Data and then generating the heart rate of this cycle.
3.6. System Implementation
As shown in Figure 18, GY-521 (InvenSense Inc., San Jose, CA, USA) [32] is used for measuring human walking speed and Max30105 (SparkFun Electronics, Niwot, CL, USA) detects SpO2 and heart rate through red, green, and IR LED [33,34]. These sensors and components are integrated with a small device strapped to the patient’s wrist. Arduino delivers the processed date to a smartphone using Bluetooth (Figure 19a,b). The smartphone saves the data to SQLite and then uploads the rehabilitation information to a database through the Internet (Figure 19c). On the patient side, their rehabilitation history can be displayed on their smartphone. On the hospital side, patient’s rehabilitation procedures can be illustrated on the website.
4. Performance Evaluation
This section presents the system performance with the hardware and prototype described in Section 3.6. Three experiments are conducted to assess the system feasibility. Experiment 1 explores the preprocessing performance. Experiment 2 explores the performance of AMPD-BL tracking. Experiment 3 quantitatively analyzes the AMPD-BL, the AMPD-Fuzzy, and a referenced system [7]. As depicted in Section 2.2, for the AMPD-BL algorithm [20], the symbol “a” represents the preprocessing output, the symbol “b” represents the estimation output with Laplacian distribution, and the symbol “c” represents the final estimation output. For the AMPD-Fuzzy algorithm, the symbol “d” represents the preprocessing output, and the symbol “e” represents the final estimation output.
4.1. Experiment 1: Preprocessing
As shown in Figure 20a, it is the heartbeat signal detected on the wrist. In Figure 20b, red samples are the local maxima through AMPD-BL algorithm by threshold = 6/L with L = 7. As depicted in Figure 20c, when the threshold value decreases, the region of local maxima will increase. As shown in Figure 20d, red samples are the local maxima through the AMPD-Fuzzy algorithm with L = 1. Comparing Figure 20c,d, we can see that in the preprocessing phase, the difference between the results of these two algorithms is not obvious.
4.2. Experiment 2: AMPD-BL Tracking
This section describes the estimation performance of the AMPD-BL, which predicts the heartrate in three ways: Method 1 (Based on , use to adjust , Method 2 (Based on , determine whether the value is greater than the threshold), and Method 3 (Based on , apply Bayesian learning to derive ).
4.2.1. Method 1
After the preprocessing phase, the value of is used to mark the peak value of the local maximum, referring to the symbol “b” in Figure 7. As shown in Equation (24), we adjust according to the value of , and set a threshold to decide whether the local maximum sample is a peak value. Figure 21a shows the estimated peak values through this decision, where the peak positions seem to be periodic, but not at the peak positions of the PPG signal. As shown in Figure 21b, the heart rate value is about 75 bpm. This is because the previous few heart rates are 75 bpm, and the value for the next heart rate may be too high to be adjusted through . For the heart rate value about 83 bpm, Figure 22a,b show similar conditions, not at the peak positions of the PPG signal.
4.2.2. Method 2
The second method is based on AMPD, performed with . First, set the threshold of . If the value of is greater than ’s threshold, define this sample as a peak value. As shown in Figure 23a, in the entire PPG signal, only a peak value is detected, due to the measurement interference of the wrist PPG signal (e.g., movement or swinging of the hand). Consequently, if the threshold of is too high, most samples will be , which means there are fewer samples that can be calculated. In Figure 23b, set threshold to 2/L such that the number of the samples that greater than threshold increases. However, the irregular signal, appeared in the major parts of the PPG signal, will be ignored because the value of is too small.
4.2.3. Method 3
AMPD-BL calibrates the peak position with Bayesian learning approach. Since the probability values are multiplied with indices, they are more sensitive to the unstable heart rate. Figure 24a shows that in the sample 42, because of the change of the heart rate value, the peak value is changed as well. In addition, due to baseline changes, the subsequent peaks are lost. Figure 24b shows the peak sample through our AMPD-Fuzzy algorithm, in which it can be seen that the irregular signal appearing in the major parts of the PPG signal can also be applied to detects peaks and was calibrated to the estimation by using the previous heart rate signal.
4.3. Experiment 3: AMPD-Fuzzy Tracking
This subsection presents a performance comparison of the three tracking methods (i.e., AMPD-BL, AMPD-Fuzzy, and a referenced system) with respect to the placement of wearable sensors and the tracking errors. Two tests are conducted to assess the system feasibility and provide statistical analyses of the results. Test 1 compares the tracking performance of AMPD-BL and AMPD-Fuzzy on the static wrist. Test 2 explores the tracking error of AMPD-Fuzzy with respect to the referenced system. Note that the referenced heart rate is obtained by the heartbeat bracelet on the market [7] with the right wrist in the static manner. The left wrist is used to assess the tracking performance of AMPD-BL and AMPD-Fuzzy. The number of repetitions of Tests 1 and 2 for each method is 50. The tests are conducted by a man aged 24 years, of an average height, and a healthy weight.
For Test 1, Figure 25a,b show the AMPD-BL and AMPD-Fuzzy estimated heart rate data, respectively, on the static wrist. In these typical runs, the average heart rates of AMPD-BL, AMPD-Fuzzy, and the referenced system are 66.86 (bpm), 66.14 (bpm), and 65.86 (bpm), respectively. To further examine the monitoring behavior, Table 5 depicts the tracking errors in terms of the mean absolute error (MAE) and the root mean squared error (RMSE). The experimental result and the quantitative analysis imply that the estimation performance of AMPD-Fuzzy is superior to that of AMPD-BL.
For Test 2, Figure 26 shows the typical runs of AMPD-Fuzzy on the finger and AMPD-Fuzzy on the dynamic wrist. The round-trip time of a swing with wrist movement is about one second. For the finger placement (Figure 26a), the average heart rates of AMPD-Fuzzy (Finger) and the referenced system are 75.63 (bpm) and 74.82 (bpm), respectively. For the wrist placement (Figure 26b), the average heart rates of AMPD-Fuzzy (Dynamic Wrist) and the referenced system are 78.25 (bpm) and 79.25 (bpm), respectively. To characterize the performance, Table 6 depicts the deviations in terms of the mean absolute error (MAE) and the root mean squared error (RMSE). Figure 26a shows that AMPD-Fuzzy has a good tracking capability for estimating the heart rate on the finger. Moreover, even for estimating the heart rate on the dynamic wrist, Figure 26b shows that AMPD-Fuzzy still provides acceptable heart rate accuracy (<±10%) [35].
5. Conclusions
This paper proposes a new algorithm, the AMPD-Fuzzy algorithm, to monitor heart rate for wearable healthcare devices. To reshape the signal and specify the range of calibration, an adaptive fuzzy logic control mechanism is designed to determine the value of the HR_Fuzzy parameter for signal processing in the next window. With the proposed sliding window approach and the signal overlap processing principle, Experiment 2 shows that the noise interference and unstable heart rate measurements can be effectively preprocessed and calibrated on the static wrist. Compared to the tracking performance of a wearable monitor on the market, Experiment 3 illustrates that the proposed system is able to provide an acceptable error rate on the dynamic wrist, which may be used in research and clinical applications. Future issues will further explore preprocessing techniques, heart rate tracking schemes, and the design of system prototypes to improve the PPG signal quality and increase the accuracy of heart rate tracking.
Author Contributions
Conceptualization, T.-H.K. and C.-Y.W.; Data curation, C.-M.T.; Investigation, M.-F.W.; Methodology, T.-H.K. and C.-Y.W.; Software, T.-H.K. and C.-M.T.; Supervision, C.-Y.W. and M.-F.W.; Writing—original draft, T.-H.K. and C.-Y.W.; Writing—review and editing, C.-M.T. and M.-F.W. All authors have read and agreed to the published version of the manuscript.
Funding
This research was funded by the Ministry of Science and Technology of Taiwan under grant number MOST-110-2221-E-005-034 and by the “Innovation and Development Center of Sustainable Agriculture” from The Featured Areas Research Center Program within the framework of the Higher Education Sprout Project by the Ministry of Education (MOE) in Taiwan.
Data Availability Statement
The author at the Wireless and Communication Networking Laboratory, located at the Department of Electrical Engineering, National Chung Hsing University, Taiwan, was the subject of the experiments. The author consented to participate in this research study.
Acknowledgments
This research was funded by the Ministry of Science and Technology of Taiwan under grant number MOST-110-2221-E-005-034 and by the “Innovation and Development Center of Sustainable Agriculture” from The Featured Areas Research Center Program within the framework of the Higher Education Sprout Project by the Ministry of Education (MOE) in Taiwan. The authors would like to thank Hon-Son Don for his valuable suggestions for this manuscript.
Conflicts of Interest
The authors declare no conflict of interest.
References
- Rajala, S.; Lindholm, H.; Taipalus, T. Comparison of photoplethysmogram measured from wrist and finger and the effect of measurement location on pulse arrival time. Physiol. Meas. 2018, 39, 075010. [Google Scholar] [CrossRef]
- Esfahani, M.I.M.; Nussbaum, M.A. Preferred Placement and Usability of a Smart Textile System vs. Inertial Measurement Units for Activity Monitoring. Sensors 2018, 18, 2501. [Google Scholar] [CrossRef] [PubMed] [Green Version]
- Wu, M.-F.; Chen, C.-L.; Wen, C.-Y.; Hsu, J.-Y. Design of Pervasive Rehabilitation Monitoring for Chronic Obstructive Pulmonary Disease. IEEE Sens. J. 2013, 13, 4413–4422. [Google Scholar] [CrossRef]
- Wen, T.-M. Using Adaptive Fuzzy Control and Wearable Computing for COPD Rehabilitation. Master’s Thesis, National Chung Hsing University, Taichung, Taiwan, July 2016. [Google Scholar]
- Carlin, B.W. Pulmonary rehabilitation and chronic lung disease: Opportunities for the respiratory therapist. Respir. Care 2009, 54, 1091–1099. [Google Scholar] [PubMed]
- Casaburi, R. A brief history of pulmonary rehabilitation. Respir. Care 2008, 53, 1185–1189. [Google Scholar]
- Lifecare-10 Wearable Multi-Parameter Patient Monitor, North-Vision Tech. Inc. Available online: http://www.north-vision.com/html/front/bin/ptdetail.phtml?Part=pro-01-004&Category=377207 (accessed on 28 August 2021).
- Zhu, P.; Du, H.; Hou, X.; Lu, P.; Wang, L.; Huang, J.; Bai, N.; Wu, Z.; Fang, N.X.; Guo, C.F. Skin-electrode iontronic interface for mechanosensing. Nat. Commun. 2021, 12, 4731. [Google Scholar] [CrossRef]
- Haykin, S. Adaptive Filter Theory; Prentice Hall: Hoboken, NJ, USA, 2002. [Google Scholar]
- Chen, G.; Xie, W.; Zhao, Y. Wavelet-Based Denoising: A Brief Review. In Proceedings of the 2013 Fourth International Conference on Intelligent Control and Information Processing (ICICIP), Beijing, China, 9–11 June 2013; pp. 570–574. [Google Scholar]
- Stone, J.V. Independent Component Analysis: A Tutorial Introduction; MIT Press: Cambridge, MA, USA, 2004; ISBN 978-0-262-69315-8. [Google Scholar]
- Huang, N.E.; Shen, Z.; Long, S.R.; Wu, M.C.; Shih, H.H.; Zheng, Q.; Yen, N.-C.; Tung, C.C.; Liu, H.H. The empirical mode decomposition and the Hilbert spectrum for nonlinear and non-stationary time series analysis. Proc. R. Soc. Lond. 1998, 454, 903–995. [Google Scholar] [CrossRef]
- Civera, M.; Surace, C. A Comparative Analysis of Signal Decomposition Techniques for Structural Health Monitoring on an Experimental Benchmark. Sensors 2021, 21, 1825. [Google Scholar] [CrossRef] [PubMed]
- Chang, X.; Li, G.; Xing, G.; Zhu, K.; Tu, L. DeepHeart: A Deep Learning Approach for Accurate Heart Rate Estimation from PPG Signals. ACM Trans. Sens. Netw. 2021, 17, 14:1–14:18. [Google Scholar] [CrossRef]
- Scholkmann, F.; Boss, J.; Wolf, M. An efficient algorithm for automatic peak detection in noisy periodic and quasi-periodic signals. Algorithms 2012, 5, 588–603. [Google Scholar] [CrossRef] [Green Version]
- Castaneda, D.; Esparza, A.; Ghamari, M.; Soltanpur, C.; Nazeran, H. A review on wearable photoplethysmography sensors and their potential future applications in health care. Int. J. Biosens. Bioelectron. 2018, 4, 195–202. [Google Scholar] [CrossRef] [Green Version]
- Lee, Y.; Shin, H.; Jo, J.; Lee, Y.-K. Development of A Wristwatch-Type PPG Array Sensor Module. In Proceedings of the 2011 IEEE International Conference on Consumer Electronics-Berlin (ICCE-Berlin), Berlin, Germany, 6–8 September 2011; Volume 2011, pp. 168–171. [Google Scholar]
- Thomas, S.S.; Nathan, V.; Zong, C.; Soundarapandian, K.; Shi, X.; Jafari, R. BioWatch: A Noninvasive Wrist-Based Blood Pressure Monitor That Incorporates Training Techniques for Posture and Subject Variability. IEEE J. Biomed. Health Inform. 2015, 20, 1291–1300. [Google Scholar] [CrossRef]
- Ismail, S.; Akram, U.; Siddiqi, I. Heart rate tracking in photoplethysmography signals affected by motion artifacts: A review. EURASIP J. Adv. Signal Process. 2021, 2021, 5. [Google Scholar] [CrossRef]
- Zong, C.; Jafari, R. Robust heart rate estimation using wrist-based PPG signals in the presence of intense physical activities. In Proceedings of the 37th Annual International Conference of the IEEE Engineering in Medicine and Biology Society (EMBC), Milano, Italy, 25–29 August 2015. [Google Scholar] [CrossRef]
- Fine, J.; Branan, K.; Rodriguez, A.; Boonya-Ananta, T.; Ramella-Roman, J.; McShane, M.; Coté, G. Sources of Inaccuracy in Photoplethysmography for Continuous Cardiovascular Monitoring. Biosensors 2021, 11, 126. [Google Scholar] [CrossRef]
- Bent, B.; Goldstein, B.A.; Kibbe, W.A.; Dunn, J.P. Investigating sources of inaccuracy in wearable optical heart rate sensors. NPJ Digit. Med. 2020, 3, 18. [Google Scholar] [CrossRef] [PubMed] [Green Version]
- Biswas, D.; Everson, L.; Liu, M.; Panwar, M.; Verhoef, B.-E.; Patki, S.; Kim, C.H.; Acharyya, A.; Van Hoof, C.; Konijnenburg, M.; et al. CorNET: Deep Learning Framework for PPG-Based Heart Rate Estimation and Biometric Identification in Ambulant Environment. IEEE Trans. Biomed. Circuits Syst. 2019, 13, 282–291. [Google Scholar] [CrossRef]
- Reiss, A.; Indlekofer, I.; Schmidt, P.; Van Laerhoven, K. Deep PPG: Large-Scale Heart Rate Estimation with Convolutional Neural Networks. Sensors 2019, 19, 3079. [Google Scholar] [CrossRef] [PubMed] [Green Version]
- Cicone, A.; Wu, H.-T. How Nonlinear-Type Time-Frequency Analysis Can Help in Sensing Instantaneous Heart Rate and Instantaneous Respiratory Rate from Photoplethysmography in a Reliable Way. Front. Physiol. 2017, 8, 701. [Google Scholar] [CrossRef] [Green Version]
- Masinelli, G.; Dell’Agnola, F.; Valdés, A.; Atienza, D. SPARE: A Spectral Peak Recovery Algorithm for PPG Signals Pulsewave Reconstruction in Multimodal Wearable Devices. Sensors 2021, 21, 2725. [Google Scholar] [CrossRef]
- Temko, A. Accurate Heart Rate Monitoring During Physical Exercises Using PPG. IEEE Trans. Biomed. Eng. 2017, 64, 2016–2024. [Google Scholar] [CrossRef] [Green Version]
- Yang, D.; Cheng, Y.; Zhu, J.; Xue, D.; Abt, G.; Ye, H.; Peng, Y. A Novel Adaptive Spectrum Noise Cancellation Approach for Enhancing Heartbeat Rate Monitoring in a Wearable Device. IEEE Access 2018, 6, 8364–8375. [Google Scholar] [CrossRef]
- Alqaraawi, A.; Alwosheel, A.; Alasaad, A. Heart rate variability estimation in photoplethysmography signals using Bayesian learning approach. Healthc. Technol. Lett. 2016, 3, 136–142. [Google Scholar] [CrossRef] [PubMed] [Green Version]
- Quer, G.; Rao, R.R. A Bayesian model of heart rate to reveal real-time physiological information. In Proceedings of the 2012 IEEE 14th International Conference on e-Health Networking, Applications and Services (Healthcom), Beijing, China, 10–13 October 2012; pp. 223–229. [Google Scholar] [CrossRef]
- PDF of Beta Function. Available online: https://en.wikipedia.org/wiki/Beta_distribution (accessed on 28 August 2021).
- MPU6050 Datasheet. Available online: http://www.haoyuelectronics.com/Attachment/GY-521/mpu6050.pdf (accessed on 28 August 2021).
- SparkFun High-Sensitivity Optical Sensor for Smoke Detection Applications. Available online: https://cdn.sparkfun.com/assets/learn_tutorials/5/7/7/MAX30105_3.pdf (accessed on 28 August 2021).
- Taiwan IOT Studio. Available online: https://www.taiwaniot.com.tw/ (accessed on 28 August 2021).
- Nelson, B.W.; Allen, N.B. Accuracy of Consumer Wearable Heart Rate Measurement during an Ecologically Valid 24-Hour Period: Intraindividual Validation Study. JMIR Mhealth Uhealth 2019, 7, e10828. [Google Scholar] [CrossRef] [PubMed]
Figure 1.
Pulmonary rehabilitation: a biosensor module-based system (top left) [3]; an arm bag-based system (top right) [4]; the proposed wrist-based wearable system; the prototype (bottom left); and the system size (bottom right).

Figure 2.
(a) Photoplethysmography (PPG) Signal (Finger); (b) PPG Signal (Static wrist); (c) PPG Signal (Dynamic wrist); and (d) Estimated heart rate without preprocessing (Dynamic wrist). Note that the axis names for PPG signals and estimated HRs are (PPG (arbitrary unit) vs. Time (samples)) and (HR (bpm) vs. Time (s)), respectively.

Figure 3.
PPG signal vector.

Figure 4.
Probability (left); probability (right).

Figure 5.
Probability density function (PDF) of the Beta function [31].
Figure 5.
Probability density function (PDF) of the Beta function [31].

Figure 6.
PDF of posterior (n = 1) and PDF of posterior (n = 0).

Figure 7.
AMPD-BL block diagram.

Figure 8.
(a) Static fingertip PPG signal using the AMPD algorithm with Laplacian (Threshold = 4/L, L = 7); (b) Static wrist PPG signal using AMPD algorithm with Laplacian (Threshold = 4/L, L = 7); (c) Dynamic wrist PPG signal using AMPD algorithm with Laplacian (Threshold = 4/L, L = 7); (d) Static wrist PPG signal using AMPD–BL (Threshold = 3/L, L = 7).


Figure 9.
The block diagram of the AMPD-Fuzzy.

Figure 10.
A window structure for calculating .

Figure 11.
A sequence diagram of the heart rate vector.

Figure 12.
The first window (left); the second window with HR_Fuzzy = 6 (right).

Figure 13.
Membership functions of heart rate (left) and the difference ratio (right).

Figure 14.
Output of the HR_Fuzzy parameter with heart rate and difference ratio.

Figure 15.
(a) The first window cycle of AMPD_Out vector with HR_Fuzzy = 6; (b) The second window cycle of AMPD_Out vector. (HR_Fuzzy = 8).
Figure 15.
(a) The first window cycle of AMPD_Out vector with HR_Fuzzy = 6; (b) The second window cycle of AMPD_Out vector. (HR_Fuzzy = 8).

Figure 16.
(a) An example of of each sample point; (b) an example of a heart rate output vector; (c) an example of a calibrated heart rate output vector; (d) next cycle of heart rate output vector.
Figure 16.
(a) An example of of each sample point; (b) an example of a heart rate output vector; (c) an example of a calibrated heart rate output vector; (d) next cycle of heart rate output vector.

Figure 17.
Calibration flow chart.

Figure 18.
The system hardware and prototype.

Figure 19.
(a) The main control screen; (b) The rehabilitation history; (c) The pulmonary rehabilitation history (SQL).
Figure 19.
(a) The main control screen; (b) The rehabilitation history; (c) The pulmonary rehabilitation history (SQL).

Figure 20.
(a) PPG signal on the wrist; (b) Local maxima of a PPG signal with AMPD-BL algorithm (AMPD Threshold =, L = 7); (c) Local maxima of a PPG signal with AMPD-BL algorithm (AMPD Threshold =, L = 7); (d) Local maxima of a PPG signal with AMPD-Fuzzy (L = 1).
Figure 20.
(a) PPG signal on the wrist; (b) Local maxima of a PPG signal with AMPD-BL algorithm (AMPD Threshold =, L = 7); (c) Local maxima of a PPG signal with AMPD-BL algorithm (AMPD Threshold =, L = 7); (d) Local maxima of a PPG signal with AMPD-Fuzzy (L = 1).


Figure 21.
(a) AMPD algorithm with Laplacian (AMPD Threshold =, L = 7); (b) Heart rate signal (AMPD Threshold =, L = 7).
Figure 21.
(a) AMPD algorithm with Laplacian (AMPD Threshold =, L = 7); (b) Heart rate signal (AMPD Threshold =, L = 7).

Figure 22.
(a) AMPD algorithm based on Laplacian (AMPD Threshold =, L = 7); (b) Heart rate signal (AMPD Threshold =, L = 7).
Figure 22.
(a) AMPD algorithm based on Laplacian (AMPD Threshold =, L = 7); (b) Heart rate signal (AMPD Threshold =, L = 7).

Figure 23.
(a) AMPD algorithm with Laplacian (AMPD Threshold =, L = 7); (b) AMPD algorithm with Laplacian (AMPD Threshold =, L = 7).
Figure 23.
(a) AMPD algorithm with Laplacian (AMPD Threshold =, L = 7); (b) AMPD algorithm with Laplacian (AMPD Threshold =, L = 7).

Figure 24.
(a) PPG signal with AMPD-BL (Threshold =, L = 7); (b) PPG signal with AMPD-Fuzzy.

Figure 25.
(a) A typical run of the estimated heart rate on the static wrist with AMPD-BL; (b) A typical run of the estimated heart rate on the static wrist with AMPD-Fuzzy.
Figure 25.
(a) A typical run of the estimated heart rate on the static wrist with AMPD-BL; (b) A typical run of the estimated heart rate on the static wrist with AMPD-Fuzzy.

Figure 26.
(a) Estimated heart rate on the finger with AMPD-Fuzzy; (b) Estimated heart rate on the dynamic wrist with AMPD-Fuzzy.
Figure 26.
(a) Estimated heart rate on the finger with AMPD-Fuzzy; (b) Estimated heart rate on the dynamic wrist with AMPD-Fuzzy.


Table 1.
The performance comparison: features and limitations.
| Methods | Features | Limitations |
|---|---|---|
| Masinelli [26] |
|
|
| Temko [27] |
|
|
| Yang [28] |
|
|
| AMPD-BL [29] |
|
|
| Proposed AMPD-Fuzzy | For a low intensity activity, the proposed algorithm achieves:
| For an intensive exercise, a large variation of heart rate prediction is observed |
Table 2.
The range of each membership function for input 1.
| Heart Rate Range | Min | Max |
|---|---|---|
| ‘Trapezoid’, [0 0 60 70] | 0 | 65 |
| ‘Triangle’, [60 70 85] | 65 | 77.5 |
| ‘Triangle’, [70 85 100] | 77.5 | 92.5 |
| ‘Triangle’, [85 100 120] | 92.5 | 110 |
| ‘Triangle’, [100 120 150] | 110 | 135 |
| ‘Trapezoid’, [130 150 180 180] | 135 | 180 |
Table 3.
The heart rate vs. peak interval.
| Peak Interval (the Range of Sample Indices) | Heart Rate (bpm) |
|---|---|
| 10 | 60 |
| 9 | 66.6 |
| 8 | 75 |
| 7 | 85.7 |
| 6 | 100 |
| 5 | 120 |
| 4 | 150 |
| 3 | 200 |
Table 4.
A fuzzy rule-based model.
| DR | Down | Maintain | Up | |
|---|---|---|---|---|
| HR | ||||
| Very slow | 9 | 8 | 7 | |
| Slow | 8 | 7 | 6 | |
| General | 7 | 6 | 5 | |
| General fast | 6 | 5 | 4 | |
| Fast | 5 | 4 | 3 | |
| Very Fast | 4 | 3 | 3 | |
Table 5.
The tracking errors on the static wrist.
| Methods | Avg. MAE (bpm) | Avg. RMSE (bpm) |
|---|---|---|
| AMPD-BL | 3.00 | 3.91 |
| AMPD-Fuzzy | 0.29 | 0.76 |
Table 6.
The tracking errors of AMPD-Fuzzy.
| Methods | Avg. MAE (bpm) | Avg. RMSE (bpm) |
|---|---|---|
| AMPD-Fuzzy (Finger) | 0.82 | 0.90 |
| AMPD-Fuzzy (Dynamic Wrist) | 6.83 | 8.05 |
Publisher’s Note: MDPI stays neutral with regard to jurisdictional claims in published maps and institutional affiliations. |
© 2021 by the authors. Licensee MDPI, Basel, Switzerland. This article is an open access article distributed under the terms and conditions of the Creative Commons Attribution (CC BY) license (https://creativecommons.org/licenses/by/4.0/).
Share and Cite
MDPI and ACS Style
Kuo, T.-H.; Teng, C.-M.; Wu, M.-F.; Wen, C.-Y. An Adaptive Heart Rate Monitoring Algorithm for Wearable Healthcare Devices. Electronics 2021, 10, 2092. https://doi.org/10.3390/electronics10172092
AMA Style
Kuo T-H, Teng C-M, Wu M-F, Wen C-Y. An Adaptive Heart Rate Monitoring Algorithm for Wearable Healthcare Devices. Electronics. 2021; 10(17):2092. https://doi.org/10.3390/electronics10172092
Chicago/Turabian StyleKuo, Tz-Hau, Chi-Min Teng, Ming-Feng Wu, and Chih-Yu Wen. 2021. "An Adaptive Heart Rate Monitoring Algorithm for Wearable Healthcare Devices" Electronics 10, no. 17: 2092. https://doi.org/10.3390/electronics10172092
Note that from the first issue of 2016, this journal uses article numbers instead of page numbers. See further details here.