
Grid Operation Assessment under a Specific EV Chargers Deployment Plan in the City of Heraklion

 ,
,  , , and
Abstract
:1. Introduction
2. Case Study Description
2.1. Electric Vehicle Charger Types
- Mode 1 (AC charging) in which the vehicle is connected to the power grid through standard socket outlets present in residences.
- Mode 2 (AC charging via a single-phase or three-phase network) in which the vehicle is connected to the main power grid via household socket outlets with a cable-incorporated protection device.
- Mode 3 (AC charging) in which the vehicle connects directly to the electrical network via specific socket and a dedicated circuit
- Mode 4 (DC charging) in which the electric vehicle is connected to the main power grid through an external charger.
2.2. Power System of the Island of Crete and Distribution Grid of the City of Heraklion
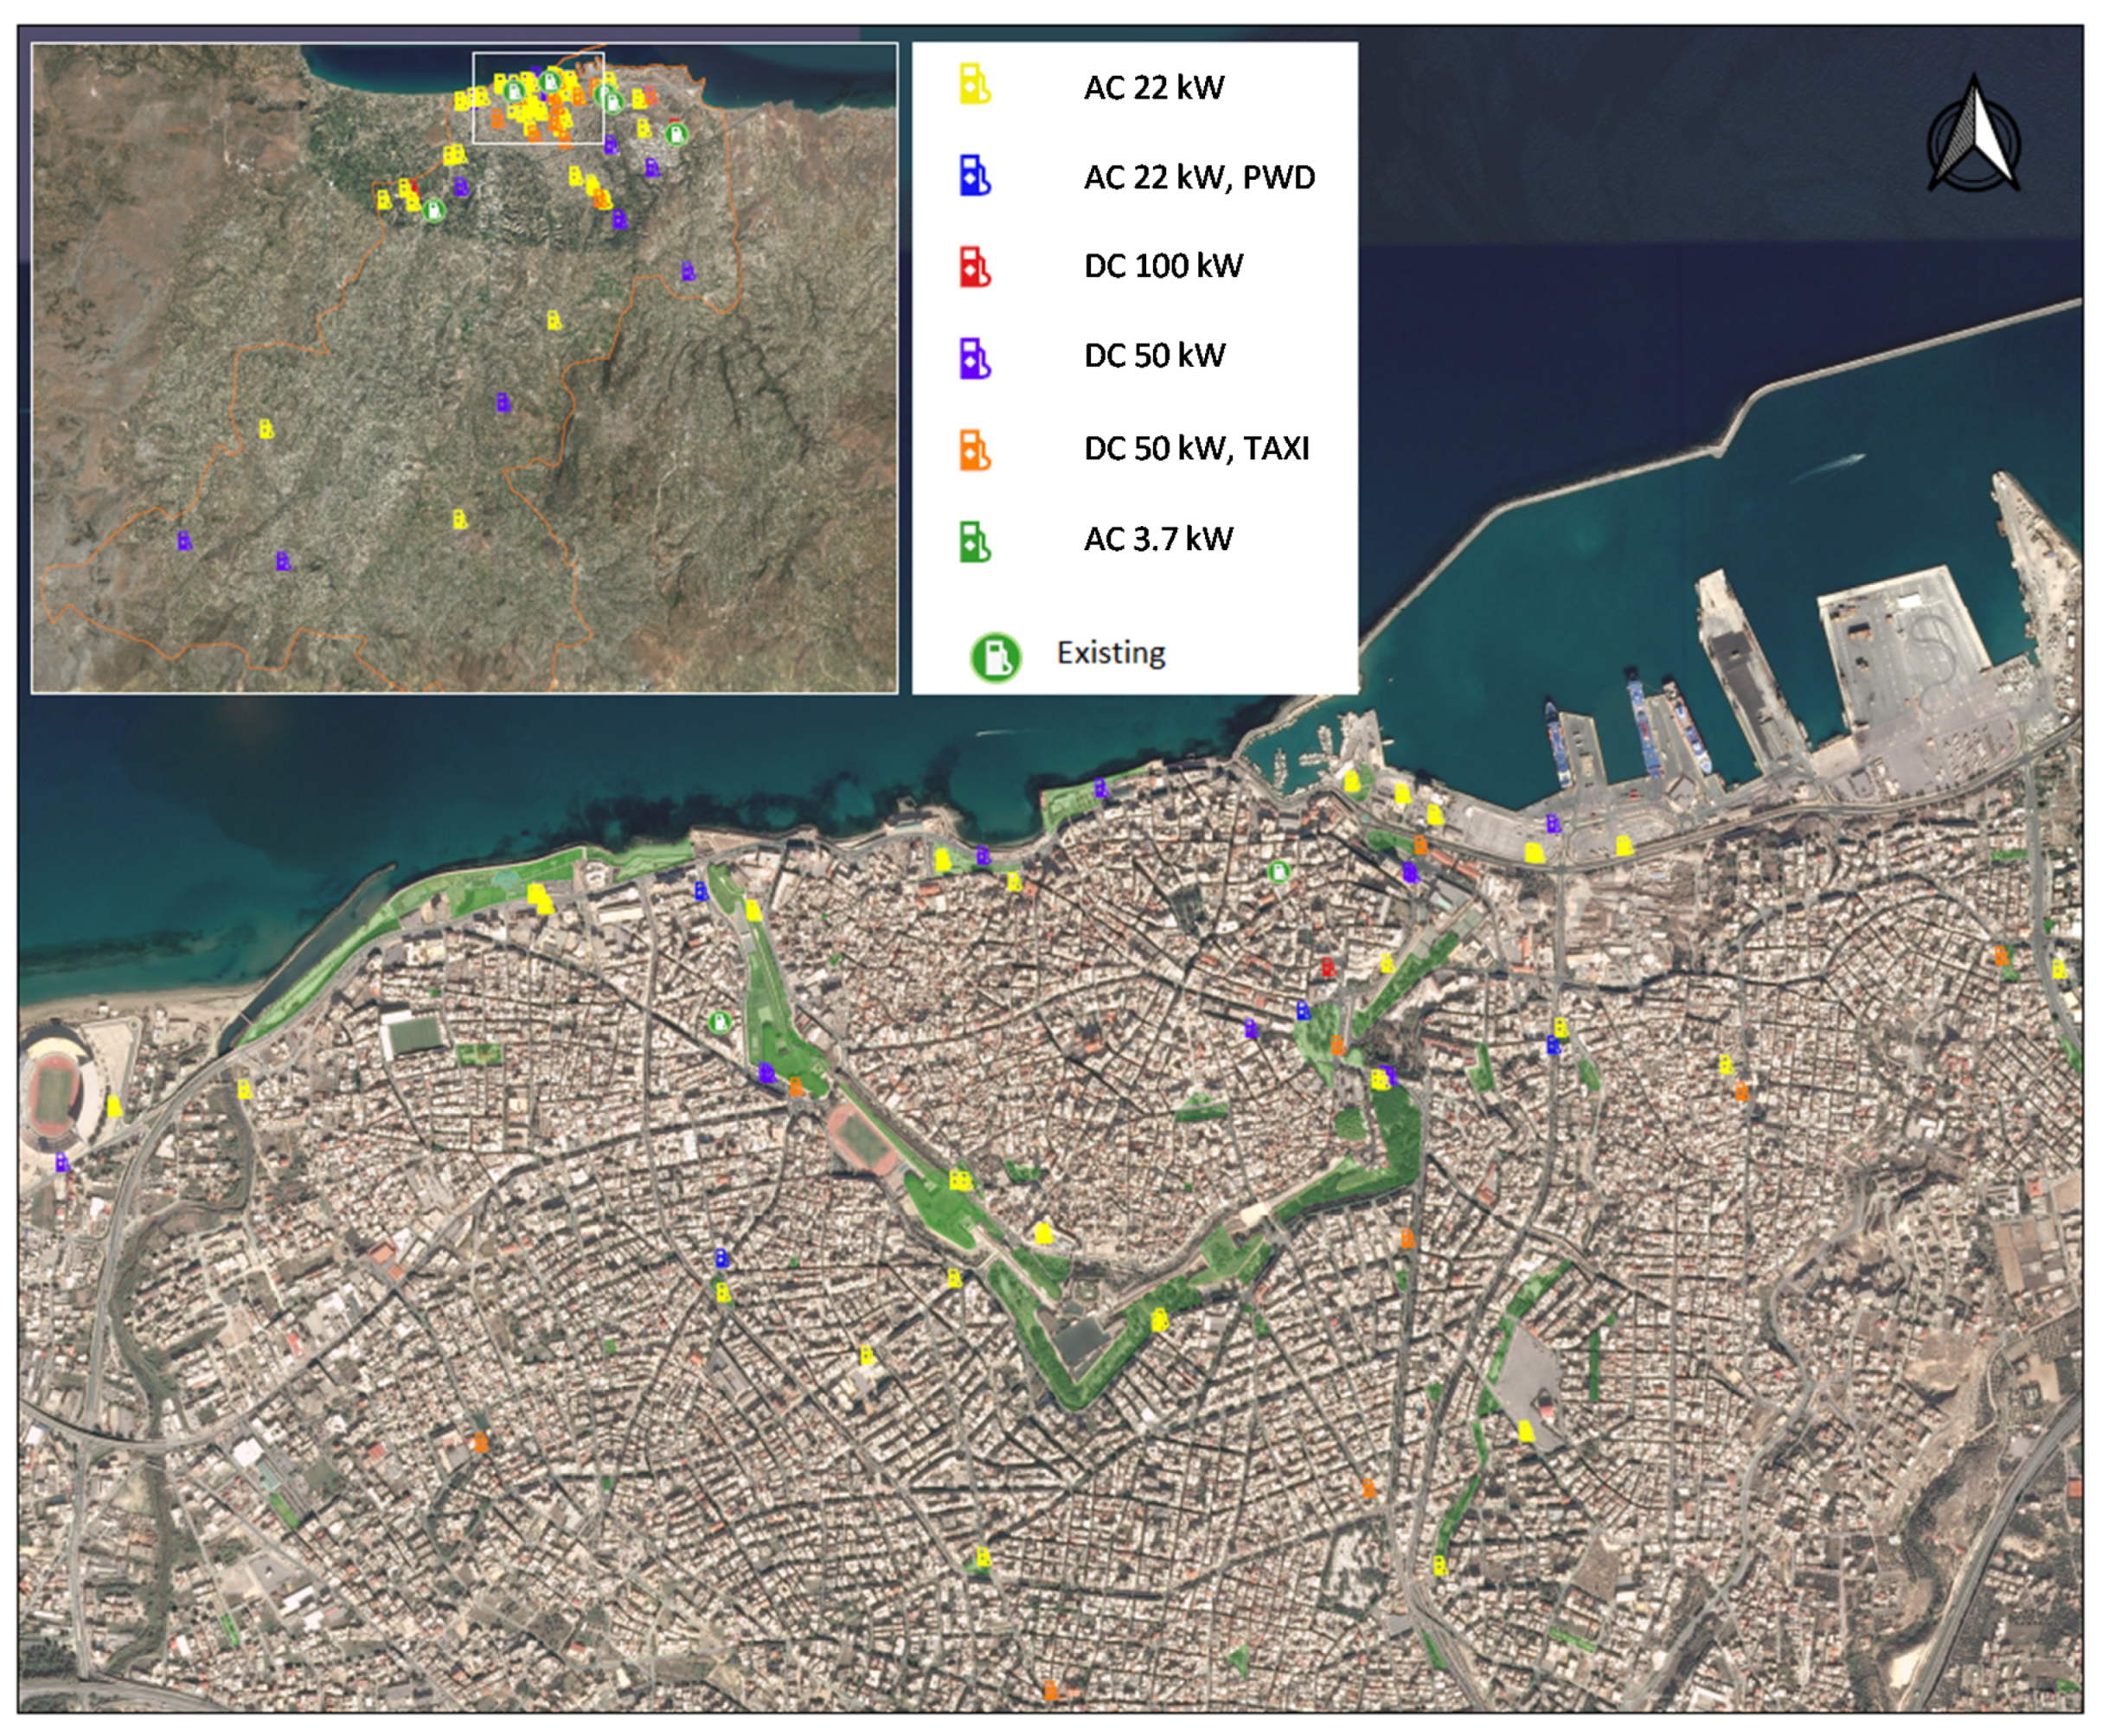
2.3. EV Charger Deployment Plan in the City of Heraklion
- Passenger (single-family) cars/taxis/semi-vans: 75.9%
- Two-wheelers: 21.5%
- Heavy-duty vehicles: 1.1%
- Buses: 0.9%
- Bicycles: 0.6%
2.3.1. Step 1: Analysis of the Existing Situation in the Area of Intervention
- Existing parking spaces of all kinds, e.g., municipal open and closed parking spaces, fee-based parking spaces, free-of-charge parking spaces (mainly on-street ones), publicly available private parking areas, etc.
- Exploitation of the official urban plan and land use characteristics
- Transport conditions in terms of hierarchy of the road network, transport flows including public transportation vehicles (e.g., taxis, buses, tourist buses, etc.);
- Special mobility networks mainly connecting the hubs, i.e., the port, the airport, and stations of intercity buses
- Information regarding the distribution of environmental stresses found in previous studies
- Existing parking spaces for people with disabilities (PWD)
- Taxi stations
- Attraction poles such as cultural buildings, tertiary buildings, public and medical service buildings, gymnasiums, banks, hospitals, etc.
2.3.2. Step 2: Locating the EV Stations
- The highest number of chargers was placed in the subregions considered the hottest by the process in step 1.
- The network of charging stations propagates to a coarser assembly as moving far from the “hottest” subregions; nonetheless, stations are also envisaged to cover well suburban areas and villages.
- Charging spots for heavy-duty vehicles are envisaged at intermediate terminal bus stations, apart from the central terminals, to serve bus routes which never visit the central terminals during the day.
- According to the regulations, charging spots are also foreseen at representative taxi stations and in the end of the waiting “tail” of each station presuming the necessary parking space for up to two electric taxis depending on space availability.
- Charging stations are also proposed in selected parking spaces for vehicles of people with disabilities (PWD) for at least 2% of the existing parking spaces of this kind.
2.3.3. Step 3: Development of the EV Charging Plan
3. Methods for Determining the Energy Needs of Electric Vehicles
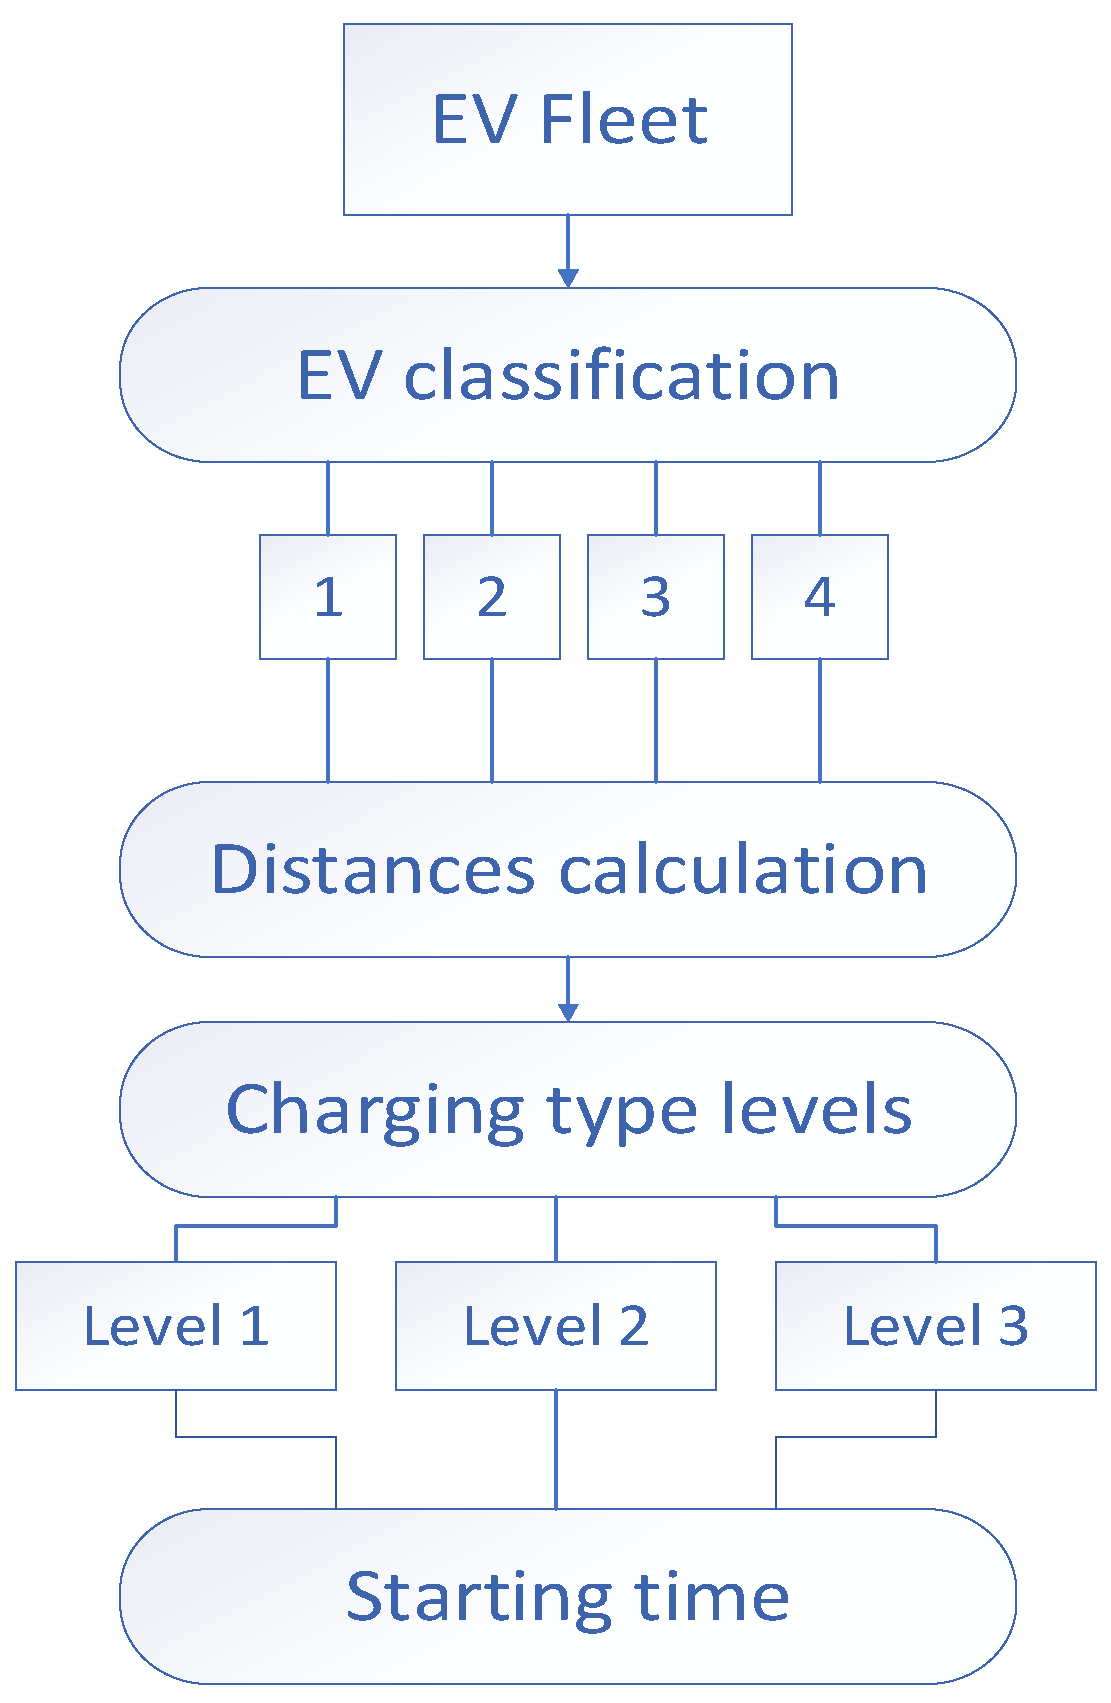
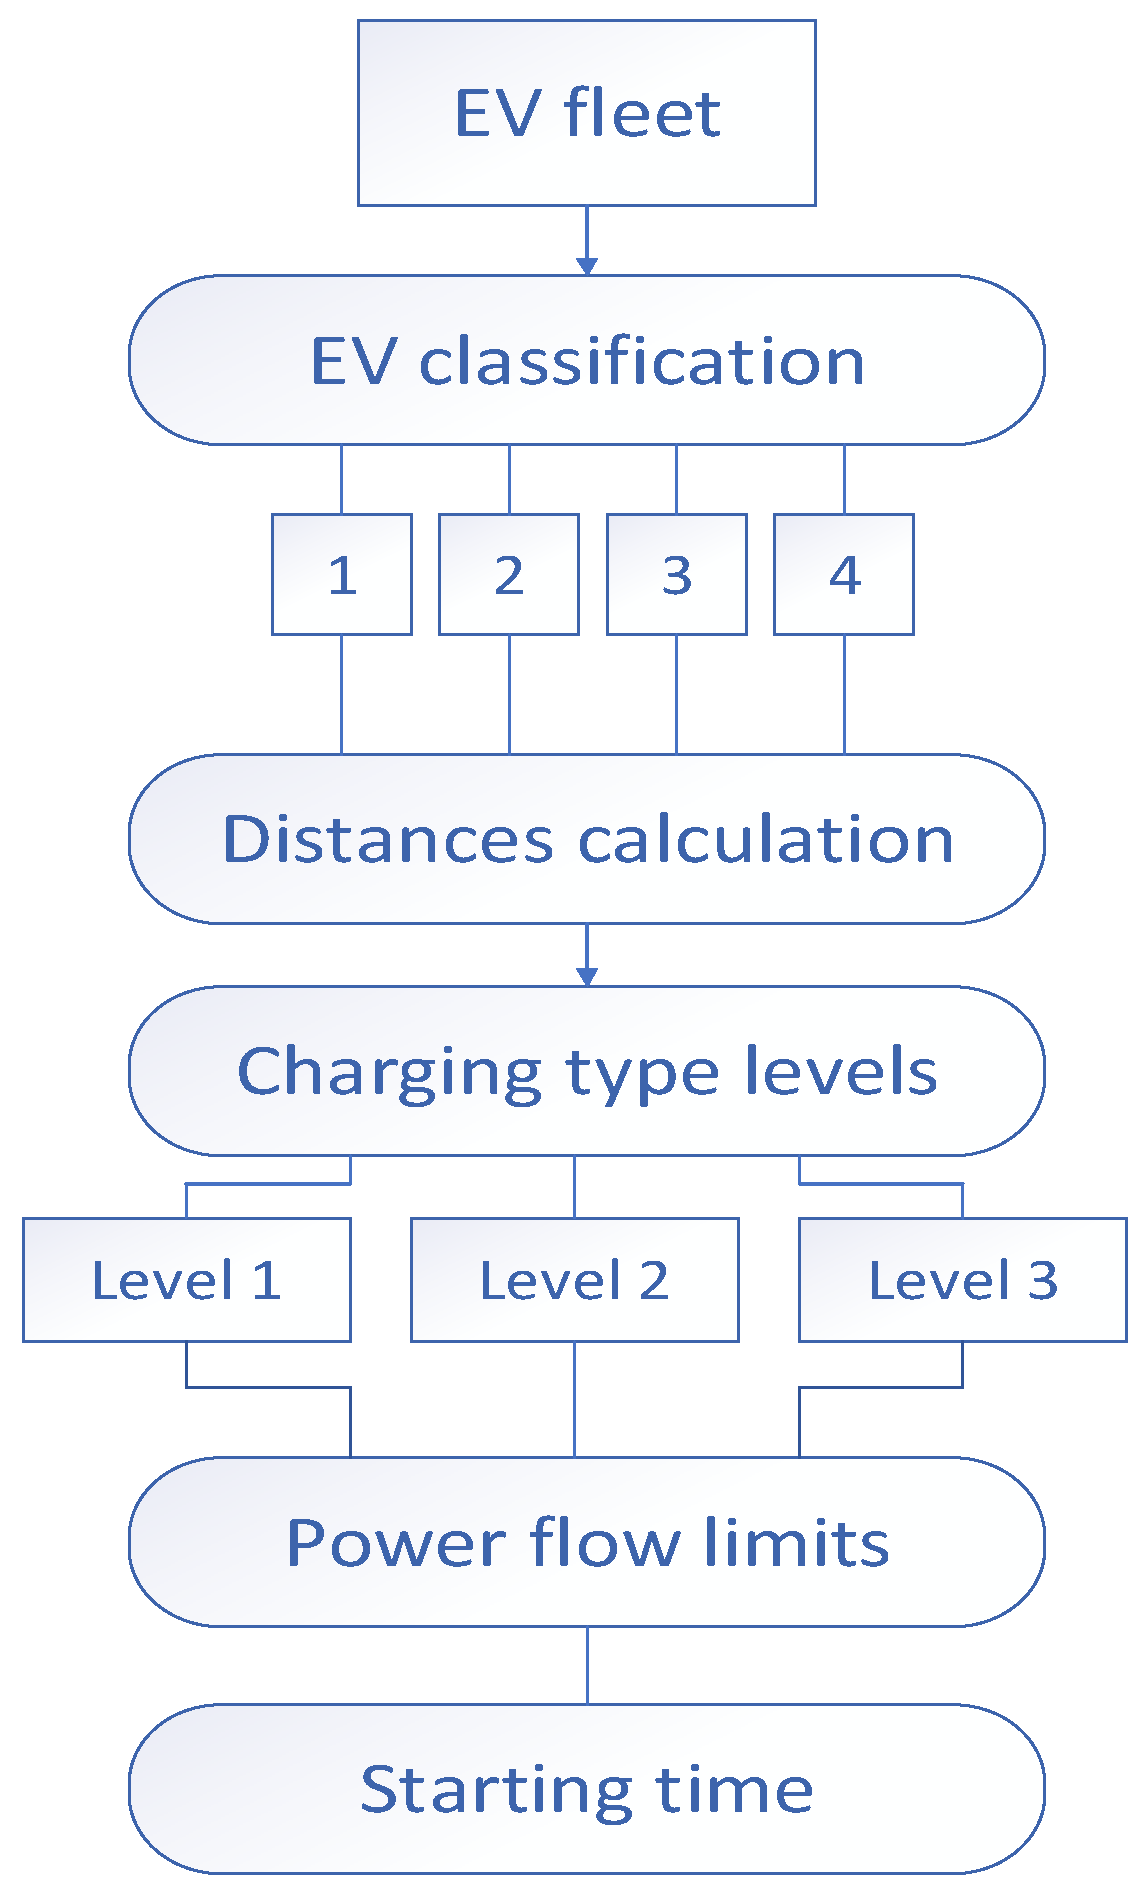
3.1. Assessment of the EV Fleet
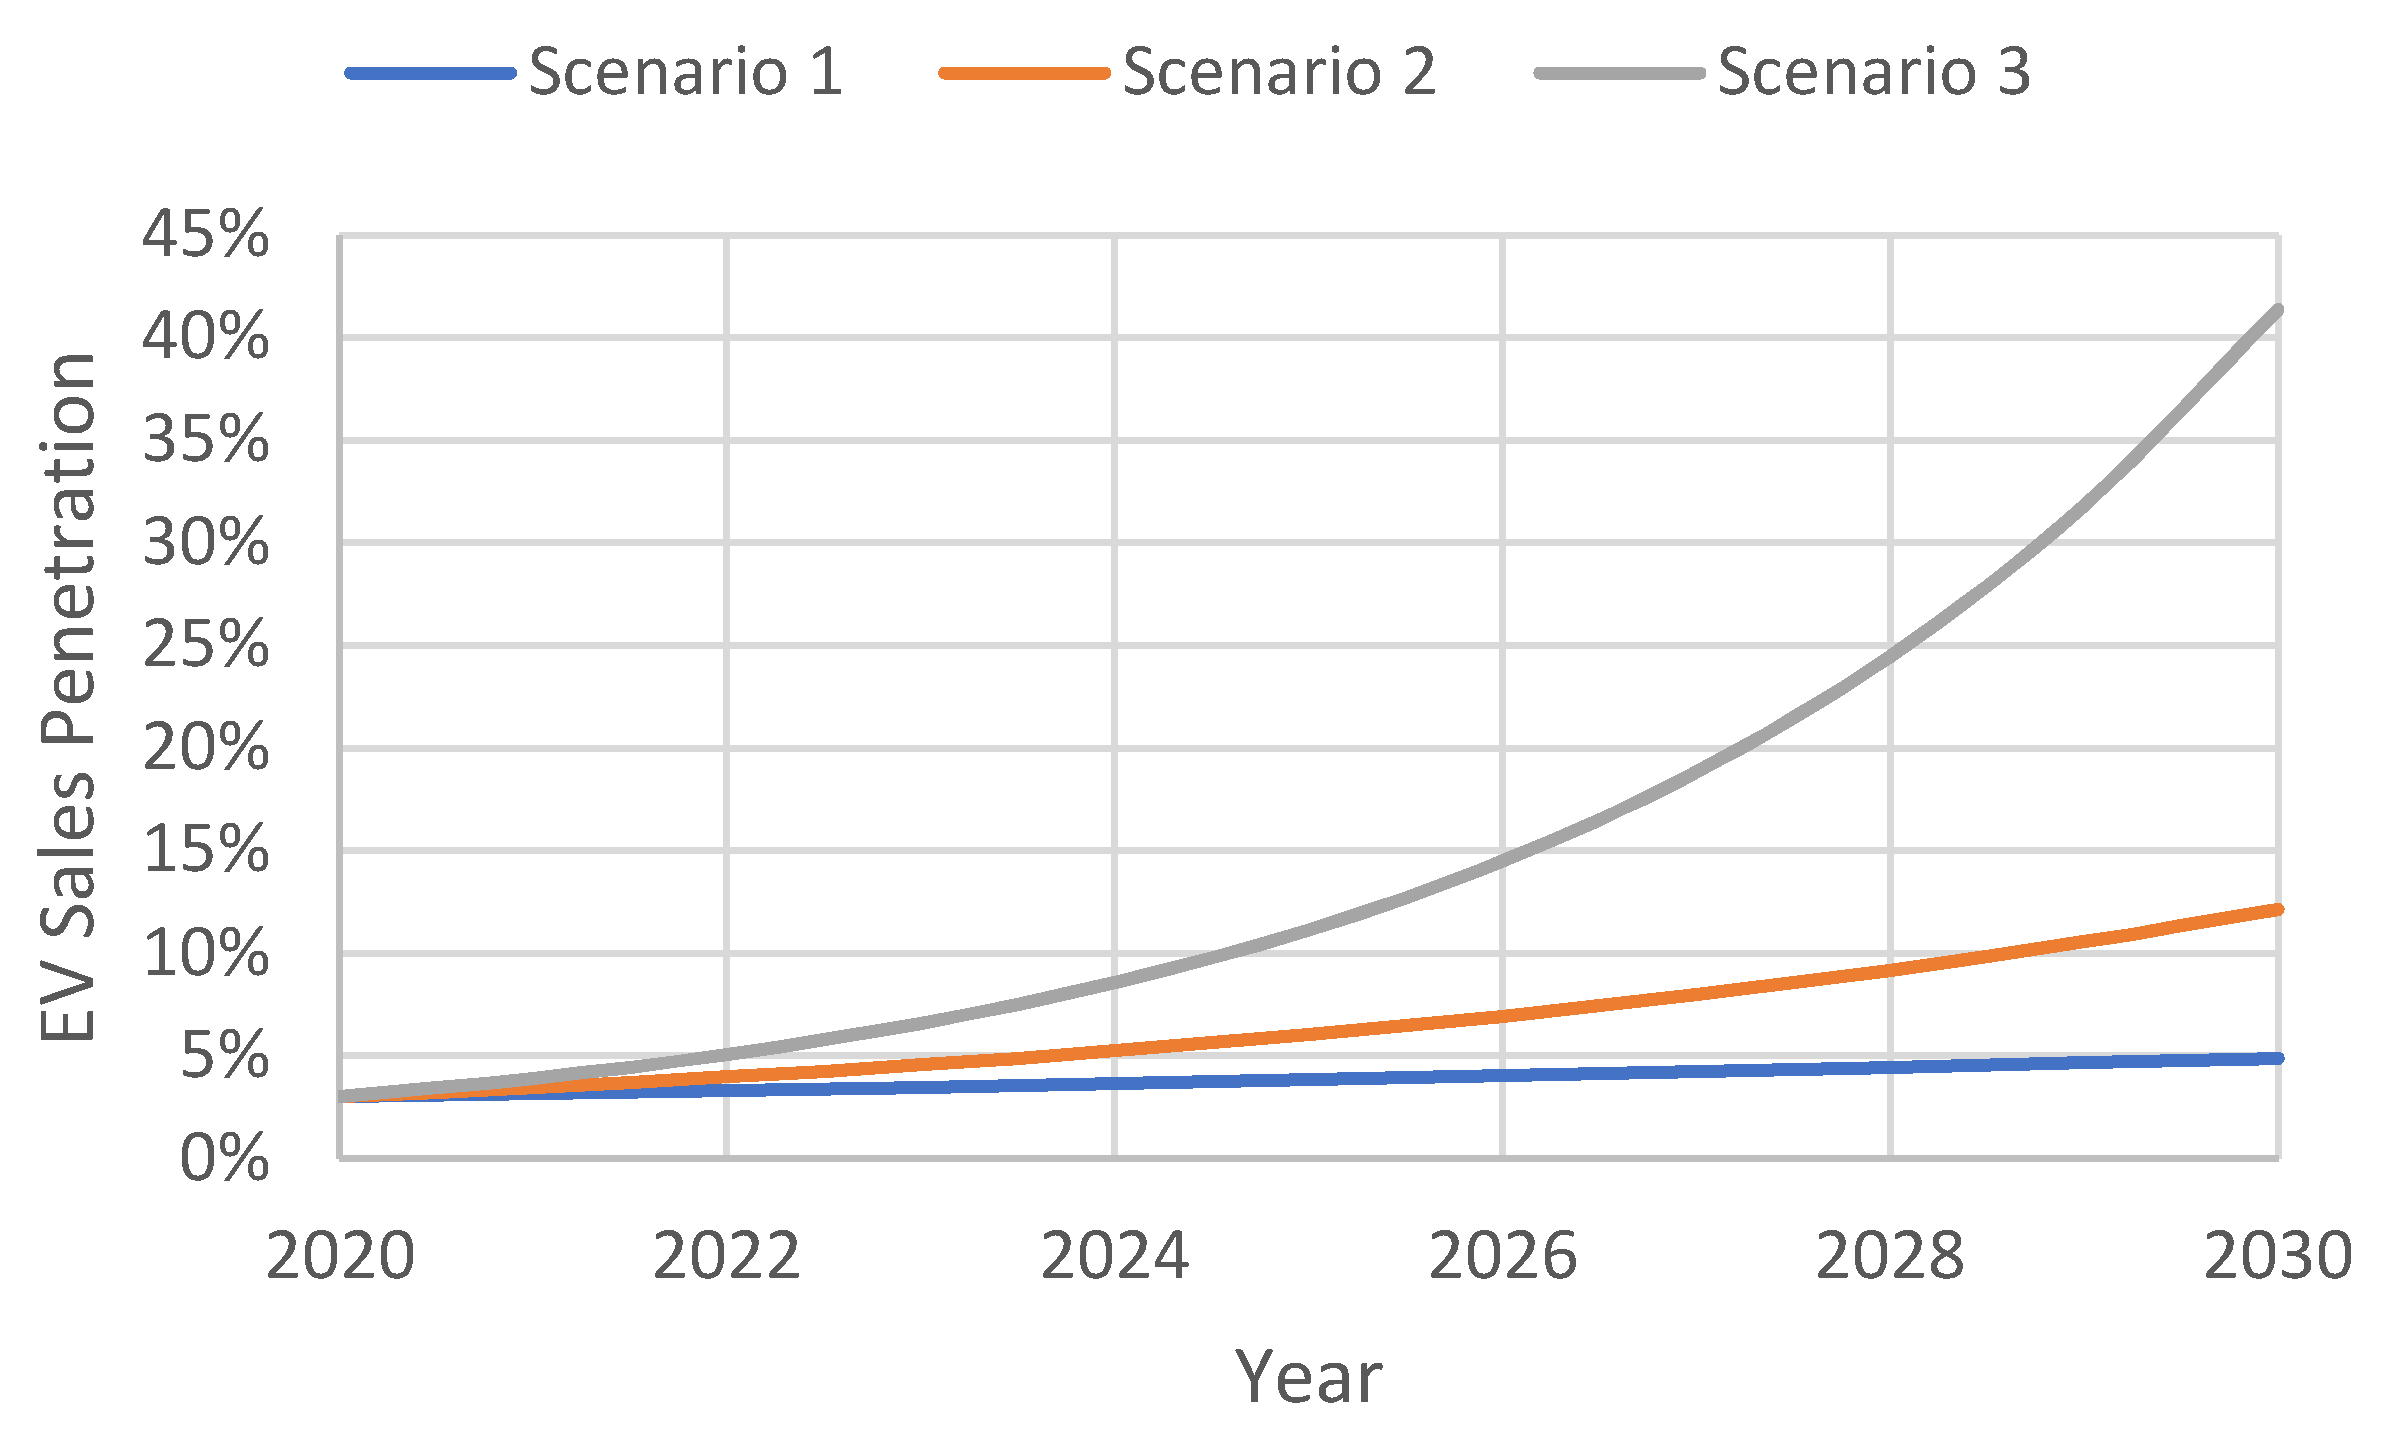
- A conservative scenario of low penetration of EVs that is more likely to happen, represented by a 5% annual rate of increment of EV sales.
- A more optimistic penetration scenario represented by a 15% annual rate of increment of EV sales.
- An aggressive scenario of extensive electric vehicles penetration represented by a 35% annual rate of increment of EV sales.
3.2. Electric Vehicles Classification
3.3. Electric Vehicles’ Charging Category
3.4. Distribution of the Daily Distance Traveled
3.5. Charging Losses
3.6. Charging Strategy
- Approach 1: uncontrolled charging.
- Approach 2: controlled charging.
3.6.1. Approach 1: Uncontrolled Charging
- FC: the final consumption of each vehicle is calculated by multiplying the total distance traveled (TL) during the day by the average energy consumption (AEC) of each vehicle type and dividing it by efficiency (EFF):
- ST: the starting time of vehicle charging. This parameter varies for each vehicle and follows normal distribution, with an average value at the time when the majority of drivers return home from work.
- CT: the charging time of each vehicle. It is calculated by dividing the final consumption (FC) by the charging level (CL) at which each vehicle charges.
3.6.2. Approach 2: Controlled Charging
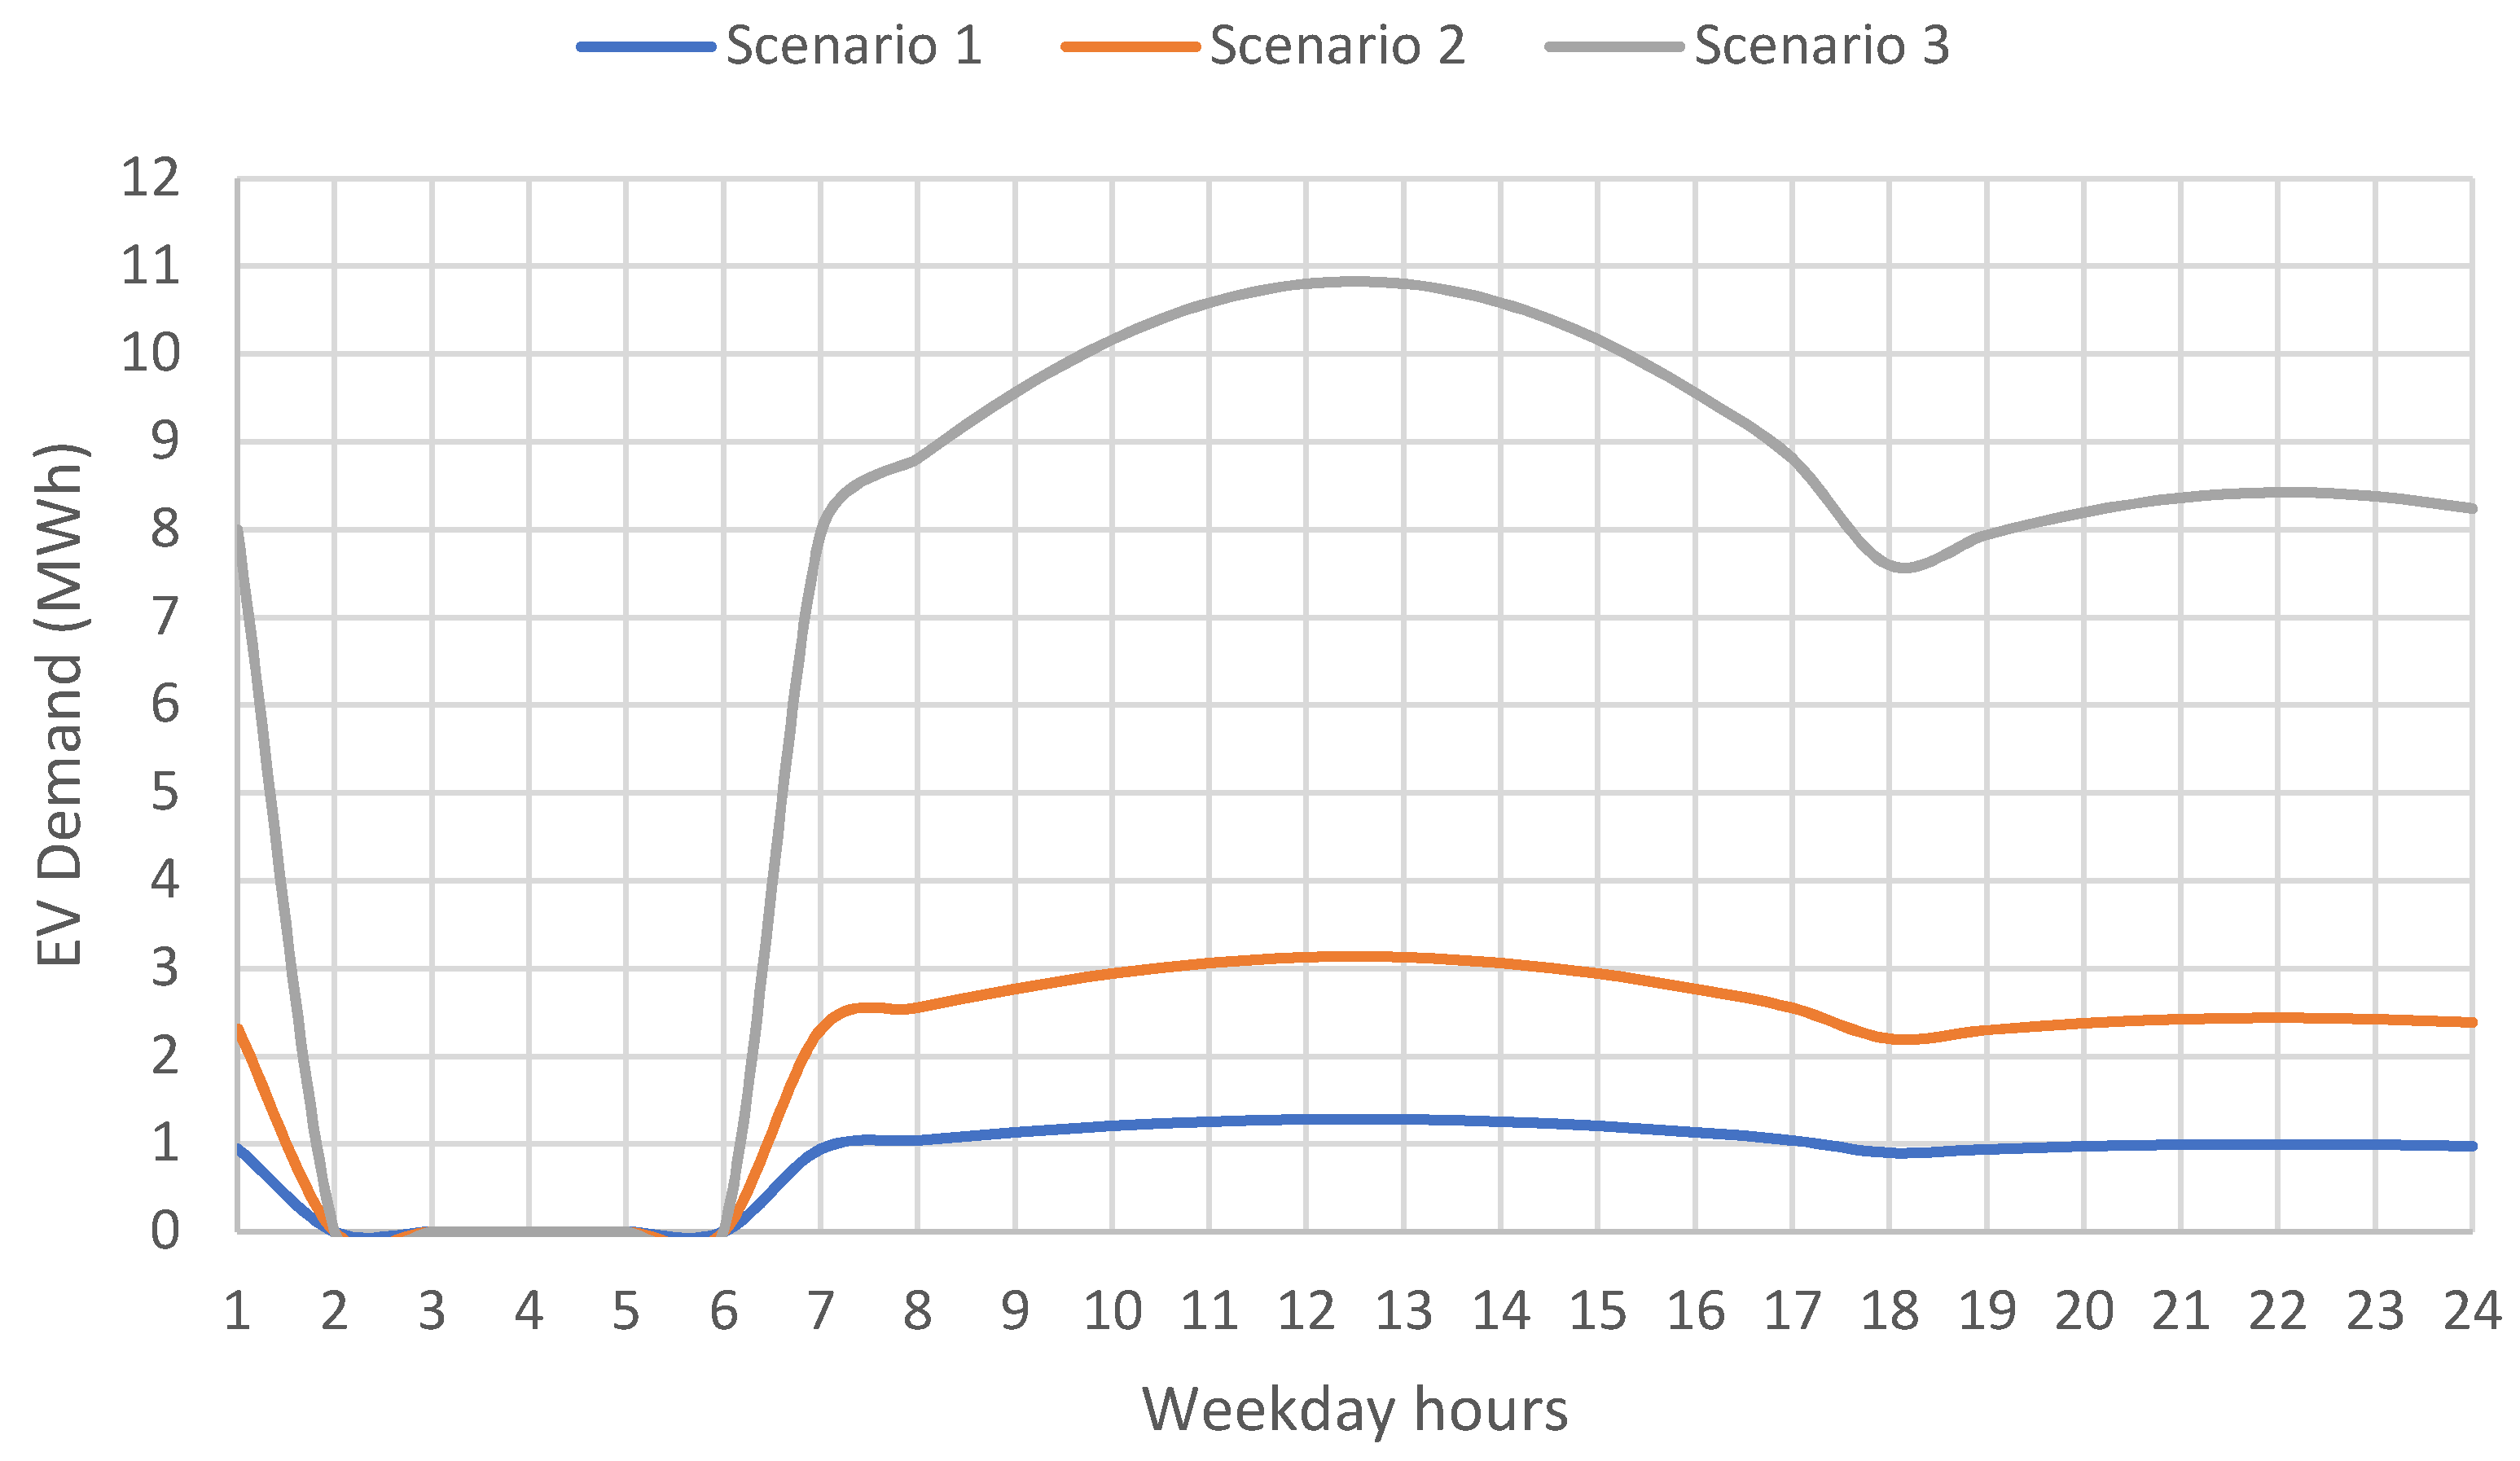
4. Results
- A.
- Comparison of the substations’ capacity and the peak demand
- B.
- The case of transformer fault
- A.
- Results of application of the first method
- B.
- Results of application of the second method
5. Conclusions
Author Contributions
Funding
Institutional Review Board Statement
Informed Consent Statement
Acknowledgments
Conflicts of Interest
Appendix A

| No. * | Geographical Coordinates, Latitude/Longitude | Primary Vehicles Charged | Charger Type | No. of Parking Spaces | Installation | No. of Spaces and Indicative Dimensions |
|---|---|---|---|---|---|---|
| 1 | 35°20′26.17″ Β/25°7′3.87″ A | Passenger (single-family) cars | AC 22 kW | 2 | Ground-mounted | 1.1: 2.5 m × 5 m 1.2: 2.5 m × 5 m |
| 2 | 35°20′26.17″ Β/25°7′4.13″ A | Passenger (single-family) cars | AC 22 kW | 2 | Ground-mounted | 2.1: 2.5 m × 5 m 2.2: 2.5 m × 5 m |
| 3 | 35°20′26.19″ Β/25°7′4.40″ A | Passenger (single-family) cars | AC 22 kW | 2 | Ground-mounted | 3.1: 2.5 m × 5 m 3.2: 2.5 m × 5 m |
| 4 | 35°18′44.37″ Β/25°8′42.00″ A | Passenger (single-family) cars | AC 22 kW | 2 | Ground-mounted | 4.1: 2.5 m × 5 m 4.2: 2.5 m × 5 m |
| 5 | 35°20′25.43″ Β/25°7′4.95″ A | Passenger (single-family) cars | AC 22 kW | 2 | Ground-mounted | 5.1: 2.5 m × 5 m 5.2: 2.5 m × 5 m |
| 6 | 35°20′25.42″ Β/25°7′4.70″ A | Passenger (single-family) cars | AC 22 kW | 2 | Ground-mounted | 6.1: 2.5 m × 5 m 6.2: 2.5 m × 5 m |
| 7 | 35°20′33.19″ Β/25°7′52.63″ A | Passenger (single-family) cars | Fast charger, DC 50 kW | 2 | Wall-mounted | 7.1: 2.5 m × 5 m 7.2: 2.5 m × 5 m |
| 8 | 35°20′28.37″ Β/25°7′39.04″ A | Passenger (single-family) cars | AC 22 kW | 2 | Wall-mounted | 8.1: 2.5 m × 5 m 8.2: 2.5 m × 5 m |
| 9 | 35°20′28.24″ Β/25°7′38.97″ A | Passenger (single-family) cars | AC 22 kW | 2 | Wall-mounted | 9.1: 2.5 m × 5 m 9.2: 2.5 m × 5 m |
| 10 | 35°20′28.13″ Β/25°7′38.91″ A | Passenger (single-family) cars | AC 22 kW | 2 | Wall-mounted | 10.1: 2.5 m × 5 m 10.2: 2.5 m × 5 m |
| 11 | 35°20′27.42″ Β/25°9′29.76″ A | Passenger (single-family) cars | AC 22 kW | 2 | Ground-mounted | 11.1: 2.5 m × 5 m 11.2: 2.5 m × 5 m |
| 12 | 35°19′58.06″ Β/25°7′19.70″ A | Passenger (single-family) cars | AC 22 kW | 2 | Ground-mounted | 12.1: 2.5 m × 5 m 12.2: 2.5 m × 5 m |
| 13 | 35°20′32.57″ Β/25°8′18.41″ A | Passenger (single-family) cars | AC 22 kW | 2 | Ground-mounted | 13.1: 2.5 m × 5 m 13.2: 2.5 m × 5 m |
| 14 | 35°20′32.48″ Β/25°8′18.66″ A | Passenger (single-family) cars | AC 22 kW | 2 | Ground-mounted | 14.1: 2.5 m × 5 m 14.2: 2.5 m × 5 m |
| 15 | 35°20′31.00″ Β/25°8′21.41″ A | Passenger (single-family) cars | AC 22 kW | 2 | Ground-mounted | 15.1: 2.5 m × 5 m 15.2: 2.5 m × 5 m |
| 16 | 35°20′31.08″ Β/25°8′21.18″ A | Passenger (single-family) cars | AC 22 kW | 2 | Ground-mounted | 16.1: 2.5 m × 5 m 16.2: 2.5 m × 5 m |
| 17 | 35°20′13.22″ Β/25°8′46.04″ A | Passenger (single-family) cars | AC 22 kW | 2 | Ground-mounted | 17.1: 2.5 m × 5 m 17.2: 2.5 m × 5 m |
| 18 | 35°20′28.23″ Β/25°8′30.07″ A | Passenger (single-family) cars | AC 22 kW | 2 | Ground-mounted | 18.1: 2.5 m × 5 m 18.2: 2.5 m × 5 m |
| 19 | 35°20′28.26″ Β/25°8′29.80″ A | Passenger (single-family) cars | AC 22 kW | 2 | Ground-mounted | 19.1: 2.5 m × 5 m 19.2: 2.5 m × 5 m |
| 20 | 35°20′28.30″ Β/25°8′29.55″ A | Passenger (single-family) cars | AC 22 kW | 2 | Ground-mounted | 20.1: 2.5 m × 5 m 20.2: 2.5 m × 5 m |
| 21 | 35°19′53.57″ Β/25°7′32.01″ A | Passenger (single-family) cars | AC 22 kW | 2 | Ground-mounted | 21.1: 2.5 m × 5 m 21.2: 2.5 m × 5 m |
| 22 | 35°20′30.31″ Β/25°8′31.44″ A | Buses | Fast charger, DC 50 kW | 1 | Ground-mounted | 22.1: 2.5 m × 9 m |
| 23 | 35°20′28.68″ Β/25°8′37.37″ A | Passenger (single-family) cars | AC 22 kW | 2 | Ground-mounted | 23.1: 2.5 m × 5 m 23.2: 2.5 m × 5 m |
| 24 | 35°20′28.74″ Β/25°8′37.66″ A | Passenger (single-family) cars | AC 22 kW | 2 | Ground-mounted | 24.1: 2.5 m × 5 m 24.2: 2.5 m × 5 m |
| 25 | 35°19′39.29″ Β/25°7′41.83″ A | Passenger (single-family) cars | AC 22 kW | 2 | Ground-mounted | 25.1: 2.5 m × 5 m 25.2: 2.5 m × 5 m |
| 26 | 35°20′7.87″ Β/25°6′10.37″ A | Passenger (single-family) cars | AC 22 kW | 2 | Ground-mounted | 26.1: 2.5 m × 5 m 26.2: 2.5 m × 5 m |
| 27 | 35°20′7.89″ Β/25°6′10.12″ A | Passenger (single-family) cars | AC 22 kW | 2 | Ground-mounted | 27.1: 2.5 m × 5 m 27.2: 2.5 m × 5 m |
| 28 | 35°20′12.66″ Β/25°6′38.83″ A | Passenger (single-family) cars | AC 22 kW | 2 | Ground-mounted | 28.1: 2.5 m × 5 m 28.2: 2.5 m × 5 m |
| 29 | 35°20′7.72″ Β/25°6′11.60″ A | Passenger (single-family) cars | AC 22 kW | 2 | Ground-mounted | 29.1: 2.5 m × 5 m 29.2: 2.5 m × 5 m |
| 30 | 35°19′7.75″ Β/25°5′55.03″ A | Passenger (single-family) cars | AC 22 kW | 2 | Ground-mounted | 30.1: 2.5 m × 5 m 30.2: 2.5 m × 5 m |
| 31 | 35°20′7.69″ Β/25°6′23.08″ A | Buses | Fast charger, DC 50 kW | 1 | Ground-mounted | 31.1: 2.5 m × 9 m |
| 32 | 35°20′11.48″ Β/25°6′27.56″ A | Passenger (single-family) cars | AC 22 kW | 2 | Ground-mounted | 32.1: 2.5 m × 5 m 32.2: 2.5 m × 5 m |
| 33 | 35°20′11.69″ Β/25°6′27.61″ A | Passenger (single-family) cars | AC 22 kW | 2 | Ground-mounted | 33.1: 2.5 m × 5 m 33.2: 2.5 m × 5 m |
| 34 | 35°20′24.77″ Β/25°7′22.76″ A | Passenger (single-family) cars | AC 22 kW | 2 | Ground-mounted | 34.1: 2.5 m × 5 m 34.2: 2.5 m × 5 m |
| 35 | 35°20′24.96″ Β/25°7′22.61″ A | Passenger (single-family) cars | AC 22 kW | 2 | Ground-mounted | 35.1: 2.5 m × 5 m 35.2: 2.5 m × 5 m |
| 36 | 35°20′1.87″ Β/25°7′47.12″ A | Passenger (single-family) cars | AC 22 kW | 2 | Wall-mounted | 36.1: 2.5 m × 5 m 36.2: 2.5 m × 5 m |
| 37 | 35°20′1.90″ Β/25°7′47.30″ A | Passenger (single-family) cars | AC 22 kW | 2 | Wall-mounted | 37.1: 2.5 m × 5 m 37.2: 2.5 m × 5 m |
| 38 | 35°20′1.94″ Β/25°7′47.48″ A | Passenger (single-family) cars | AC 22 kW | 2 | Wall-mounted | 38.1: 2.5 m × 5 m 38.2: 2.5 m × 5 m |
| 39 | 35°18′35.26″ Β/25°9′3.51″ A | Passenger (single-family) cars | AC 22 kW | 2 | Ground-mounted | 39.1: 2.5 m × 5 m 39.2: 2.5 m × 5 m |
| 40 | 35°19′23.81″ Β/25°8′28.44″ A | Taxis | Fast charger, DC 50 kW | 1 | Ground-mounted | 40.1: 2.5 m × 5 m |
| 41 | 35°20′26.86″ Β/25°8′19.29″ A | Buses | Fast charger, DC 50 kW | 2 | Ground-mounted | 41.1: 3 m × 14 m 41.2: 3 m × 14 m |
| 42 | 35°20′27.01″ Β/25°8′19.04″ A | Buses | Fast charger, DC 50 kW | 2 | Ground-mounted | 42.1: 3 m × 14 m 42.2: 3 m × 14 m |
| 43 | 35°20′13.48″ Β/25°7′23.54″ A | Buses | Fast charger, DC 50 kW | 2 | Ground-mounted | 43.1: 3 m × 14 m 43.2: 3 m × 14 m |
| 44 | 35°20′13.36″ Β/25°7′23.84″ A | Buses | Fast charger, DC 50 kW | 2 | Ground-mounted | 44.1: 3 m × 14 m 44.2: 3 m × 14 m |
| 45 | 35°20′20.44″ Β/25°8′11.96″ A | Buses | Fast charger, DC 100 kW | 2 | Ground-mounted | 45.1: 3 m × 14 m 45.2: 3 m × 14 m |
| 46 | 35°20′12.75″ Β/25°8′16.80″ A | Buses + passenger cars | Fast charger, DC 50 kW | 2 | Ground-mounted | 46.1: 3 m × 14 m 46.2: 2.5 m × 5 m |
| 47 | 35°20′12.50″ Β/25°8′17.59″ A | Buses + passenger cars | Fast charger, DC 50 kW | 2 | Ground-mounted | 47.1: 3 m × 14 m 47.2: 2.5 m × 5 m |
| 48 | 35°17′56.55″ Β/25°9′39.90″ A | Buses + passenger cars | Fast charger, DC 50 kW | 2 | Ground-mounted | 48.1: 3 m × 14 m 48.2: 3 m × 14 m 48.3: 2.5 m × 5 m 48.4: 2.5 m × 5 m |
| 49 | 35°17′56.56″ Β/25°9′39.98″ A | Buses + passenger cars | Fast charger, DC 50 kW | 2 | Ground-mounted | 49.1: 3 m × 14 m 49.2: 3 m × 14 m 49.3: 2.5 m × 5 m 49.4: 2.5 m × 5 m |
| 50 | 35°20′11.23″ Β/25°10′22.28″ A | Buses + passenger cars | Fast charger, DC 50 kW | 2 | Ground-mounted | 50.1: 3 m × 14 m 50.2: 3 m × 14 m |
| 51 | 35°20′8.36″ Β/25°10′7.68″ A | Passenger (single-family) cars | AC 22 kW | 2 | Ground-mounted | 51.1: 2.5 m × 5 m 51.2: 2.5 m × 5 m |
| 52 | 35°20′7.75″ Β/25°10′7.80″ A | Passenger (single-family) cars | AC 22 kW | 2 | Ground-mounted | 52.1: 2.5 m × 5 m 52.2: 2.5 m × 5 m |
| 53 | 35°20′7.05″ Β/25°10′7.96″ A | Passenger (single-family) cars | AC 22 kW | 2 | Ground-mounted | 53.1: 2.5 m × 5 m 53.2: 2.5 m × 5 m |
| 54 | 35°19′27.81″ Β/25°10′54.21″ A | Heavy-duty vehicles | Fast charger, DC 100 kW | 4 | Ground-mounted | 54.1: 3 m × 14 m 54.2: 3 m × 14 m 54.3: 2.5 m × 5 m 54.4: 2.5 m × 5 m |
| 55 | 35°19′35.39″ Β/25°10′56.40″ A | Heavy-duty vehicles | Fast charger, DC 100 kW | 4 | Ground-mounted | 55.1: 3 m × 14 m 55.2: 3 m × 14 m 55.3: 2.5 m × 5 m 55.4: 2.5 m × 5 m |
| 56 | 35°20′14.89″ Β/25°8′12.71″ A | Taxis | Fast charger, DC 50 kW | 2 | Ground-mounted | 56.1: 2.5 m × 5 m 56.2: 2.5 m × 5 m |
| 57 | 35°20′28.94″ Β/25°8′20.09″ A | Taxis | Fast charger, DC 50 kW | 1 | Ground-mounted | 57.1: 2.5 m × 5 m |
| 58 | 35°20′20.64″ Β/25°9′9.77″ A | Taxis | Fast charger, DC 50 kW | 1 | Ground-mounted | 58.1: 2.5 m × 5 m |
| 59 | 35°19′47.72″ Β/25°6′58.79″ A | Taxis | Fast charger, DC 50 kW | 2 | Ground-mounted | 59.1: 2.5 m × 5 m 59.2: 2.5 m × 5 m |
| 60 | 35°20′1.30″ Β/25°8′18.54″ A | Taxis | Fast charger, DC 50 kW | 1 | Ground-mounted | 60.1: 2.5 m × 5 m |
| 61 | 35°18′19.28″ Β/25°9′14.08″ A | Taxis | Fast charger, DC 50 kW | 2 | Ground-mounted | 61.1: 2.5 m × 5 m 61.2: 2.5 m × 5 m |
| 62 | 35°20′11.32″ Β/25°8′47.38″ A | Taxis | Fast charger, DC 50 kW | 1 | Ground-mounted | 62.1: 2.5 m × 5 m |
| 63 | 35°20′12.44″ Β/25°7′26.17″ A | Taxis | Fast charger, DC 50 kW | 2 | Ground-mounted | 63.1: 2.5 m × 5 m 63.2: 2.5 m × 5 m |
| 64 | 35°19′9.98″ Β/25°6′6.95″ A | Passenger (single-family) cars | AC 22 kW | 2 | Ground-mounted | 64.1: 2.5 m × 5 m 64.2: 2.5 m × 5 m |
| 65 | 35°18′34.04″ Β/25°6′9.35″ A | Buses | Fast charger, DC 50 kW | 1 | Ground-mounted | 65.1: 3 m × 14 m |
| 66 | 35°18′18.67″ Β/25°5′4.79″ A | Passenger (single-family) cars | AC 22 kW | 2 | Ground-mounted | 66.1: 2.5 m × 5 m 66.2: 2.5 m × 5 m |
| 67 | 35°18′18.58″ Β/25°5′4.91″ A | Passenger (single-family) cars | AC 22 kW | 2 | Ground-mounted | 67.1: 2.5 m × 5 m 67.2: 2.5 m × 5 m |
| 68 | 35°18′33.00″ Β/25°4′54.35″ A | Passenger (single-family) cars | AC 22 kW | 2 | Ground-mounted | 68.1: 2.5 m × 5 m 68.2: 2.5 m × 5 m |
| 69 | 35°18′30.92″ Β/25°5′4.57″ A | Buses + passenger cars | Fast charger, DC 50 kW | 2 | Ground-mounted | 69.1: 2.5 m × 5 m 69.2: 2.5 m × 5 m |
| 70 | 35°18′20.67″ Β/25°4′26.19″ A | Passenger (single-family) cars | AC 22 kW | 2 | Ground-mounted | 70.1: 2.5 m × 5 m 70.2: 2.5 m × 5 m |
| 71 | 35°18′18.02″ Β/25°9′20.61″ A | Passenger (single-family) cars | AC 22 kW | 2 | Ground-mounted | 71.1: 2.5 m × 5 m 71.2: 2.5 m × 5 m |
| 72 | 35°18′17.94″ Β/25°9′20.35″ A | Passenger (single-family) cars | AC 22 kW | 2 | Ground-mounted | 72.1: 2.5 m × 5 m 72.2: 2.5 m × 5 m |
| 73 | 35°18′32.16″ Β/25°9′6.25″ A | Passenger (single-family) cars | AC 22 kW | 2 | Ground-mounted | 73.1: 2.5 m × 5 m 73.2: 2.5 m × 5 m |
| 74 | 35°19′35.41″ Β/25°10′13.76″ A | Passenger (single-family) cars | AC 22 kW | 2 | Ground-mounted | 74.1: 2.5 m × 5 m 74.2: 2.5 m × 5 m |
| 75 | 35°19′29.80″ Β/25°7′47.51″ A | Taxis | Fast charger, DC 50 kW | 1 | Ground-mounted | 75.1: 2.5 m × 5 m |
| 76 | 35°19′47.76″ Β/25°8′28.43″ A | Passenger (single-family) cars | AC 22 kW | 2 | Ground-mounted | 76.1: 2.5 m × 5 m 76.2: 2.5 m × 5 m |
| 77 | 35°19′47.59″ Β/25°8′28.59″ A | Passenger (single-family) cars | AC 22 kW | 2 | Ground-mounted | 77.1: 2.5 m × 5 m 77.2: 2.5 m × 5 m |
| 78 | 35°20′12.49″ Β/25°8′16.11″ A | Passenger (single-family) cars | AC 22 kW | 2 | Ground-mounted | 78.1: 2.5 m × 5 m 78.2: 2.5 m × 5 m |
| 79 | 35°20′12.39″ Β/25°8′16.53″ A | Passenger (single-family) cars | AC 22 kW | 2 | Ground-mounted | 79.1: 2.5 m × 5 m 79.2: 2.5 m × 5 m |
| 80 | 35°20′16.20″ Β/25°8′5.23″ A | Passenger (single-family) cars | Fast charger, DC 50 kW | 1 | Ground-mounted | 80.1: 2.5 m × 5 m |
| 81 | 35°20′20.62″ Β/25°8′17.05″ A | Passenger (single-family) cars | AC 22 kW | 2 | Ground-mounted | 81.1: 2.5 m × 5 m 81.2: 2.5 m × 5 m |
| 82 | 35°19′55.64″ Β/25°7′57.01″ A | Passenger (single-family) cars | AC 22 kW | 2 | Ground-mounted | 82.1: 2.5 m × 5 m 82.2: 2.5 m × 5 m |
| 83 | 35°19′55.92″ Β/25°7′57.32″ A | Passenger (single-family) cars | AC 22 kW | 2 | Ground-mounted | 83.1: 2.5 m × 5 m 83.2: 2.5 m × 5 m |
| 84 | 35°20′5.71″ Β/25°7′39.83″ A | Passenger (single-family) cars | AC 22 kW | 2 | Ground-mounted | 84.1: 2.5 m × 5 m 84.2: 2.5 m × 5 m |
| 85 | 35°19′43.80″ Β/25°8′14.97″ A | Taxis | Fast charger, DC 50 kW | 1 | Ground-mounted | 85.1: 2.5 m × 5 m |
| 86 | 35°20′15.96″ Β/25°8′31.89″ A | Passenger (single-family) cars | AC 22 kW | 2 | Ground-mounted | 86.1: 2.5 m × 5 m 86.2: 2.5 m × 5 m |
| 87 | 35°20′26.68″ Β/25°7′45.10″ A | Passenger (single-family) cars | AC 22 kW | 2 | Ground-mounted | 87.1: 2.5 m × 5 m 87.2: 2.5 m × 5 m |
| 88 | 35°19′38.32″ Β/25°8′20.99″ A | Passenger (single-family) cars | AC 22 kW | 2 | Ground-mounted | 88.1: 2.5 m × 5 m 88.2¨: 2.5 m × 5 m |
| 89 | 35°20′19.01″ Β/25°9′14.60″ A | Passenger (single-family) cars | AC 22 kW | 2 | Ground-mounted | 89.1: 2.5 m × 5 m 89.2: 2.5 m × 5 m |
| 90 | 35°20′5.64″ Β/25°7′40.61″ A | Passenger (single-family) cars | AC 22 kW | 2 | Ground-mounted | 90.1: 2.5 m × 5 m 90.2: 2.5 m × 5 m |
| 91 | 35°19′58.89″ Β/25°7′39.58″ A | Passenger (single-family) cars | AC 22 kW | 2 | Ground-mounted | 91.1: 2.5 m × 5 m 91.2: 2.5 m × 5 m |
| 92 | 35°16′58.71″ Β/25°11′10.24″ A | Buses + passenger cars | Fast charger, DC 50 kW | 2 | Ground-mounted | 92.1: 3 m × 14 m 92.2: 2.5 m × 5 m |
| 93 | 35°16′6.93″ Β/25°8′10.81″ A | Passenger (single-family) cars | AC 22 kW | 2 | Ground-mounted | 93.1: 2.5 m × 5 m 93.2: 2.5 m × 5 m |
| 94 | 35°12′30.35″ Β/25°6′2.28″ A | Passenger (single-family) cars | AC 22 kW | 2 | Ground-mounted | 94.1: 2.5 m × 5 m 94.2: 2.5 m × 5 m |
| 95 | 35°14′11.36″ Β/25°1′45.95″ A | Buses + passenger cars | AC 22 kW | 2 | Ground-mounted | 95.1: 2.5 m × 9 m 95.2: 2.5 m × 5 m |
| 96 | 35°11′46.64″ Β/25°2′6.46″ A | Buses + passenger cars | Fast charger, DC 50 kW | 2 | Ground-mounted | 96.1: 3 m × 12 m 96.2: 2.5 m × 5 m |
| 97 | 35°12′9.96″ Β/24°59′55.44″ A | Buses + passenger cars | Fast charger, DC 50 kW | 2 | Ground-mounted | 97.1: 3 m × 14 m 97.2: 2.5 m × 5 m |
| 98 | 35°18′52.18″ Β/25°10′24.53″ A | Buses + passenger cars | Fast charger, DC 50 kW | 2 | Ground-mounted | 98.1: 3 m × 14 m 98.2: 2.5 m × 5 m |
| 99 | 35°14′37.41″ Β/25°7′2.35″ A | Buses + passenger cars | Fast charger, DC 50 kW | 2 | Ground-mounted | 99.1: 3 m × 12 m 99.2: 2.5 m × 5 m |
| 100 | 35°20′14.75″ Β/25°8′31.23″ A | Passenger (single-family) cars | AC 22 kW | 1 | Ground-mounted | 100.1: 3.5 m × 5 m |
| 101 | 35°20′17.37″ Β/25°8′9.77″ A | Passenger (single-family) cars | AC 22 kW | 1 | Ground-mounted | 101.1: 3.5 m × 5 m |
| 102 | 35°20′26.24″ Β/25°7′18.22″ A | Passenger (single-family) cars | AC 22 kW | 1 | Ground-mounted | 102.1: 3.5 m × 5 m |
| 103 | 35°20′0.46″ Β/25°7′19.66″ A | Passenger (single-family) cars | AC 22 kW | 2 | Ground-mounted | 103.1: 3.5 m × 5 m 103.2: 2.5 m × 5 m |
| 104 | 35°20′16.29″ Β/25°8′5.16″ A | Two-wheelers | AC 3.7 kW | 4 | Ground-mounted | 104.1: 1.3 m × 2.8 m 104.2: 1.3 m × 2.8 m 104.3: 1.3 m × 2.8 m 104.4: 1.3 m × 2.8 m |
| 105 | 35°20′32.94″ Β/25°7′52.42″ A | Two-wheelers | AC 3.7 kW | 4 | Ground-mounted | 105.1: 1.3 m × 2.8 m 105.2: 1.3 m × 2.8 m 105.3: 1.3 m × 2.8 m 105.4: 1.3 m × 2.8 m |
| 106 | 35°20′28.56″ Β/25°7′42.45″ A | Passenger (single-family) cars | Fast charger, DC 50 kW | 2 | Ground-mounted | 106.1: 2.5 m × 5 m 106.2: 2.5 m × 5 m |
| 107 | 35°20′22.55″ Β/25°7′55.04″ A | Two-wheelers | AC 3.7 kW | 4 | Ground-mounted | 107.1: 1.3 m × 2.8 m 107.2: 1.3 m × 2.8 m 107.3: 1.3 m × 2.8 m 107.4: 1.3 m × 2.8 m |
| 108 | 35°20′19.84″ Β/25°8′12.58″ A | Two-wheelers | AC 3.7 kW | 4 | Ground-mounted | 108.1: 1.3 m × 2.8 m 108.2: 1.3 m × 2.8 m 108.3: 1.3 m × 2.8 m 108.4: 1.3 m × 2.8 m |
| 109 | 35°20′10.40″ Β/25°8′3.31″ A | Two-wheelers | AC 3.7 kW | 4 | Ground-mounted | 109.1: 1.3 m × 2.8 m 109.2: 1.3 m × 2.8 m 109.3: 1.3 m × 2.8 m 109.4: 1.3 m × 2.8 m |
| 110 | 35°20′33.41″ Β/25°8′14.10″ A | Passenger (single-family) cars | AC 22 kW | 2 | Ground-mounted | 110.1: 2.5 m × 5 m 110.2: 2.5 m × 5 m |
| 111 | 35°20′33.55″ Β/25°8′14.29″ A | Passenger (single-family) cars | AC 22 kW | 2 | Ground-mounted | 111.1: 2.5 m × 5 m 111.2: 2.5 m × 5 m |
| 112 | 35°20′11.24″ Β/25°10′23.11″ A | Τaxis | Fast charger, DC 50 kW | 2 | Ground-mounted | 112.1: 2.5 m × 5 m 112.2: 2.5 m × 5 m |
| 113 | 35°19′18.09″ Β/25°9′29.15″ A | Buses + passenger cars | Fast charger, DC 50 kW | 2 | Ground-mounted | 113.1: 3 m × 14 m 113.2: 2.5 m × 5 m |
| 114 | 35°18′44.28″ Β/25°8′41.85″ A | Passenger (single-family) cars | AC 22 kW | 2 | Ground-mounted | 114.1: 2.5 m × 5 m 114.2: 2.5 m × 5 m |
| 115 | 35°18′48.80″ Β/25°8′38.27″ A | Two-wheelers | AC 3.7 kW | 4 | Ground-mounted | 115.1: 1.3 m × 2.8 m 115.2: 1.3 m × 2.8 m 115.3: 1.3 m × 2.8 m 115.4: 1.3 m × 2.8 m |
| Ε116 | 35°19′28.24″ Β/25°10′55.35″ A | Minibuses (ECOROUTS project) | DC 2 × 6 kW | 1 | Ground-mounted | 104.1: 2.5 m × 6.5 m |
| Ε117 | 35°19′28.31″ Β/25°10′55.55″ A | Minibuses (ECOROUTS project) | DC 2 × 6 kW | 1 | Ground-mounted | 104.2: 2.5 m × 6.5 m |
| Ε118 | 35°20′3.91″ Β/25°9′31.16″ A | Passenger (single-family) cars | AC 22 kW | 1 | Ground-mounted | Ν/A |
| Ε119 | 35°20′12.60″ Β/25°9′20.80″ A | Passenger (single-family) cars | AC 7 kW | 1 | Ground-mounted | Ν/A |
| Ε120 | 35°20′27.15″ Β/25°8′7.75″ A | Passenger (single-family) cars | AC 22 kW | 2 | Wall-mounted | Ν/A |
| Ε121 | 35°20′17.00″ Β/25°7′19.60″ A | Passenger (single-family) cars | AC 22 kW | 1 | Ground-mounted | Ν/A |
| Ε122 | 35°18′7.88″ Β/25°5′30.94″ A | Passenger (single-family) cars | AC 22 kW | 1 | Ν/A | Ν/A |
References
- Sanguesa, J.A.; Torres-Sanz, V.; Garrido, P.; Martinez, F.J.; Marquez-Barja, J.M. A review on electric vehicles: Technologies and challenges. Smart Cities 2021, 4, 372–404. [Google Scholar] [CrossRef]
- Asuah, A.; Zumelzu, A. Measuring urban diversities in cities in transformation: Case of Temuco, Chile. IOP Conf. Ser. Earth Environ. Sci. 2020, 503, 012085. [Google Scholar] [CrossRef]
- Yigitcanlar, T.; Cugurullo, F. The sustainability of artificial intelligence: An urbanistic viewpoint from the lens of smart and sustainable cities. Sustainability 2020, 12, 8548. [Google Scholar] [CrossRef]
- Jabareen, Y.R. Sustainable urban forms: Their typologies, models, and concepts. J. Plan. Educ. Res. 2006, 26, 38–52. [Google Scholar] [CrossRef]
- International Energy Agency. Global EV Outlook 2016; OCED: Paris, France, 2016. [Google Scholar]
- Bayissa, B.B.; Baiqing, S.; Lixin, Q. Sustainable transport infrastructure and economic returns: A bibliometric and visualization analysis. Sustainability 2020, 12, 2033. [Google Scholar]
- Pollák, F.; Vodák, J.; Soviar, J.; Markovič, P.; Lentini, G.; Mazzeschi, V.; Luè, A. Promotion of electric mobility in the European Union—Overview of project PROMETEUS from the perspective of cohesion through synergistic cooperation on the example of the catching-up region. Sustainability 2021, 13, 1545. [Google Scholar] [CrossRef]
- Dijk, M.; Orsato, R.J.; Kemp, R. The emergence of an electric mobility trajectory. Energy Policy 2013, 52, 135–145. [Google Scholar] [CrossRef]
- Efthymiou, D.; Chrysostomou, K.; Morfoulaki, M.; Aifantopoulou, G. Electric vehicles charging infrastructure location: A genetic algorithm approach. Eur. Transp. Res. Rev. 2017, 9, 27. [Google Scholar] [CrossRef] [Green Version]
- Farid, A.M.; Viswanath, A.; Al-Junaibi, R.; Allan, D.; Van der Wardt, T.J.T. Electric vehicle integration into road transportation, intelligent transportation, and electric power systems: An Abu Dhabi case study. Smart Cities 2021, 4, 1039–1057. [Google Scholar] [CrossRef]
- Statharas, S.; Moysoglou, Y.; Siskos, P.; Zazias, G.; Capros, P. Factors influencing electric vehicle penetration in the EU by 2030: A model-based policy assessment. Energies 2019, 12, 2739. [Google Scholar] [CrossRef] [Green Version]
- Thiel, C.; Tsakalidis, A.; Jäger-Waldau, A. Will electric vehicles be killed (again) or are they the next mobility killer app? Energies 2020, 13, 1828. [Google Scholar] [CrossRef] [Green Version]
- Dimitropoulou, M.; Tsikalakis, A.; Gigantidou, A.; Thalassinakis, E.; Pylarinos, D. Estimation of Hosting Electric Vehicles Capacity in the Transformers on the Island of Crete; Engineering and Industry Series; Volume Power Systems, Energy Markets and Renewable Energy Sources in South-Eastern Europe; Trivent Publishing: Budapest, Hungary, 2016; pp. 235–246. [Google Scholar]
- Morais, H.; Sousa, T.; Vale, Z.; Faria, P. Evaluation of the electric vehicle impact in the power demand curve in a smart grid environment. Energy Convers. Manag. 2014, 82, 268–282. [Google Scholar] [CrossRef] [Green Version]
- Knezovic, K.; Marinelli, M.; Zecchino, A.; Andersen, P.B.; Traeholt, C. Supporting involvement of electric vehicles in distribution grids: Lowering the barriers for a proactive integration. Energy 2017, 134, 458–468. [Google Scholar] [CrossRef] [Green Version]
- Wu, F.; Sioshansi, R. A two-stage stochastic optimization model for scheduling electric vehicle charging loads to relieve distribution-system constraints. Transp. Res. B 2017, 102, 55–82. [Google Scholar] [CrossRef]
- Hu, J.; You, S.; Lind, M.; Østergaard, J. Coordinated charging of electric vehicles for congestion prevention in the distribution grid. IEEE Trans. Smart Grid 2014, 5, 703–711. [Google Scholar] [CrossRef] [Green Version]
- Zagorskas, J.; Burinskienė, M. Challenges caused by increased use of e-powered personal mobility vehicles in european cities. Sustainability 2020, 12, 273. [Google Scholar] [CrossRef] [Green Version]
- Ribeiro, P.; Dias, G.; Pereira, P. Transport systems and mobility for smart cities. Appl. Syst. Innov. 2021, 4, 61. [Google Scholar] [CrossRef]
- Wang, C.; Steinfeld, E.; Maisel, J.; Kang, B. Is your smart city inclusive? Evaluating proposals from the U.S. department of transportation’s smart city challenge. Sustain. Cities Soc. 2021, 74, 103148. [Google Scholar] [CrossRef]
- Karfopoulos, E.; Hatziargyriou, N. A multi-agent system for controlled charging of a large population of electric vehicles. IEEE Trans. Power Syst. 2013, 28, 1196–1204. [Google Scholar] [CrossRef]
- Karfopoulos, E.; Hatziargyriou, N. Distributed coordination of electric vehicles for conforming to an energy schedule. Electr. Power Syst. Res. 2017, 151, 86–95. [Google Scholar] [CrossRef]
- Spanoudakis, P.; Tsourveloudis, N.C.; Doitsidis, L.; Karapidakis, E.S. Experimental research of transmissions on electric vehicles’ energy consumption. Energies 2019, 12, 388. [Google Scholar] [CrossRef] [Green Version]


| Vehicle | No. of Charging Stations | Number of Parking Spaces |
|---|---|---|
| Passenger cars | 75 | 160 |
| Taxis | 12 | 17 |
| Two-wheelers | 6 | 24 |
| Buses | 25 | 35 |
| Passenger cars of people with disabilities | 4 | 4 |
| Total | 122 | 240 |
| Charging Voltage | |||
|---|---|---|---|
| Single-Phase 230V | Three-Phase 400V | ||
| Charging current | 16 A | 3.70 kW | 11.00 kW |
| 32 A | 7.40 kW | 22.00 kW | |
| 100 A | - | 50.00 kW | |
| 160 A | - | 100.00 kW | |
| Substation | Installed Capacity (MVA) | Current Peak Power Demand (MW) |
|---|---|---|
| Heraklion I | 2 × 50 | 62 |
| Heraklion II | 3 × 50 | 86 |
| Heraklion III | 2 × 50 | 42 |
| Total | 350 | 190 |
| Substation | Average Available Power (MW) | EV Hosting Range |
|---|---|---|
| Heraklion I | 2 × 7.4 | 802–1335 |
| Heraklion II | 3 × 9.1 | 1532–2554 |
| Heraklion III | 2 × 17.2 | 1862–3104 |
| Total | 77.5 | 4196–6993 |
| Substation | Average Available Power (MW) | EV Hosting Range |
|---|---|---|
| Heraklion I | 2 × 7.4 | 400–668 |
| Heraklion II | 3 × 9.1 | 985–1642 |
| Heraklion III | 2 × 17.2 | 931–1552 |
| Total | 77.5 | 2316–3862 |
Publisher’s Note: MDPI stays neutral with regard to jurisdictional claims in published maps and institutional affiliations. |
© 2021 by the authors. Licensee MDPI, Basel, Switzerland. This article is an open access article distributed under the terms and conditions of the Creative Commons Attribution (CC BY) license (https://creativecommons.org/licenses/by/4.0/).
Share and Cite
Karapidakis, E.; Tsikalakis, A.; Paspatis, A.; Fotakis, E.; Stavrakakis, G.; Chatzipoulka, C.; Zervas, P. Grid Operation Assessment under a Specific EV Chargers Deployment Plan in the City of Heraklion. Electronics 2021, 10, 2831. https://doi.org/10.3390/electronics10222831
Karapidakis E, Tsikalakis A, Paspatis A, Fotakis E, Stavrakakis G, Chatzipoulka C, Zervas P. Grid Operation Assessment under a Specific EV Chargers Deployment Plan in the City of Heraklion. Electronics. 2021; 10(22):2831. https://doi.org/10.3390/electronics10222831
Chicago/Turabian StyleKarapidakis, Emmanuel, Antonis Tsikalakis, Alexandros Paspatis, Emmanuel Fotakis, George Stavrakakis, Christina Chatzipoulka, and Panagiotis Zervas. 2021. "Grid Operation Assessment under a Specific EV Chargers Deployment Plan in the City of Heraklion" Electronics 10, no. 22: 2831. https://doi.org/10.3390/electronics10222831