
A Novel Android Botnet Detection System Using Image-Based and Manifest File Features


1
Cyber Technology Institute, Faculty of Computing, Engineering and Media, De Montfort University, Leicester LE1 9BH, UK
2
Department of Computer Engineering, Prince Mohammad Bin Fahd University, Khobar 31952, Saudi Arabia
*
Author to whom correspondence should be addressed.
Electronics 2022, 11(3), 486; https://doi.org/10.3390/electronics11030486
Submission received: 31 December 2021
/
Revised: 29 January 2022
/
Accepted: 3 February 2022
/
Published: 8 February 2022
(This article belongs to the Special Issue High Accuracy Detection of Mobile Malware Using Machine Learning)
Abstract
:Malicious botnet applications have become a serious threat and are increasingly incorporating sophisticated detection avoidance techniques. Hence, there is a need for more effective mitigation approaches to combat the rise of Android botnets. Although the use of Machine Learning to detect botnets has been a focus of recent research efforts, several challenges remain. To overcome the limitations of using hand-crafted features for Machine-Learning-based detection, in this paper, we propose a novel mobile botnet detection system based on features extracted from images and a manifest file. The scheme employs a Histogram of Oriented Gradients and byte histograms obtained from images representing the app executable and combines these with features derived from the manifest files. Feature selection is then applied to utilize the best features for classification with Machine-Learning algorithms. The proposed system was evaluated using the ISCX botnet dataset, and the experimental results demonstrate its effectiveness with F1 scores ranging from 0.923 to 0.96 using popular Machine-Learning algorithms. Furthermore, with the Extra Trees model, up to 97.5% overall accuracy was obtained using an 80:20 train–test split, and 96% overall accuracy was obtained using 10-fold cross validation.
1. Introduction
The prevalence of mobile malware globally is a well-known phenomenon as increasing malware of different types continue to target mobile platforms and particularly Android. The McAfee Threat report of June 2021 stated that around 7.73 million new mobile malware samples were seen in 2020 alone [1]. The report further revealed that 2.34 million new mobile malwares had already been discovered in the wild during the first quarter of 2021.
Android, being an open source mobile and IoT platform that also permits users to install apps from diverse sources is the prime target for mobile malware. Unverified and/or re-packaged apps can be downloaded and installed on an Android device from virtually any online third-party source other than the official Google play store. Even though the Google play store benefits from screening services to prevent the distribution of malicious apps, cleverly crafted malware, such as the Chamois botnet [2,3,4], were still able to bypass protection mechanisms and infect millions of users worldwide.
Chamois was distributed through Google play and third-party app stores and infected over 20.8 million Android devices between November 2017 and March 2018. The first generation of the Chamois botnet was primarily distributed through fake apps, and initial eradication efforts by anti-malware professionals almost completely eliminated the threat. The creators of the botnet responded by adopting a more sophisticated distribution model that bundled Chamois into a fake payment solution for device manufacturers and a fake advertising SDK for developers.
As mobile devices—especially smartphones—tend to be online for long periods, they provide a suitable platform for operating botnets when they have been compromised. Mobile botnets are controlled using SMS or web-based commands and control channels and are used for various attacks, such as Distributed Denial of Service (DDoS), phishing attacks, spam distribution, click fraud, credential stuffing etc. A study by Imperva on mobile botnet activity revealed that 5.8 million bot-infected mobile devices were used to launch credential stuffing attacks on websites and apps over a 45-day period on six major cellular networks [5].
DDoS attacks are high volume and high frequency and are thus easily detected by traditional network intrusion detection systems. By contrast, credential stuffing attacks from botnets are characterized by low frequency and low volume network traffic and are therefore more challenging to detect. Thus, complementary approaches to network-based detection are needed to strengthen defense against mobile botnet infection and attacks.
As mobile malware continues to increase and become more sophisticated, research efforts directed at detecting and mitigating Android malware has intensified in recent years. Several Machine-Learning-based detection systems have been proposed in the current literature to combat the rising incident of Android malware, including botnets [6,7,8]. Such systems rely on statically or dynamically extracted features for training the Machine-Learning models. In many cases, these features are either hand-crafted and/or depend heavily on domain expertise to effectively extract them. As the Android OS evolves, many of these hand-crafted features may become deprecated or obsolete and the entire feature extraction process will need to be re-engineered.
The utilization of image processing techniques to extract features from image-based representation of the application has the distinct advantage of eliminating the need to rely on hand-crafted features to build Machine-Learning models. Moreover, with image-based approach, little or no modification will be required to adapt to platform/OS evolution, and this leads to long-term efficiency compared to systems based on hand-crafted features.
Hence, in this paper, we propose a system that utilizes an image processing technique called Histogram of Oriented Gradients, to extract features for training Machine-Learning models to detect Android botnets. Our proposed system is a novel scheme that detects Android botnets based on Histogram of Oriented Gradients (HOG). In the scheme, the HOG features are combined with byte histograms and features from the app manifest file to improve prediction accuracy. Furthermore, we demonstrate the feasibility of our approach using a dataset of Android botnets and benign samples.
The rest of the paper is organized as follows: In Section 2, we provide an overview of related work. Section 3 describes our proposed system, while in Section 4, we outline the study undertaken to evaluate the system. Section 5 presents and discusses the results of the evaluation. Finally, in Section 6, we conclude the paper and give an outline of future work.
2. Related Work
There is extensive literature regarding the Machine-Learning-based detection of mobile malware, and [9,10], provide recent surveys on the topic. Here, we provide an overview of related works in Android botnet detection as well as image-based detection of malicious applications.
2.1. Image-Based Analysis of Malicious Applications
In [11], a method for image-based malware classification using an ensemble of CNN architectures was proposed. This was based on the malimg dataset where the raw images were used as input to the CNN-based classification system. Additionally, a malware dataset of 96 packed executables was also used and converted into images to evaluate the proposed system. The images were divided into training and validation sets based on a 70:30 split.
The method consisted of using transfer learning with fine-tuned ResNet-50 and VGG16 models that were pre-trained on ImageNet data. The output of these models obtained through SoftMax classifiers were fused with a version of the output that had been reduced using PCA and fed to a one-vs-all multiclass SVM classifier. In their experiments, they obtained a classification accuracy of up to 99.50% with unpacked samples and 98.11% and 97.59% for packed and salted samples, respectively.
In [12], the authors presented a method to recognize malware by capturing the memory dump of suspicious processes and representing them as RGB images. The study was based on 4294 malware samples consisting of 10 families and benign executables and several Machine-Learning classifiers, including J48, SMO with RBF kernel, Random Forest, Linear SVM and XGBoost. Dimensionality reduction was achieved using UMAP based manifold learning strategy. A combination of GIST and HOG features were used to extract features from the RGB images. The method yielded the highest prediction accuracy of up to 96.39% using the SMO classifier.
In [13], Bozkir et al. evaluated several CNN architectures for PE malware classification using coloured images. They used the Malevis Dataset containing 12,394 malware files and split this into 8750 training and 3644 testing samples. From their experiments, they obtained an accuracy of 97.48% using the DenseNet architecture.
Nataraj et al. [14] used grayscale images to visualize malware binaries to distinguish between different families. GIST was used to extract features from the images, and using KNN as a classifier they achieved 97.18% classification accuracy on experiments with a dataset consisting of 9458 malware samples from 25 families. In another paper [15] by the same authors, similar results were obtained when they applied image processing with dynamic analysis, in order to address both packed and unpacked malware.
Kumar et al. [16] proposed a method that uses an autoencoder enhanced deep convolutional neural network (AE-DCNN) to classify malware images into their respective families. A novel training mechanism is proposed where a DCNN classifier is trained with the help of an encoder. The encoder is used to provide extra information to the CNN classifier that may be lost during the forward propagation thus resulting in better performance. On the standard malimg dataset, 99.38% accuracy and F1-score of 99.38% were reported.
In [17], Fine Tuning and Transfer Learning approaches were used for multi-class classification of malware images. Eight different fine-tuned CNN-based transfer learning models were developed for vision-based malware multi-classification applications. These included VGG16, AlexNet, DarkNet-53, DenseNet-201, Inception-V3, Places365-GoogleNet, REsNet-50 and MobileNet-V2. Experiments based on the malimg dataset showed high performance with 99.97% accuracy.
Similarly, in [18], the IMCFN system i.e., image-based malware classification using fine-tuned convolutional neural network architecture, was presented. IMCFN converts raw malware binary into color images that are used by fine-tuned CNN architecture to classify malware. It fine-tunes a previously trained model based on ImageNet dataset and uses data augmentation to address class imbalance. The method was evaluated using malimg and an IoT-android mobile dataset containing 14,733 malware and 2486 benign samples. With the malimg dataset, an accuracy of 98.82% was obtained, while 97.35% accuracy was obtained for the IoT-android mobile dataset.
Xiao et al. [19] proposed a malware classification framework, MalFCS based on malware visualization and automated feature extraction. Malware binaries are visualized as entropy graphs based on structural entropy, while a deep convolutional neural network is used as a feature extractor to automatically extract patterns shared by a family from entropy graphs. An SVM classifier was used to classify malware based on the extracted features. The method achieved 99.7% accuracy when evaluated on the malimg dataset and 100% accuracy when evaluated on the Microsoft dataset.
Awan et al. also proposed an image-based malware classification system, which was investigated using malimg data [20]. The VGG19 model was used with transfer learning as a feature extractor, while a CNN model enhanced by a spatial attention mechanism was used to enhance the system. The attention-based model achieved an accuracy of 97.68% in the classification of the 25 families using a 70:30 training and testing split.
In [21], DenseNet was used with the final classification layer adopting a reweighted class-balanced loss function in the final classification layer to address data imbalance issues and improve performance. Experiments performed on malimg dataset yielded 98.23% accuracy while 98.46%, 98.21% and 89.48% accuracies were obtained with BIG 2015, MaleVis and Malicia datasets, respectively.
In [22,23], local binary patterns (LBP) were used while [24] used Intensity, Wavelet and Gabor to extract grayscale image features. Han et al. [25], used entropy graphs and similarity measures between entropy images for malware family classification. They obtained an accuracy of 97.9% by experimenting with 1000 malware samples from 50 families. In [26], the authors first disassembled binary executables and then converted the opcode sequences into RGB images. They evaluated their approach on 9168 malware and 8640 benign binaries achieving 94.8% to 96.5% accuracy.
Dai et al. [27] proposed a method for identifying malware families aimed at addressing the deficiencies of dynamic analysis approaches, by extracting a memory dump file and converting it to a grayscale image. They used the Cuckoo sandbox and built the procdump program into the sandbox, while using the ma command to extract the dump of the monitored process. Histogram of Gradient (HOG) was used to extract features from the image file and train KNN, Random Forest and MLP classifiers. Experiments were performed on 1984 malware samples from the Open Malware Benchmark dataset, and MLP performed best with an accuracy of 95.2% and F1-score of 94.1%.
Although these works highlight the success of employing image-based techniques in malware related work, their focus has largely been on Windows (PE) malware and family classification. By contrast, this paper uses image-based techniques for detection of botnets on the Android platform based on a novel approach to utilize HOG with manifest file features.
In a recent paper that focused on Android, Singh et al. [28] proposed a system called SARVOTAM that converts malware non-intuitive features into fingerprint images to extract quality information. Automatic extraction of rich features from visualized malware is then enabled using CNN, ultimately eliminating feature engineering and domain expert cost. They used 15 different combinations of Android malware image sections to identify and classify malware and replaced the softmax layer of CNN with ML algorithms like KNN, SVM and Random Forest to analyze grayscale malware images. It was observed that CNN-SVM outperformed the original CNN as well as CNN-KNN and CNN-RF. The experiments performed on the DREBIN dataset achieved 92.59% accuracy using Android certificates and manifest malware images.
2.2. Botnet Detection on Android
In [29], the authors proposed a signature-based, real-time SMS botnet detection system that applies pattern-matching for incoming and outgoing SMS messages. This is followed by a second step that uses rule-based techniques to label SMS messages as suspicious or normal. They performed experiments to evaluate their system with more than 12,000 messages. The system detected all 747 malicious SMS messages but also had a high false positive rate with 349 normal SMS messages misclassified as malicious.
Jadhav et al. presented a cloud-based Android botnet detection system in [30], based on strace, netflow, logcat, sysdump and tcpdump. Although this is a real-time dynamic analysis system, one major drawback is the ability of sophisticated botnets to detect and evade the cloud environment. Moreover, detecting Android botnets using a cloud-based dynamic analysis system based on several types of traces is more resource intensive compared to an image-based static analysis system.
Moodi et al. [31], presented an approach to detect Android botnets based on traffic features. Their method was based on SVM where a new approach called smart adaptive particle swarm optimization support vector machine (SAPSO-SVM) is developed to adapt the parameters of the optimization algorithm. The proposed approach identified the top 20 traffic features of Android botnets from the 28-SABD Android botnet dataset.
Bernardeschia et al. [32], used model checking to identify Android botnets. Static analysis is used to derive a set of finite state automata from the Java byte code that represents approximate information about the run-time behaviour of an app. However, the authors only evaluated their approach using 96 samples from the Rootsmart botnet family and 28 samples from the Tigerbot family in addition to 1000 clean samples.
Anwar et al. [33], proposed a static technique that consists of four layers of botnet security filters. The four layers consist of MD5 signatures, permissions, broadcast receiver and background services modules. Based on these, classification models were built using SVM, KNN, J48, Bagging, Naive Bayes and Random Forest. Experiments were performed on 1400 mobile botnet applications from the ISCX Android botnet dataset and 1400 benign applications. They observed the best result of 95.1% accuracy from the results of their experiments. In [34], the Android Botnet Identification System (ABIS) was proposed based on static and dynamic features using API calls, network traffic and permissions. These features were used to train several Machine-Learning classifiers, where Random Forest showed the best performance by obtaining a precision score of 0.972 and a recall score of 0.960.
Yusof et al. proposed a botnet classification system based on permission and API calls in [35]. They used feature selection to select 16 permissions and 31 API calls that were subsequently used to train Machine-Learning algorithms using the WEKA tool. The experiments were performed on 6282 benign and malicious samples using Naive Bayes, KNN, J48, Random Forest and SVM. Using both permission and API call features, Random Forest obtained the best results with 99.4% TP rate, 16.1% FP rate, 93.2% precision and 99.4% recall. This work was extended in [36] to include system calls and this resulted in improved performance with Random Forest achieving 99.4% TP rate, 12.5% FP rate, 98.2% precision, 99.4% recall and 97.9% accuracy.
In [37], a system for Android botnet detection using permissions and their protection levels were proposed. Random Forest, MLP, Naive Bayes and Decision Trees were used as Machine-Learning classifiers, with the experiments conducted using 1635 benign and 1635 botnet applications from the ISCX botnet datasets. Random Forest achieved 97.3% accuracy, 98.7% recall and 98.5% precision as the best result.
In [38], Android botnet classification (ABC) was proposed as a Machine-Learning-based system using requested permissions as features with Information Gain feature selection applied to select the most significant requested permissions. Naive Bayes, Random Forest and J48 were used as classifiers and experiments showed that Random Forest had the highest detection accuracy of 94.6%, lowest FP rate of 9.9%, with precision of 93.1% and recall of 94.6%. The experiments were performed on 2355 Android applications (1505 samples from the ISCX botnet dataset and 850 benign applications).
Karim et al. proposed DeDroid in [39], as a static analysis approach to extract critical features specific to botnets that can be used in the detection of mobile botnets. They achieved this by observing the code behaviour of known malware binaries that possess command and control features. In [40], an Android botnet detection system based on deep learning was proposed. The system is based on 342 static features including permissions, API calls, extra files, commands and intents. The model was evaluated using 6802 samples including 1929 ISCX botnet dataset samples and 4873 clean applications.
The performance of CNN was compared to Naive Bayes, Bayes Net, Random Forest, Random Tree, Simple Logistic, ANN and SVM. The CNN-based model achieved the best performance with 98.9% accuracy, 98.3% precision, 97.8% recall and 98.1% F1-score. In [8], a comprehensive study of deep learning techniques for Android botnet detection was presented using the same dataset and static features utilized in [40]. CNN, DNN, LSTM, GRU, CNN-LSTM and CNN-GRU models were studied, and the overall best result from DNN was 99.1% accuracy, 99% precision, 97.9% recall and 98.1% F1-score.
This cross-section of Android botnet detection systems summarized above indicates that in the current literature, most proposed solutions are based on hand-crafted (static or dynamic features) or rely on in-depth (Android) domain knowledge, unlike the system proposed in this paper. Furthermore, compared to image-based approaches, hand-crafted features may not be sustainable in the long run because as the Android OS evolves, new features are added while some old ones may become deprecated. This will require significant re-engineering of hand-crafted based systems to cope with the OS/platform evolution.
Some recent papers have begun exploring image-based techniques for Android botnet detection. In [41], the Bot-IMG framework was used to extract HOG descriptors and train Machine-Learning-based classifiers to distinguish botnets from benign applications. An enhanced HOG scheme was proposed, which enabled improved accuracy performance with the use of autoencoders. The system was evaluated with experiments performed using 1929 ISCX botnet applications and 2500 benign applications.
KNN, SVM, Random Forest, XGBoost and Extra Trees learning algorithms were trained using the HOG-based schemes. With Extra Trees, the best result from 10-fold cross validation was obtained using autoencoder and gave 93.1% accuracy with 93.1% F1-score. In [42], the authors used permissions to generate images based on a co-occurrence matrix. The images were used to train a CNN model to classify applications into benign or botnet. The experiments were performed on 3650 benign applications and 1800 botnet applications from the ISCX dataset. Their best result was 97.2% accuracy, 96% recall, 95.5% precision and 95.7% F1-score.
Different from [41,42], the system presented and evaluated in this paper is a novel botnet detection system based on image features (i.e., HOG, byte histograms) and manifest features (i.e., permissions, intents). All of these features come from a single pre-processed composite image derived from automated reverse engineering of the Android applications. In this paper, we demonstrate the feasibility and performance of the proposed scheme by using it to train and evaluate several popular Machine-Learning classifiers on a dataset of 1929 ISCX botnet applications and 2500 benign applications.
3. Proposed HOG-Based Android Botnet Detection System
Our proposed system is based on the Bot-IMG framework [41], which enables automated reverse engineering of the Android applications, image generation and subsequent extraction of image-based and manifest features. Figure 1 shows an overview of the system for HOG-based Android botnet detection. As shown in the figure, the first step involves reverse engineering the apks to extract the various files contained in the application.
Out of all the files present in an apk, only the manifest file and the Dalvik executable (dex) file are utilized in the proposed system. The manifest file is processed using AXMLPrinter2 tool, which converts it into a readable text file that is scanned to generate a set of 187 features consisting of permissions and intents. These features extracted from the manifest file are encoded for gray-scale representation.
Thus, the presence of a feature is denoted by 255 (or white), while a 0 (i.e., black) is recorded if the feature is absent and these are stored in an array of manifest features. The dex file is converted to a byte array consisting of integer encoded bytes ranging from 0 to 255. This byte array from the executable is combined with the array of manifest features. The combined array is then used to generate a composite gray-scale image representing the application.
The image files are processed by the feature extraction engine using the algorithm described in Section 3.2 to generate feature vectors for each application used in the training of the Machine-Learning models. During the training of a model, a feature selection algorithm is applied to select the best features. The trained model is then used to detect botnet apps by classifying an unknown application into ‘botnet’ or ‘benign’. The proposed system is based on HOG, byte histograms and manifest features. We provide a brief description of HOG in the following section.
3.1. Histogram of Oriented Gradients
HOG, first proposed for human detection by Dalal and Triggs [43] is a popular image descriptor that has found wide application in computer vision and pattern recognition. For example, it has been applied to handwriting recognition [44], recognition of facial expressions [45], pedestrian detection system for autonomous vehicles [46]. HOG is considered to be an appearance descriptor because it counts occurrences of gradient orientation in localized portions of an image. Due to the simple computations involved, HOG is generally a fast descriptor compared to Local Binary Patterns (LBP) or Scale Invariant Feature Transforms (SIFT).
HOG descriptors are computed on a dense grid of uniformly spaced cells and overlapping local contrast normalizations are used for improved performance. For each pixel, magnitude and orientation can be computed using the following formulae:
where and are calculated from the neighboring pixels in the horizontal and vertical directions respectively. Figure 2 illustrates how the histograms are generated for a cell, using the highlighted pixel as an example. For the pixel represented by number 65, the change in x direction is 69 − 54 = 15, and the change in y direction is 78 − 30 = 48. Using the Equations (1) and (2), the total magnitude while the orientation . To generate the histogram for the cell, using nine bins representing the orientations separated 20 degrees apart, each pixel’s contribution will be added to the bin according to orientation.
For example, in Figure 2, the orientation is , which is between 60 degrees and 80 degrees. Thus, the magnitude is split between these two bins by using the following weighting approach where the distances from the bin orientations are used. Hence, we have and as the weights that will be used to split the 50.3 magnitude between the bins. This means that the split will result in 31.7 and 18.6 being placed in the 4th and 5th bins respectively. The process is repeated for all the pixels in the cell.
The binning of the magnitudes by taking the orientations into consideration, produces a histogram of gradient directions for the pixel magnitudes in a cell. If the number of bins is taken as 9, then, each cell will be represented by a array. In order to make the gradients less sensitive to scaling, the histogram array is normalized in blocks, where each block is made up of cells. Hence, taking will result in 4 cells per block. This means that each block will be represented by a vector or array (i.e., 4 cells × nine bins). Block normalization is based on the L2-norm computed as in Equation (3), where is a small constant:
In the default situation, the HOG algorithm takes an input image whose size is 128 × 64. Therefore, in the 128 × 64 pixel image, it turns out that if we take 8 × 8 pixels in each cell and 2 × 2 cells in each block, then this will result in 7 horizontal block positions and 15 vertical block positions. Hence, we get a total HOG vector length of 3780 (which is 36 × 7 × 15). As such, to get a HOG descriptor vector of length 3780 for an image, we are required to choose the following parameters: n = 9 (number of orientations); ppc = 8 × 8 (number of pixels per cell) and cpb = 2 × 2 (number of cells per block).
3.2. Characterizing Apps with Image and Manifest Features
The methodology for extracting the HOG descriptors and using them together with byte histogram and manifest features to characterize the apps, is discussed in this section. The steps involved in deriving the composite features for Machine-Learning-based detection approach are shown in Algorithm 1.
| Algorithm 1: Extracting image-based and manifest-based features. |
| Input: D = set of images with their class labels |
| Output: V = class labelled set of output vectors |
| 01: Initialize and , the arrays of size K = 8192 with zeros |
| 02: Initialize BH the byte histogram array of size 256 with zeros |
| 03: Initialize HOG parameters: , dim = 128 × 64; ppc = 8 × 8; cpb = 2 × 2 |
| 04: for each image I do |
| 05: Slice the image to separate the first 187 pixels |
| 06: Copy first slice having 187 pixels into a manifest vector |
| 07: // Obtain the HOG vector for the image |
| 08: Convert second slice into an array P of pixel decimal values |
| 09: Copy the first bytes into arrays |
| 10: Reshape to 128 × 64 size arrays |
| 11: Convert into images |
| 12: for each sub-image j do |
| 13: |
| 14: |
| 15: end |
| 16: |
| 17: // Obtain the byte histogram vector for the image |
| 18: |
| 19: for index = 0, 1, 2 …255 do |
| 20: count = 0 |
| 21: for do |
| 22: count = count +1 |
| 23: if count > max |
| 24: count = max |
| 25: end if |
| 26: end |
| 27: |
| 28: end |
| 29: // Obtain the overall output vector for the image |
| 30: |
| 31: end |
The required input is the set of images from benign and botnet apps, while the output will be a high dimensional vector V. The images generated from the apps are of different sizes. Thus, in order to utilize the original HOG descriptors generation approach proposed by Dalal and Triggs, the images must be reshaped to 128 × 64 pixels. However, it has been found that resizing the images diminishes the performance of the trained Machine-Learning models [41]. We therefore adopt a methodology that uses five patches or segments from the image with each segment being 128 × 64 pixels in size. In line 1 of Algorithm 1, the five arrays X1, X2, X3, X4 and X5 that will hold the pixels of the five segments are initialized with zeros.
This approach utilizes only the first 40,960 pixels of the images (after extracting the manifest features) making for a fast and efficient system. Once the five segments from the image are copied into the arrays, they are reshaped into 128 × 64 arrays and converted into 5 separate images. This is because the HOG descriptor function only takes images as input and not arrays. From line 12 to line 15 of Algorithm 1, five different HOG vectors are generated for each segment image, and in line 14, we sub-sample each of them to retain 500 descriptors. The 500 descriptors from each batch are then concatenated into a 2500 descriptor vector in line 16.
From line 17 to line 28 of Algorithm 1, a byte histogram is generated, but only for the same combined area where the HOG descriptors were extracted, i.e., the first 40,960 pixels of the application’s image. The byte histogram will consist of a vector of dimension 256 that will hold the occurrences of bytes (pixels) within that region. The occurrences are clipped and log-scaled as depicted in lines 23, 24 and 27 respectively, to keep the values between zero and 255. Finally, the overall feature vector V of dimension 2943 is generated by concatenating the extracted manifest vector (MV) with the final HOG vector () and the log-scaled byte histogram ().
3.3. Feature Selection Using CHI Square Algorithm
Since the image processing resulted in a high dimensional vector, we apply feature selection for dimensionality reduction and to improve the performance of the Machine-Learning classifiers. As we know, if there are more features resulting a high dimensional vector as an input to the classifier during the training phase, they will contribute to algorithmic complexity in terms of data storage and processing. As not all features contribute to the model’s performance in the classification phase, it is suitable that they be removed from the training phase as well. This process is termed as ‘Dimensionality Reduction’.
Dimensionality reduction can be achieved by “measuring” the contribution of each of the features to the model’s prediction performance. Those features that have insignificant contributions can be safely removed to enhance the training speed of the Machine-Learning model. Dimensionality reduction chooses those features, which are good contributors to the model performance, and hence this process is also called Feature Selection.
Various approaches for Feature Selection have been presented in the literature, such as Information Gain, Mutual Information, Principal Component Analysis and the Chi-Square test [47]. In our research, we chose to use the Chi-Square test, which results in a better prediction performance for our ML classifiers. The Chi-Square test is represented by the formula given in Equation (4):
where
= Chi-Squared value
= Observed value
= Expected value
In our case, the observed value could take one of the values of the input features variable and the expected value would be another feature variable. If there is a strong correlation between them (that is is too low) then it is enough to consider only one out of them and hence reduce one feature. Similarly, all possible combinations of the feature variables can be compared and sorted according to their Chi-Square values. Then, we can choose those feature variables that have high Chi-Square values from the list.
4. Experiments and Evaluation of the System
4.1. Dataset Description
The ISCX botnet dataset obtained from [48] has been used to evaluate the proposed system. The dataset consists of 1929 botnet apps of 14 different families. We complemented this dataset with 2500 clean apps from different categories on the Google play store and used VirusTotal for verification. Thus, our experiments were based on a total of 4429 applications from, which the images were generated and processed using the Bot-IMG framework.The clean applications can be made available to third parties on request.
4.2. Evaluation Metrics
The following metrics were used in measuring the performance of the models: accuracy, precision, recall and F1-score. All the results of the experiments are from 10-fold cross validation where the dataset is divided into 10 equal parts with 10% of the dataset held out for testing, while the models are trained from the remaining 90%. This is repeated until all of the 10 parts have been used for testing. The average of all 10 results is then taken to produce the final result. We also employed the 80:20 split approach where 80% of the samples were used for training and 20% for testing.
4.3. Machine-Learning Classifiers
In this section, a brief overview of the Machine-Learning classifiers is presented, which were used to distinguish between botnet and clean apps. In general these are algorithms, which are trained on the labelled data (input) and then the learned model is used for estimating the target variable (output, in this case, malicious botnet or clean app).
- 1.
- K-Nearest Neighbor (KNN): KNN is a supervised classifier that classifies an input data into a specific set of classes based on the distance metric among its nearest neighbors [49]. Various distance metrics are possible candidates for the K-NN algorithm, such as the Euclidean distance, Manhattan distance, City block distance and Hamming distance. Due to its simplicity, Euclidean distance is the preferred choice among these distance measures. The K-NN algorithm uses vectors in a multidimensional feature space as training examples, each having a class label. During the training phase the algorithm stores the feature vectors and their class labels for the purpose of learning the model. During the classification phase, an unlabeled vector is classified by assigning the label, which is most frequent among the k training samples. Here k is a user defined constant whose choice depends on the type of data to be classified.
- 2.
- Support Vector Machines (SVM): SVM classifies the input data into different classes by finding a hyperplane in a higher dimension space of the feature set to distinguish among various classes [50]. This technique transforms the input data, which is divided into separate classes non-linearly, by applying various types of kernel functions, such as linear, polynomial, Gaussian and radial basis functions. SVM follows the concept of minimizing the classification risk as opposed to optimizing the classification accuracy. As a result, SVMs have a better generalization capability and hence can be used in situations where the number of training samples are less and the data has large number of features. SVMs have been popularly used in text and image classification problems and also in voice recognition and anomaly detection (e.g., security, fraud detection and healthcare).
- 3.
- Decision Trees (DT): A Decision Tree uses a tree-like structure that models a labelled data [51]. Its structure consists of leaves and branches, which actually represent the classifications and the combinations of features that lead to those classifications, respectively. During the classification, an unlabeled input is classified by testing its feature values against the nodes of the decision tree. Two popular algorithmic implementations of Decision Trees are the ID3 and C4.5, which use the information entropy measurements to learn the tree from the set of the training data. The procedure followed when building the decision tree, is to choose the data attributes that most efficiently splits its set of inputs into smaller subsets. Normalised information gain is used as the criteria for performing the splitting process. Those attributes that have the highest normalized information gain are used in making the splitting decision.
- 4.
- Random Forest (RF): Random Forest belong to the class of classifiers that are known as the Ensemble Learning classifiers [52]. As the name suggests, RF is a collection of several decision trees that are created first and are then combined in a random manner to build a “forest of trees”. A random sample of data from the training set is utilised for training the constituent trees of the RF. It is observed that due the presence of mutiple DTs in the RF, it circumvents the over-fitting problem encountered in DTs. This is due to the fact that RF performs a “bagging” step that uses bootstrap aggregation to deal with the over-fitting problem. During the classification phase, the RF takes the test features as an input and each DT within the RF is used to predict the desired target variable. The final outcome of the algorithm is achieved by taking the prediction with maximum votes among the constituent DTs.
- 5.
- Extra Trees (ET): Extra Trees is also an ensemble Machine-Learning algorithm that combines the predictions from many decision trees [53]. The concept is similar to the Random Forests, however there are certain key differences between them. One of the difference lies in how they take the input data to learn the models. RF uses bootstrap replicas (sub-sampling of the data), where as the Extra Trees use the whole input data as it is. Another difference lies in how the the cut points are selected in order to split the nodes of the tree. RF chooses the split in an optimal manner, however the Extra Trees do it randomly. That is why another name for Extra Trees is Extremely Randomised Trees. As such, Extra Trees add randomisation to the training process, but at the same time maintains the optimization. In other words, Extra Trees reduce both the bias and variance and are a good choice for classification tasks as compared to Random Forests.
- 6.
- XGBoost (XGB): XGBoost also belongs to the category of Ensemble Learning classifiers similar to RF and ETs, mentioned above [54]. However, they are based on the concept of Boosting, rather than Bagging (which is implemented in RF). Boosting is a process of increasing the prediction capabilities of an ensemble of weak classifiers. It is actually an iterative process where the weights of the each of the constituent weak classifiers are adjusted based on their performance in making the predictions of the target variable. Boosting is an iterative method that uses random sampling of the data without replacement (as opposed to replacement used during the bagging process in the RF). In boosting, errors that occur in the prediction of earlier models are reduced by the predictions of future models. This step is very much different from the bagging process used in Random Forest classifiers that use an ensemble of “independently” trained classifiers.
5. Results and Discussions
In this section we present the results of the experiments performed to evaluate the performance of the proposed scheme described in Section 3. The proposed scheme was implemented with Python and the following libraries were utilized: OpenCV, PIL, Scikit-learn, Scikit-image, Pandas, Keras, Numpy, Seaborn and Matplotlib. The experiments were performed on an Ubuntu Linux 16.04 64-bit machine with 8 GB RAM.
Six popular Machine-Learning classifiers were used to evaluate the proposed scheme. These include: K-Nearest Neighbor (KNN), Random Forest (RF), Support Vector Machines (SVM), Decision Trees (DT), Extra Trees (ET) and XGBoost (XGB). We implemented two other schemes for baseline comparison of the Machine-Learning classifier performance. The first baseline scheme was the original HOG scheme where all the images in the training and test sets were resized to the standard 128 × 64 pixels and resulting in vectors of size 3780 used in training the models. The second baseline scheme used five segments to extract HOG descriptors in an identical way to our proposed scheme described by Algorithm 1 and used them to train the models without adding byte histograms or manifest features. We call the second baseline scheme the ‘enhanced HOG’ method.
In Table 1, the results of our proposed scheme using 10-fold cross validation are shown for the six Machine-Learning classifiers. We present the precision and recall for both malicious botnet class (M) and the benign or clean class (C). Note that the F1-scores presented in the table are weighted values, due to the difference in the numbers of samples in each class. The table shows that all of the classifiers obtained an overall accuracy performance of 92.3% or above, indicating that our proposed approach enables the training of high performing machine learning classifiers. The Extra Tree classifier had the highest weighted F1-score of 0.96, followed by Random Forest with 0.958 and XGBoost with 0.952. The lowest weighted F1-score was for KNN with 0.923 while SVM obtained a weighted F1-score of 0.926.
The Extra Trees classifier had the best precision and recall values except in the case of malware recall, which was 94.2% compared to that of Random Forest, which had 94.4%. SVM had the lowest malware class recall of 92.1% while KNN had the lowest benign class recall of 90.7%.
In Table 2, the results of the proposed scheme using a train–test split of 80:20 are presented. The table shows that all of the classifiers resulted in an overall accuracy of 93.7% or higher, with the Extra Tree classifier yielding an accuracy of 97.5%. The Extra Tree classifier had the highest weighted F1-score of 0.980 followed by XGBoost and Random Forest with 0.970 and Decision Trees with 0.950. SVM and KNN had the lowest weighted F1-score of 0.940. Extra Trees had the highest malware class recall of 97% while SVM had the lowest recall of 92% for malware. Extra Tree, XGBoost and RF had the highest recall for benign class with 98%, while SVM had the lowest one, with 92%. Based on these results Extra Trees model will be the classifier of choice for our proposed Android botnet detection system.
The results presented in Table 1 and Table 2 demonstrates the effectiveness of our proposed scheme. This is evident in the performance of the strongest and the weakest classifiers in the group. SVM and KNN were the weakest classifiers but still managed to yield quite high accuracies and F1-scores in both 10-fold cross validation and the split based evaluation. On the other hand, the strongest classifiers Extra Tress, RF and XGBoost produced results that were comparable to the state-of-the art in the literature.
It is possible that the few malicious botnets that were not detected by the system had characteristics that made them resemble benign apps. For example, botnets with relatively few permissions and intents, or those with HOG representation were very close to those of benign training examples. This could be addressed in future work by extracting additional types of features or complementing our proposed method with alternative methods, for example through an ensemble or voting approach.
In Table 3 and Figure 3, we compare the performance of the proposed scheme with the two baseline schemes (HOG original and HOG enhanced) using the overall classification accuracy as the metric. The accuracies of each of the Machine-Learning classifiers for the compared schemes can be seen side by side in Figure 3. The proposed scheme outperforms the baseline schemes in all of the Machine-Learning classifiers.
From Table 3, HOG original obtained the highest classification accuracy of 89.2% with the XGBoost classifier. This suggests that the resizing of the images during pre-processing has adverse effects on the performance of the models. The enhanced HOG scheme reached a highest accuracy of 92.7% also with XGBoost classifier. The scheme proposed in this paper, which additionally leverages byte histograms and encoded manifest features led to significantly improved performance.
In Figure 4, the average training times for the samples trained during the 10-fold cross validation experiments are shown. Note that the training includes the feature selection step. The XGBoost classifier needed about 14.49 s to train 3987 samples in the training set, equivalent to an average of 3.6 milliseconds per sample. The rest of the classifiers were much faster and required significantly lower average training times for the training sets as shown in Figure 4.
The highest accuracy classifier, Extra Trees, needed an average of 1.72 s for the training sets—equivalent to 0.43 milliseconds per sample. In the pre-processing stage, the average amount of time taken to extract the features per application was approximately 1.37 s. These relatively low pre-processing and training times required per application indicates that the proposed approach is feasible in practice.The fact that we successfully utilized off-the-shelf Python libraries to build and evaluate the proposed system also indicates that commercial implementation is viable.
Although we demonstrated the effectiveness of our proposed method by experimental results showing high performance with several classifiers, our observed results also compare favorably with existing works. Due to variations in environments, datasets, the numbers of samples, reported metrics etc., direct comparison is not always possible. However, the set of results reported in this paper either exceeds or is similar to what has been reported in recent related works.
For example, the work in [41] was based on the same dataset used in this paper but had a lower performance with 93.1% as the highest accuracy. The papers [33,38] also reported lower accuracies than our results. However, these works were based on a different dataset and used hand-crafted features. As mentioned before, such features on Android have the disadvantage of maintenance overhead in the long run. Moreover, it was shown in [55] that the performance of hand-crafted features used to build machine learning models declined over time.
6. Conclusions and Future Work
In this paper, we proposed a novel approach for the detection of Android botnets based on image and manifest features. The proposed approach removes the need for detection solutions to rely on extracting hand-crafted features from the executable file, which ultimately requires domain expertise. The system is based on a Histogram of Oriented Gradients (HOG) and additionally leverages a byte histogram and the manifest features. We implemented the system in Python and evaluated its performance using six popular Machine-Learning classifiers.
All of them exhibited good performance with Extra Trees, XGBoost and Random Forest obtaining better performance as compared to the state-of-the-art results. These results demonstrate the effectiveness of the proposed approach. An overall accuracy of 97.5% and F1-score of 0.980 were observed with Extra Trees when evaluated with the 80:20 split approach; while a 96% accuracy and 0.960 F1-score were observed when evaluated using a 10-fold cross validation approach. In future work, we plan to explore other types of image descriptors and investigate whether they could be leveraged to improve the performance of the HOG-based scheme.
Author Contributions
Conceptualization, S.Y.Y.; methodology, S.Y.Y.; software, S.Y.Y. and A.B.; validation, A.B. and S.Y.Y.; formal analysis, S.Y.Y.; investigation, S.Y.Y.; resources, A.B. and S.Y.Y.; data curation, S.Y.Y.; writing—original draft preparation, S.Y.Y.; writing—review and editing, A.B.; visualization, A.B.; supervision, A.B. and S.Y.Y.; project administration, A.B.; funding acquisition, A.B. and S.Y.Y. All authors have read and agreed to the published version of the manuscript.
Funding
There is no external funding.
Institutional Review Board Statement
Ethical review and approval were waived for this study, due to the usage of the dataset available from the public domain (University of New Brunswick) governed by the ethics and privacy laws at: https://www.unb.ca/cic/datasets/android-botnet.html, accessed on 28 December 2021.
Informed Consent Statement
Since the dataset was taken from University of New Brunswick (public domain) the informed consent was not applicable in our case.
Data Availability Statement
The botnet dataset used in this research work was taken from the public domain (University of New Brunswick) at: https://www.unb.ca/cic/datasets/android-botnet.html, accessed on 28 December 2021.
Acknowledgments
This work is supported in part by the 2021 Cybersecurity research grant from the Cybersecurity Center at Prince Mohammad Bin Fahd University, Al-Khobar, Saudi Arabia.
Conflicts of Interest
The authors declare no conflict of interest.
References
- McAfee. McAfee Labs Threat Report 06.21. Available online: https://www.mcafee.com/enterprise/en-us/assets/reports/rp-threats-jun-2021.pdf (accessed on 28 December 2021).
- Rashid, F.Y. Chamois: The Big Botnet You Didn’t Hear About. Available online: https://duo.com/decipher/chamois-the-big-botnet-you-didnt-hear-about (accessed on 28 December 2021).
- Brook, C. Google Eliminates Android Adfraud Botnet Chamois. Available online: https://threatpost.com/google-eliminates-android-adfraud-botnet-chamois/124311/ (accessed on 28 December 2021).
- Grill, B.; Ruthven, M.; Zhao, X. Detecting and Eliminating Chamois, a Fraud Botnet on Android. Available online: https://android-developers.googleblog.com/2017/03/detecting-and-eliminating-chamois-fraud.html (accessed on 28 December 2021).
- Imperva. Mobile Bots: The Next Evolution of Bad Bots. In Imperva; Report, 2019. Available online: https://www.imperva.com/resources/resource-library/reports/mobile-bots-the-next-evolution-of-bad-bots/ (accessed on 28 December 2021).
- Feng, P.; Ma, J.; Sun, C.; Xu, X.; Ma, Y. A Novel Dynamic Android Malware Detection System With Ensemble Learning. IEEE Access 2018, 6, 30996–31011. [Google Scholar] [CrossRef]
- Wang, W.; Li, Y.; Wang, X.; Liu, J.; Zhang, X. Detecting Android malicious apps and categorizing benign apps with ensemble of classifiers. Future Gener. Comput. Syst. 2018, 78, 987–994. [Google Scholar] [CrossRef] [Green Version]
- Yerima, S.Y.; Alzaylaee, M.K.; Shajan, A.; Vinod, P. Deep Learning Techniques for Android Botnet Detection. Electronics 2021, 10, 519. [Google Scholar] [CrossRef]
- Senanayake, J.; Kalutarage, H.; Al-Kadri, M.O. Android Mobile Malware Detection Using Machine Learning: A Systematic Review. Electronics 2021, 10, 1606. [Google Scholar] [CrossRef]
- Liu, K.; Xu, S.; Xu, G.; Zhang, M.; Sun, D.; Liu, H. A Review of Android Malware Detection Approaches Based on Machine Learning. IEEE Access 2020, 8, 124579–124607. [Google Scholar] [CrossRef]
- Vasan, D.; Alazab, M.; Wassan, S.; Safaei, B.; Zheng, Q. Image-Based malware classification using ensemble of CNN architectures (IMCEC). Comput. Secur. 2020, 92, 101748. [Google Scholar] [CrossRef]
- Bozkir, A.S.; Tahillioglu, E.; Aydos, M.; Kara, I. Catch them alive: A malware detection approach through memory forensics, manifold learning and computer vision. Comput. Secur. 2021, 103, 102166. [Google Scholar] [CrossRef]
- Bozkir, A.S.; Cankaya, A.O.; Aydos, M. Utilization and Comparison of Convolutional Neural Networks in Malware Recognition. In Proceedings of the 27th Signal Processing and Communications Applications Conference (SIU), Sivas, Turkey, 24–26 April 2019. [Google Scholar]
- Nataraj, L.; Karthikeyan, S.; Jacob, G.; Manjunath, B.S. Malware Images: Visualization and Automatic Classification. In Proceedings of the 8th International Symposium on Visualization for Cyber Security, Pittsburgh, PA, USA, 20 July 2011. [Google Scholar]
- Nataraj, L.; Yegneswaran, V.; Porras, P.; Zhang, J. A Comparative Assessment of Malware Classification Using Binary Texture Analysis and Dynamic Analysis. In Proceedings of the 4th ACM Workshop on Security and Artificial Intelligence, Chicago, IL, USA, 21 October 2011. [Google Scholar]
- Kumar, S.; Meena, S.; Khosla, S.; Parihar, A.S. AE-DCNN: Autoencoder Enhanced Deep Convolutional Neural Network For Malware Classification. In Proceedings of the 2021 International Conference on Intelligent Technologies (CONIT), Hubli, India, 25–27 June 2021; pp. 1–5. [Google Scholar]
- El-Shafai, W.; Almomani, I.; AlKhayer, A. Visualized Malware Multi-Classification Framework Using Fine-Tuned CNN-Based Transfer Learning Models. Appl. Sci. 2021, 11, 6446. [Google Scholar] [CrossRef]
- Vasan, D.; Alazab, M.; Wassan, S.; Naeem, H.; Safaei, B.; Zheng, Q. IMCFN: Image-based malware classification using fine-tuned convolutional neural network architecture. Comput. Netw. 2020, 171, 107138. [Google Scholar] [CrossRef]
- Xiao, G.; Li, J.; Chen, Y.; Li, K. MalFCS: An effective malware classification framework with automated feature extraction based on deep convolutional neural networks. J. Parallel. Distrib. Comput. 2020, 141, 49–58. [Google Scholar] [CrossRef]
- Awan, M.J.; Masood, O.A.; Mohammed, M.A.; Yasin, A.; Zain, A.M.; Damaševičius, R.; Abdulkareem, K.H. Image-Based Malware Classification Using VGG19 Network and Spatial Convolutional Attention. Electronics 2021, 10, 2444. [Google Scholar] [CrossRef]
- Hemalatha, J.; Roseline, S.A.; Geetha, S.; Kadry, S.; Damaševičius, R. An Efficient DenseNet-Based Deep Learning Model for Malware Detection. Entropy 2021, 23, 344. [Google Scholar] [CrossRef] [PubMed]
- Yan, H.; Zhou, H.; Zhang, H. Automatic Malware Classification via PRICoLBP. Chinese J. Chem. 2018, 27, 852–859. [Google Scholar] [CrossRef]
- Luo, J.S.; Lo, D.C.T. Binary malware image classification using machine learning with local binary pattern. In Proceedings of the 2017 IEEE International Conference on Big Data (Big Data), Boston, MA, USA, 11–14 December 2017; pp. 4664–4667. [Google Scholar]
- Kancherla, K.; Mukkamala, S. Image visualization based malware detection. In Proceedings of the 2013 IEEE Symposium on Computational Intelligence in Cyber Security (CICS), Singapore, 16–19 April 2013; pp. 40–44. [Google Scholar]
- Han, K.S.; Lim, J.H.; Kang, B.; Im, E.G. Malware analysis using visualized images and entropy graphs. Int. J. Inf. Secur. 2015, 14, 1–14. [Google Scholar] [CrossRef]
- Wang, T.; Xu, N. Malware variants detection based on opcode image recognition in small training set. In Proceedings of the IEEE 2nd International Conference on Cloud Computing and Big Data Analysis (ICCCBDA), Chengdu, China, 28–30 April 2017; pp. 328–332. [Google Scholar]
- Dai, Y.; Li, H.; Qian, Y.; Lu, X. A malware classification method based on memory dump grayscale image. Digit. Investig. 2018, 27, 30–37. [Google Scholar] [CrossRef]
- Singh, J.; Thakur, D.; Ali, F.; Gera, T.; Kwak, K.S. Deep Feature Extraction and Classification of Android Malware Images. Sensors 2020, 20, 7013. [Google Scholar] [CrossRef] [PubMed]
- Alzahrani, A.J.; Ghorbani, A.A. Real-time signature-based detection approach for SMS botnet. In Proceedings of the 13th Annual Conference on Privacy, Security and Trust (PST), Izmir, Turkey, 21–23 July 2015; pp. 157–164. [Google Scholar]
- Jadhav, S.; Dutia, S.; Calangutkar, K.; Oh, T.; Kim, Y.H.; Kim, J.N. Cloud-based Android botnet malware detection system. In Proceedings of the 17th International Conference on Advanced Communication Technology (ICACT), PyeongChang, Korea, 1–3 July 2015; pp. 347–352. [Google Scholar]
- Moodi, M.; Ghazvini, M.; Moodi, H.; Ghawami, B. A smart adaptive particle swarm optimization–support vector machine: Android botnet detection application. J. Supercomput. 2020, 76, 9854–9881. [Google Scholar] [CrossRef]
- Bernardeschia, C.; Mercaldo, F.; Nardonec, V.; Santoned, A. Exploiting Model Checking for Mobile Botnet Detection. Procedia Comput. Sci. 2019, 159, 963–972. [Google Scholar] [CrossRef]
- Anwar, S.; Zain, J.M.; Inayat, Z.; Haq, R.U.; Karim, A.; Jabir, A.N. A static approach towards mobile botnet detection. In Proceedings of the 3rd International Conference on Electronic Design (ICED), Phuket, Thailand, 11–12 August 2016; pp. 563–567. [Google Scholar]
- Tansettanakorn, C.; Thongprasit, S.; Thamkongka, S.; Visoottiviseth, V. ABIS: A prototype of Android Botnet Identification System. In Proceedings of the Fifth ICT International Student Project Conference (ICT-ISPC), Nakhonpathom, Thailand, 27–28 May 2016; pp. 1–5. [Google Scholar]
- Yusof, M.; Saudi, M.M.; Ridzuan, F. A new mobile botnet classification based on permission and API calls. In Proceedings of the Seventh International Conference on Emerging Security Technologies (EST), Canterbury, UK, 6–8 September 2017; pp. 122–127. [Google Scholar]
- Yusof, M.; Saudi, M.M.; Ridzuan, F. Mobile Botnet Classification by using Hybrid Analysis. Int. J. Eng. Technol. 2018, 7, 103–108. [Google Scholar] [CrossRef] [Green Version]
- Hijawi, W.; Alqatawna, J.; Faris, H. Toward a Detection Framework for Android Botnet. In Proceedings of the International Conference on New Trends in Computing Sciences (ICTCS), Amman, Jordan, 11–13 October 2017; pp. 197–202. [Google Scholar]
- Abdullah, Z.; Saudi, M.M.; Anuar, N.B. ABC: Android Botnet Classification Using Feature Selection and Classification Algorithms. Adv. Sci. Lett. 2017, 23, 4717–4720. [Google Scholar] [CrossRef]
- Karim, A.; Salleh, R.; Shah, S.A.A. DeDroid: A Mobile Botnet Detection Approach Based on Static Analysis. In Proceedings of the 7th International Symposium on UbiCom Frontiers—Innovative Research, Systems and Technologies, Beijing, China, 10–14 August 2015; pp. 1327–1332. [Google Scholar]
- Yerima, S.Y.; Alzaylaee, M.K. Mobile Botnet Detection: A Deep Learning Approach Using Convolutional Neural Networks. In Proceedings of the 2020 International Conference on Cyber Situational Awareness (Cyber SA 2020), Dublin, Ireland, 15–19 June 2020. [Google Scholar]
- Yerima, S.Y.; Bashar, A. Bot-IMG: A framework for image-based detection of Android botnets using machine learning. In Proceedings of the 18th ACS/IEEE International Conference on Computer systems and Applications (AICCSA 2021), Tangier, Morocco, 3–30 November 2021; pp. 1–7. [Google Scholar]
- Hojjatinia, S.; Hamzenejadi, S.; Mohseni, H. Android Botnet Detection using Convolutional Neural Networks. In Proceedings of the 28th Iranian Conference on Electrical Engineering (ICEE), Tabriz, Iran, 4–6 August 2020; pp. 1–6. [Google Scholar]
- Dalal, N.; Triggs, B. Histograms of oriented gradients for human detection. In Proceedings of the IEEE Computer Society Conference on Computer Vision and Pattern Recognition (CVPR’05), San Diego, CA, USA, 20–26 June 2005; pp. 886–893. [Google Scholar]
- Ebrahimzadeh, R.; Jampour, M. Article: Efficient Handwritten Digit Recognition based on Histogram of Oriented Gradients and SVM. Int. J. Comput. Appl. 2014, 104, 10–13. [Google Scholar]
- Anu, K.A.; Akbar, N.A. Recognition of Facial Expressions Based on Detection of Facial Components and HOG Characteristics. In Intelligent Manufacturing and Energy Sustainability; Springer: Berlin/Heidelberg, Germany, 2021. [Google Scholar]
- Arief, S.S.; Samratul, F.; Arumjeni, M.; Sari, Y.W. HOG Based Pedestrian Detection System for Autonomous Vehicle Operated in Limited Area. In Proceedings of the International Conference on Radar, Antenna, Microwave, Electronics, and Telecommunications (ICRAMET), Bandung, Indonesia, 23–24 November 2021. [Google Scholar]
- Bahassine, S.; Madani, A.; Al-Sarem, M.; Kissi, M. Feature selection using an improved Chi-square for Arabic text classification. J. King Saud Univ.-Comput. 2020, 32, 225–231. [Google Scholar] [CrossRef]
- ISCX. ISCX Android Botnet Dataset. Available online: https://www.unb.ca/cic/datasets/android-botnet.html (accessed on 28 December 2021).
- Weiss, S. Small sample error rate estimation for k-NN classifiers. IEEE T. Pattern. Anal. 1991, 13, 285–289. [Google Scholar] [CrossRef]
- Pontil, M.; Verri, A. Support vector machines for 3D object recognition. IEEE Trans. Pattern. Anal. 1998, 20, 637–646. [Google Scholar] [CrossRef] [Green Version]
- Kruegel, C.; Toth, T. Using Decision Trees to Improve Signature-Based Intrusion Detection. In Recent Advances in Intrusion Detection; Springer: Berlin/Heidelberg, Germany, 2003; pp. 173–191. [Google Scholar]
- Zhang, J.; Zulkernine, M.; Haque, A. Random-Forests-Based Network Intrusion Detection Systems. IEEE Trans. Syst. Man. Cybern. Part C 2008, 38, 649–659. [Google Scholar] [CrossRef]
- Alsariera, Y.A.; Adeyemo, V.E.; Balogun, A.O.; Alazzawi, A.K. AI Meta-Learners and Extra-Trees Algorithm for the Detection of Phishing Websites. IEEE Access 2020, 8, 142532–142542. [Google Scholar] [CrossRef]
- Podlodowski, L.; Kozłowski, M. Application of XGBoost to the cyber-security problem of detecting suspicious network traffic events. In Proceedings of the IEEE International Conference on Big Data (Big Data), Los Angeles, CA, USA, 9–12 December 2019; pp. 5902–5907. [Google Scholar]
- Yerima, S.Y.; Khan, S. Longitudinal Performance Analysis of Machine Learning based Android Malware Detectors. In Proceedings of the 2019 International Conference on Cyber Security and Protection of Digital Services (Cyber Security), Oxford, UK, 3–4 June 2019. [Google Scholar]
Figure 1.
Overview of the different steps involved in building the image-based Android botnet detection system.
Figure 1.
Overview of the different steps involved in building the image-based Android botnet detection system.
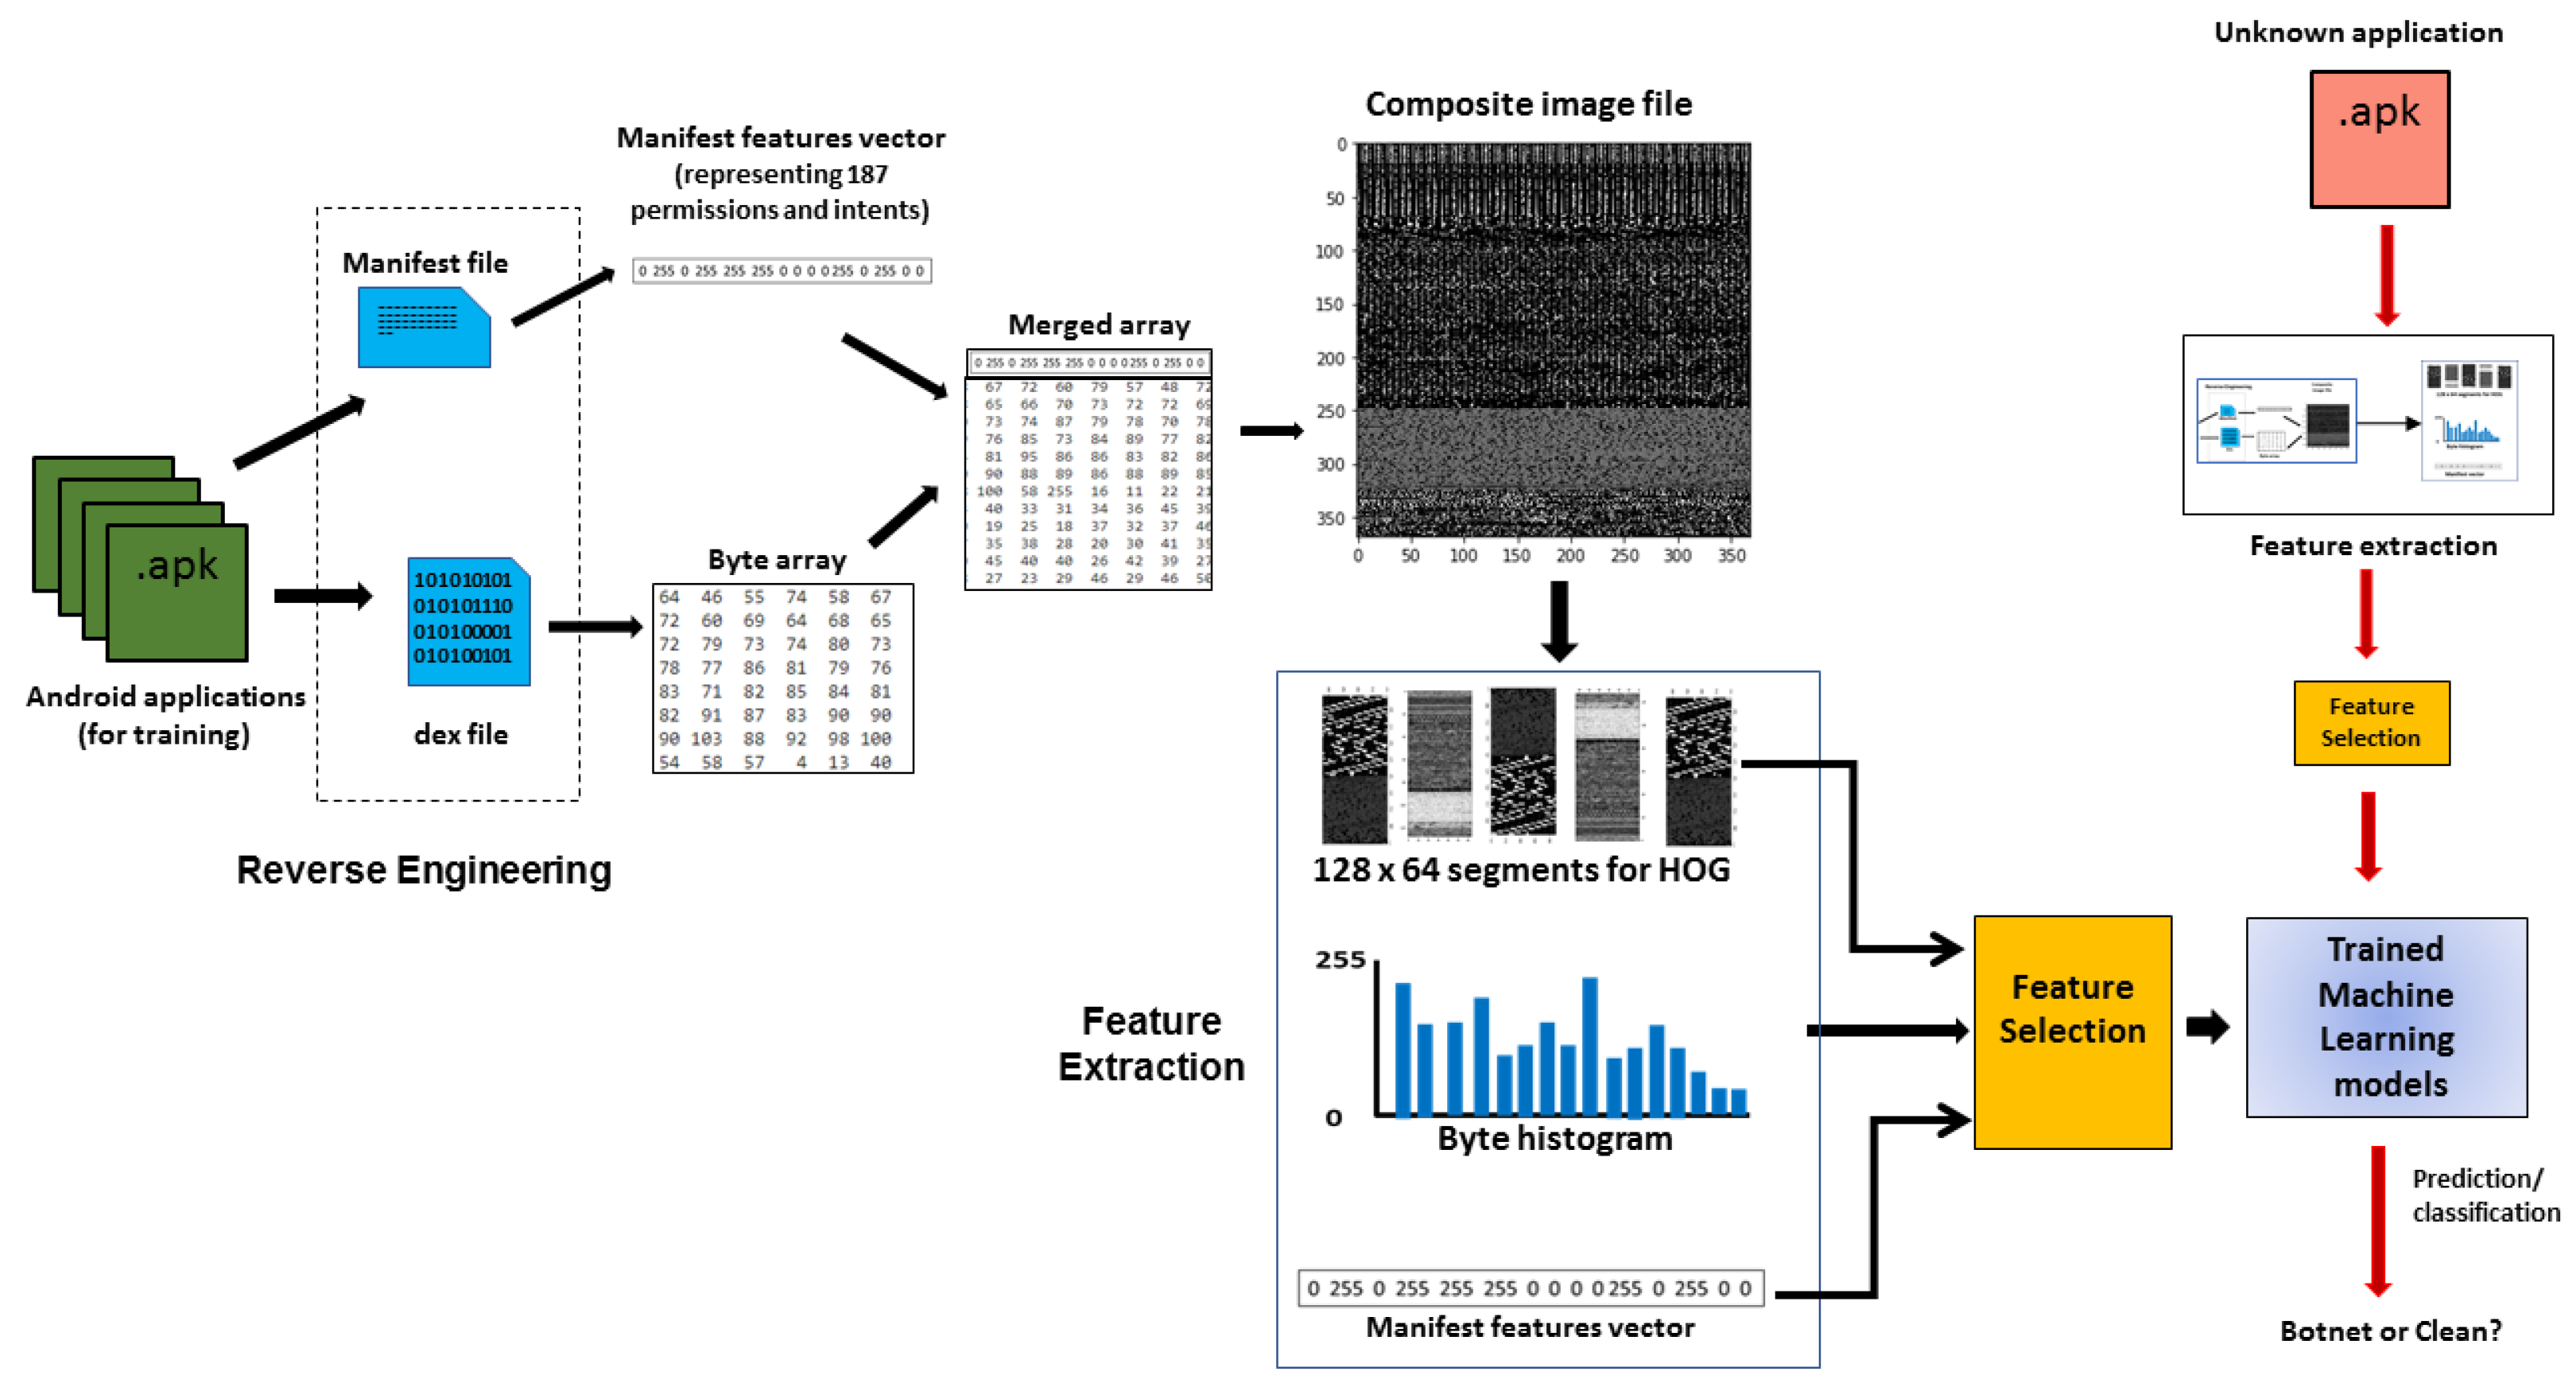
Figure 2.
Building a Histogram of Oriented Gradients using nine bins representing positive orientations spaced 20 degrees apart.
Figure 2.
Building a Histogram of Oriented Gradients using nine bins representing positive orientations spaced 20 degrees apart.

Figure 3.
Overall classification accuracy for the various classifiers using the three compared schemes.
Figure 3.
Overall classification accuracy for the various classifiers using the three compared schemes.

Figure 4.
Average training times for the training set samples in seconds for each of the ML classifiers using our proposed scheme.
Figure 4.
Average training times for the training set samples in seconds for each of the ML classifiers using our proposed scheme.


Table 1.
Classifier performance with permissions, byte histograms and HOG descriptors (10-fold cross validation results).
Table 1.
Classifier performance with permissions, byte histograms and HOG descriptors (10-fold cross validation results).
| Precision (M) | Recall (M) | Accuracy | Precision (C) | Recall (C) | F1-Score | |
|---|---|---|---|---|---|---|
| Extra Trees | 0.965 | 0.942 | 0.960 | 0.955 | 0.974 | 0.960 |
| SVM | 0.911 | 0.921 | 0.926 | 0.938 | 0.930 | 0.926 |
| KNN | 0.889 | 0.942 | 0.923 | 0.953 | 0.907 | 0.923 |
| XGBoost | 0.950 | 0.935 | 0.952 | 0.950 | 0.962 | 0.952 |
| RF | 0.962 | 0.944 | 0.958 | 0.955 | 0.970 | 0.958 |
| DT | 0.913 | 0.940 | 0.936 | 0.954 | 0.933 | 0.936 |
Table 2.
Classifier performance with permissions, byte histograms and HOG descriptors (train–test split results).
Table 2.
Classifier performance with permissions, byte histograms and HOG descriptors (train–test split results).
| Precision (M) | Recall (M) | Accuracy | Precision (C) | Recall (C) | F1-Score | |
|---|---|---|---|---|---|---|
| Extra Trees | 0.970 | 0.970 | 0.975 | 0.980 | 0.980 | 0.980 |
| SVM | 0.890 | 0.920 | 0.937 | 0.940 | 0.920 | 0.940 |
| KNN | 0.860 | 0.940 | 0.944 | 0.960 | 0.900 | 0.940 |
| XGBoost | 0.970 | 0.940 | 0.966 | 0.960 | 0.980 | 0.970 |
| RF | 0.970 | 0.960 | 0.973 | 0.970 | 0.980 | 0.970 |
| DT | 0.920 | 0.950 | 0.953 | 0.960 | 0.950 | 0.950 |
Table 3.
Comparison of the baseline HOG schemes with the proposed method using the overall accuracy (10-fold cross validation results).
Table 3.
Comparison of the baseline HOG schemes with the proposed method using the overall accuracy (10-fold cross validation results).
| HOG (Original) | HOG (Enhanced) | HOG + BH + MF | |
|---|---|---|---|
| XGBoost | 0.892 | 0.927 | 0.952 |
| Extra Trees | 0.863 | 0.925 | 0.960 |
| RF | 0.871 | 0.919 | 0.958 |
| KNN | 0.877 | 0.877 | 0.920 |
| SVM | 0.811 | 0.866 | 0.926 |
| DT | 0.773 | 0.835 | 0.935 |
Publisher’s Note: MDPI stays neutral with regard to jurisdictional claims in published maps and institutional affiliations. |
© 2022 by the authors. Licensee MDPI, Basel, Switzerland. This article is an open access article distributed under the terms and conditions of the Creative Commons Attribution (CC BY) license (https://creativecommons.org/licenses/by/4.0/).
Share and Cite
MDPI and ACS Style
Yerima, S.Y.; Bashar, A. A Novel Android Botnet Detection System Using Image-Based and Manifest File Features. Electronics 2022, 11, 486. https://doi.org/10.3390/electronics11030486
AMA Style
Yerima SY, Bashar A. A Novel Android Botnet Detection System Using Image-Based and Manifest File Features. Electronics. 2022; 11(3):486. https://doi.org/10.3390/electronics11030486
Chicago/Turabian StyleYerima, Suleiman Y., and Abul Bashar. 2022. "A Novel Android Botnet Detection System Using Image-Based and Manifest File Features" Electronics 11, no. 3: 486. https://doi.org/10.3390/electronics11030486
Note that from the first issue of 2016, this journal uses article numbers instead of page numbers. See further details here.