
The ESD Characteristics of a pMOS-Triggered Bidirectional SCR in SOI BCD Technology
by
Mingzhu Li
1,2,3, 
Xiaowu Cai
1,3,
Chuanbin Zeng
1,3,
Xiaojing Li
1,3,*,
Tao Ni
1,3,
Juanjuan Wang
1,3,
Duoli Li
1,3,
Fazhan Zhao
1,3 and
Zhengsheng Han
1,2,3 1
Institute of Microelectronics of Chinese Academy of Sciences, Beijing 100029, China
2
University of Chinese Academy of Sciences, Beijing 100049, China
3
Key Laboratory of Science and Technology on Silicon Devices, Chinese Academy of Sciences, Beijing 100029, China
*
Author to whom correspondence should be addressed.
Electronics 2022, 11(4), 546; https://doi.org/10.3390/electronics11040546
Submission received: 28 December 2021
/
Revised: 5 February 2022
/
Accepted: 8 February 2022
/
Published: 11 February 2022
(This article belongs to the Section Microelectronics)
Abstract
:In this work, the electrostatic discharge (ESD) characteristics of a pMOS-triggered bidirectional silicon-controlled rectifier (PTBSCR) that was fabricated in a 0.18 μm silicon-on-insulator (SOI) bipolar-CMOS-DMOS (BCD) process, is investigated. The multi-snapback phenomenon was observed under the transmission line pulsing (TLP) test system. It was found that gate voltage and inserting shallow trench isolation (STI) can significantly affect the trigger voltage and holding voltage. The underlying physical mechanism related to the multi-snapback phenomenon and the effects of gate voltage on the critical parameters was investigated through the experimental results and the assistance of technology computer-aided design (TCAD) simulations. The adjustments of gate voltage and STI on the critical ESD parameters of the device provide an effective design idea for low-voltage ESD protection in the SOI BCD process.
1. Introduction
Electrostatic discharge (ESD) remains a challenge in terms of the reliability and robustness of integrated circuits (ICs). The scaling down of dimensions, the increasing integration density, and the new production process make the circuits more sensitive to ESD stress [1]. An ESD device is needed to protect a pin in ICs. To protect the internal circuits and avoid latch-up issues, the trigger voltage (Vt1) of the ESD device must be greater than the supply power and lower than the breakdown voltage; the holding voltage (Vh) of the ESD device must be greater than the power supply voltage [2,3]. The silicon-controlled rectifier (SCR) device has been widely used as an efficient ESD protection structure for its high ESD robustness within a small silicon footprint, however, the high trigger voltage and a low holding voltage have limited use. The RC trigger circuit has been coupled to the SCR component, allowing the trigger voltage of the SCR to be decreased [4]. And the diode-triggered SCR (DTSCR) can adjust the trigger voltage by using a chain of diodes to trigger [5,6,7], however, the leakage current is at a high level. The low-voltage triggered SCR (LVTSCR) [8,9,10] has been proposed, which involves integrating a MOS configured in a grounded-gate N-channel metal-oxide-semiconductor (GGNMOS) across the P+/N-well junction. Similarly, a pMOS component can also be integrated. A dual-direction SCR (DDSCR) is suited to protect circuits from the two polarities of ESD stress [11,12,13]. The same scheme to reduce Vt1 by embedding the MOS in SCR can be used for DDSCR. The optimized pMOS-triggered bidirectional SCR (PTBSCR) fabricated in a 0.18 μm CMOS process uses symmetrical stacked SCR and pMOS to reduce the trigger voltage and improve the holding voltage [14]. The ESD design concept of ESD on the CMOS process can be applied to that on the silicon-on-insulator (SOI) bipolar-CMOS-DMOS (BCD) process. Compared with the integrated protection network based on diodes, the localized protection approach that relies on devices is more suitable for the multiple power supply ICs in the SOI BCD process. The protection structures applied for a localized protection net should be bidirectional to provide protections from the two polarities of the discharge [15]. Thus, a dual-direction SCR is suited for a localized protection net.
However, most ESD protection structures fabricated in the SOI BCD process are designed for high-voltage applications [16,17,18], while the protection structures for a low-voltage applications’ process are rarely discussed. Embedding a pMOS in DDSCR can reduce Vt1 and increase the Vh, however, the effect of gate voltage on critical parameters for DDSCR is not investigated in detail. In addition, the influence of inserting shallow trench isolation (STI) in DDSCR has not been discussed.
In this paper, the PTBSCR is fabricated in a 0.18 μm SOI BCD process. This structure aims to protect the I/O pins of ICs in the SOI BCD process, and it shows a low trigger voltage and a high holding voltage in the transmission line pulsing (TLP) I-V curve. In addition, the device can protect a pin with an operating voltage varying between positive and negative values. The multi-snapback phenomenon of the device and the effects of gate voltage, layout parameter, and STI on the variation of Vt1 and Vh are discussed in detail. The technological computer-aided design (TCAD) simulation is carried out to obtain physical insight into the distributions of current density, the impact of ionization rate, the electric field, and the electrostatic potential of PTBSCR.
2. Test and Simulation Structure
The PTBSCR (with/without STI) is studied in this work. Figure 1 shows the cross-sectional view of the PTBSCR with STI. It consists of a bidirectional SCR, an embedded pMOS, and parasitic resistors. The DNW is a high-voltage isolation well. The NW1, NW2, NW3, PW1, and PW2 are low-voltage wells. The TR is the dielectric isolation ring. The STI is used to isolate the PN junction. The device is designed by using the existing layer. Therefore, the fabrication process of the device is fully compatible with the SOI BCD process. Some parameters of the PTBSCR are summarized in Table 1. The device can discharge an ESD current in dual directions and it is completely symmetrical. Figure 1 illuminates the equivalent circuit when terminal 1 (T1) is subject to a positive ESD stress and terminal 2 (T2) is grounded. When T1 of the PTBSCR is subject to a positive ESD stress and T2 is grounded, the voltage applied on the pMOS drain (P2+) will cause the trigger current to flow via the channel, and such a current flow will trigger the internal parasitic device. The poly-silicon gate on top of the NW2 region is the third terminal, which provides additional voltage to turn the pMOS on/off.
The concentrations, depths, and dimensions of the simulation structure are the same as the test structure. Through 2D simulation, the distribution of current, electric field, and avalanche impact ionization under an ESD current pulse can be used to analyze the ESD mechanism of PTBSCR.
3. Experimental Results and Analysis
3.1. The Multiple Snapback Characteristic
The measurements are targeted to the human body model (HBM) and conducted using the TLP test system HOXI-I with a pulse width of 100 ns and a rise time of 5 ns. The TLP test system measures I-V characteristics of the device when T1/T2 is subject to a positive ESD stress, the T2/T1 and G are grounded. As shown in Figure 2, the test curve presents a multi-snapback phenomenon, and the holding point after the second snapback reaches the lowest voltage. The double snapback has been observed in a double-snapback silicon-controlled rectifier (DSSCR) [19] and a GGNMOS triggered silicon-controlled rectifier (GGSCR) [20], where both of the structures have introduced the MOS-trigger mechanism. The double snapback in these two structures was caused by a progressive turn-on sequence of parasitic nMOS and an SCR, which were investigated by analyzing the current distribution of structures at different current levels. The same method can be used to analyze the multi-snapback phenomenon in PTBSCR.
To support and analyze the experimental phenomenon, TCAD simulation is carried out. The simulation method is named the multi-current pulse simulation method. In the method, a customized piecewise linear function (PWL) is used to generate the TLP current pulse which is applied to the T1 electrode. Other electrodes, including the T2 and G, are connected to the ground (0 V). The same mechanism applies to the ESD stress zapping at T2 when T1 and G are grounded. The underlying physical mechanism can be explained by the current distribution of PTBSCR under an increasing simulated pulsing current.
As shown in Figure 3, the PTBSCR passes through four different conduct phases as the pulsing current increases. Figure 3a illuminates before the other parasitic structure is triggered by the current that flows through the parasitic pMOS (composed of P2+, NW2, and P3+) when T1 is subject to positive ESD stress. The holes are injected into NW2 by PW1 and picked up by P3+. As shown in Figure 3b, current flows, and more broadly, the parasitic PNP BJT is triggered. Thus, the first snapback is caused by the trigger of PNP BJT. As the current increases, the current path is widened, as shown in Figure 3c. The holes drift the PW2 towards the N2+, which generates a voltage drop across the PW2 resistance R4. The voltage drop raises the local potential in PW2 and leads the PNPN structure (composed of P1+, NW2, PW2, and N2+) to trigger on. According to the avalanche impact ionization distribution of Figure 4, the impact ionization rate appears to be largest at the junction of NW2/PW2 on the current flow path, where the holes accelerate and a collision impact occurred. Then holes accumulate at PW2 until the parasitic NPN BJT (composed of NW2, PW2, and N2+) turn-on, then the NPN BJT forms positive feedback with PNP BJT (composed of P2+, NW2, P3+). Thus, it can be concluded that the NPN (composed of NW2, PW2, and N2+) is triggered earlier. Thus, the second snapback is caused by the turn-on of the PNPN structure. As shown in Figure 3d, the current flow through R2 generates a voltage drop across the PW1 and turns on the parasitic NPNP structure, (composed of N1+, PW1, NW2, and P3+), Thus, the third snapback happens due to the turn-on of the NPNP structure.
The physical failure analysis (PFA) was carried out after the TLP test. Three metal layers have been removed to locate the failure spots. As shown in Figure 5, the failure spots caused by silicon melting appear in the junctions of the NW2/PW2 and N1+/PW1. As shown in Figure 4, the electric field at the reverse-biased NW2/PW2 junction is larger than other positions (impact ionization is related to the electric field), and the current almost flows through these reverse-biased PN junctions, as shown in Figure 3d. The heat generated at the reverse-biased junction is the product of high-voltage dropping on the junction and a high ESD current, which causes temperature rises until silicon melting. The distributions of failure spots have indirectly verified the accuracy of simulated results in Figure 3 and Figure 4.
3.2. The Effect of Gate Voltage on Snapback Voltage
3.2.1. The Measured TLP Results
To investigate the effect of gate voltage on the ESD characteristics of the structure, the I-V curves of PTBSCR are measured when T1 is subject to a positive ESD stress, G is subject to a different voltage, and T2 is grounded. The multi-snapback phenomenon exists in curves with different gate voltages (gate voltage means the DC voltage applied on the G electrode) in Figure 6. Therefore, the voltage that applies to the gate has no effects on the work scheme of PTBSCR in ESD stress. In addition, it can be seen that the Vt1 and Vh of the device decrease regularly with decreasing gate voltage.
Figure 7 presents the effects of L and gate voltage on the Vt1/Vh. The value of Vt1 (VG = 0 V) can decrease from 8.1 V to 6.2 V with L decreasing from 1.5 μm to 0.5 μm. The total reduction is about 1.9 V, and accounting exceeds 23.0% of Vt1 (L = 1.5 μm, VG = 0 V). The value of Vh (VG = −1 V) can increase from 4.5 V to 4.9 V with L increasing from 0.5 μm to 1.5 μm. The total rise is about 0.4 V, and accounting exceeds 9.6% of Vh (L = 0.5 μm, VG = −1 V). The value of Vt1 (L = 0.5 μm) can reduce from 6.2 V to 4.6 V with gate voltage decreasing from 0 V to −5 V. The total reduction is about 2.0 V, and accounting exceeds 25.8% of Vt1 (VG = 0 V, L = 0.5 μm). The value of Vh (L = 1 μm) can increase from 4.3 V to 5.2 V with gate voltage increasing from −5 V to 0 V. The total rise is about 0.8 V, and accounting exceeds 19.5% of Vh (VG = −5 V, L = 1 μm). The above results indicate that the values of Vt1/Vh can be adjusted via gate voltage and the length of L in a large range.
3.2.2. The Influence of Gate Voltage on Vt1 and Vh
The influence mechanism of gate voltage on trigger characteristics of nMOS has been analyzed in [21,22]. Because the first trigger behavior of PTBSCR is governed by the pMOS, the same analysis scheme of nMOS can be used to study the trigger behavior of pMOS. The Ids of pMOS play a crucial part in reducing the Vt1 because the Ids is the main contributor to the increase of the incident current Ip for the avalanche multiplication at the NW2/PW2 junction. The avalanche generation current Igen is related to the incident current Ip and the avalanche multiplication factor M by:
Igen = (M − 1)Ip
Before the turning on of BJT, body current IBody = Igen. A gate voltage VG greater than the pMOS threshold voltage Vth will result in a pMOS current Ids. The Ip is strengthened by Ids, and a lower M can sustain the same IBody. The increasing Ids make the Vt1 decrease. Thus, the Vt1 of pMOS is initiated reducing with decreasing gate voltage. For the same reason, the Vt1 of PTBSCR is decreasing with the decreasing gate voltage.
According to the analysis before, the second triggering is caused by the turn-on of the PNPN structure (composed of P1+, NW2, PW2, N2+), and the holding point appears after the second triggering. Before the third snapback, the current flows through P1+, PW1, NW2, PW2, and N2+ and the voltage drop on the reverse-biased NW2/PW2 junction contributes the most to the holding voltage. We chose the same pulsing current to analyze the distribution of electric field and electrostatic potential when applying the different gate voltages. As shown in Figure 8a–d, gate voltage has an evident influence on the electric field distribution in NW2/PW2. The gradually weakened electric field in the NW2/PW2 junction will induce the undermined electrostatic potential with reducing gate voltage. In Figure 9a–d, the electrostatic potential in NW2/PW2 is gradually decreasing with reducing gate voltage, and the Vh of PTBSCR is decreasing with the decreasing electrostatic potential in NW2/PW2.
3.3. The Results Difference Caused by STI Isolation
To investigate the influence of STI on critical parameters, the TLP I-V curves of structures (with/without STI) are measured. Figure 10 shows the test curves of different devices. The TLP test system measures I-V characteristics of the devices when T1 is subject to a positive ESD stress, the T2 and G are grounded. The multi-snapback phenomenon of the I-V curve exists in structures with or without STI. In addition, inserting STI decreases the Vt1 and increases the Vh. The first snapback is caused by the turn-on of PNP BJT. The STI inserted in the device is used to isolate the PN junction. The P1+/N1+ junction of PTBSCR without STI consumes the voltage drop on the current flow path, which reduces the voltage drop on the NW2/PW2. Thus, the device without STI triggers with more difficulty. Thus, the Vt1 of PTBSCR with STI is smaller. After being triggered completely, the STI increases the current path, and thus, the Vh is larger.
Figure 11 shows the effect of gate voltage on the Vt1 and Vh of PTBSCR (with/without STI). As expected, the Vt1 and Vh of the device have decreased regularly with a decreasing gate voltage. The Vt1 decreases from 6.2 V/7.0 V to 4.6 V/4.8 V. The Vh decreases from 5.1 V/4.6 V to 4.3 V/3.8 V when gate voltage decreases from 0 V to −5 V.
4. Conclusions
The multi-snapback phenomenon of PTBSCR in the 0.18 μm SOI BCD process was investigated in this work. The ESD characteristics of PTBSCR were verified by the TLP measurement and TCAD simulator. The structure offered a low trigger voltage and a high holding voltage to satisfy the ESD design window. The multi-snapback phenomenon of the device can be explained by the non-simultaneous trigger of the parasitic structure in the current path. The decreasing gate voltage increased channel current and weakened the electric field, therefore decreasing Vt1, Vh. Inserting STI reduced the voltage drop on the P1+/N1+ junction, and increased the current flow path. Thus, inserting STI decreased the Vt1, and increased Vh. The effects of gate voltage, inserting STI, and channel length on ESD characteristics of PTBSCR is useful to design low-voltage ESD protections in SOI BCD ICs.
Author Contributions
Data collection, M.L.; data analysis, M.L.; data interpretation, M.L.; resources, T.N., J.W. and D.L.; software, M.L.; writing—original draft, M.L.; writing—review and editing, X.L., X.C., C.Z., F.Z. and Z.H. All authors have read and agreed to the published version of the manuscript.
Funding
This work was funded by the National Natural Science Foundation of China, Grant number NSFC 61804168.
Data Availability Statement
The data presented in this study are available on request from the corresponding author. The data are not publicly available due to privacy.
Conflicts of Interest
The authors declare no conflict of interest.
References
- Bafleur, M. Introduction. In ESD Protection Methodologies; Elsevier Ltd.: Amsterdam, The Netherlands, 2017; pp. xvii–xxvi. ISBN 978-1-78548-122-2. [Google Scholar]
- Steven, L.; Voldman, H.; Wiley, J. 1.1 CMOS Latchup. In Latchup; John Wiley & Sons: Chichester, UK, 2008; pp. 1–46. [Google Scholar] [CrossRef]
- Ker, M.-D.; Hsu, S.-F. Introduction. In Transient-Induced Latchup in CMOS Integrated Circuits; IEEE: Piscataway, NJ, USA, 2009; pp. 1–21. ISBN 9780470824078. [Google Scholar]
- Chen, S.-H.; Ker, M.-D. Optimization of PMOS-triggered SCR devices for on-chip ESD protection in a 0.18-μm CMOS technology. In Proceedings of the 14th International Symposium on the Physical and Failure Analysis of Integrated Circuits, Bangalore, India, 11–13 July 2007; pp. 245–248. [Google Scholar] [CrossRef]
- Di Sarro, J.; Chatty, K.; Gauthier, R.; Rosenbaum, E. Evaluation of SCR-Based ESD Protection Devices in 90 nm and 65 nm CMOS Technologies. In Proceedings of the 2007 IEEE International Reliability Physics Symposium Proceedings. 45th Annual, Phoenix, AZ, USA, 15–19 April 2007. [Google Scholar]
- Chen, W.-Y.; Rosenbaum, E.; Ker, M.-D. Diode-Triggered Silicon-Controlled Rectifier with Reduced Voltage Overshoot for CDM ESD Protection. IEEE Trans. Device Mater. Reliab. 2011, 12, 10–14. [Google Scholar] [CrossRef]
- Mergens, M.; Russ, C.; Verhaege, K.; Armer, J.; Jozwiak, P.; Mohn, R.; Keppens, B.; Trinh, C. Diode-triggered SCR (DTSCR) for RF-ESD protection of Bi, CMOS Si, Ge HBTs and CMOS ultra-thin gate oxides. In Proceedings of the IEEE International Electron Devices Meeting 2003, Washington, DC, USA, 8–10 December 2003; pp. 515–518. [Google Scholar]
- Ker, M.D.; Chang, H.H. How to safely apply the LVTSCR for CMOS whole-chip ESD protection without being acci-dentally triggered on. J. Electrost. 1999, 47, 215–248. [Google Scholar] [CrossRef]
- Dong, S.; Wu, J.; Miao, M.; Zeng, J.; Han, Y.; Liou, J.J. High-Holding-Voltage Silicon-Controlled Rectifier for ESD Appli-cations. IEEE Electron Device Lett. 2012, 33, 1345–1347. [Google Scholar] [CrossRef]
- Vashchenko, V.; Concannon, A.; Ter Beek, M.; Hopper, P. High Holding Voltage Cascoded LVTSCR Structures for 5.5-V Tolerant ESD Protection Clamps. IEEE Trans. Device Mater. Reliab. 2004, 4, 273–280. [Google Scholar] [CrossRef]
- Wang, A.; Tsay, C.-H. On a dual-polarity on-chip electrostatic discharge protection structure. IEEE Trans. Electron Devices 2001, 48, 978–984. [Google Scholar] [CrossRef]
- Liu, Z.; Vinson, J.; Lou, L.; Liou, J. An Improved Bidirectional SCR Structure for Low-Triggering ESD Protection Applications. IEEE Electron Device Lett. 2008, 29, 360–362. [Google Scholar] [CrossRef]
- Vashchenko, V.A.; Kuznetsov, V.; Hopper, P.J. Implementation of dual-direction SCR devices in analog CMOS process. In Proceedings of the 2007 29th Electrical Overstress/Electrostatic Discharge Symposium (EOS/ESD), Anaheim, CA, USA, 16–21 September 2007. [Google Scholar]
- Wang, Z.; Sun, R.-C.; Liou, J.J.; Liu, D.-G. Optimized p, MOS-Triggered Bidirectional SCR for Low-Voltage ESD Protection Applications. IEEE Trans. Electron Devices 2014, 61, 2588–2594. [Google Scholar]
- Bafleur, M.; Caignet, F.; Nolhier, N. Protection Strategies Against ESD. In ESD Protection Methodologies; Elsevier Ltd.: Amsterdam, The Netherlands, 2017; pp. 71–109. [Google Scholar] [CrossRef]
- Voldman, H.; Steven, H. Smart Power, LDMOS, and BCD Technology; John Wiley & Sons, Ltd.: Hoboken, NJ, USA, 2009; pp. 315–332. [Google Scholar] [CrossRef]
- Dong, S.; Jin, H.; Miao, M.; Wu, J.; Liou, J.J. Novel Capacitance Coupling Complementary Dual-Direction SCR for High-Voltage ESD. IEEE Electron Device Lett. 2012, 33, 640–642. [Google Scholar] [CrossRef]
- Dai, C.-T.; Ker, M.-D. Comparison Between High-Holding-Voltage SCR and Stacked Low-Voltage Devices for ESD Protection in High-Voltage Applications. IEEE Trans. Electron Devices 2018, 65, 798–802. [Google Scholar] [CrossRef]
- Hu, T.; Dong, S.; Jin, H.; Wong, H.; Xu, Z.; Li, X.; Liou, J.J. A double snapback SCR ESD protection scheme for 28 nm CMOS process. Microelectron. Reliab. 2018, 84, 20–25. [Google Scholar] [CrossRef]
- Zhang, S.; Dong, S.-R.; Wu, X.-J.; Zeng, J.; Zhong, L.; Wu, J. An improved GGNMOS triggered SCR for high holding volt-age ESD protection applications. Chin. Phys. B 2015, 24, 108502. [Google Scholar] [CrossRef]
- Mergens, M.; Wilkening, W.; Mettler, S.; Wolf, H.; Fichtner, W. Modular approach of a high current MOS compact model for circuit-level ESD simulation including transient gate coupling behavior. In Proceedings of the 37th Annual IEEE International Reliability Physics Symposium, San Diego, CA, USA, 23–25 March 1999; pp. 167–178. [Google Scholar]
- Amerasekera, A.; Ramaswamy, S.; Chang, M.-C.; Duvvury, C. Modeling MOS snapback and parasitic bipolar action for circuit-level ESD and high current simulations. In Proceedings of the 34th Annual International Reliability Physics Symposium, Dallas, TX, USA, 25–28 March 1996; pp. 318–326. [Google Scholar]
Figure 1.
Cross-sectional view and equivalent circuit of the PTBSCR in SOI BCD technology.
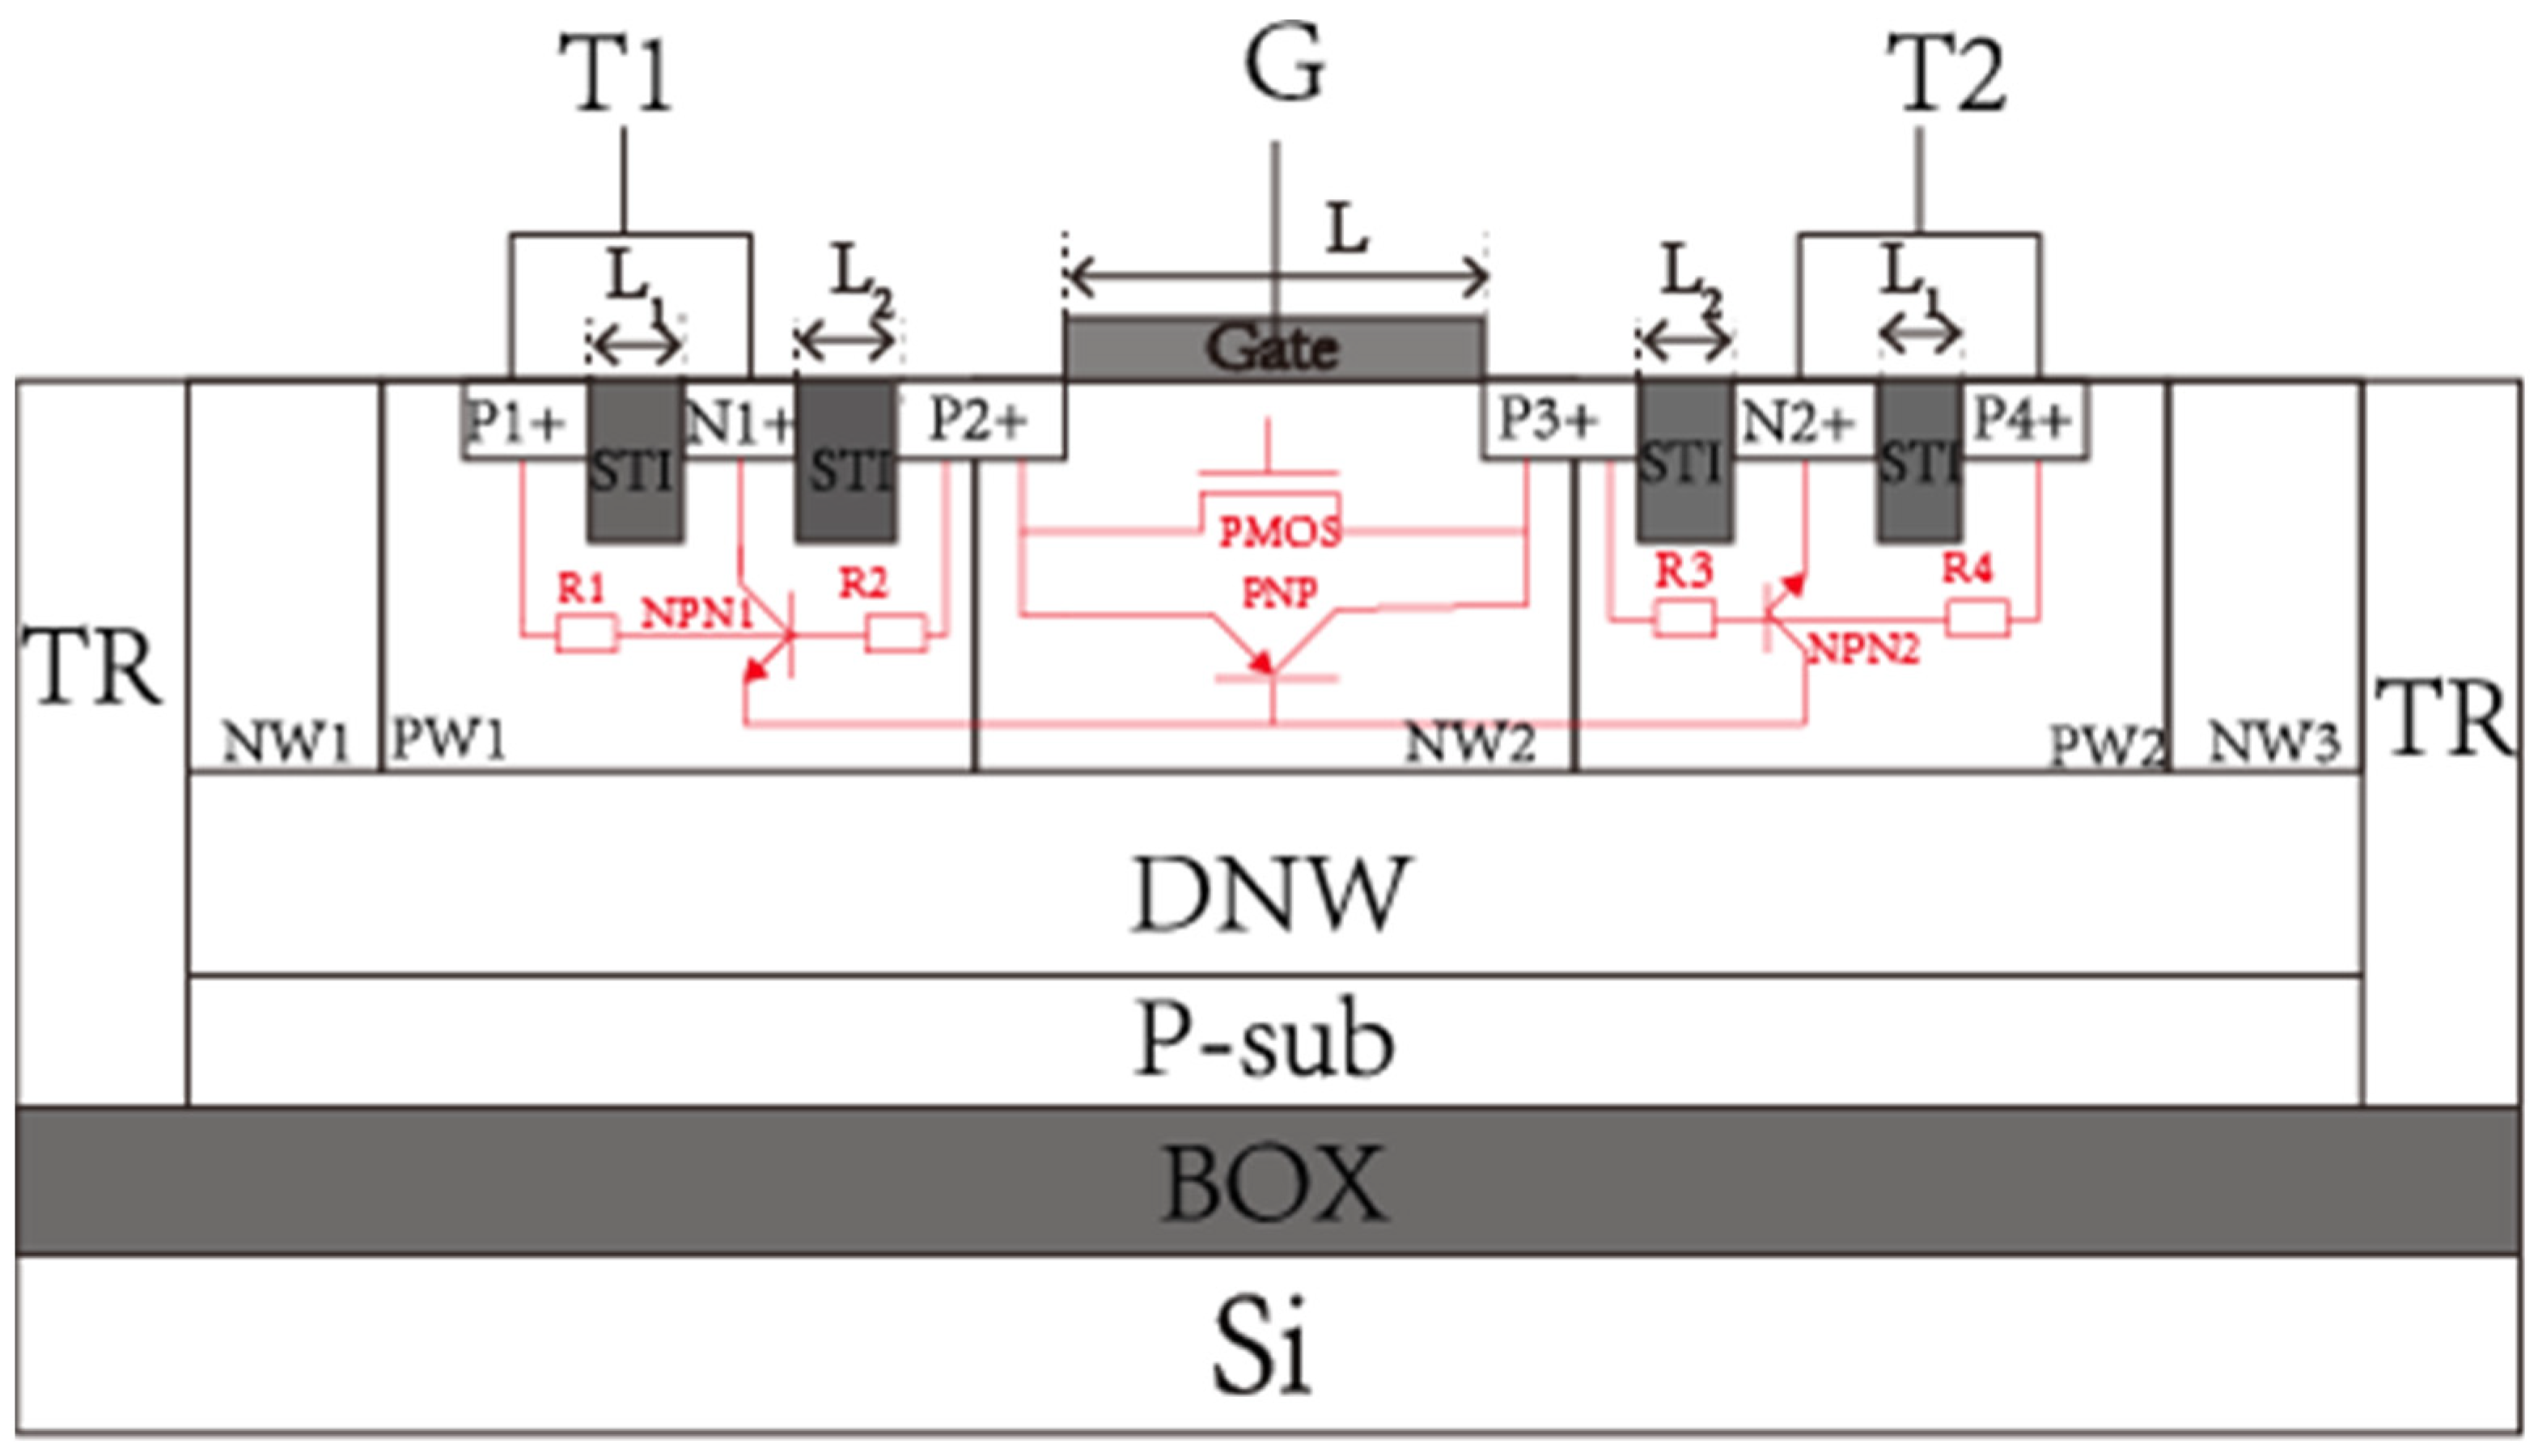
Figure 2.
TLP I-V curve for the PTBSCR (L = 0.5 μm) when T1/T2 is subject to a positive ESD stress, the T2/T1 and G are grounded. Enlarged figures: detailed triggering behaviors for the device.
Figure 2.
TLP I-V curve for the PTBSCR (L = 0.5 μm) when T1/T2 is subject to a positive ESD stress, the T2/T1 and G are grounded. Enlarged figures: detailed triggering behaviors for the device.
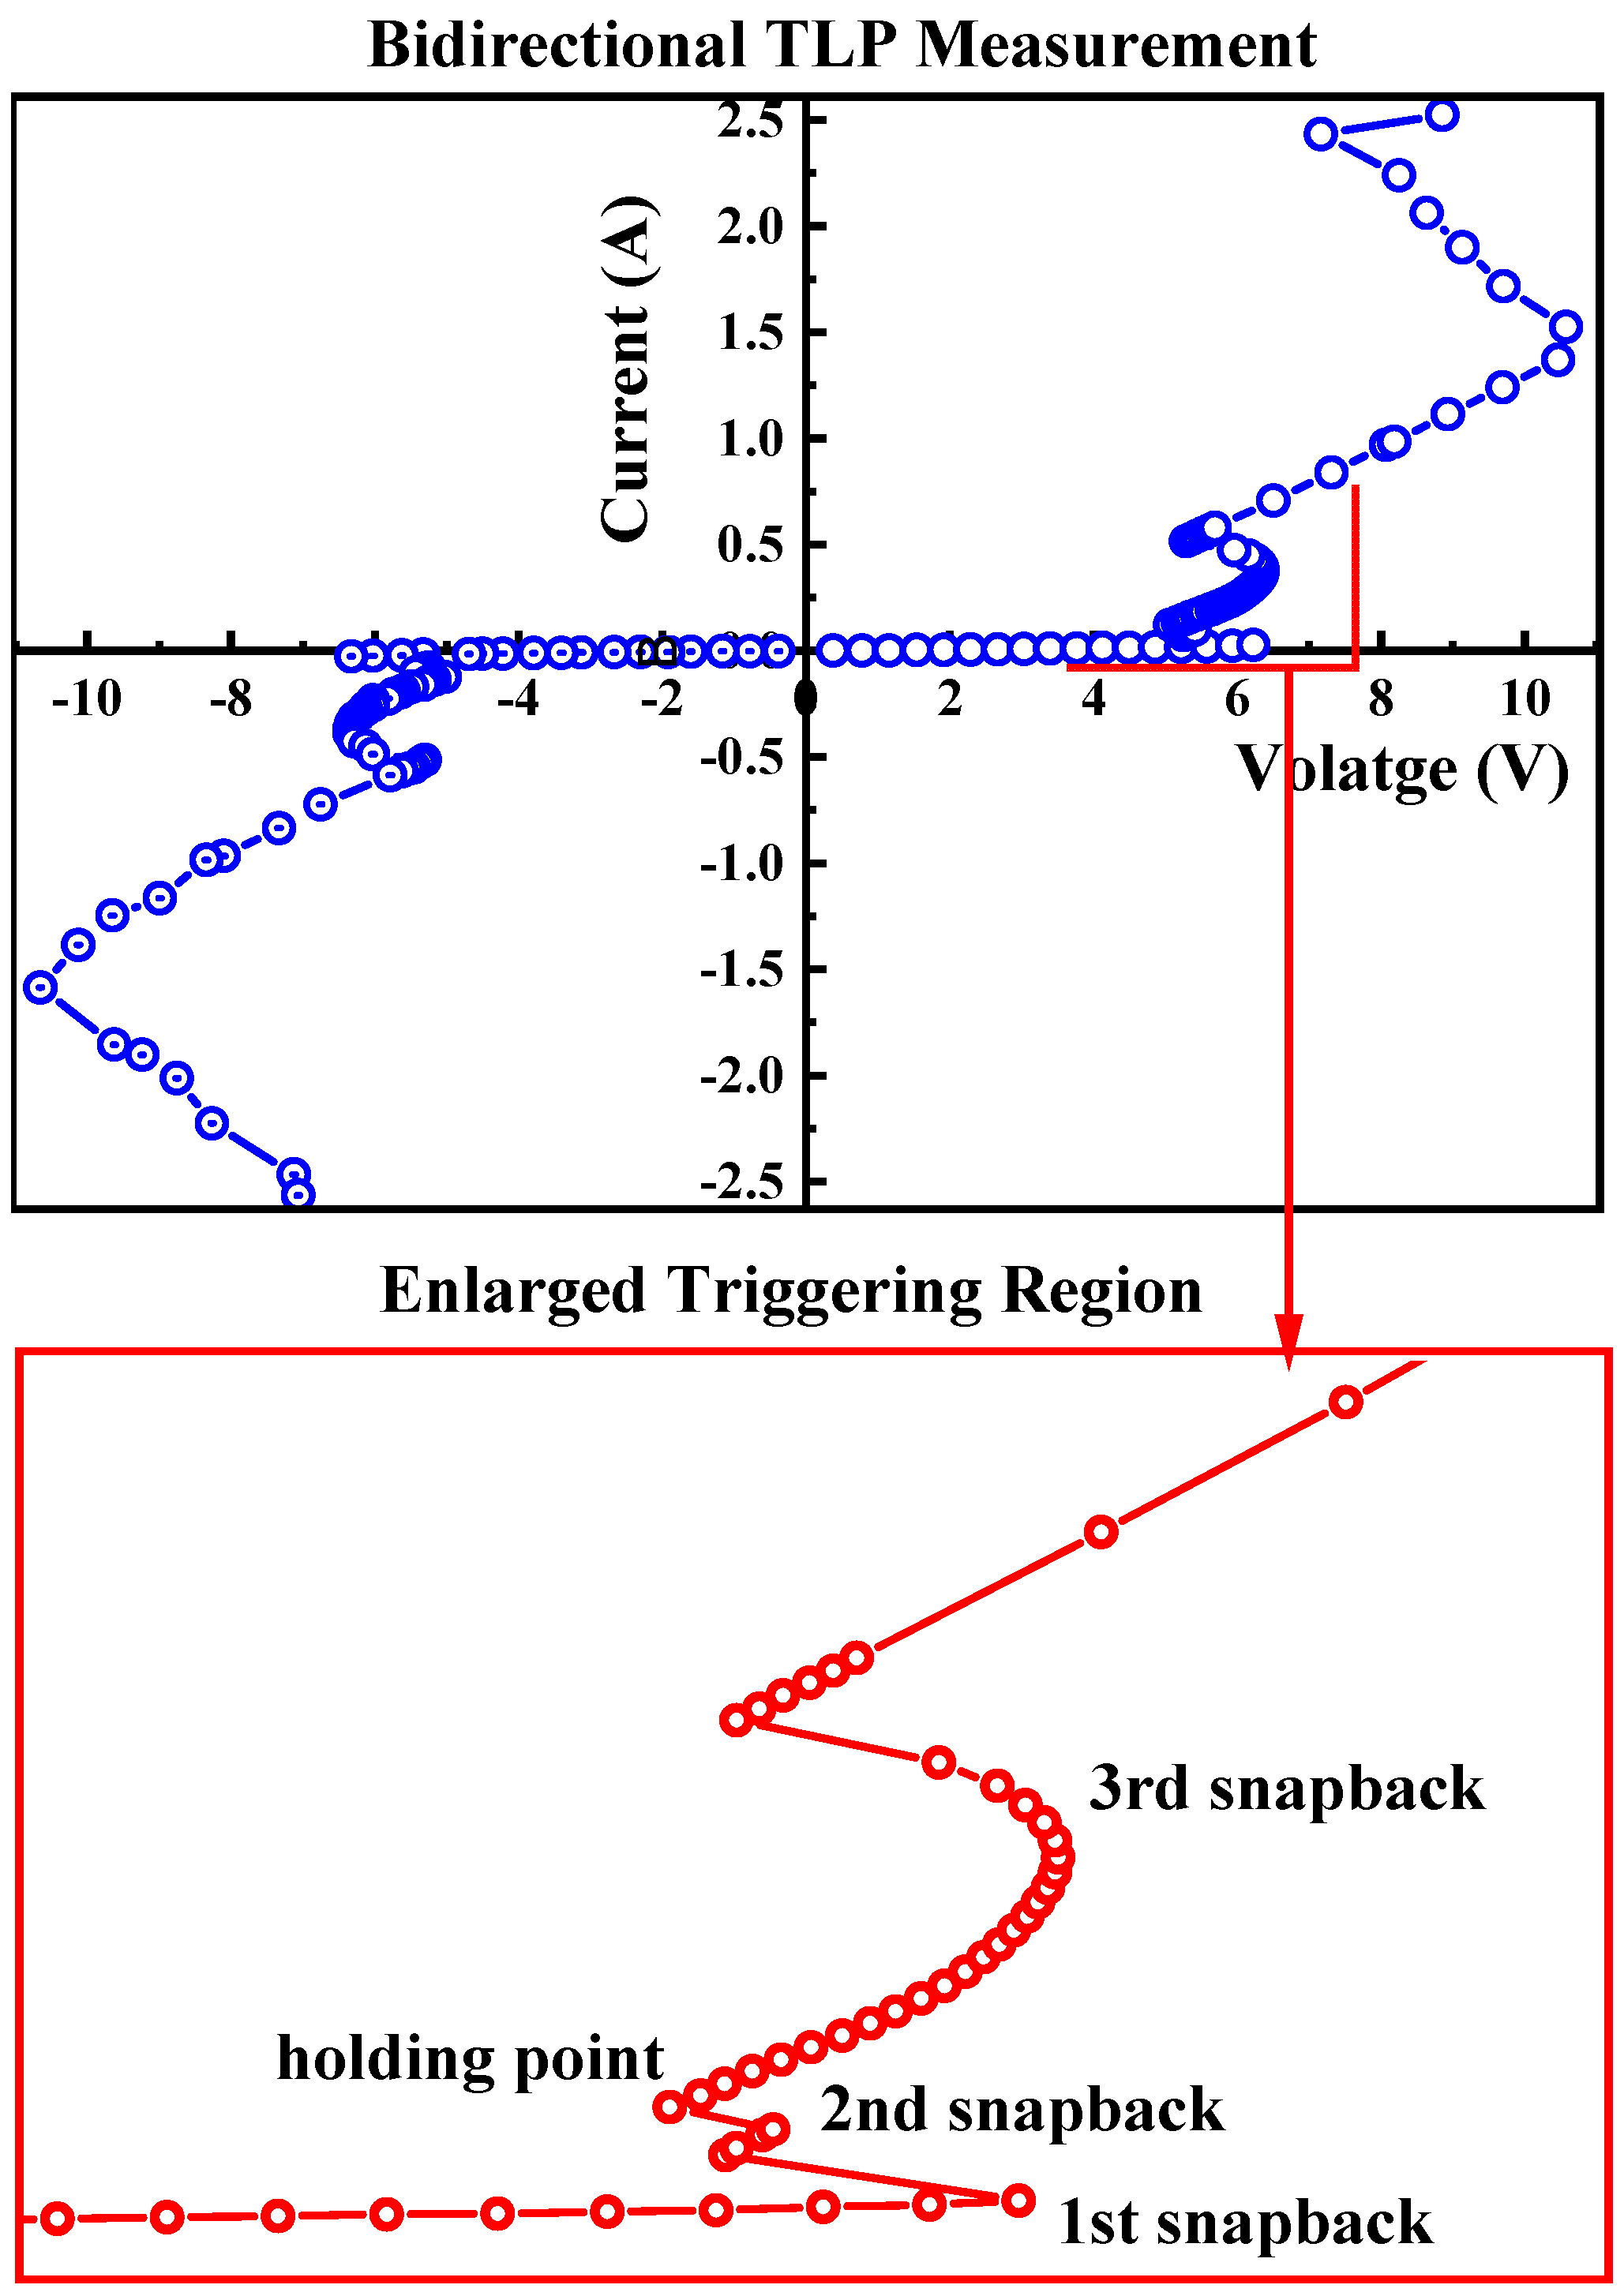
Figure 3.
TCAD-simulated current density distribution of PTBSCR (L = 0.5 μm) at different levels of current when T2 and G are grounded. The T1 is subject to (a) Ipulse = 50 μA, (b) Ipulse = 60 μA, (c) Ipulse = 75 μA, (d) Ipulse = 150 μA.
Figure 3.
TCAD-simulated current density distribution of PTBSCR (L = 0.5 μm) at different levels of current when T2 and G are grounded. The T1 is subject to (a) Ipulse = 50 μA, (b) Ipulse = 60 μA, (c) Ipulse = 75 μA, (d) Ipulse = 150 μA.
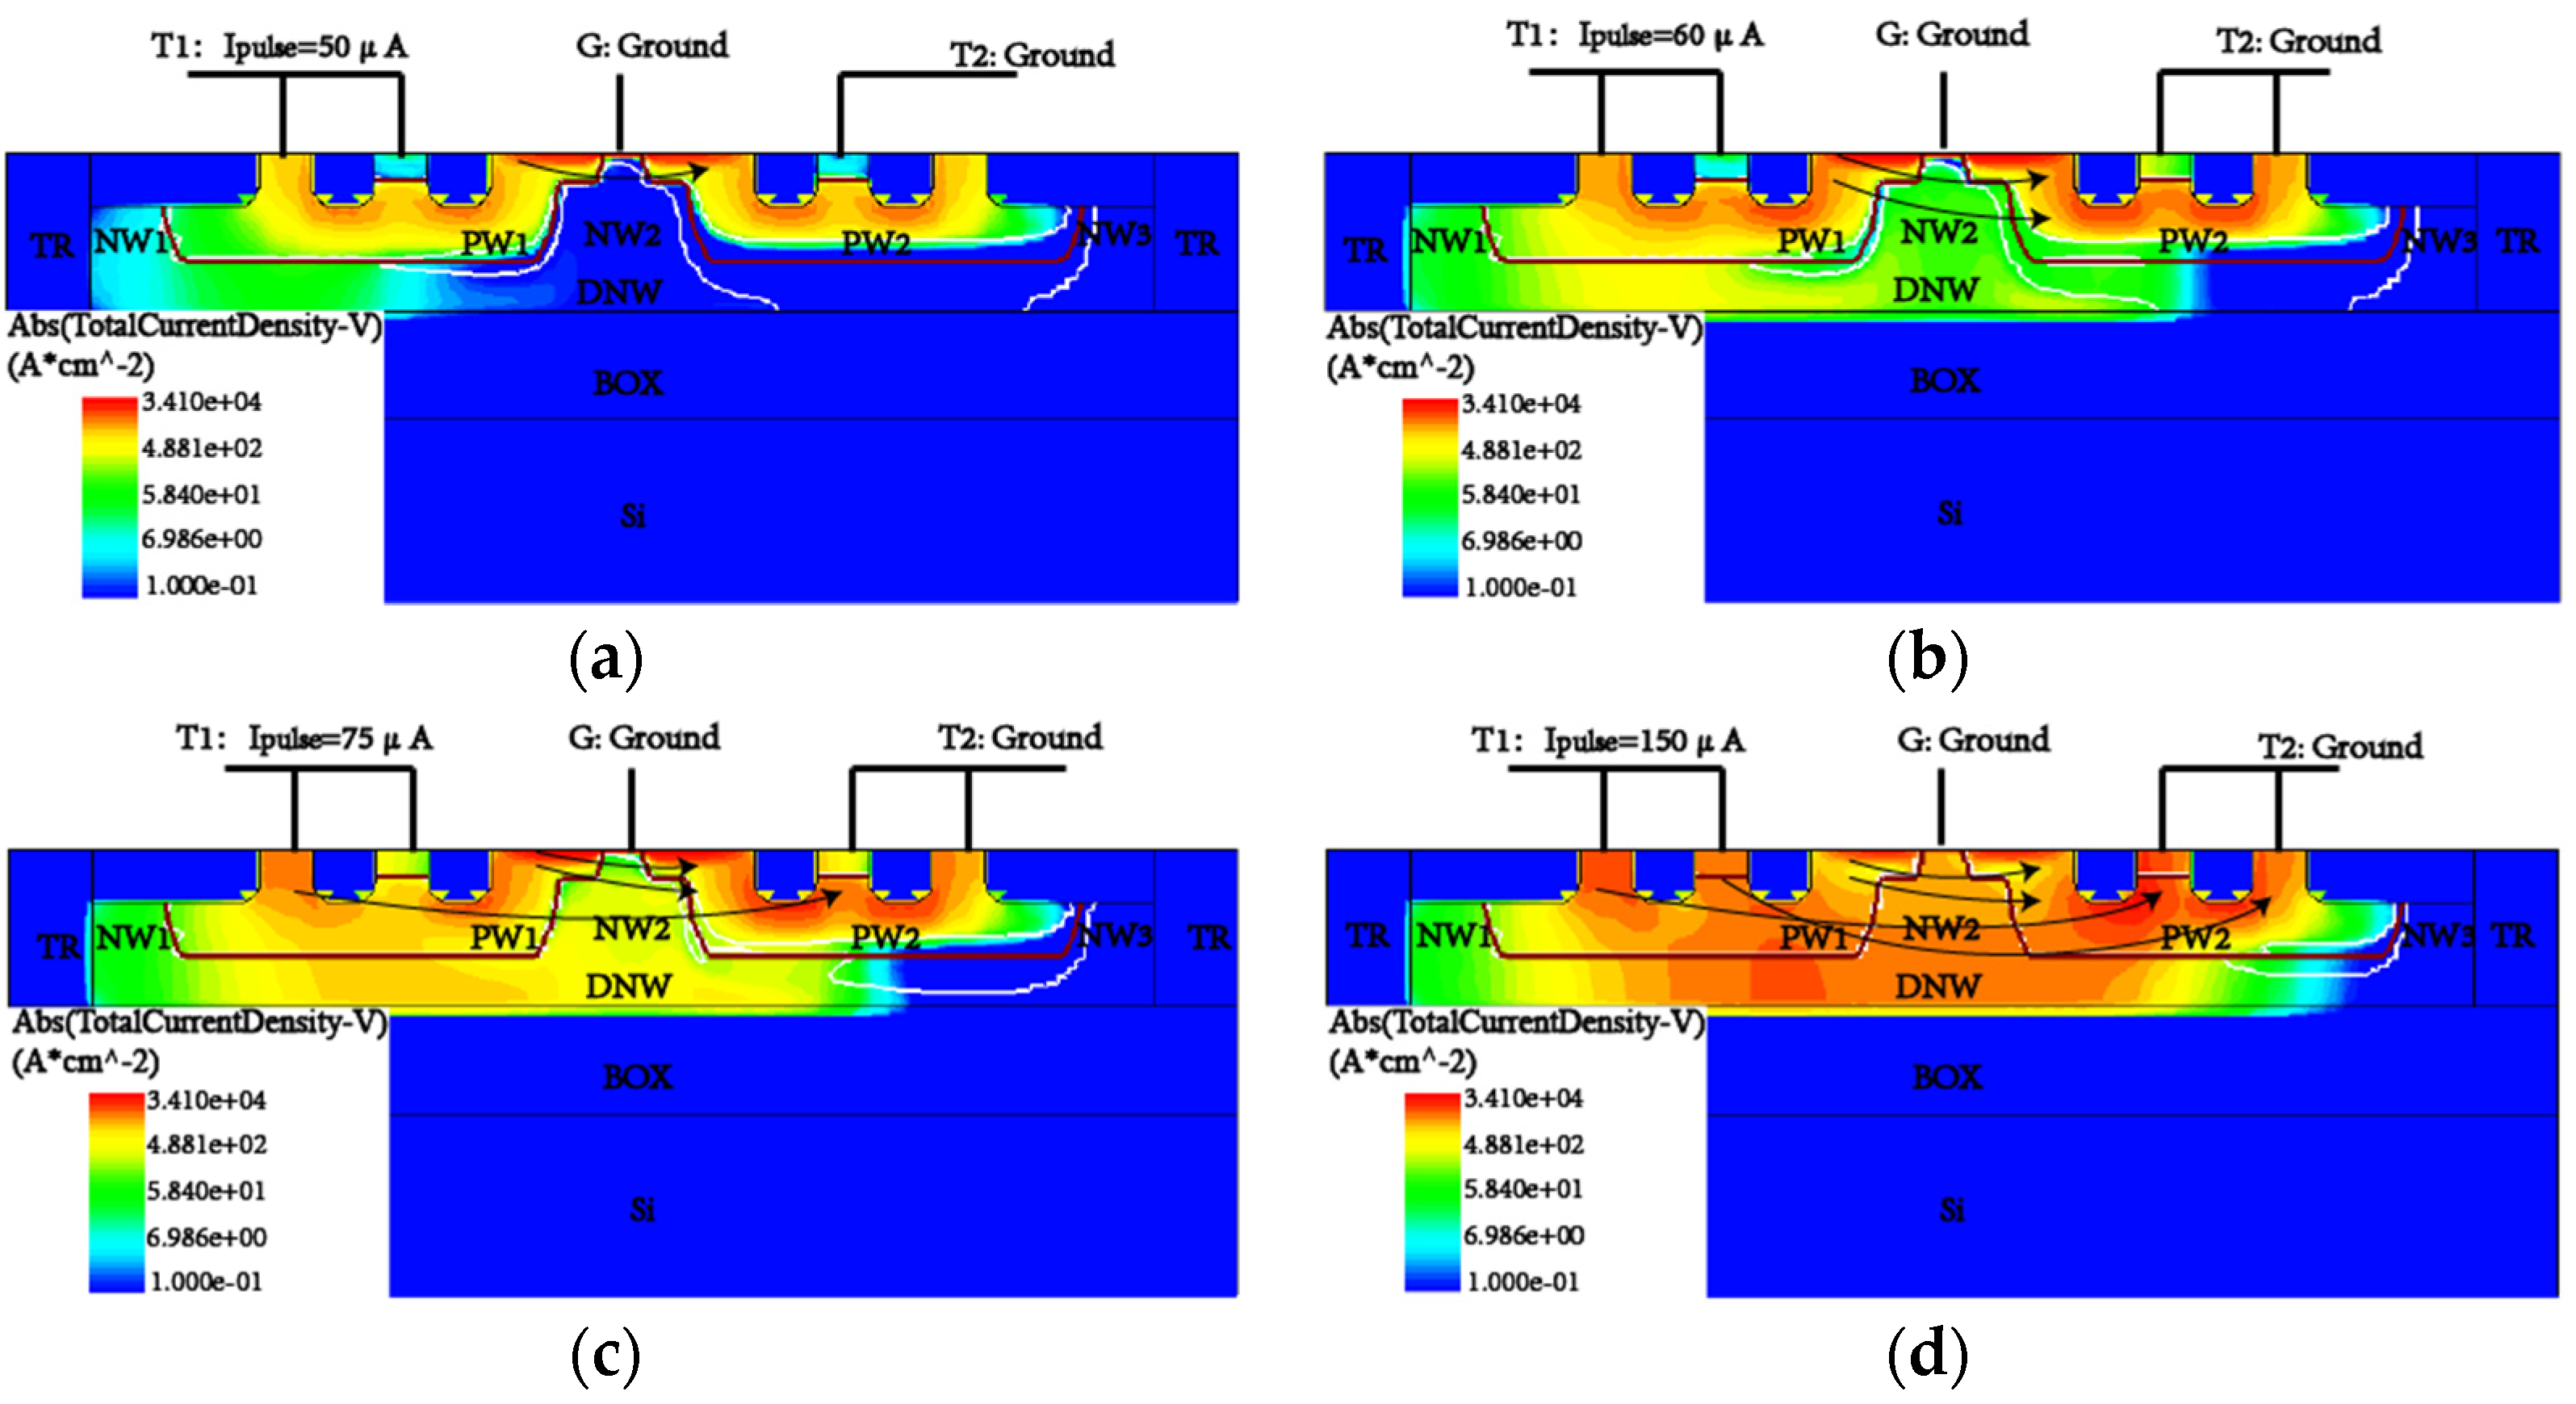
Figure 4.
TCAD-simulated impact ionization rate distribution in PTBSCR (L = 0.5 μm) when T1 is subject to the stress of Ipulse = 60 μA, T2 and G are grounded.
Figure 4.
TCAD-simulated impact ionization rate distribution in PTBSCR (L = 0.5 μm) when T1 is subject to the stress of Ipulse = 60 μA, T2 and G are grounded.
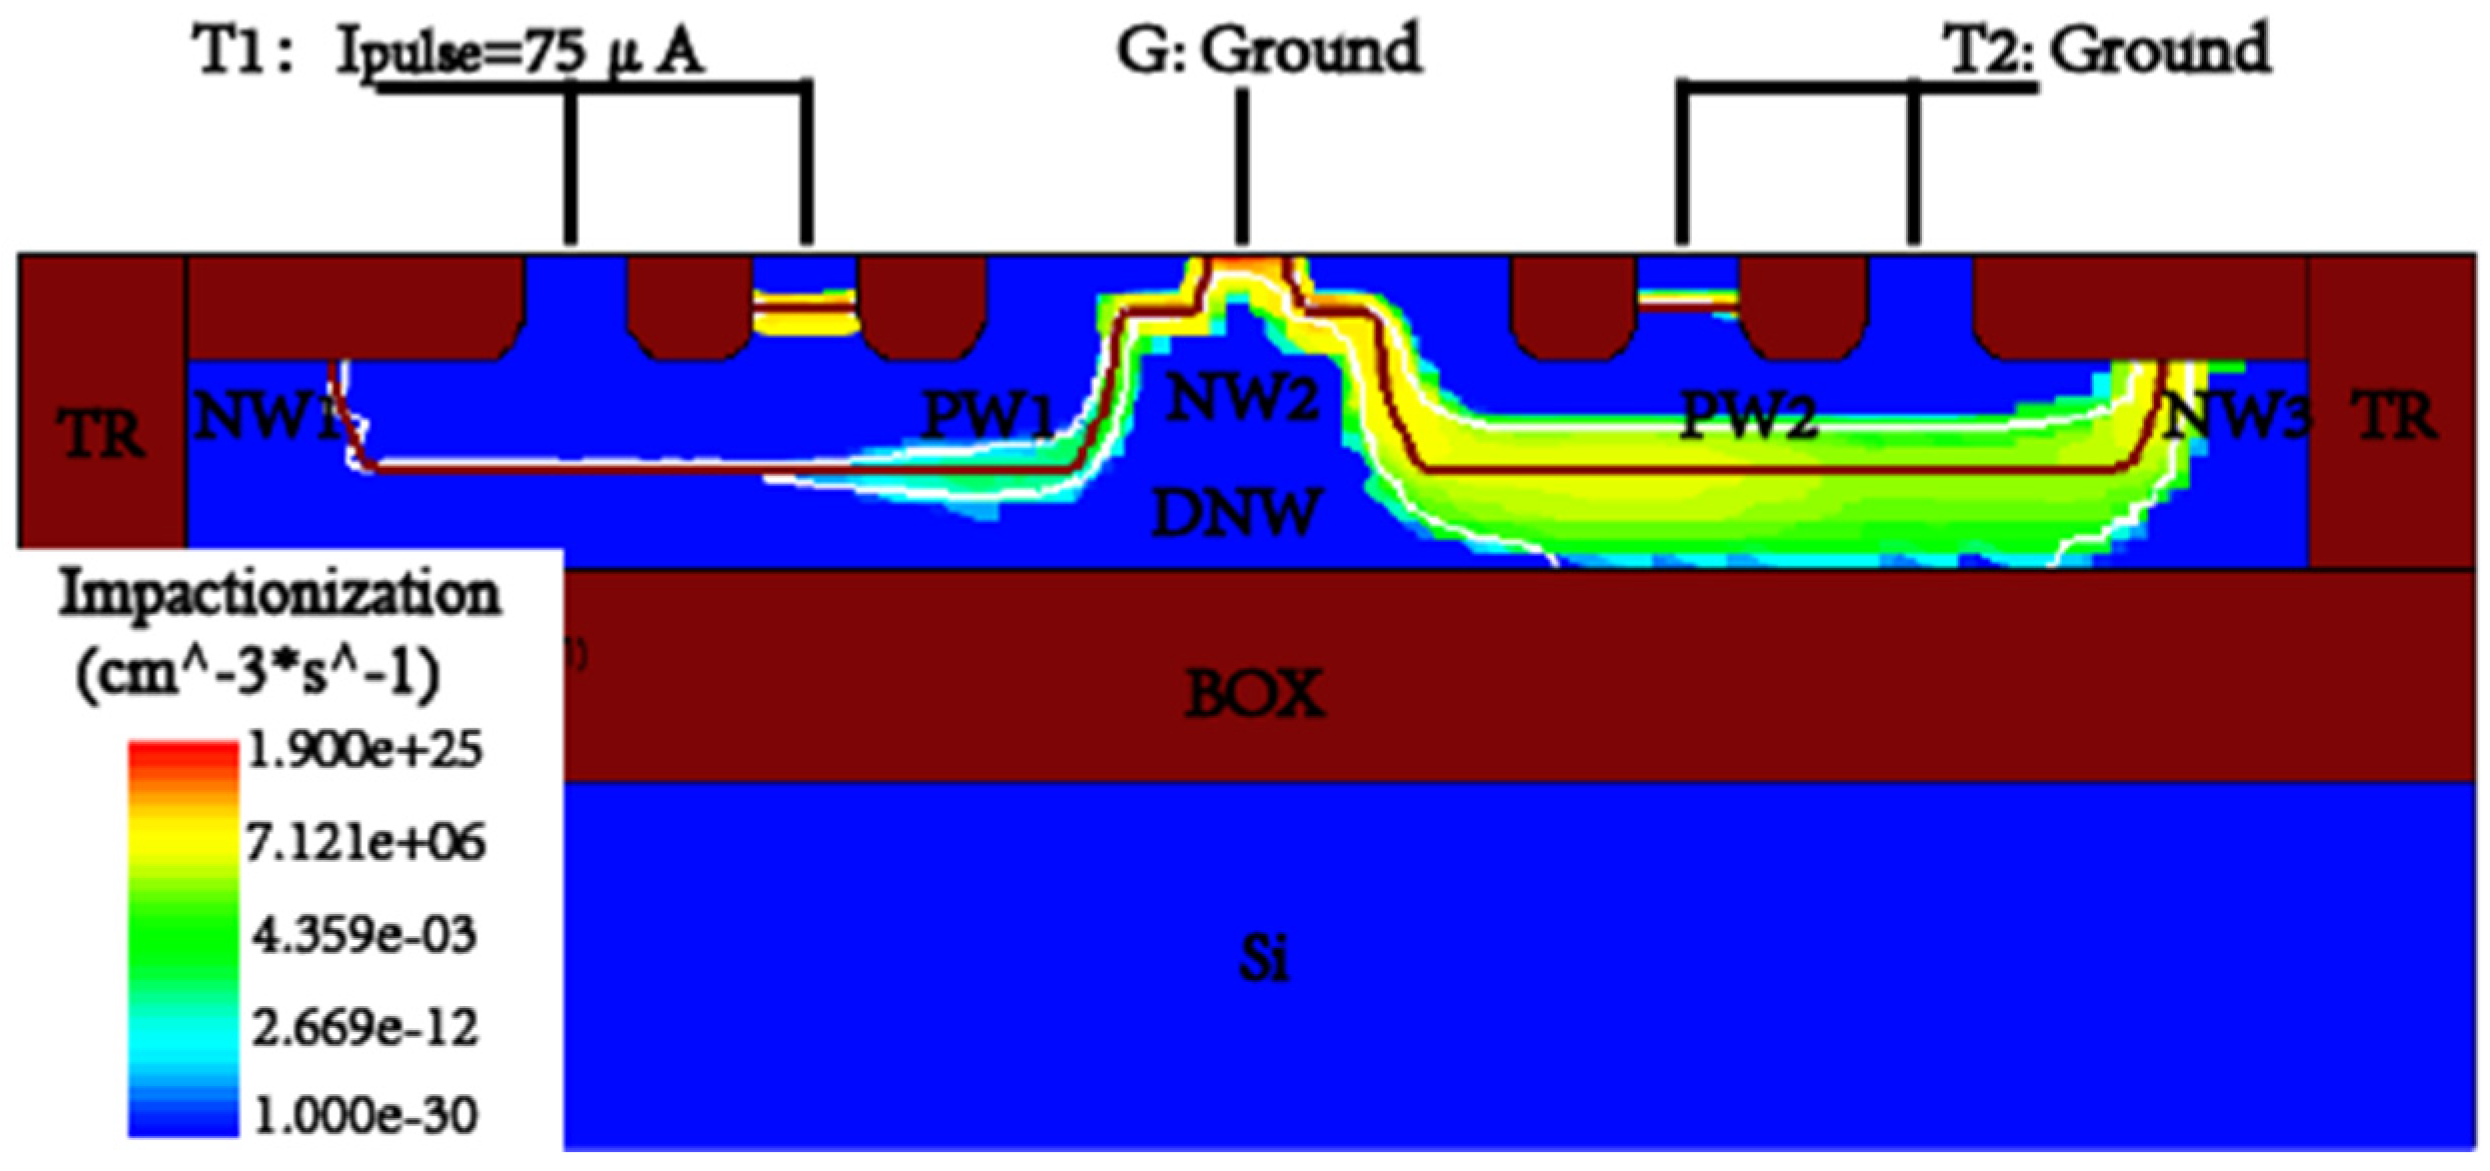
Figure 5.
Failure spots induced by ESD stress of the PTBSCR (L = 0.5 μm) in physical failure analysis.
Figure 5.
Failure spots induced by ESD stress of the PTBSCR (L = 0.5 μm) in physical failure analysis.
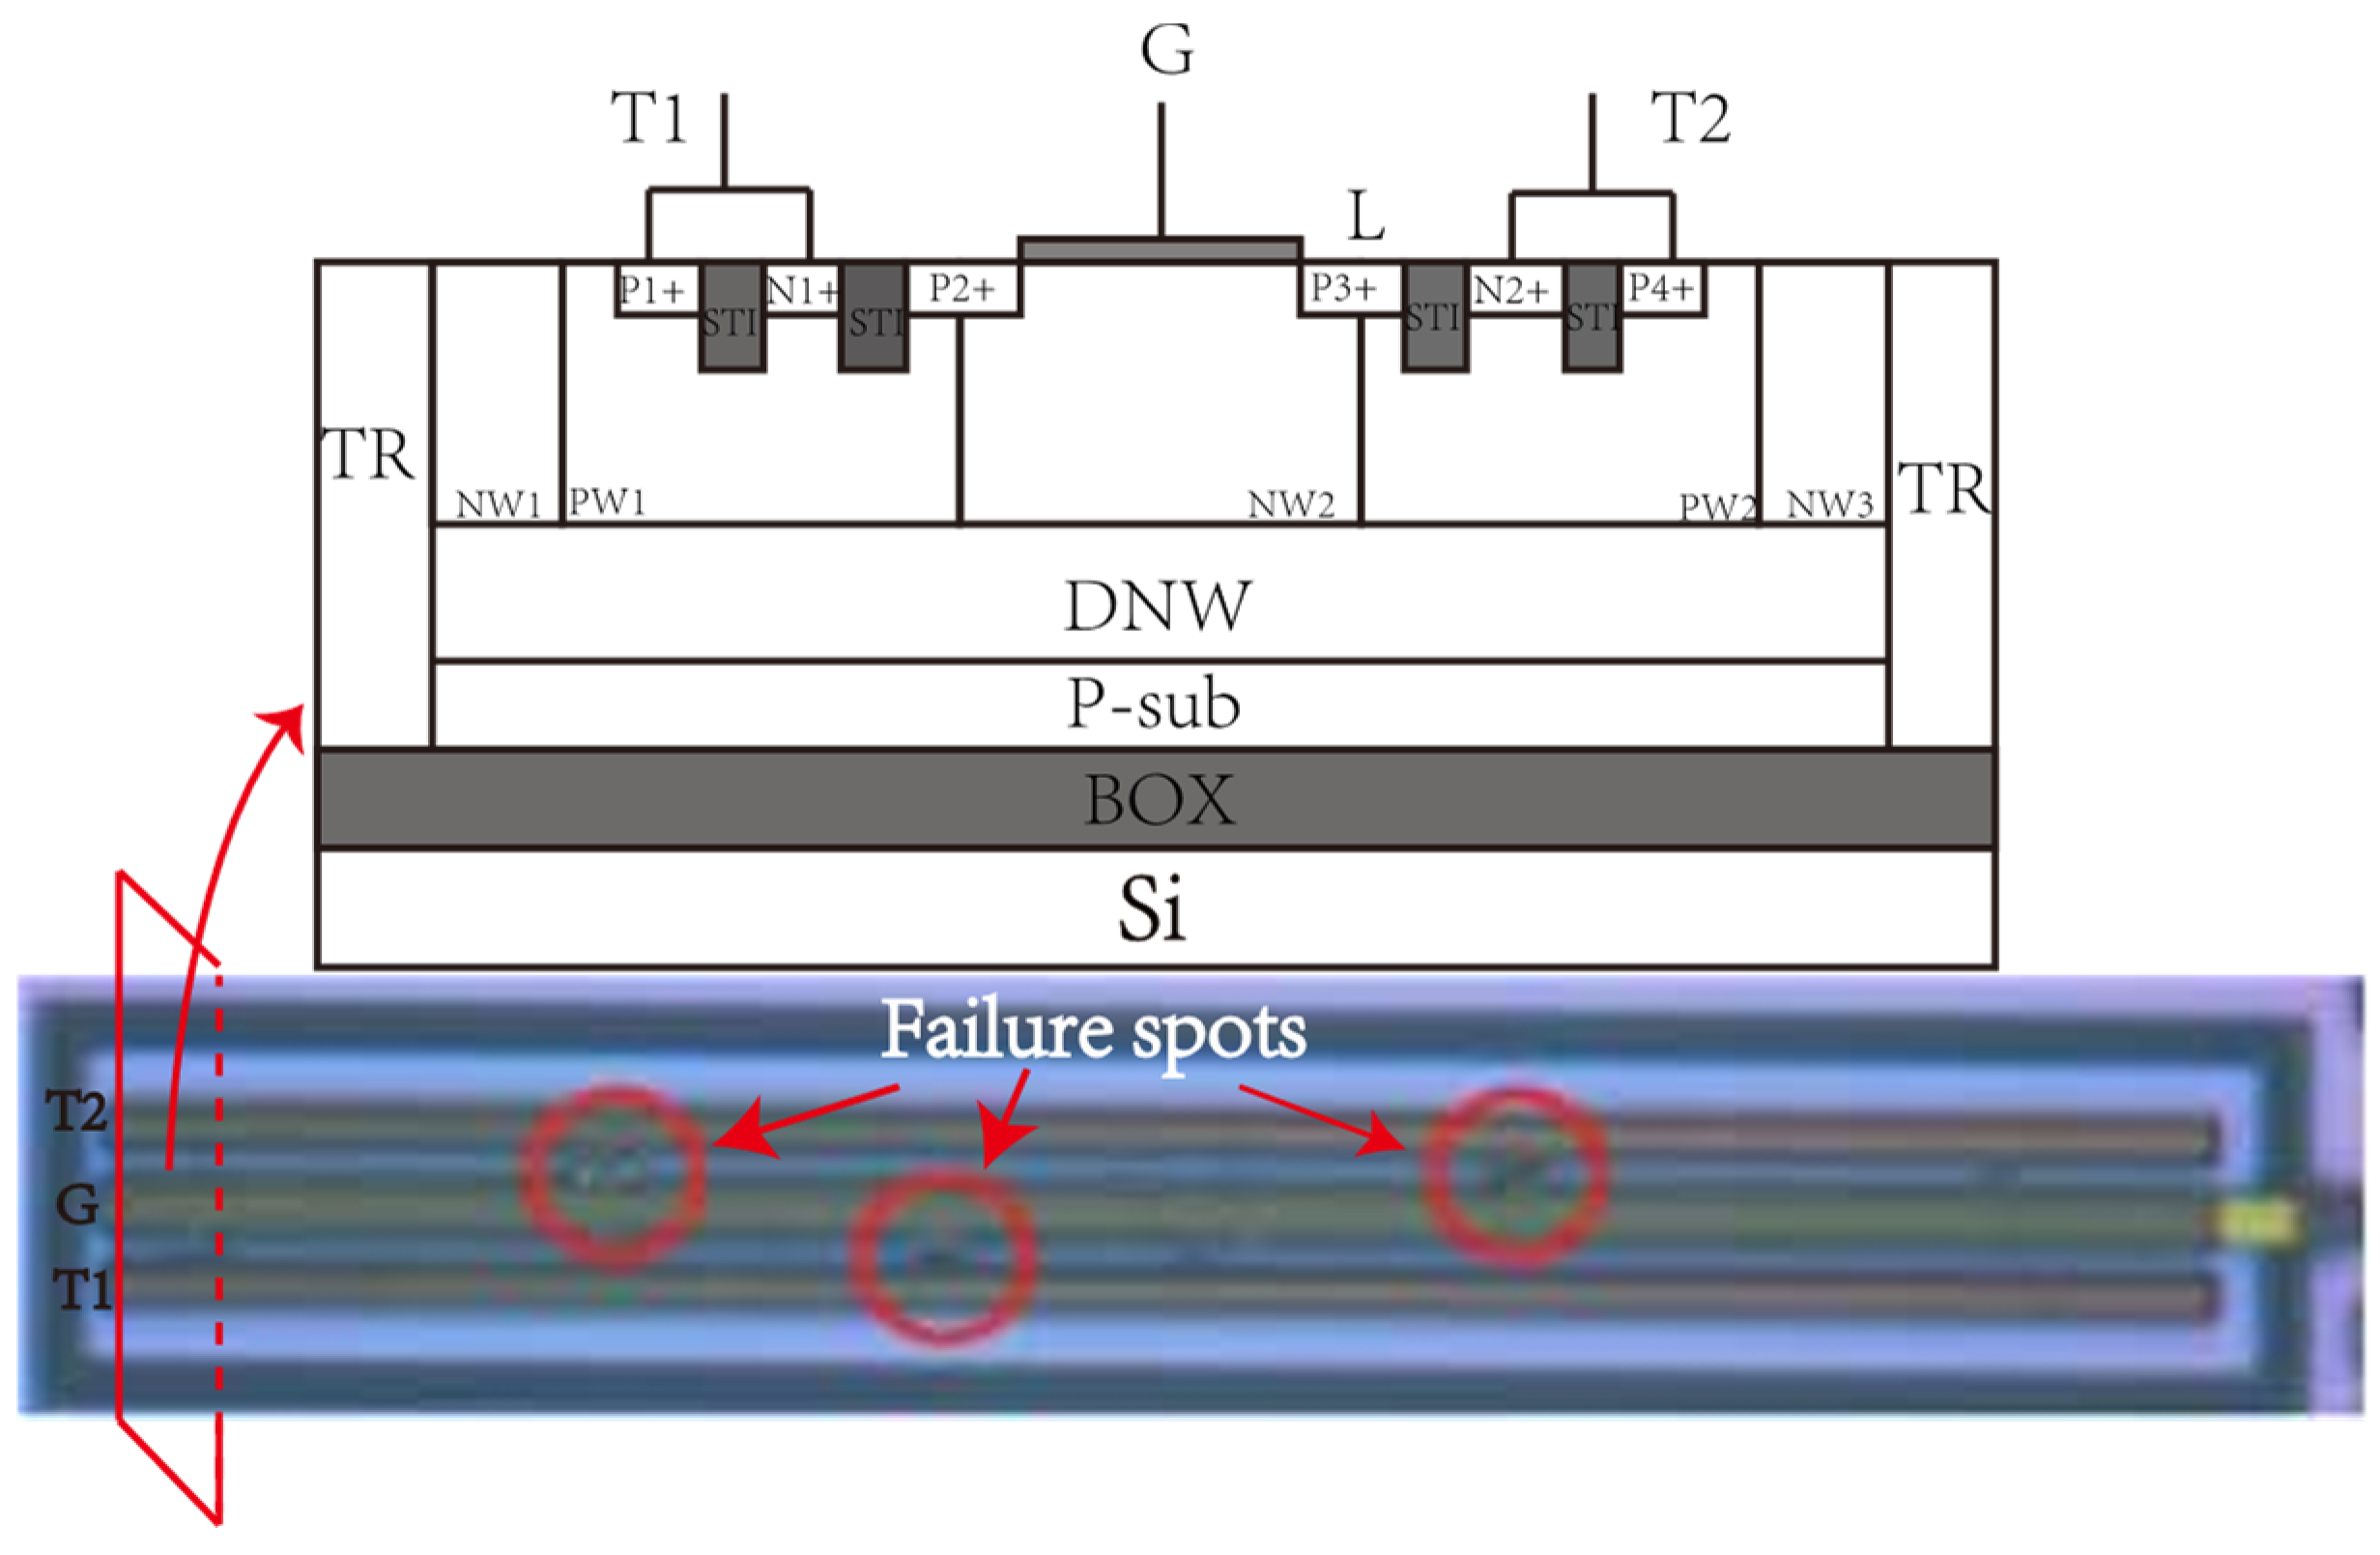
Figure 6.
TLP I-V curves for the PTBSCR (L = 0.5 μm) with different gate voltages.
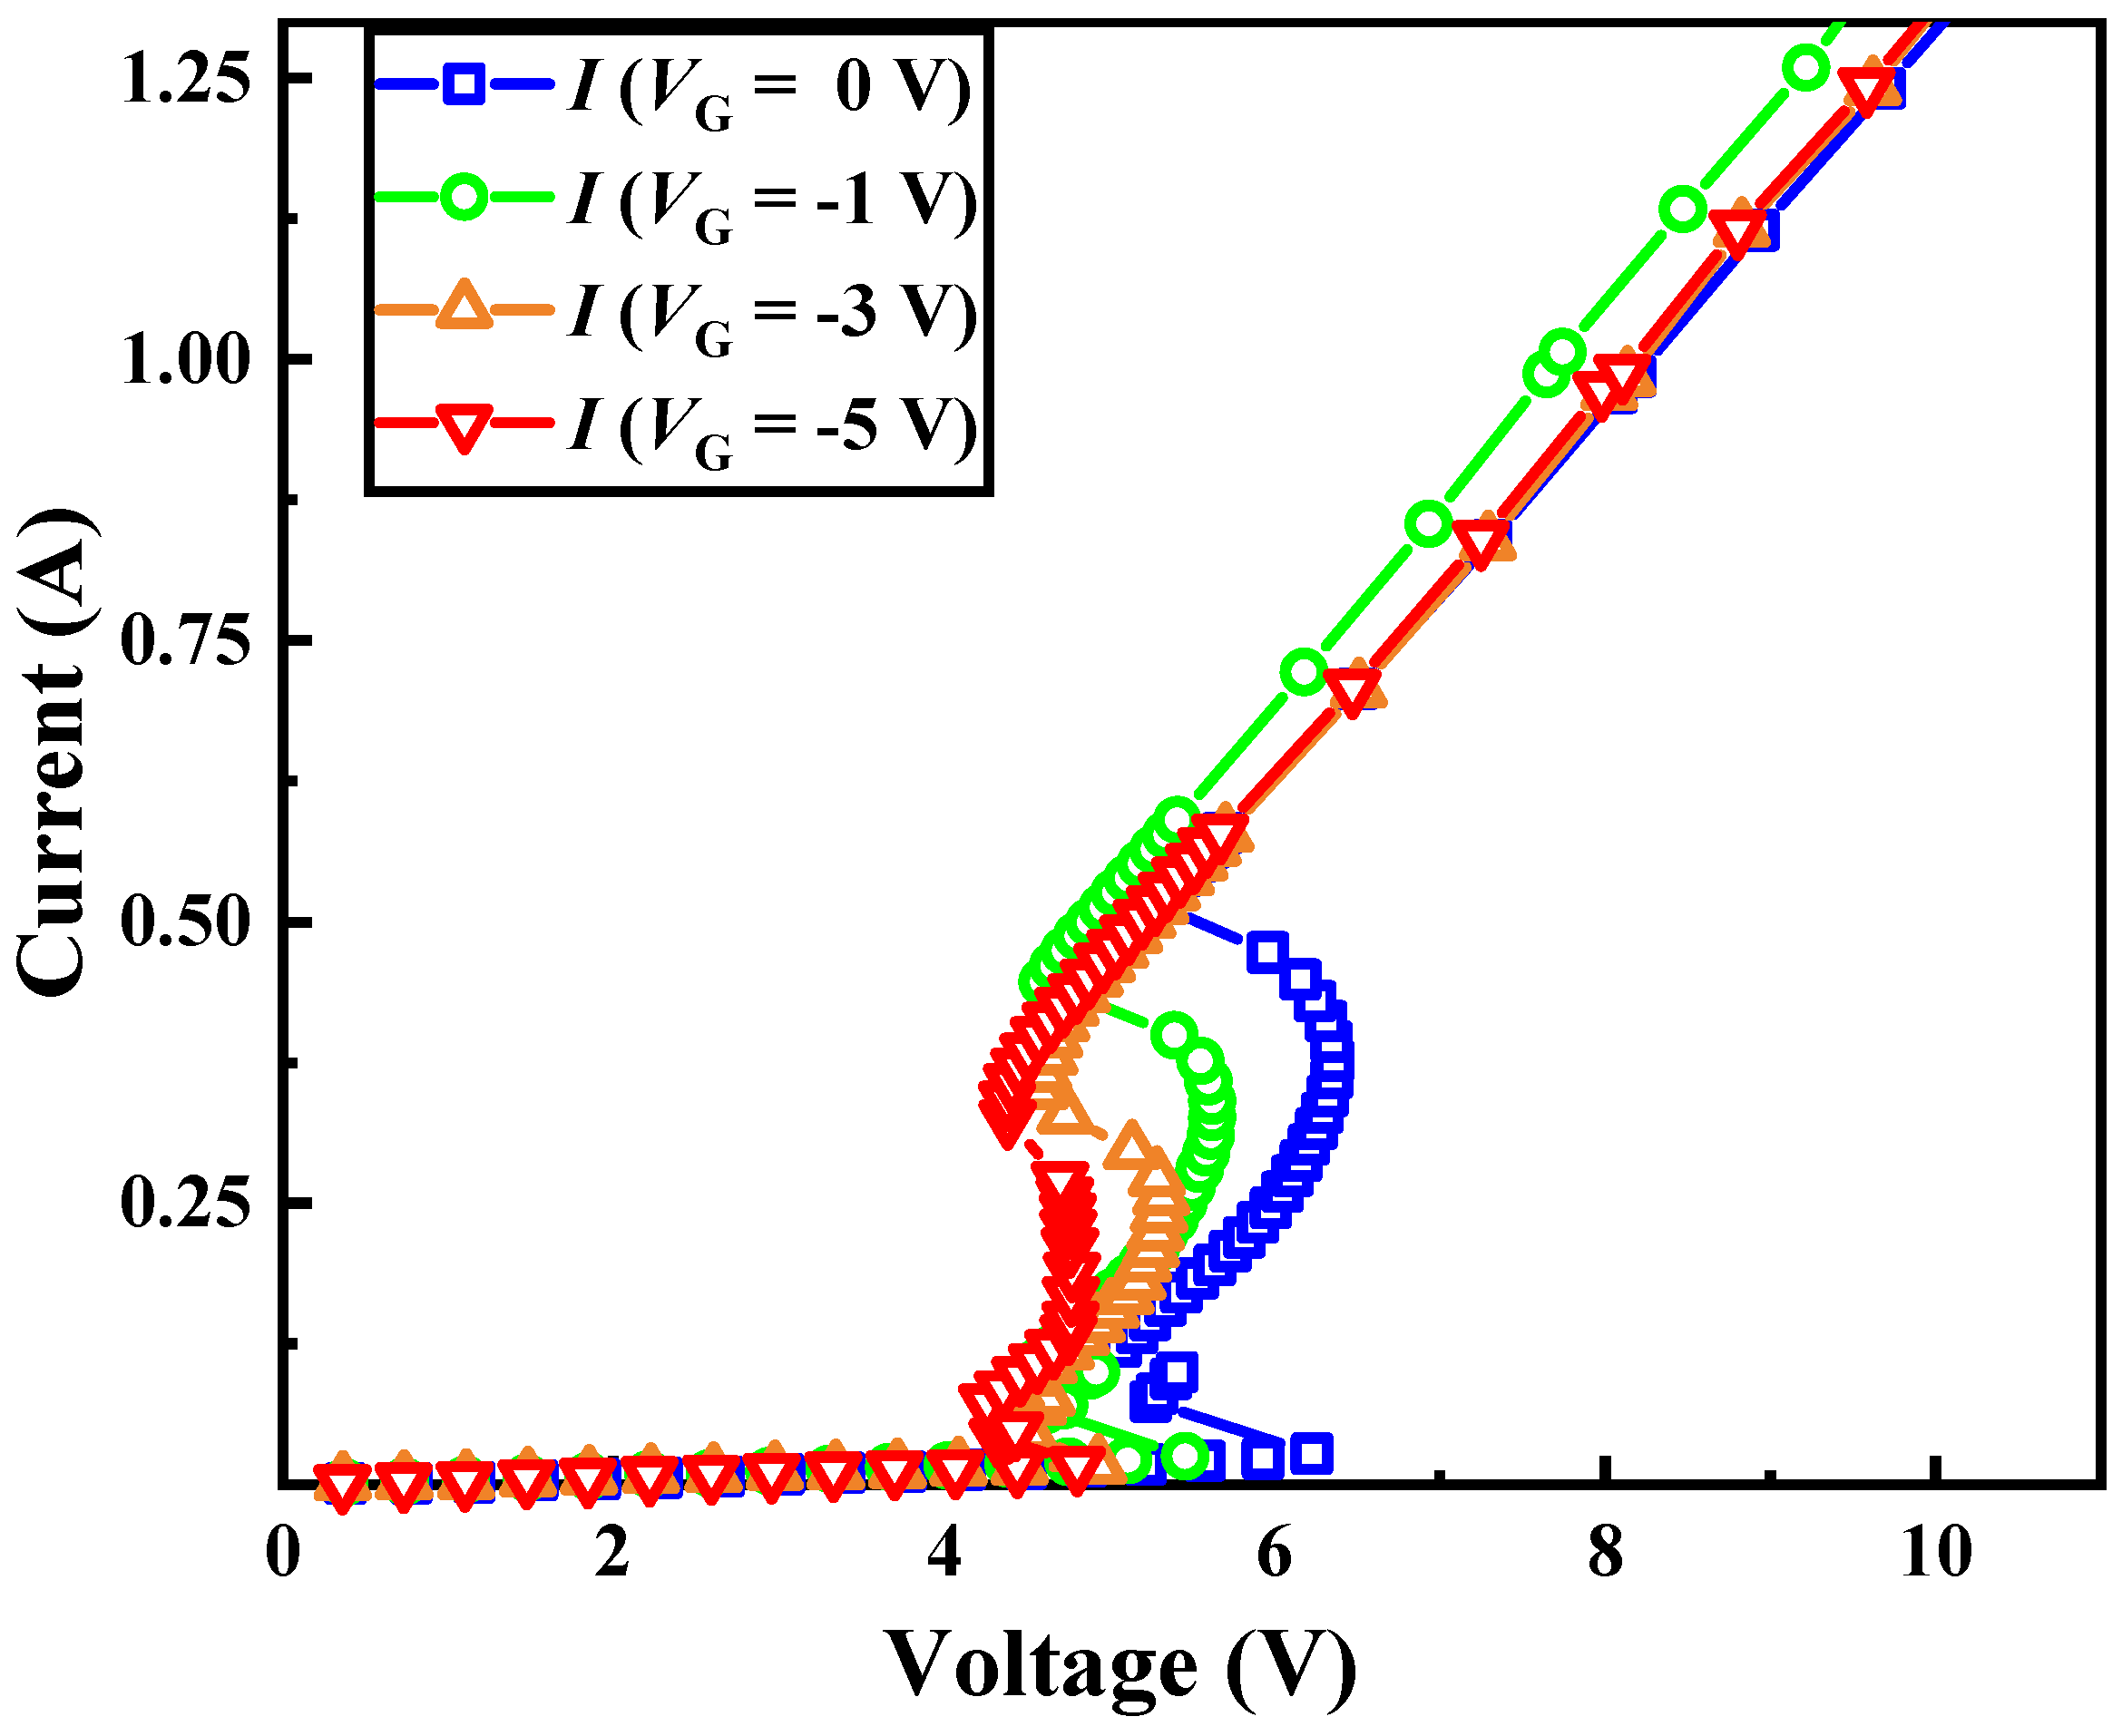
Figure 7.
Measured trigger voltage and holding voltage of PTBSCR with different L versus different gate voltages.
Figure 7.
Measured trigger voltage and holding voltage of PTBSCR with different L versus different gate voltages.

Figure 8.
TCAD-simulated electric field distribution of PTBSCR (L = 0.5 μm) when T1 is subject to a stress of Ipulse = 75 μA, T2 is grounded. The PTBSCR with (a) VG = 0 V, (b) VG = −1 V, (c) VG = −3 V, (d) VG = −5 V.
Figure 8.
TCAD-simulated electric field distribution of PTBSCR (L = 0.5 μm) when T1 is subject to a stress of Ipulse = 75 μA, T2 is grounded. The PTBSCR with (a) VG = 0 V, (b) VG = −1 V, (c) VG = −3 V, (d) VG = −5 V.
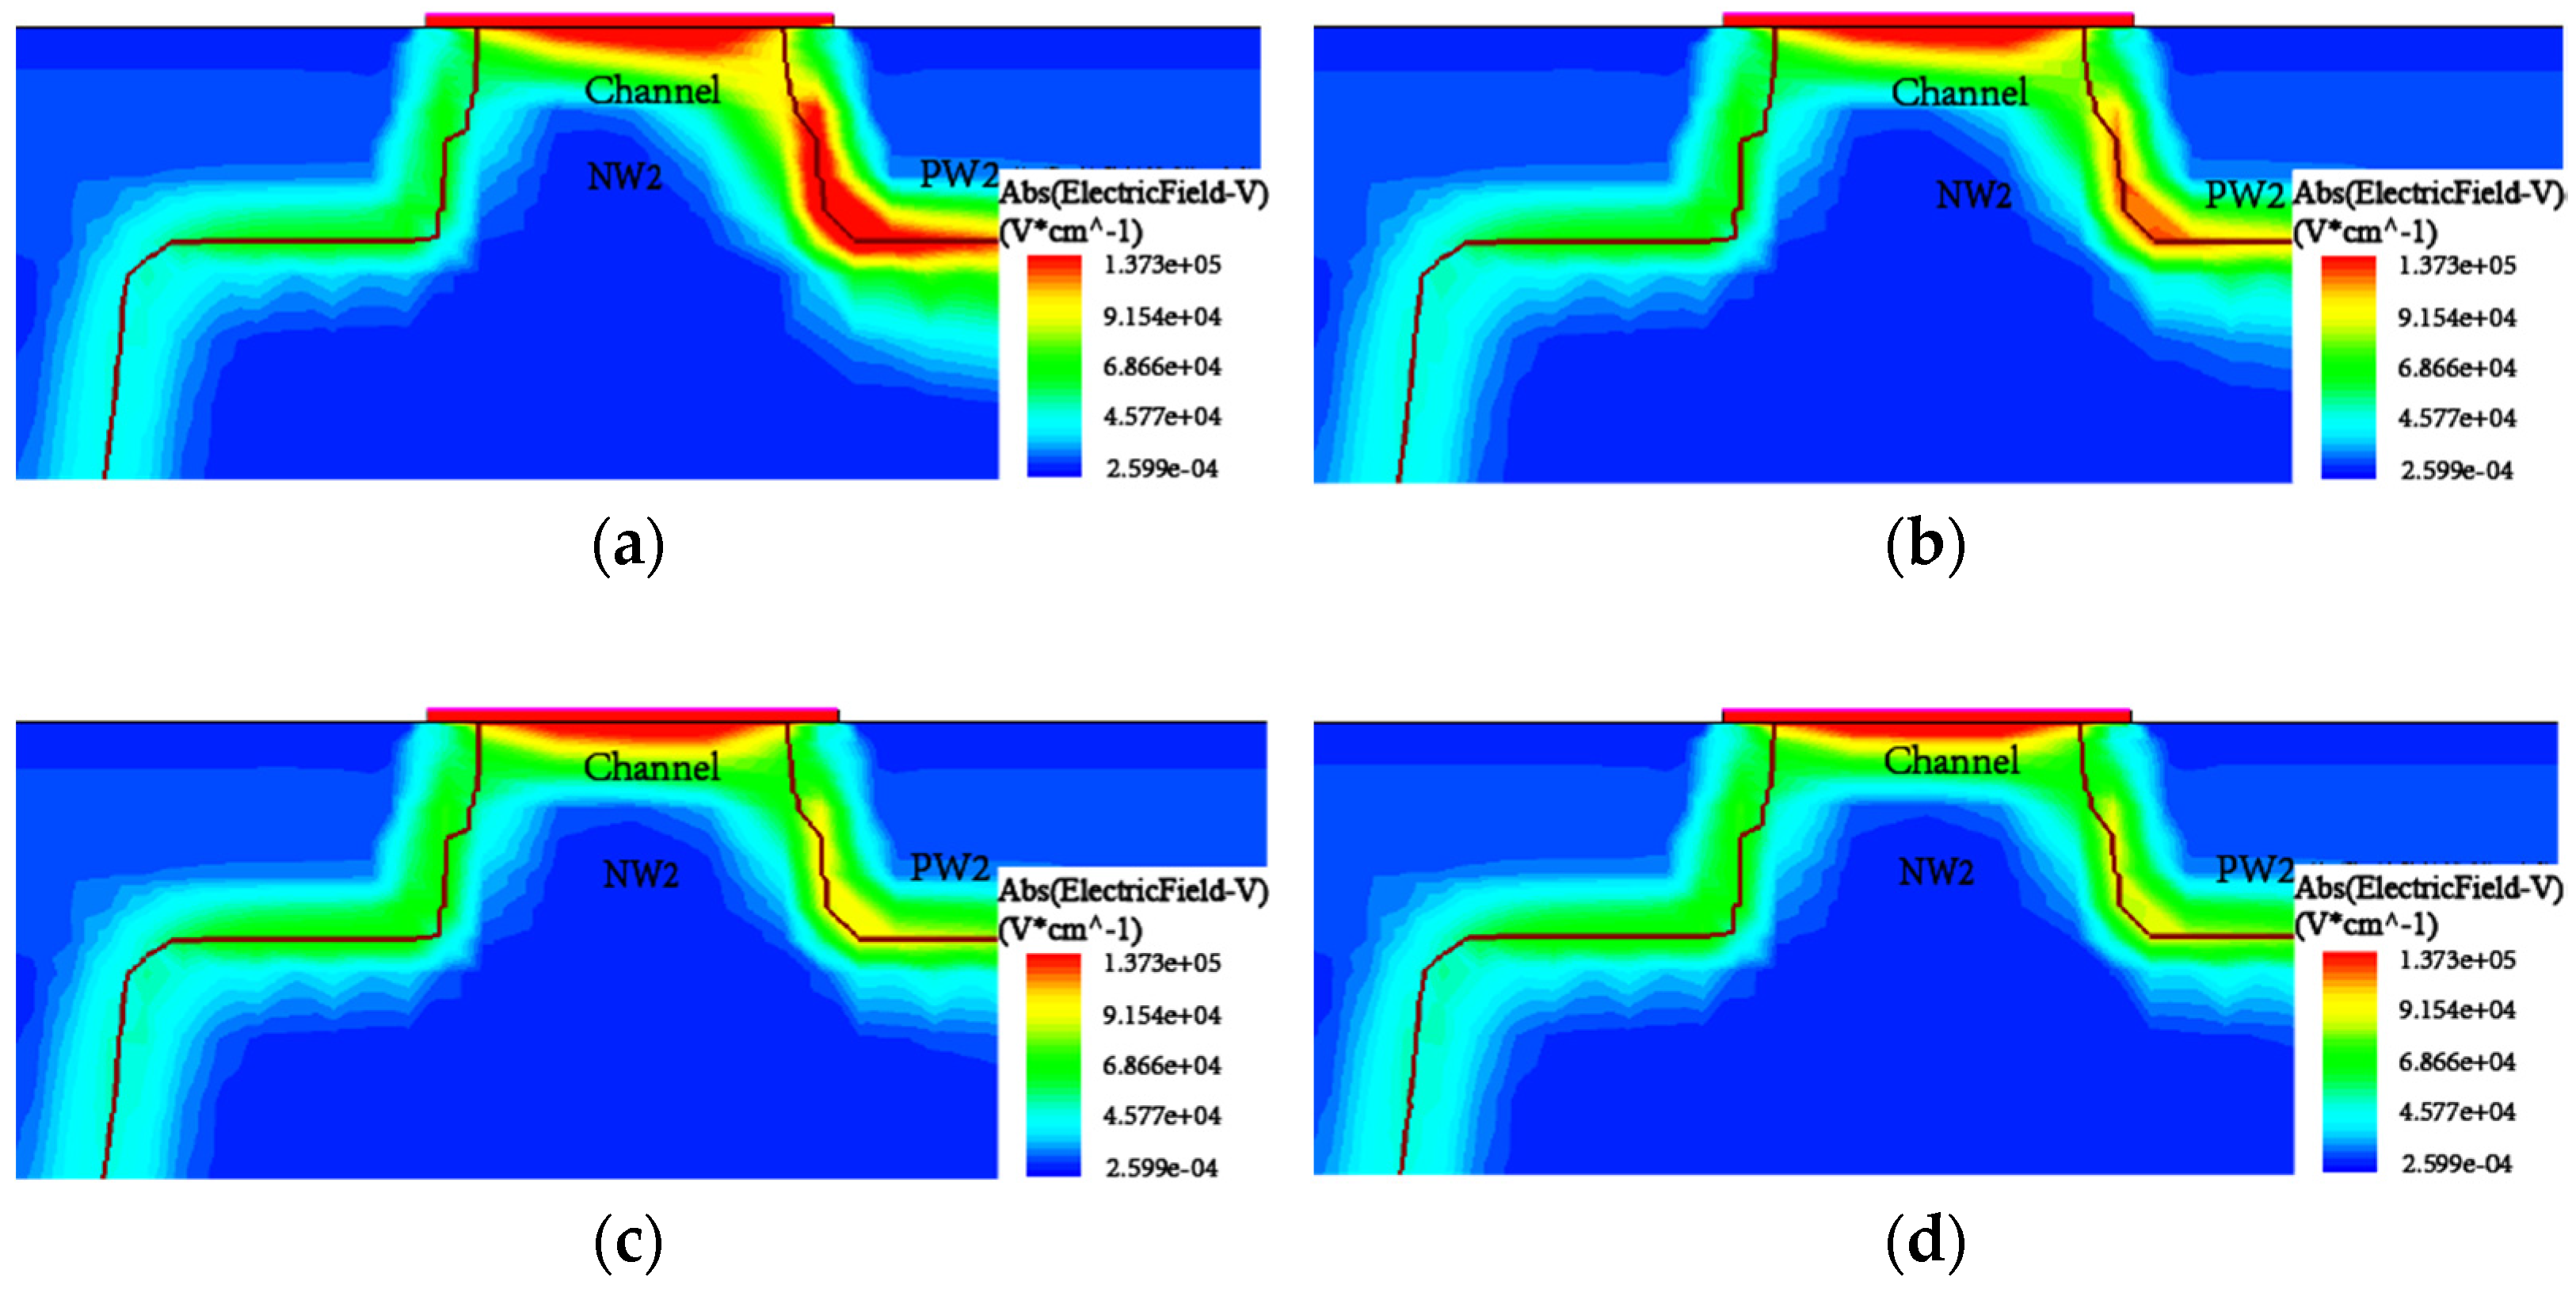
Figure 9.
TCAD-simulated electrostatic potential distribution of PTBSCR (L = 0.5 μm) when T1 is subject to a stress of Ipulse = 75 μA, T2 is grounded. The PTBSCR with (a) VG = 0 V, (b) VG = −1 V, (c) VG = −3 V, (d) VG = −5 V.
Figure 9.
TCAD-simulated electrostatic potential distribution of PTBSCR (L = 0.5 μm) when T1 is subject to a stress of Ipulse = 75 μA, T2 is grounded. The PTBSCR with (a) VG = 0 V, (b) VG = −1 V, (c) VG = −3 V, (d) VG = −5 V.

Figure 10.
TLP I-V curves of PTBSCR (L = 0.5 μm) with/without STI when G is grounded.
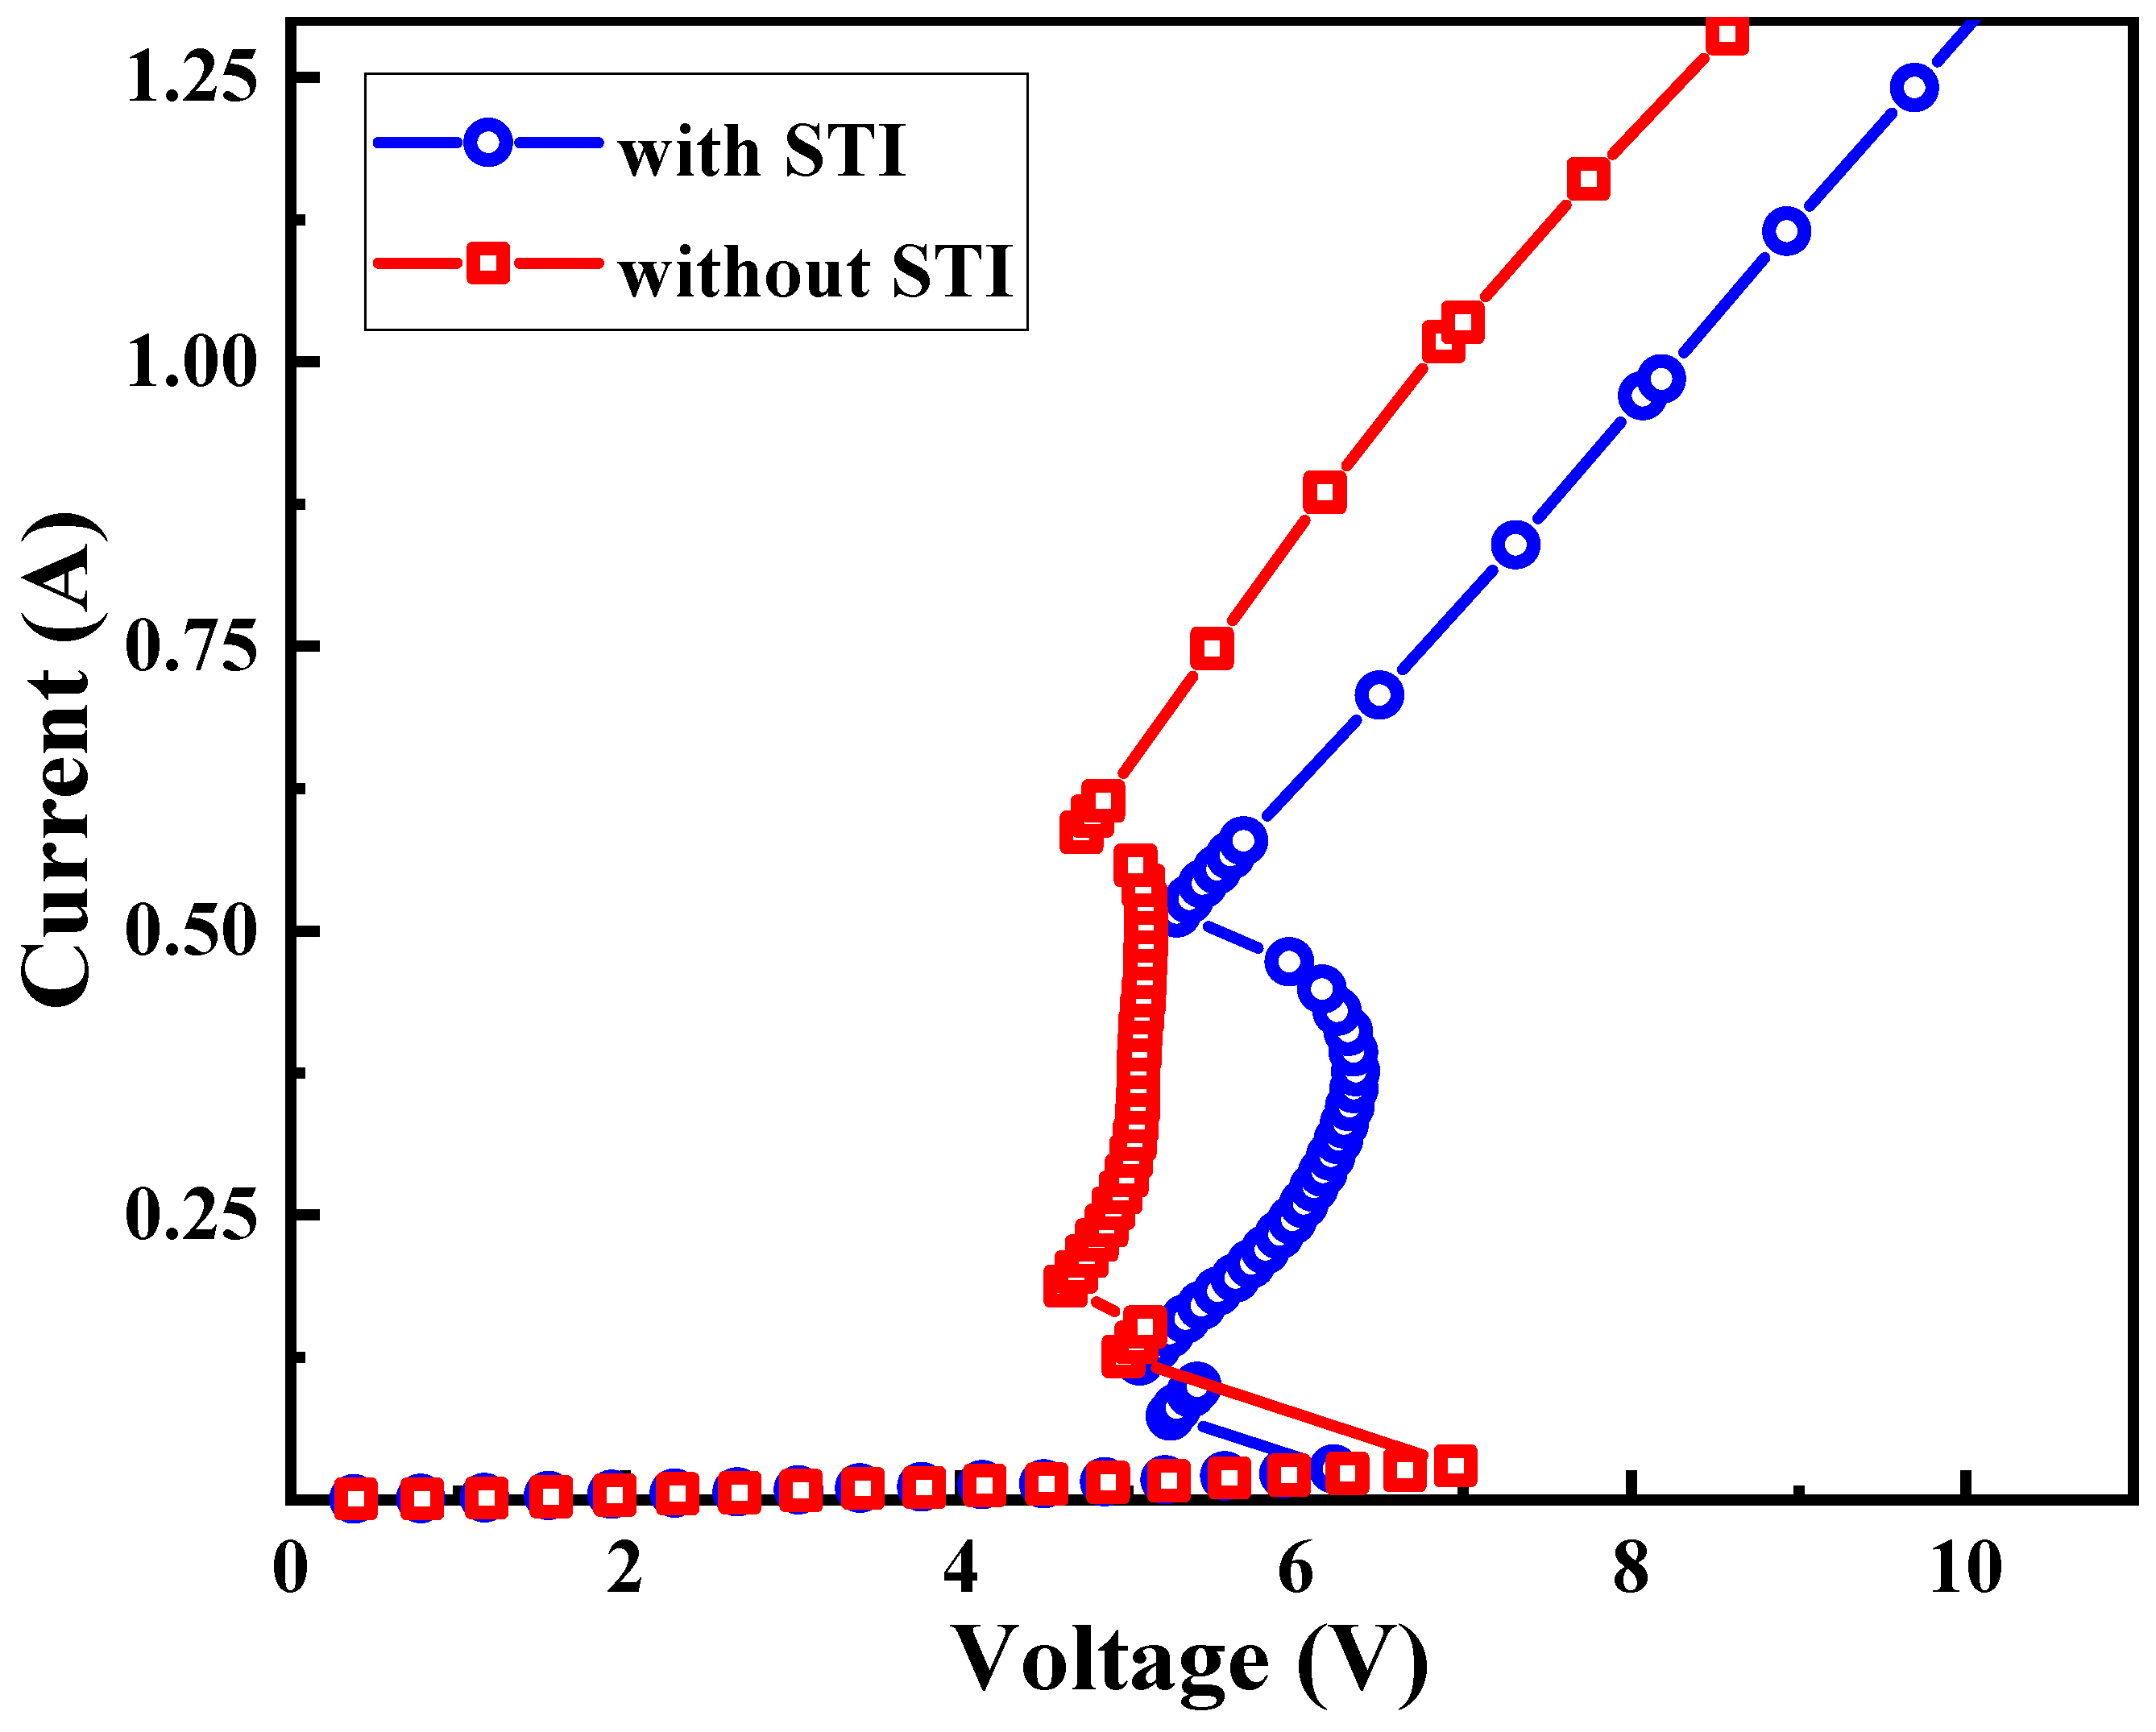
Figure 11.
Trigger voltage, holding voltage for the PTBSCR (L = 0.5 μm) versus different gate voltages.
Figure 11.
Trigger voltage, holding voltage for the PTBSCR (L = 0.5 μm) versus different gate voltages.


Table 1.
Some parameters of PTBSCR.
| Parameters | Volume |
|---|---|
| TSi (μm) | 1.5 |
| TBOX (μm) | 1.0 |
| Tgate (nm) | 14 |
| TSTI (μm) | 0.4 |
| DNW/DPW (μm) | 1.0 |
| L1 (μm) | 0.6 |
| L2 (μm) | 0.6 |
Publisher’s Note: MDPI stays neutral with regard to jurisdictional claims in published maps and institutional affiliations. |
© 2022 by the authors. Licensee MDPI, Basel, Switzerland. This article is an open access article distributed under the terms and conditions of the Creative Commons Attribution (CC BY) license (https://creativecommons.org/licenses/by/4.0/).
Share and Cite
MDPI and ACS Style
Li, M.; Cai, X.; Zeng, C.; Li, X.; Ni, T.; Wang, J.; Li, D.; Zhao, F.; Han, Z. The ESD Characteristics of a pMOS-Triggered Bidirectional SCR in SOI BCD Technology. Electronics 2022, 11, 546. https://doi.org/10.3390/electronics11040546
AMA Style
Li M, Cai X, Zeng C, Li X, Ni T, Wang J, Li D, Zhao F, Han Z. The ESD Characteristics of a pMOS-Triggered Bidirectional SCR in SOI BCD Technology. Electronics. 2022; 11(4):546. https://doi.org/10.3390/electronics11040546
Chicago/Turabian StyleLi, Mingzhu, Xiaowu Cai, Chuanbin Zeng, Xiaojing Li, Tao Ni, Juanjuan Wang, Duoli Li, Fazhan Zhao, and Zhengsheng Han. 2022. "The ESD Characteristics of a pMOS-Triggered Bidirectional SCR in SOI BCD Technology" Electronics 11, no. 4: 546. https://doi.org/10.3390/electronics11040546
Note that from the first issue of 2016, this journal uses article numbers instead of page numbers. See further details here.