Article

Textural Feature Analysis of Optical Coherence Tomography Phantoms

1
School of Optometry and Vision Sciences, Cardiff University, Cardiff CF24 4HQ, UK
2
Kazakh Eye Research Institute, Almaty A05H2A8, Kazakhstan
3
UK Dementia Research Institute, Cardiff University, Cardiff CF24 4HQ, UK
4
Visual Information Laboratory, University of Bristol, Bristol BS8 1TH, UK
*
Author to whom correspondence should be addressed.
Electronics 2022, 11(4), 669; https://doi.org/10.3390/electronics11040669
Submission received: 3 January 2022 / Revised: 14 February 2022 / Accepted: 20 February 2022 / Published: 21 February 2022
(This article belongs to the Special Issue Medical Image Analysis and Computer Vision)

Abstract

:
Optical coherence tomography (OCT) is an imaging technique based on interferometry of backscattered lights from materials and biological samples. For the quantitative evaluation of an OCT system, artificial optical samples or phantoms are commonly used. They mimic the structure of biological tissues and can provide a quality standard for comparison within and across devices. Phantoms contain medium matrix and scattering particles within the dimension range of target biological structures such as the retina. The aim was to determine if changes in speckle derived optical texture could be employed to classify the OCT phantoms based on their structural composition. Four groups of phantom types were prepared and imaged. These comprise different concentrations of a medium matrix (gelatin solution), different sized polystyrene beads (PBs), the volume of PBs and different refractive indices of scatterers (PBs and SiO2). Texture analysis was applied to detect subtle optical differences in OCT image intensity, surface coarseness and brightness of regions of interest. A semi-automated classifier based on principal component analysis (PCA) and support vector machine (SVM) was applied to discriminate the various texture models. The classifier detected correctly different phantom textures from 82% to 100%, demonstrating that analysis of the texture of OCT images can be potentially used to discriminate biological structure based on subtle changes in light scattering.

1. Introduction

Optical coherence tomography (OCT) is now in routine use for the assessment of morphological and physiological characteristics of biological structures such as the retina at micron scales. OCT generates images derived from interferometry of incident and backscattered beams of coherent light [1]. Commercially available OCT devices use low coherence light sources typically centered in the wavelength range around 840 nm or 1040 nm; their axial resolution is determined by the full width at half maximum (FWHM) of the light source and not by the aberrations of the optic system [2]. Thus, for a light source of 1040 nm central wavelength with FWHM of 70 nm, the axial resolution is about 7 µm in air (NP photonics 1-M-ASE-HPE-S). The resolution in clinical systems is not isotropic with a lateral (aberration limited) resolution for ocular imaging in the range of 10 to 15 μm [3].
Variations in contrast along the imaging axis are analyzed to generate axial intensity profiles that correlate with the underlying biological structure. Fourier-domain OCT measures the phase of the Fourier transform of the spectral interference between the backscattered lights from both arms of a device [4]. This phase is an estimate of structural information about the sample refractive index (RI) within the implicit coherence gating enforced by the spectral bandwidth of the light source [5]. The measurement of retinal layers is based on the segmentation and texture analysis of multi-cellular structures along each axial intensity line.
Due to the influence on the quality and the performance of OCT scans, speckle is often considered a type of noise that is routinely removed [6] to facilitate the segmentation and the delineation of retinal layers. While this is a useful and pragmatic engineering solution, there is evidence that a component of the speckle contains information of biological relevance. Schmitt et al. [7] classified two types of speckles: ‘chance’ (stochastic) speckle and ‘inherent’ speckle. ‘Chance’ speckle is random and arises from multiply scattered photons, the width of which equals one pixel and can be removed by averaging OCT scans. By contrast, larger ‘inherent’ speckle is consistent and located in the same region in repeated OCT images; this speckle arises from the wavefronts from multiple scatterers, located in the same focal volume [7]. Cumulatively, these speckle components produce a specific aggregate texture from the region of interest, which can provide an optical signature that correlates with structural changes that cannot be discerned by conventional OCT techniques [8]. The texture is a measure of subtle optical differences in OCT image intensity, surface coarseness and brightness of regions of interest [9,10]. Analysis of these parameters is based on the assessment of the optical characteristics that contribute to an overall texture pattern within an image; this method is frequently used in classification [11,12], segmentation [13,14] and synthesis [15] of images.
Scatter has great potential as an image analysis method but is limited to providing abstract textural indices that correlate with potential small-scale changes, particularly in the context of imaging subcellular components. It is important that the rationale for using speckle derived indices is validated and optical phantoms provide essential ground truth objects for the purpose of such validation [16,17,18,19]. Phantoms with particle dimensions and refractive indices that replicate the scales within the biological structure of interest can produce an explicit textural picture. These similarities relate to the refractive incidence of the component particles.
Therefore, in this study, we developed optical phantoms with components within the scale range of cellular organelles (1–5 μm) to determine if changes in speckle derived optical texture could be employed to classify the phantoms on the basis of their optical compositions.

2. Materials and Methods

2.1. OCT Device

Images were acquired using a custom OCT (Figure 1). The light source 1-M-ASEHPE-S (NP Photonics, USA) has a center wavelength of 1040 nm and a FWHM of 70 nm. It was connected via a 2 × 2 optical fiber coupler (AFW Technologies, Australia) to the sample and reference arms. The sample arm included close-coupled 2-dimensional optical scanners (Cambridge Technology Division, Germany), an achromatic off-axis parabolic reflector and a near-infrared telecentric scan lens from Thorlabs (UK). Parabolic mirror collimator provides an optical beam of Ø 2 mm (1/e2). Given the lateral resolution of 15.6 μm (NA of eye = 0.029), the minimum scaling distance per pixel is 7.8 μm. For a standard 512-pixel OCT scan, the maximum angular size the image can be in order to achieve Nyquist sampling is 3994.4 μm. This is the theoretical maximum; it is likely that the real lateral resolution is slightly worse due to optical aberrations and the true Nyquist sampling distance may be slightly higher. The maximum scan angle is therefore 13.3° for a standard eye.

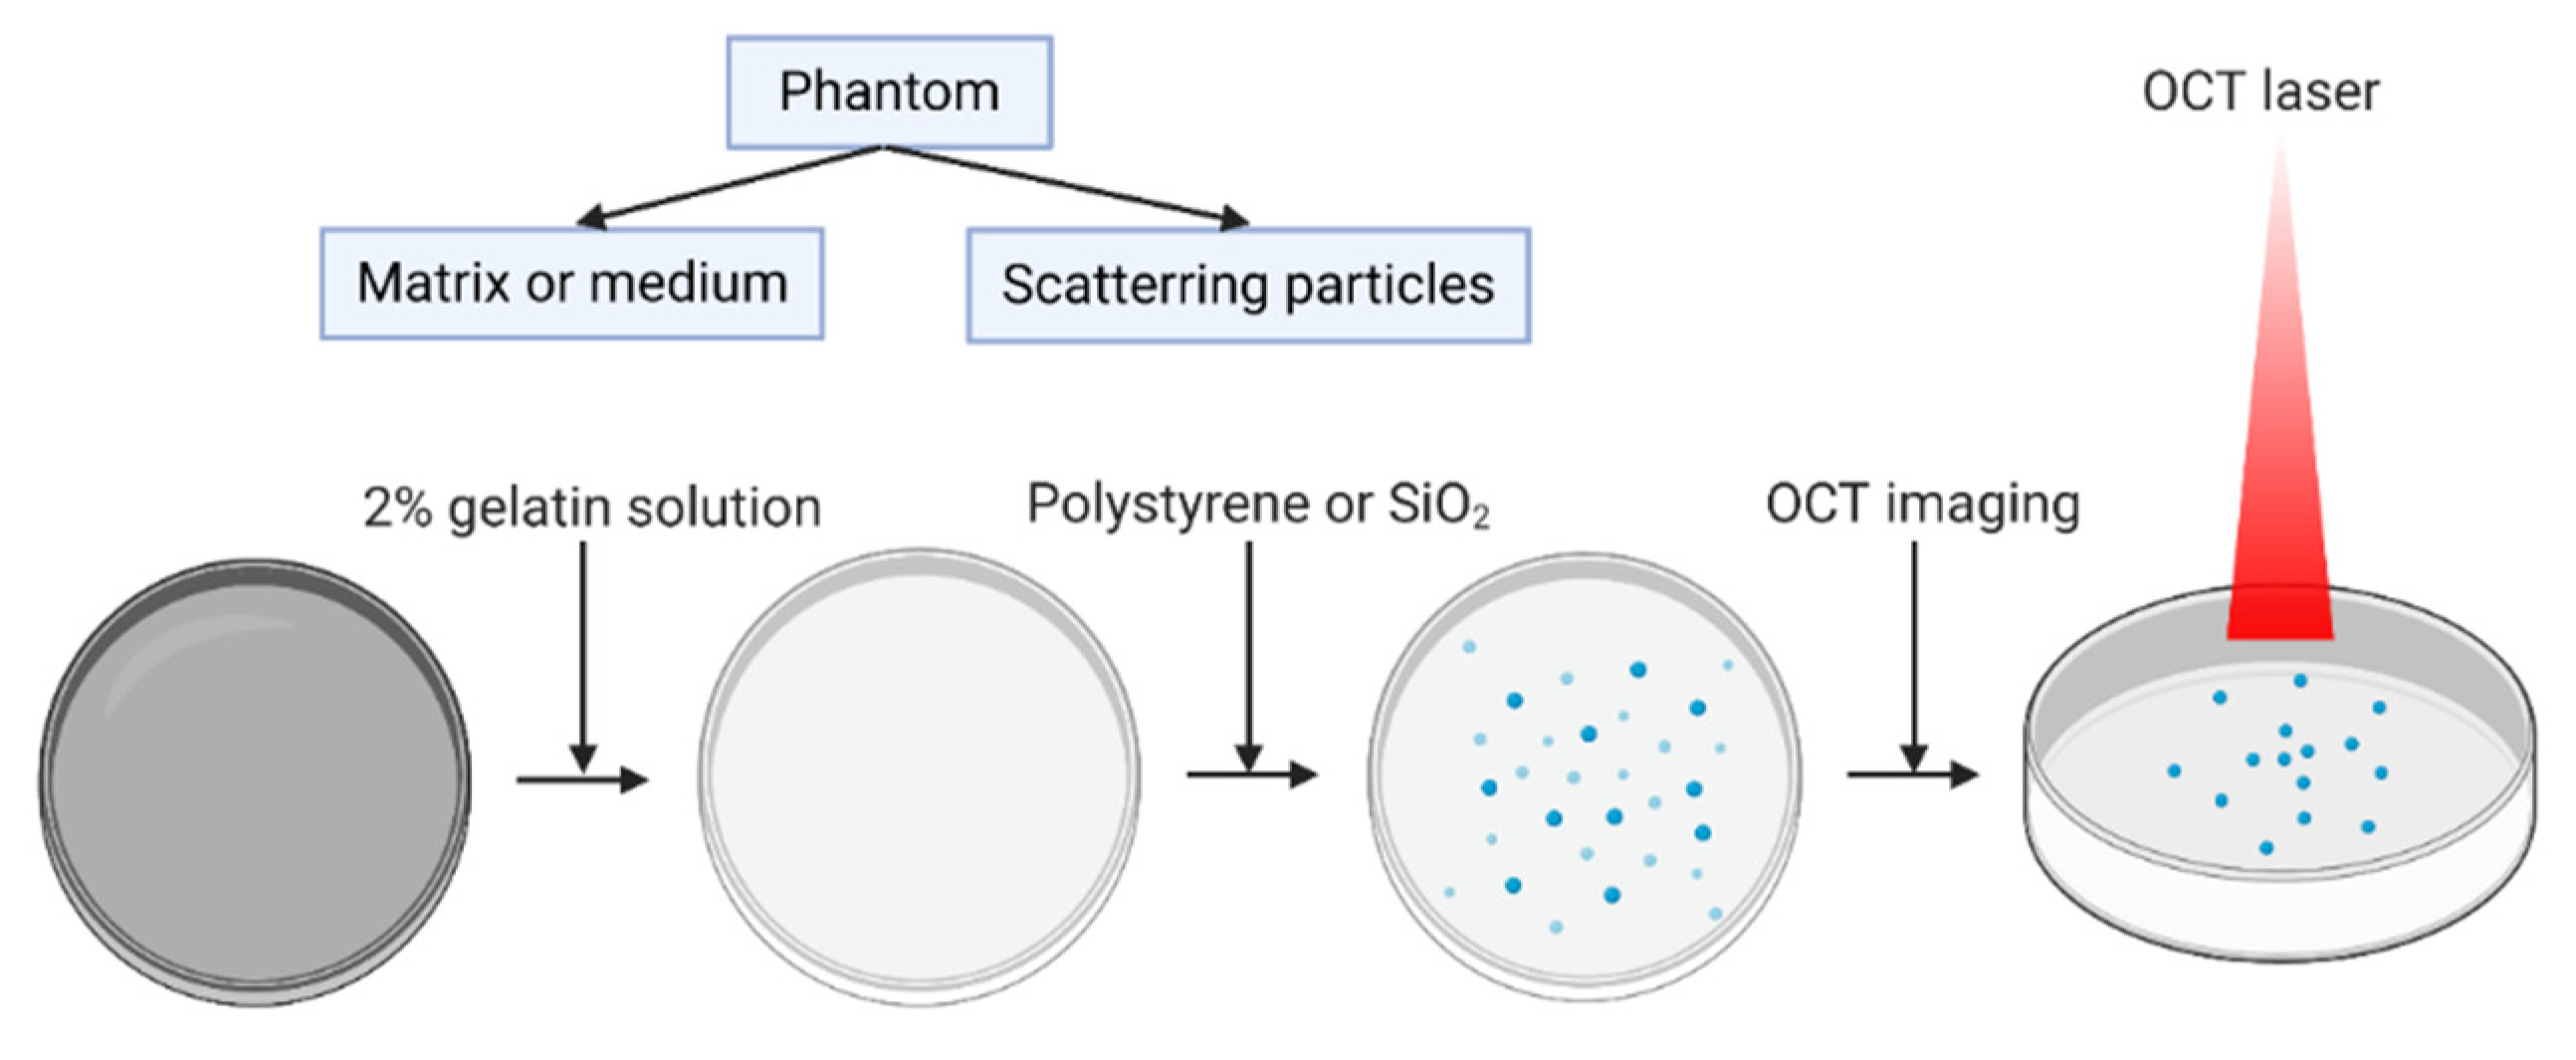
2.2. Phantom Preparation and Imaging

Polymer beads, in a range of sizes that correspond to subcellular organelles (1–15 μm) were embedded in a gelatin matrix. Polystyrene beads (PBs) are most frequently used for retinal phantom fabrication purposes [20] and consist of embedded hydrogel-based agents, such as gelatin and agarose [21,22] whose refractive index is close to commonly imaged biological structures. Four groups of phantoms were fabricated: various concentrations of gelatin solution (1); diverse diameter of PBs (2), their volume differences in the solution (3) and scatterer RIs (4).
If the RI of the retina equals 1.36 [23], the refractive indices of the cell nucleus and isolated mitochondria amount to 1.36–1.39 [24,25] and 1.41 [26], respectively. So, the RIs of medium (gelatin = 1.33) and scatterer (polystyrene beads = 1.57) were determined using an Abbe Refractometer Model 60/70. The steps for phantom preparation are shown in Figure 2.
Five OCT scans of size 512 × 512 × 1024 pixels, x, y, z) were collected from each phantom with Z max = 1 mm. The first scan (Z0) was taken below the surface of the phantom to avoid the refractive effects of the air-phantom interface. Each pixel was sorted at 8-bit resolution (0–255) with a grayscale applied for visualization. For each image, five volumes of interest (VOIs) were extracted (30 × 30 × 30 pixels) for the analysis of texture and classification of OCT images (Figure 3).

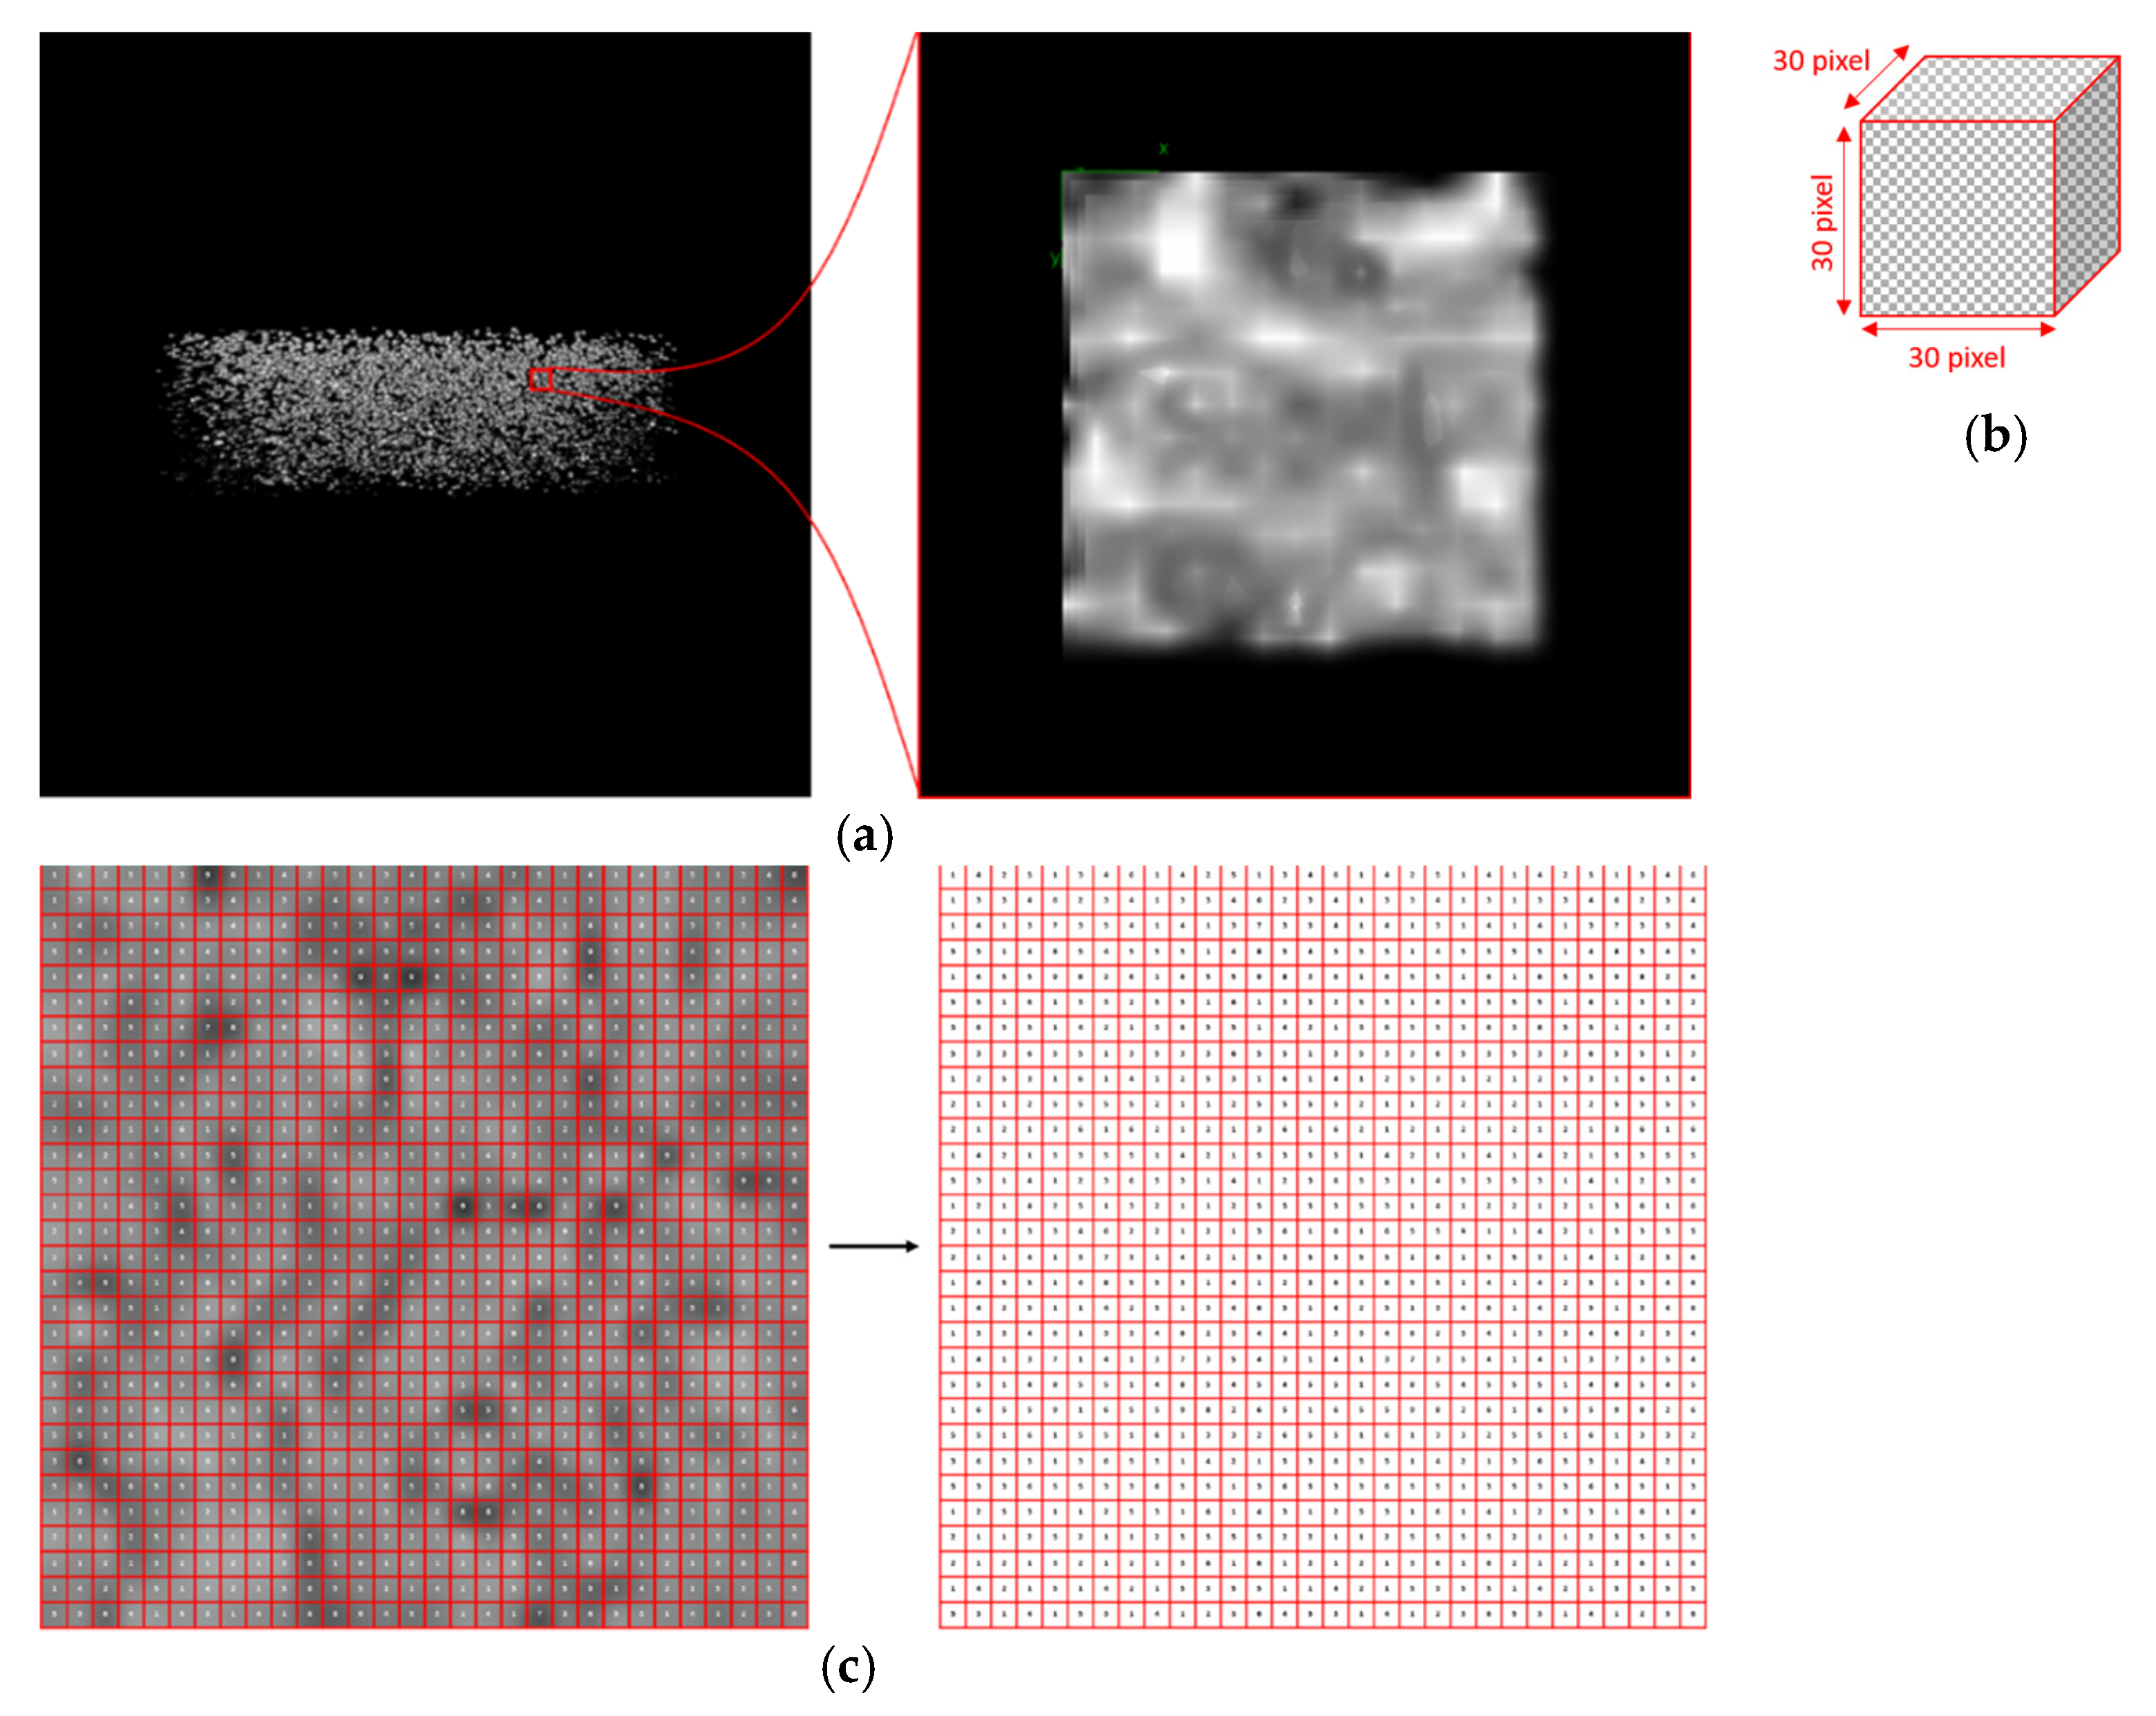
2.3. Texture Analysis
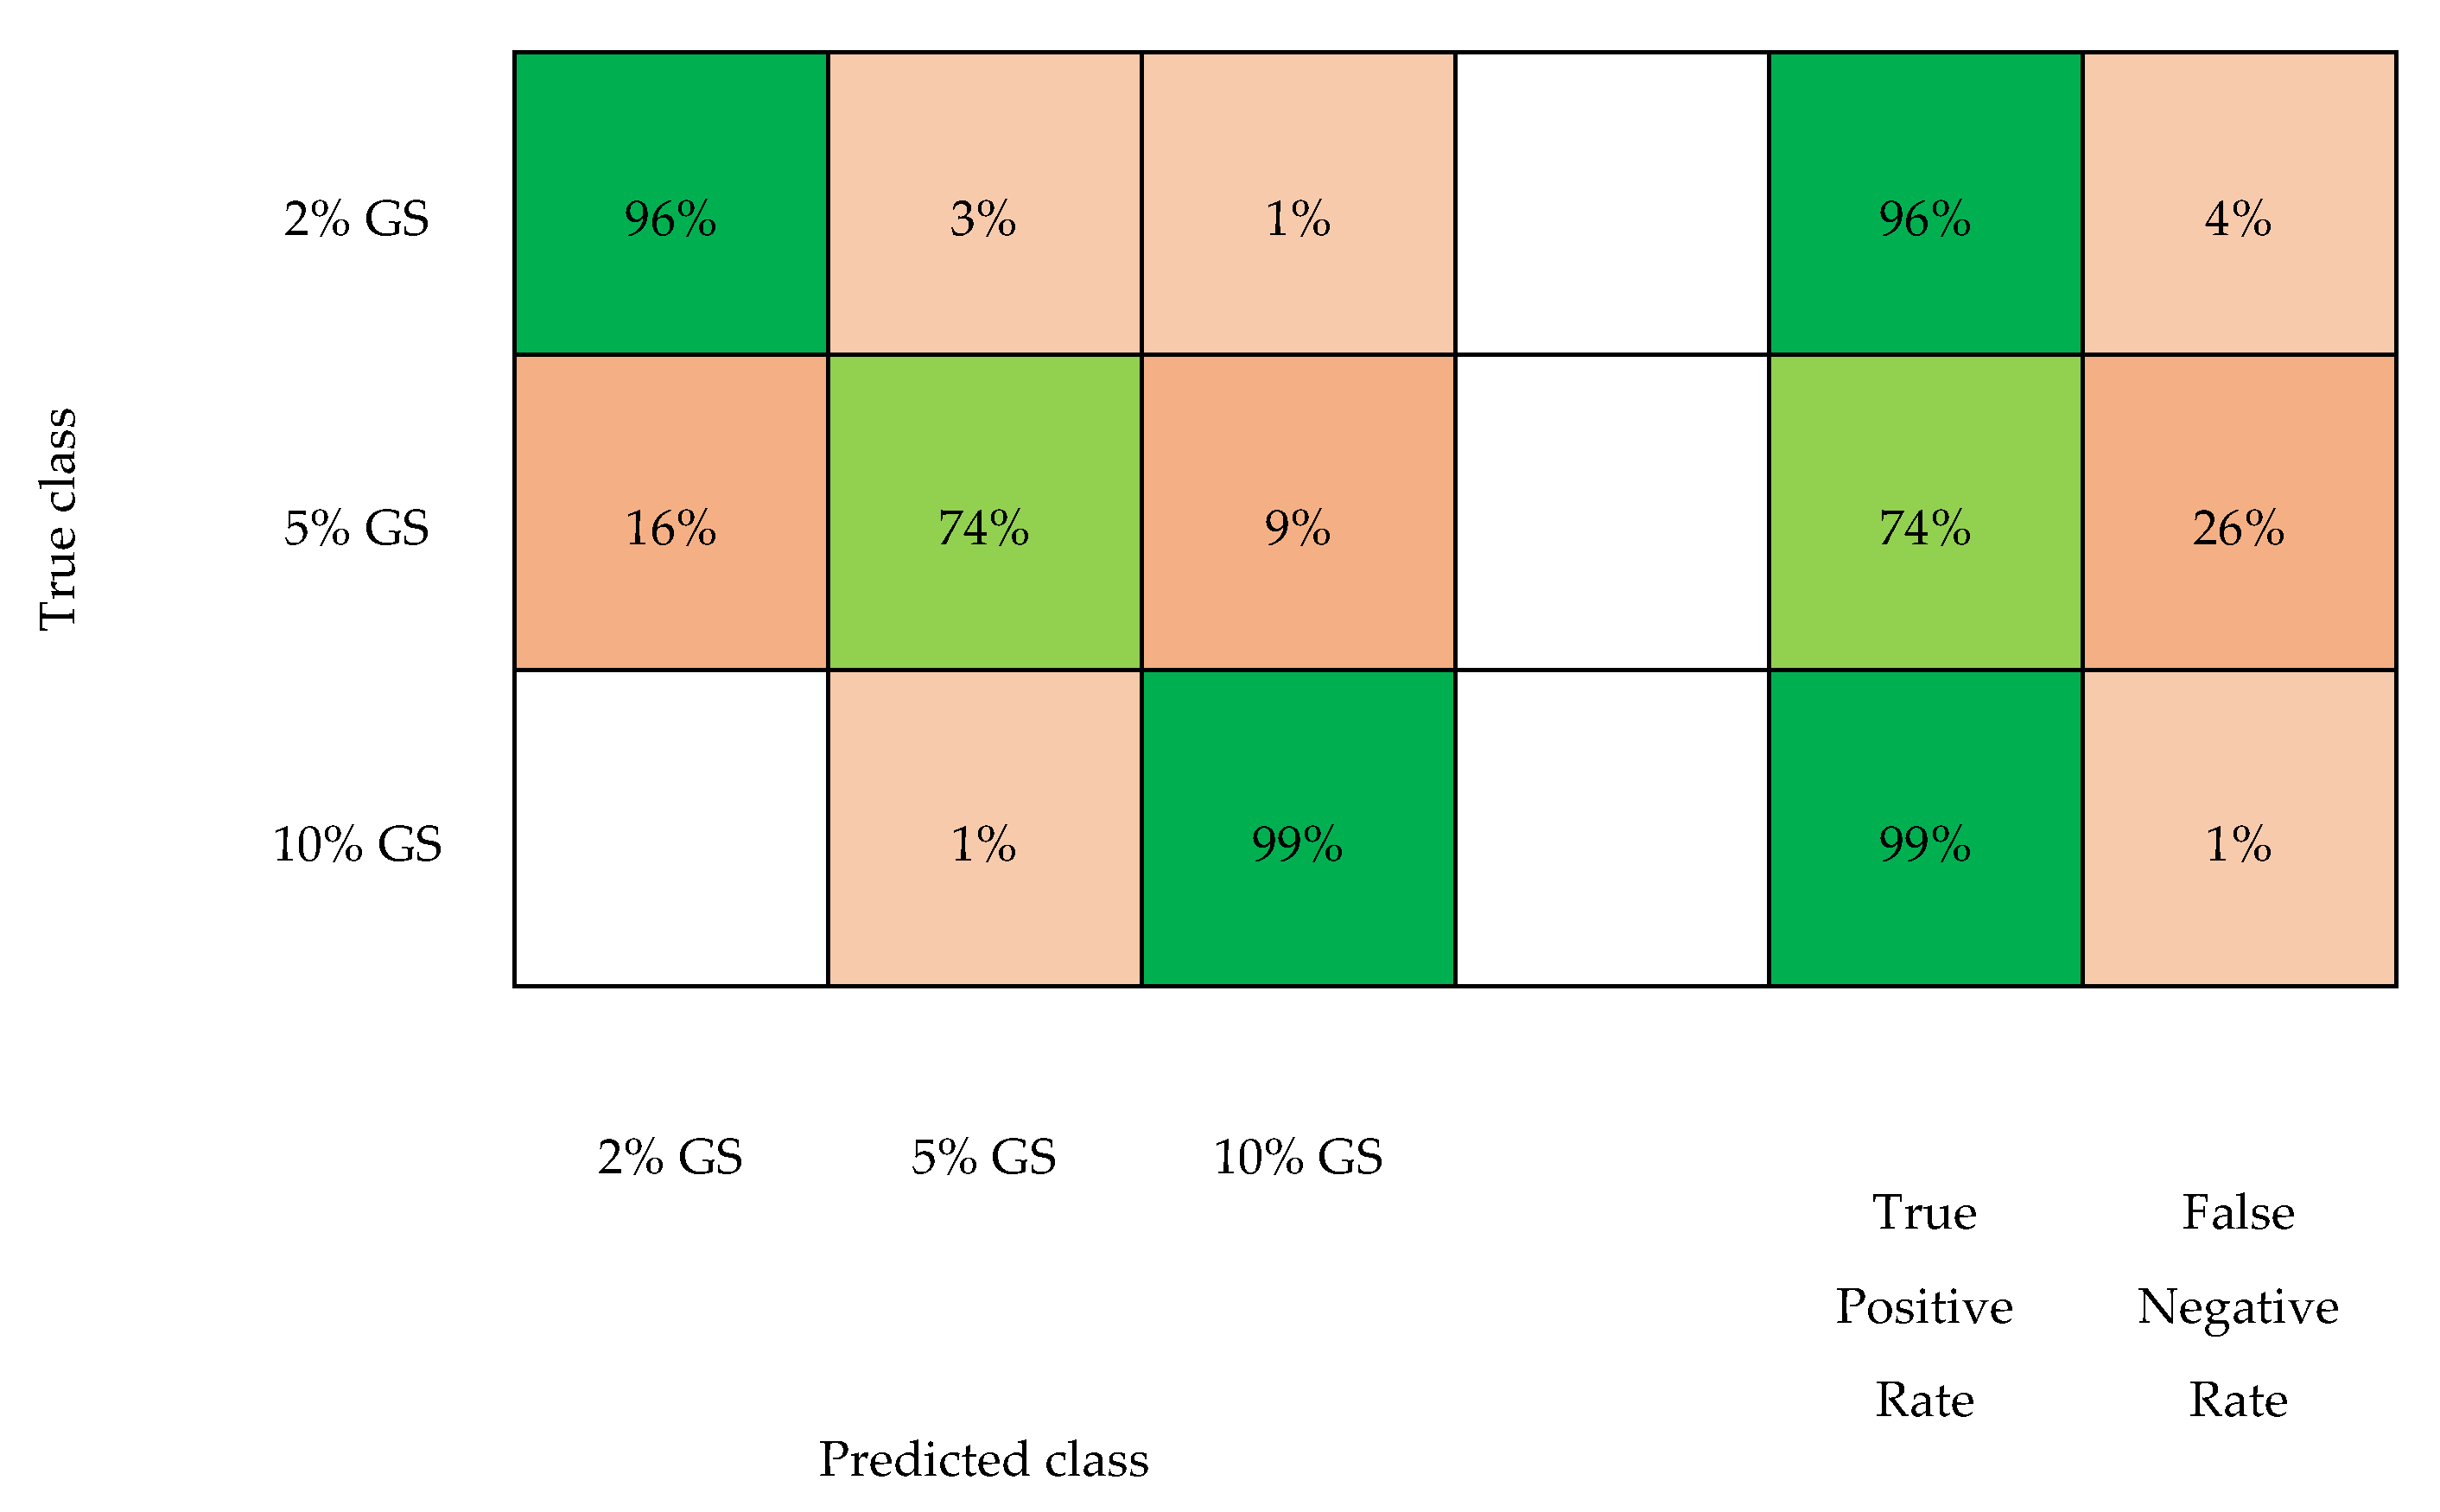
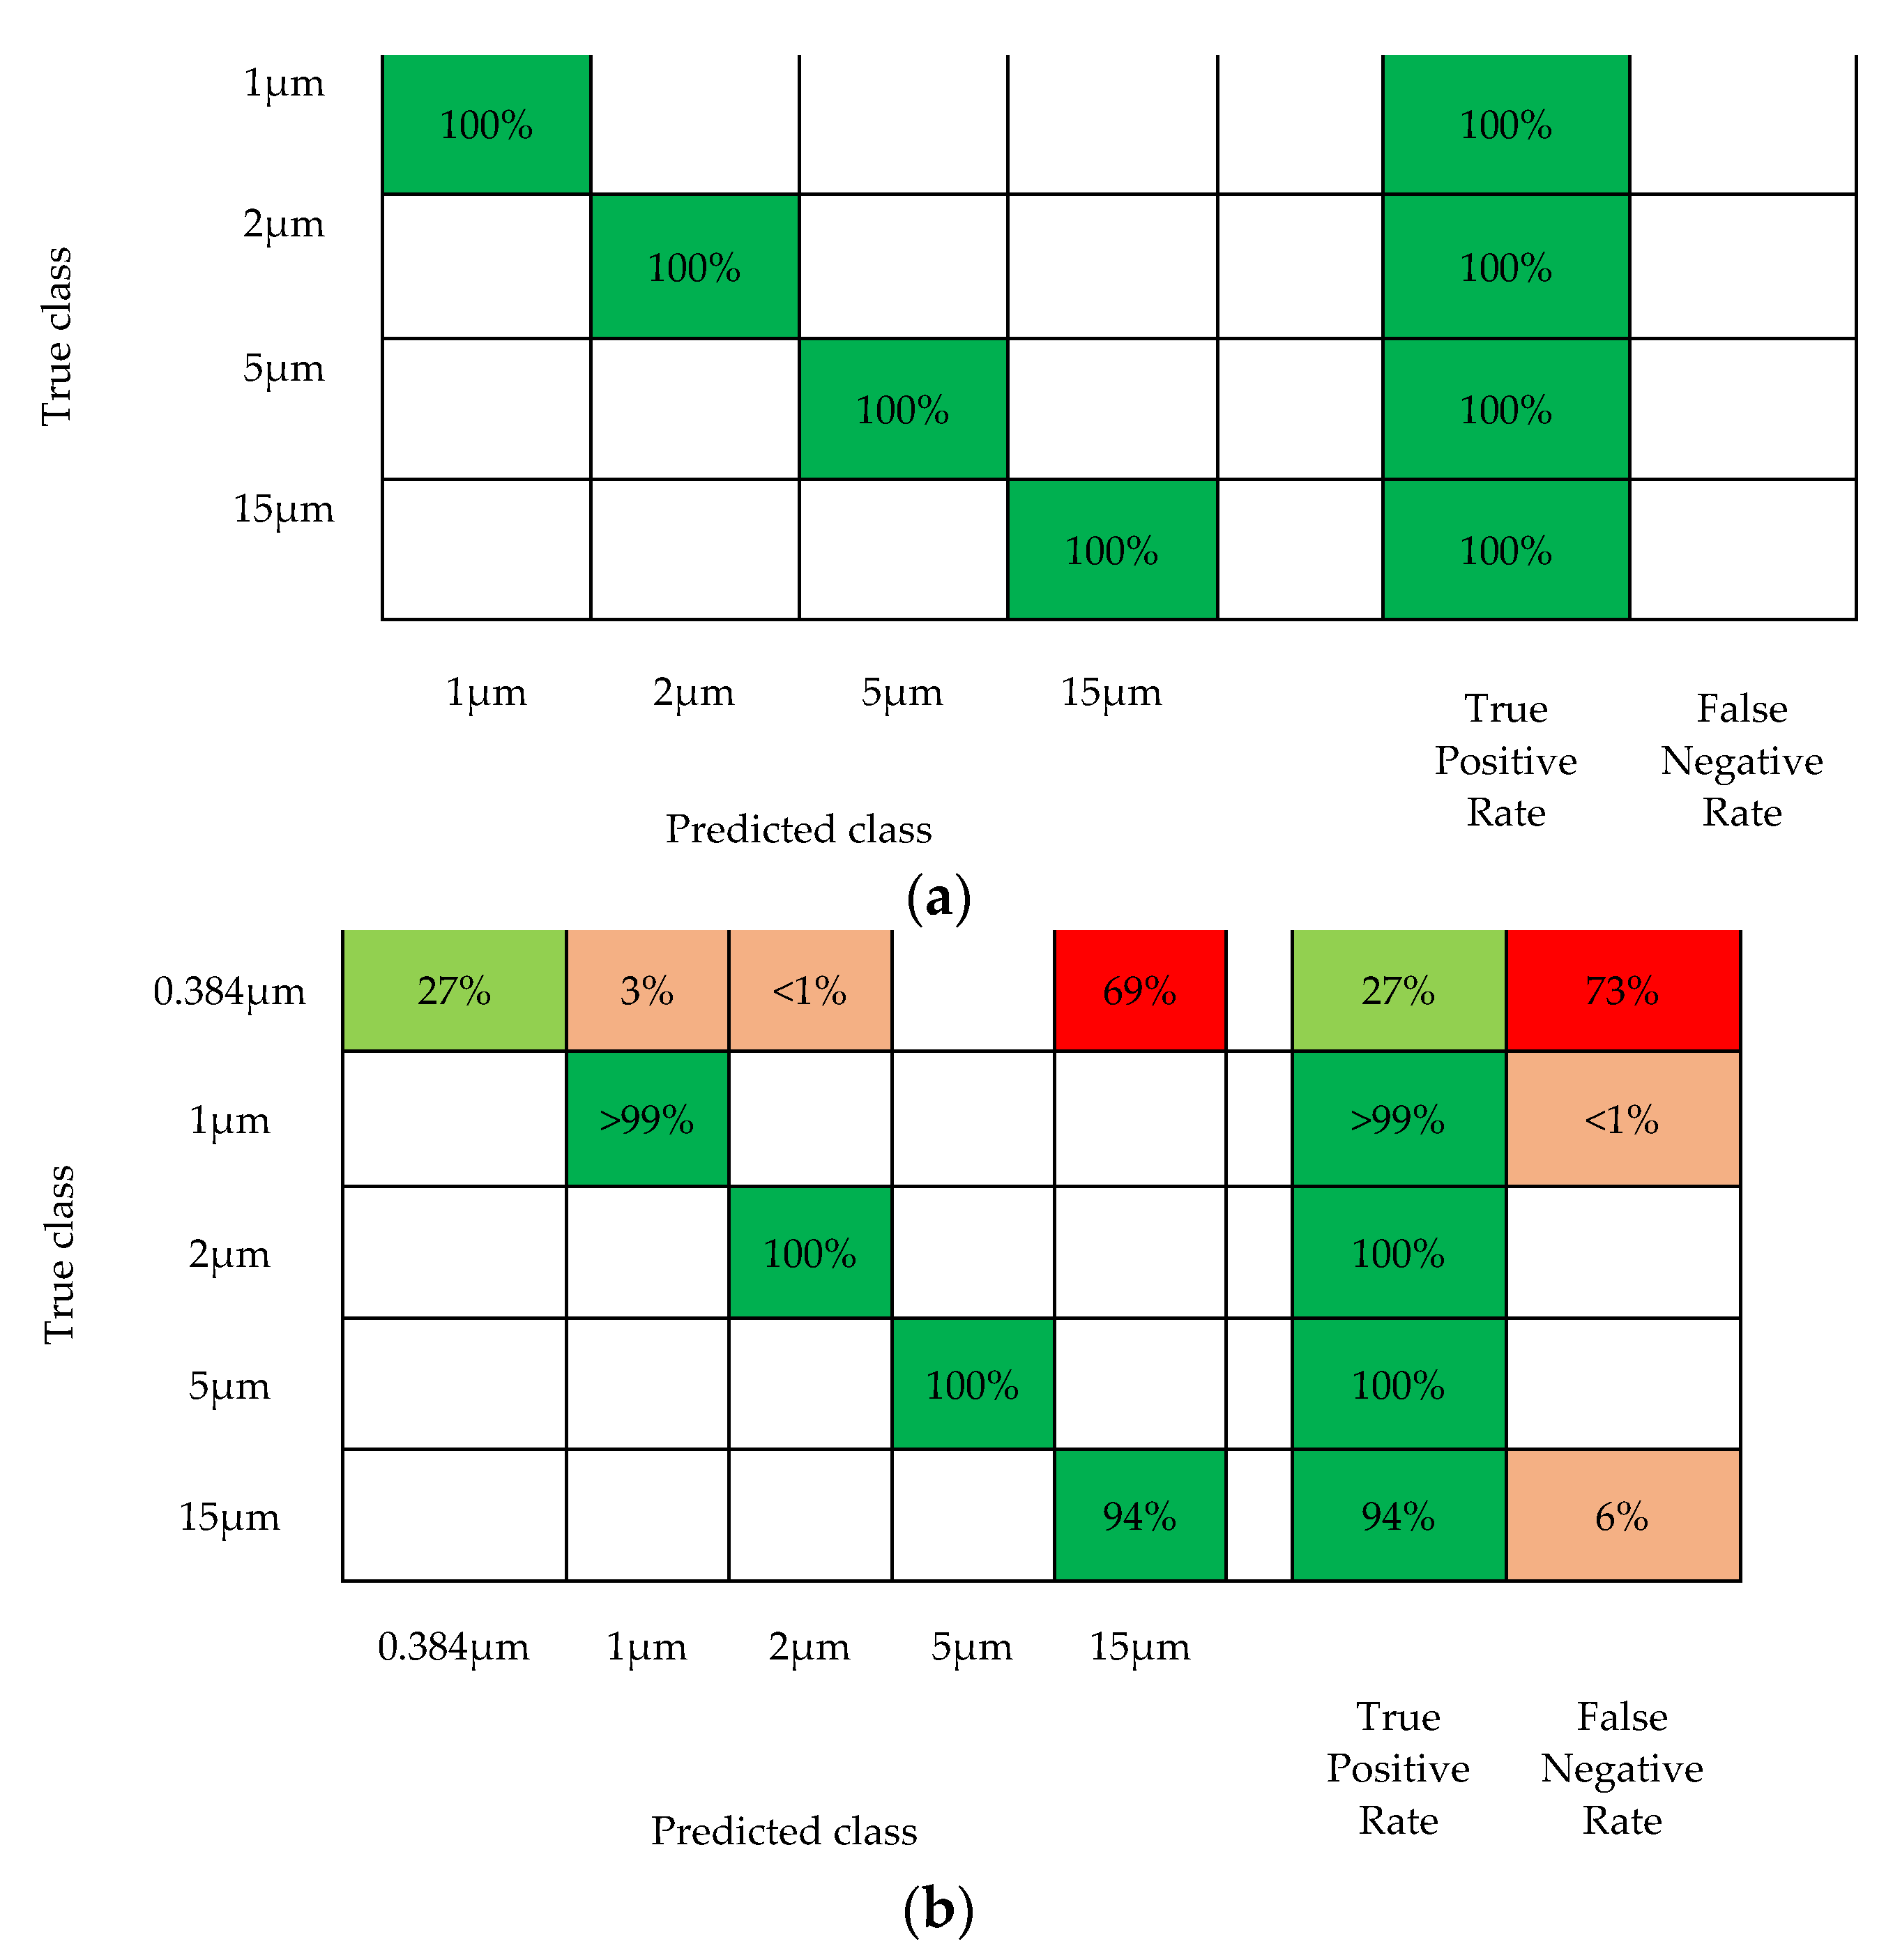
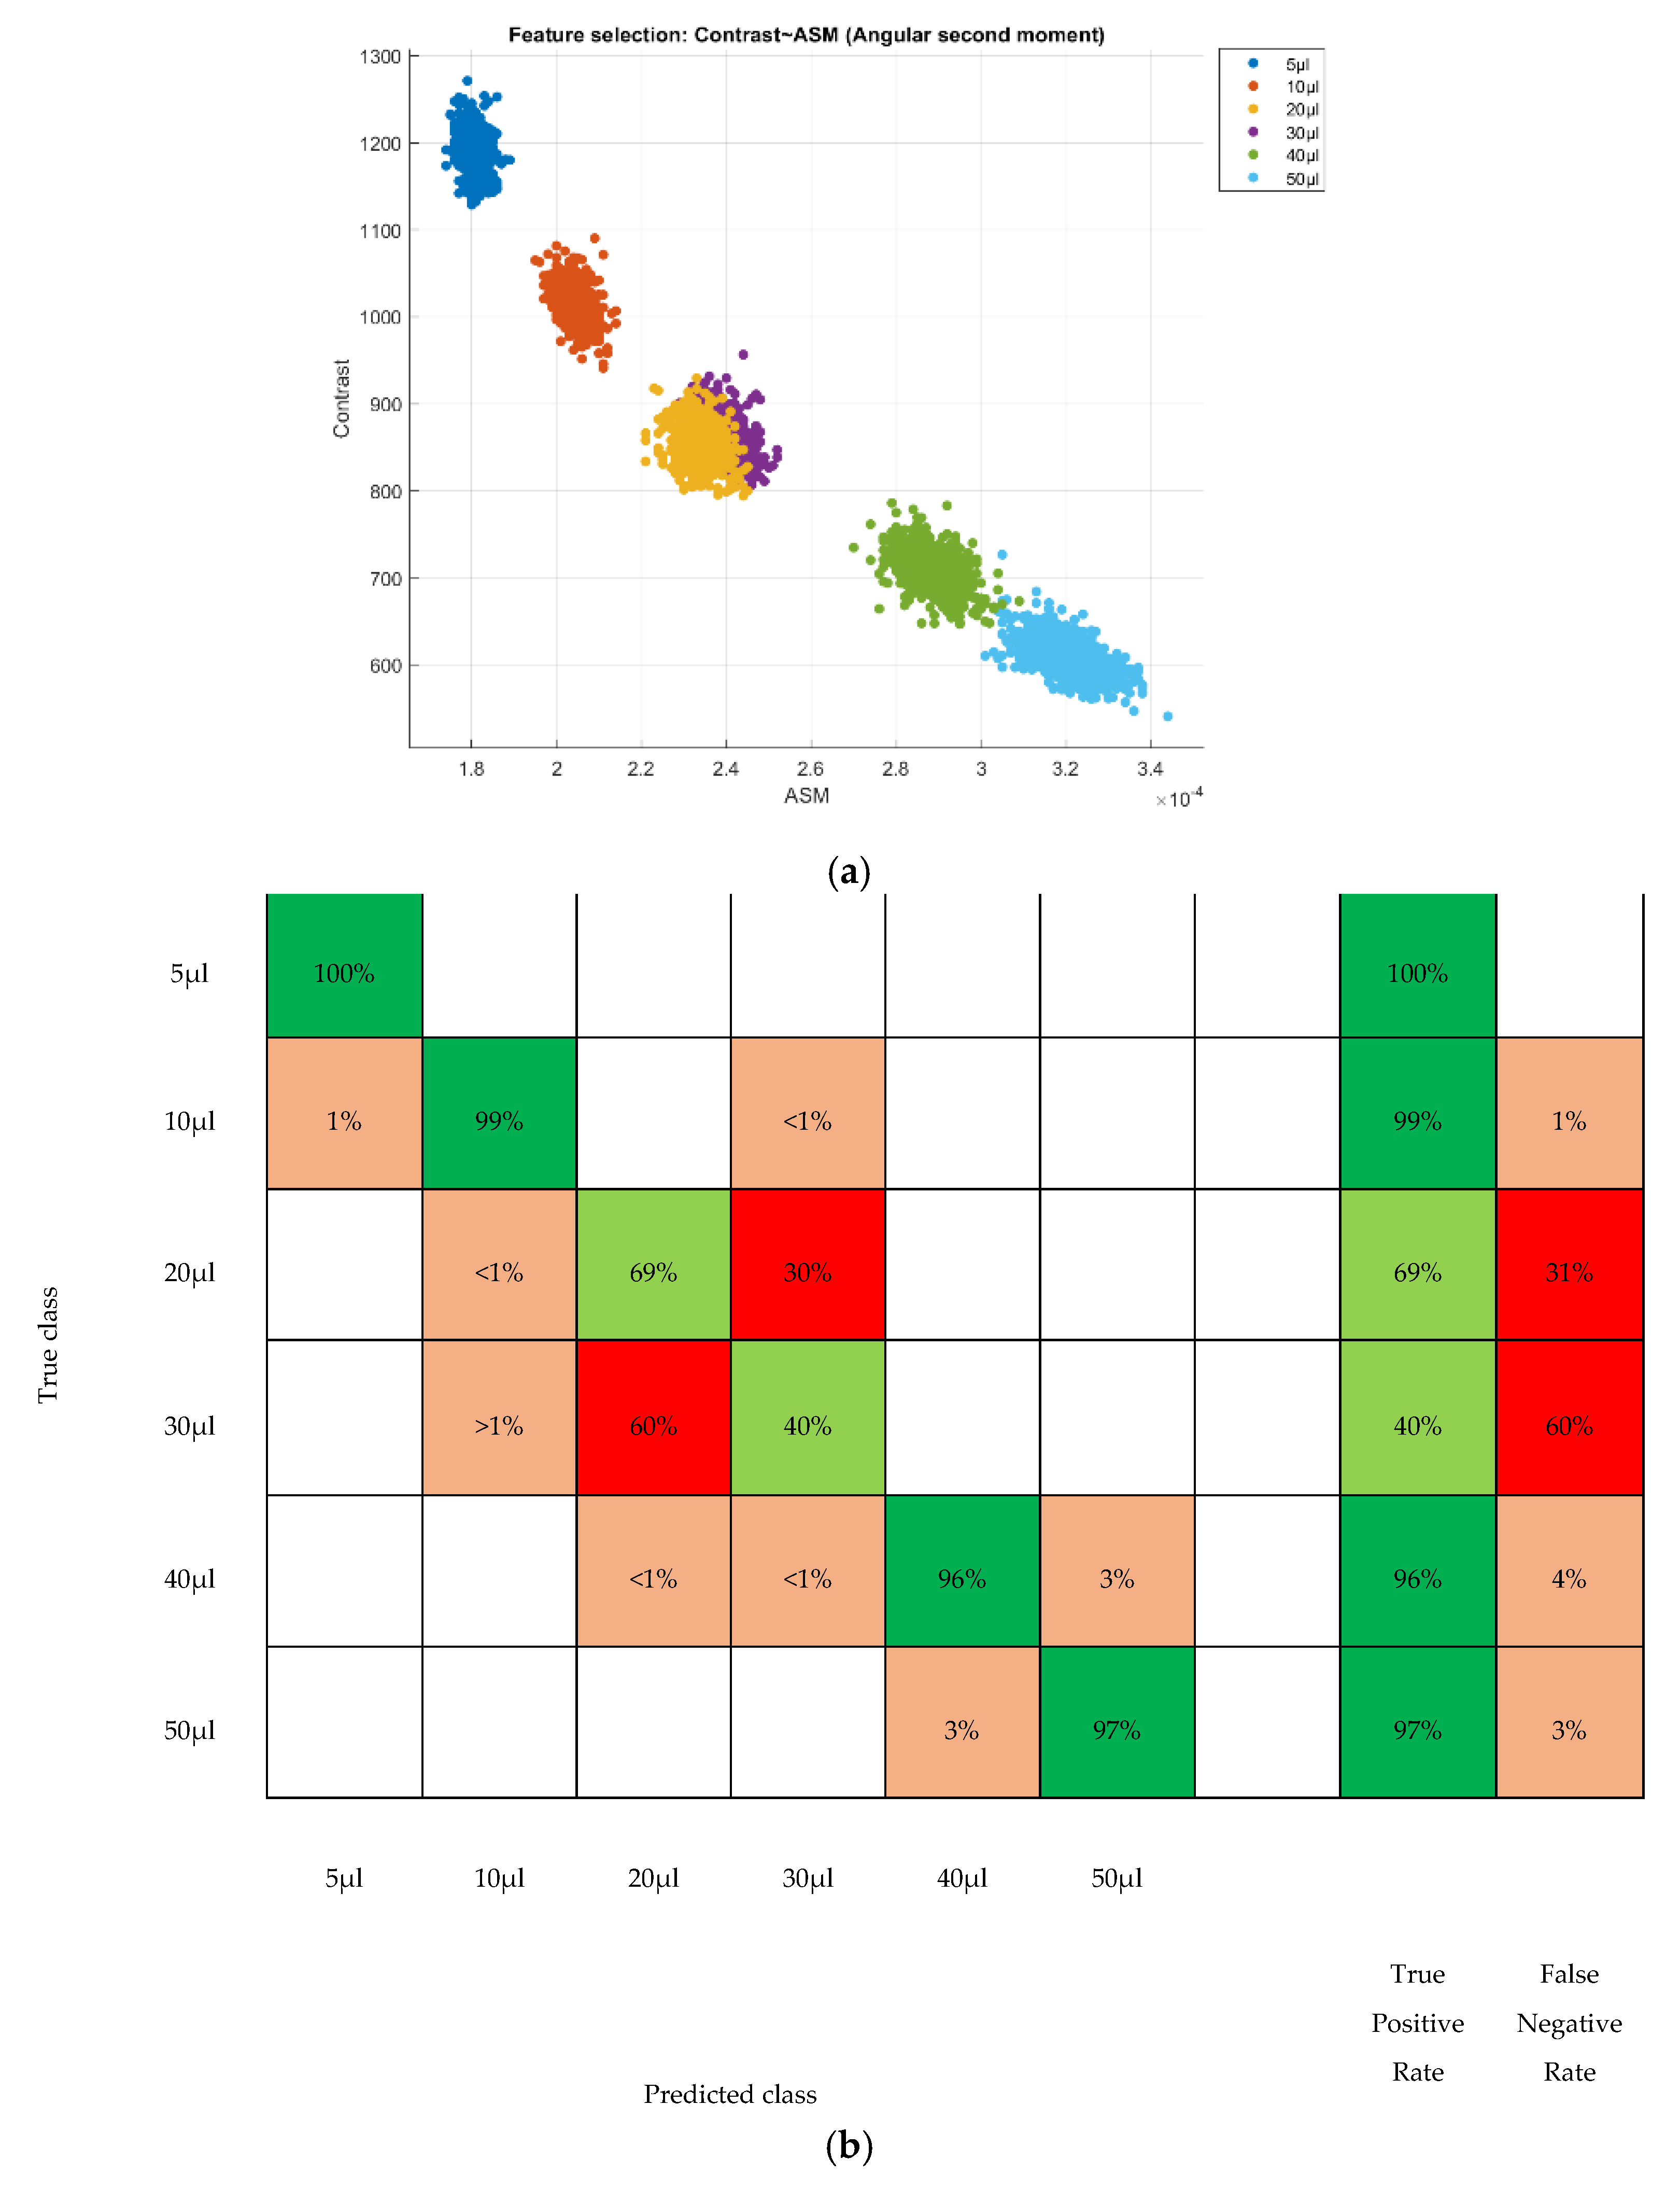
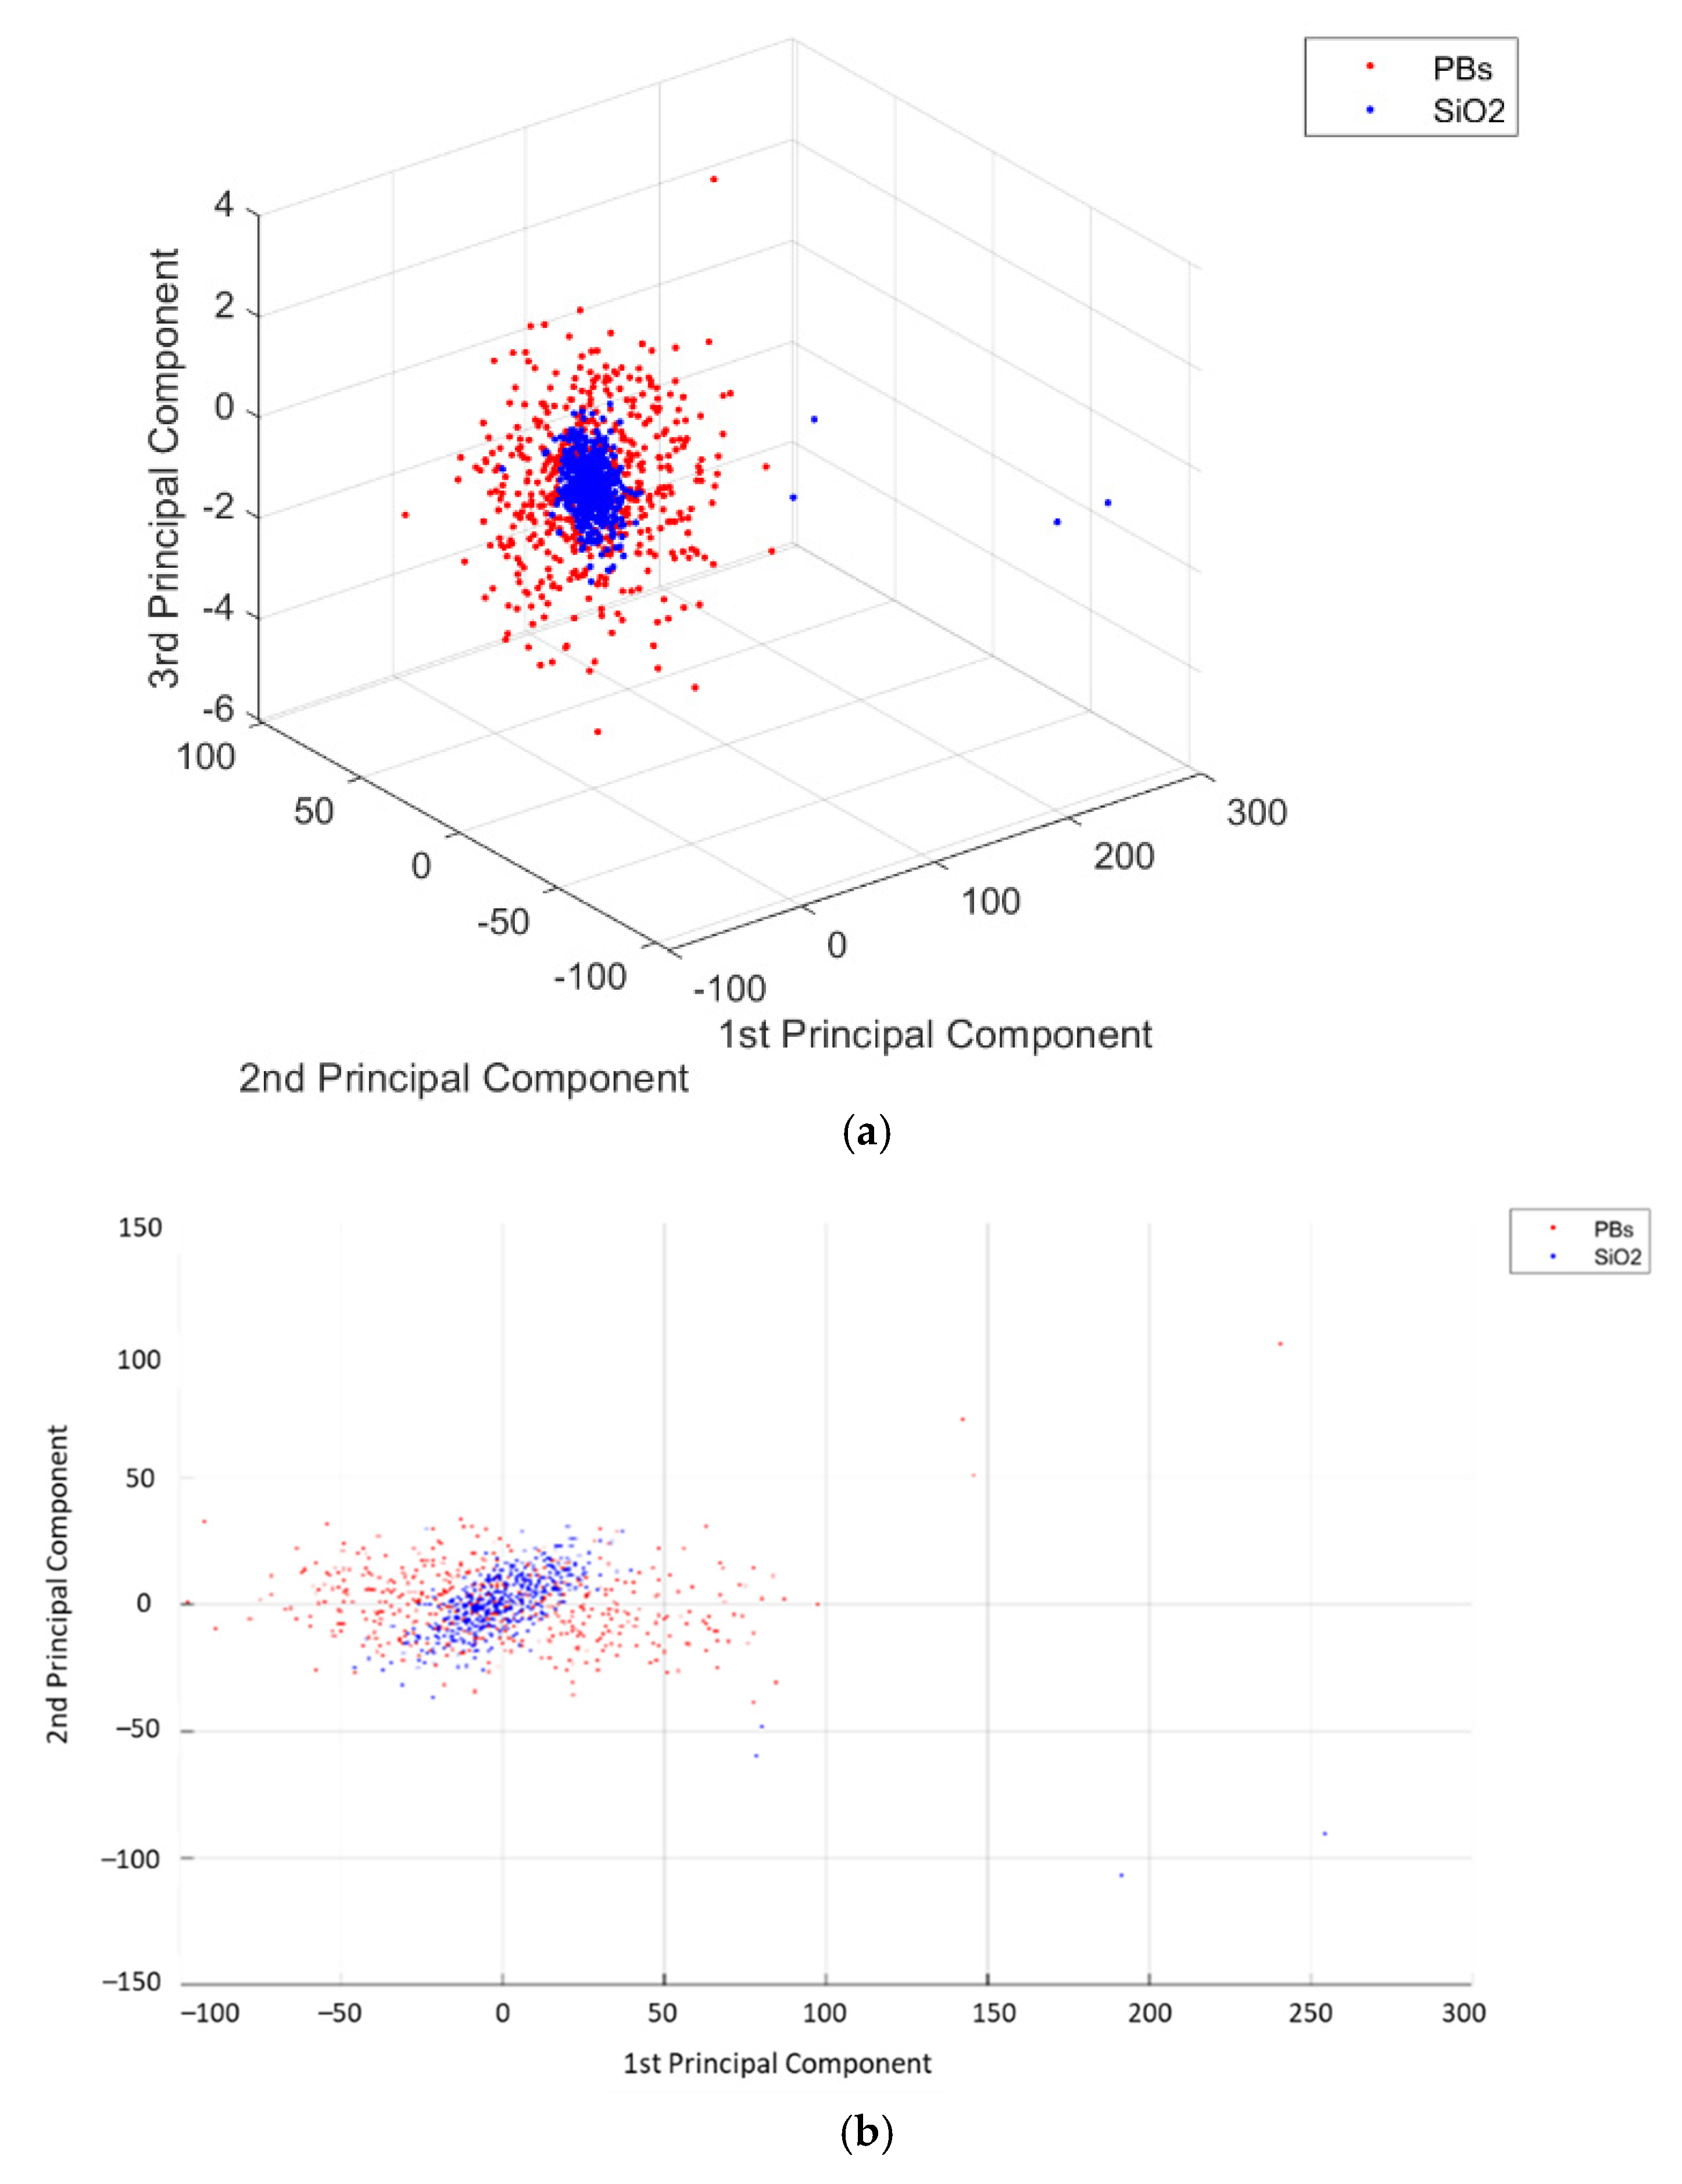
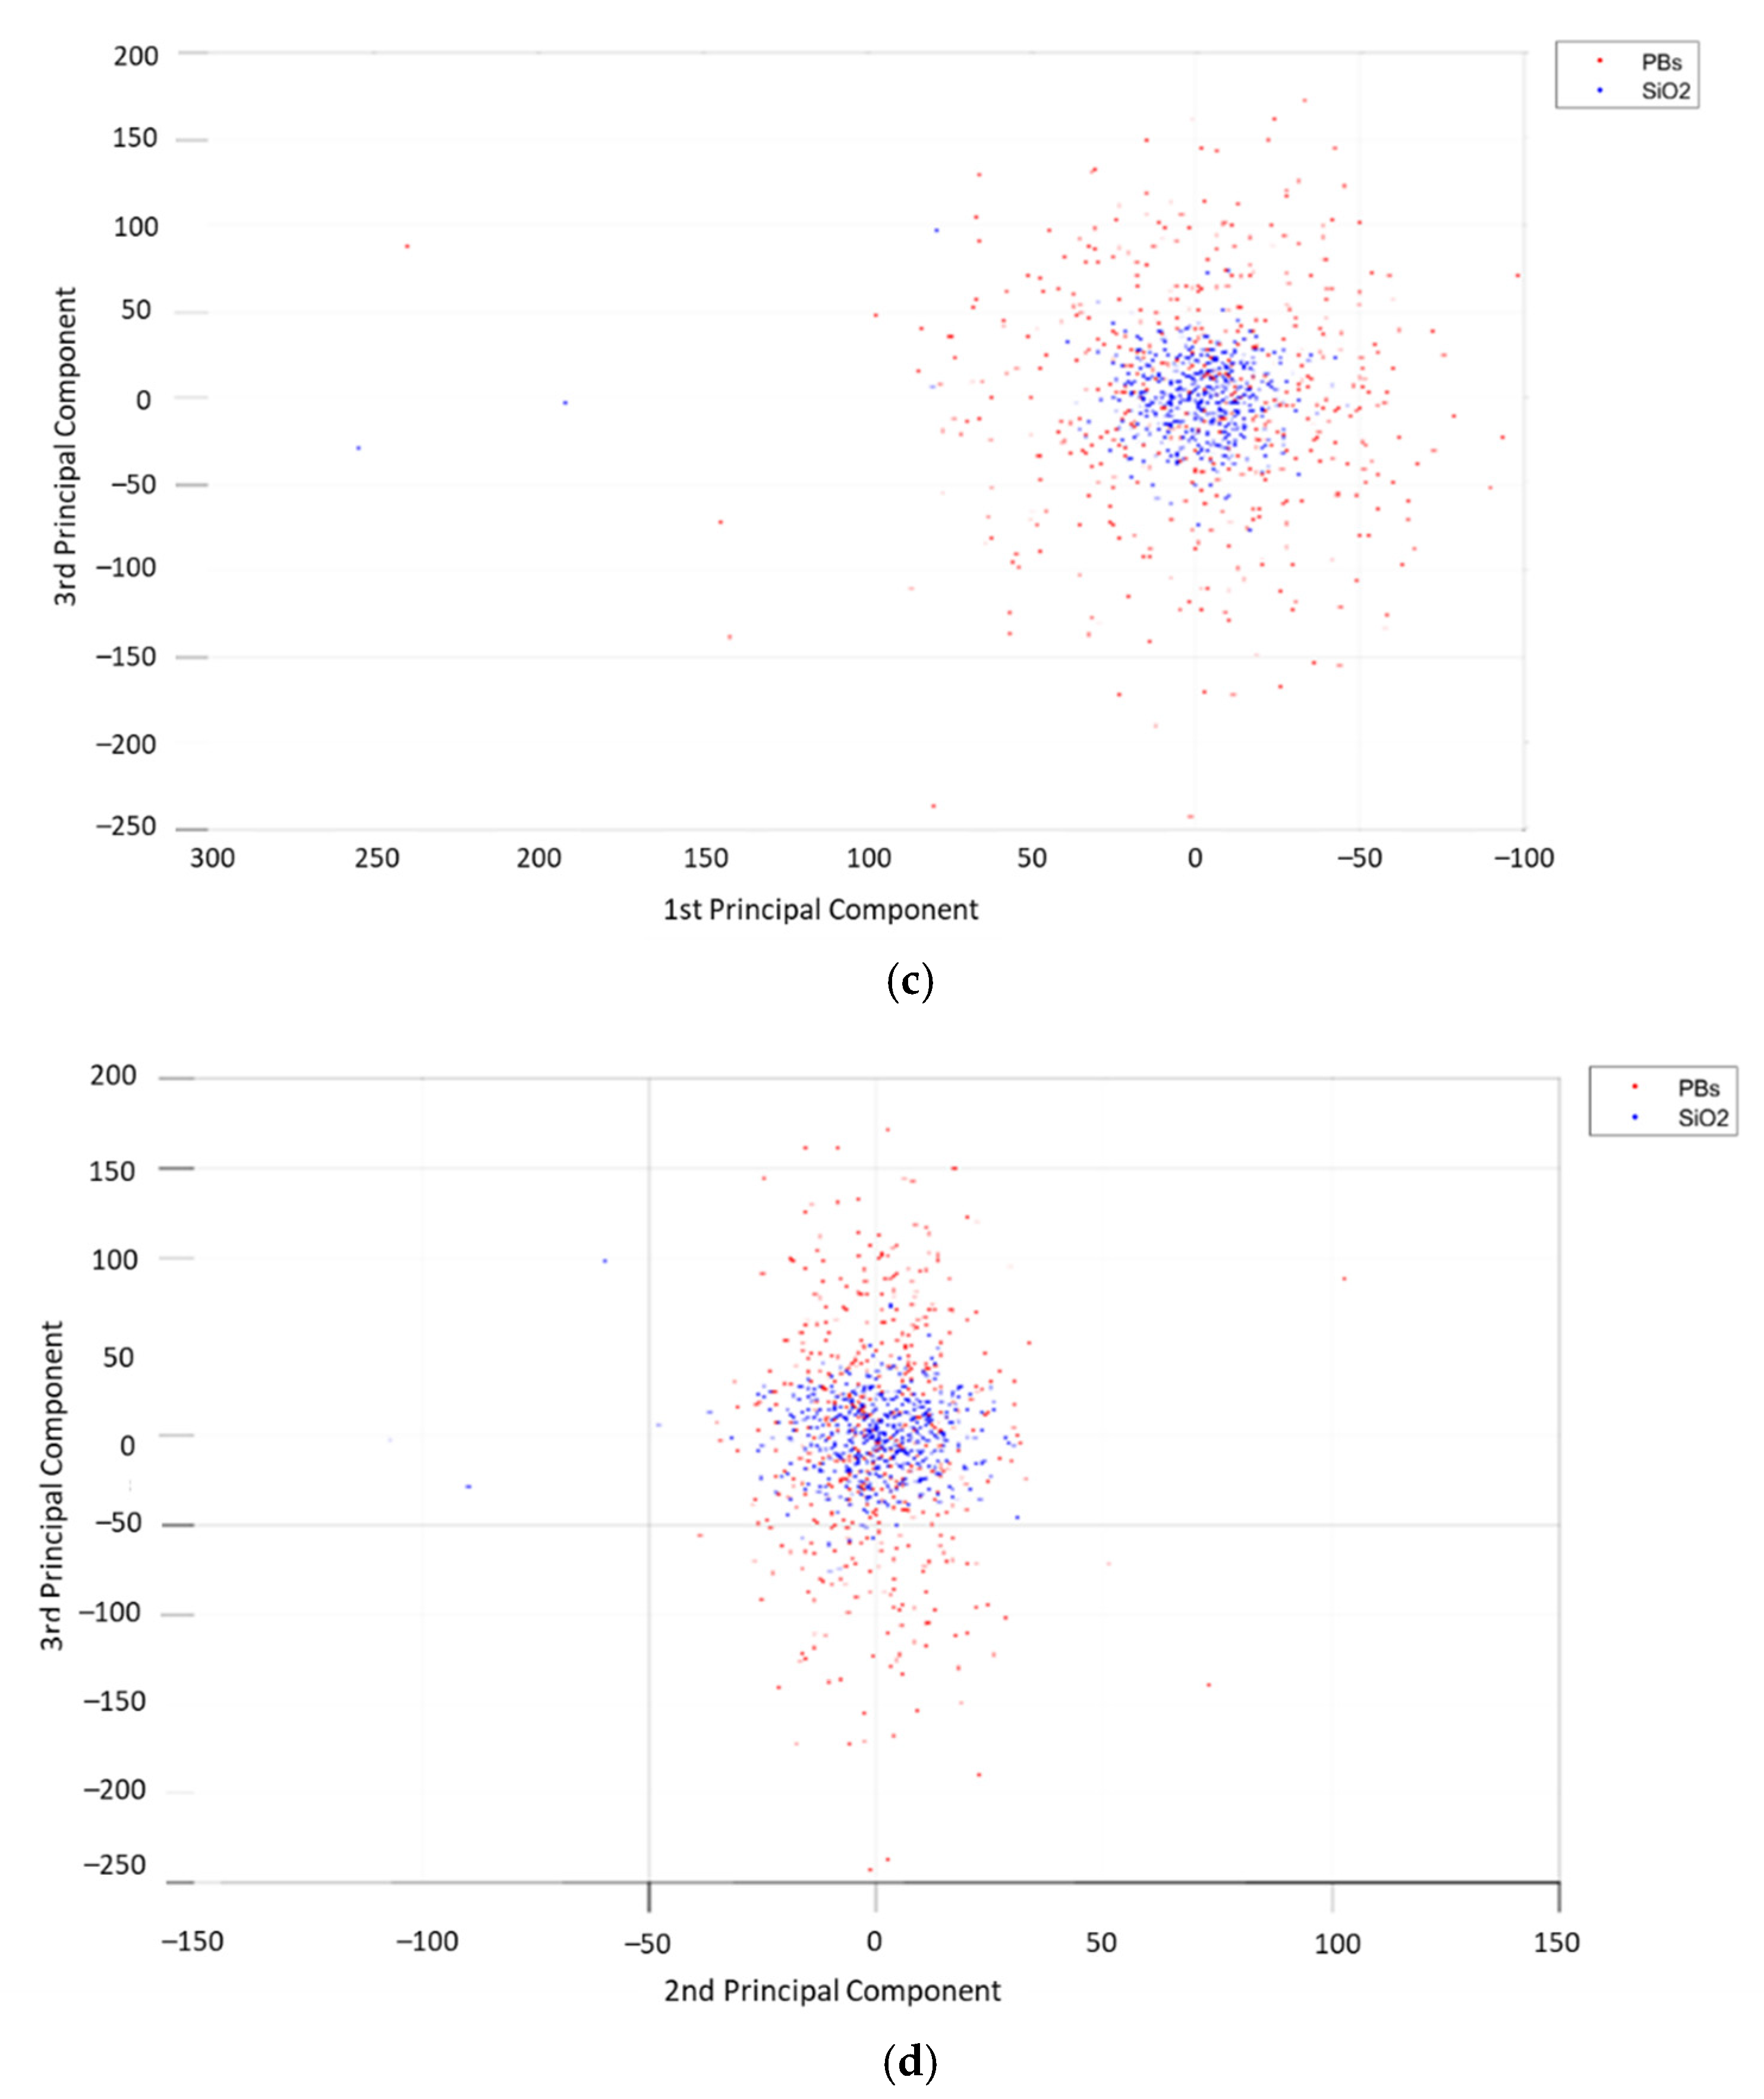
For the purpose of texture analysis, feature extraction and image classification were achieved using the plug-ins of ImageJ (NIH) and MATLAB Simulink (MathWorks). Groups of parameters from the grey-level co-occurrence matrix (GLCM) were selected. The GLCM provides a spatial histogram of the image, showing the relationship between each intensity level caused by alterations between grey levels i and j. For the quantification of grey-scale distributions, probability density functions Sθ (i, j|d,θ) were calculated [27]. In the present study, the distance d between i-th reference pixel and j-th pixel was equal to 1 pixel and the directions θ between i and j pixels were 0°, 90°, 180°, 270°.
Five GLCM parameters were extracted from each VOI in all θ: entropy, energy (or angular second moment), inverse difference moment (IDM), correlation and inertia (or contrast) (Equations (1)–(5)). Therefore, a total of 20 GLCM features were derived from each VOI. The regularity of the local greyscale distribution was measured by the angular second moment by the sum of the squares of Sθ (i, j|d,θ). Inertia provides higher weights to each value in the matrices and corresponds to areas of higher contrast. The sum of the multiplication of each probability density function value by the log of this function computes the entropy as a measure of randomness. The inverse difference moment parameter measures the local minimal changes and correlation calculates the joint probability of occurrence. The latter is higher in regions with uniform grey-scale values.
G L C M   A S M = i = 0 L 1 j = 0 L 1 [ S θ ( i ,   j | d ) ] 2
G L C M   i n e r t i a = i = 0 L 1 j = 0 L 1 ( i j ) 2 S θ ( i ,   j | d )
G L C M   e n t r o p y = i = 0 L 1 j = 0 L 1 S θ ( i ,   j | d ) log ( S θ ( i ,   j | d ) )  
G L C M   I D M = i = 0 L 1 j = 0 L 1 1 1 + ( i j ) 2 S θ ( i ,   j | d )
G L C M   c o r r e l a t i o n = i = 0 L 1 j = 0 L 1 ( i μ x ) ( j μ y ) S θ ( i ,   j | d ) σ x σ y
where Sθ (i, j|d,θ) is the i-th and j-th elements of GLCM and L is the number of grey levels in the image.
Then, extracted parameters were analyzed by principal component analysis (PCA) and support vector machine (SVM). PCA is a vector space transform method, which converts high-dimensional data sets into a set of values of linearly uncorrelated variables. This can subsequently be employed to reduce the feature dimensions by eliminating redundant data. PCA computes the eigenvalue decomposition of the covariance matrix of the image without matrix-to-vector conversion [28]. The SVM is a supervised machine learning tool, which constructs a set of hyperplanes in feature space to allow the separation of the data into different classes. The datasets were then classified by SVM with and without preliminary PCA.

3. Results

For the purpose of classification, we developed 4 phantom groups based on differences in the concentration of gelatin, particle size, particle concentration and particle refractive index. 10 OCT scans were obtained for each phantom variable (160 scans in total, Table 1). Ø 5–15 µm particles, which fell within the resolution limit of the OCT could be discerned as discrete objects. As expected, particles below 5 µm in diameter could still be discerned as discrete entities although collectively they generated differences in the overall texture of the phantom. Submicron (384 nm) polystyrene beads had no discernible effect on the optical properties of the phantom; single- or multi-pixel speckle noise in the scans from these phantoms (Figure 4). OCT scan thresholding was achieved using ImageJ software built-in technique for automatic computing of a value cutoff.
Following the learning of the model with various random training and validation datasets, a test dataset was evaluated with the generated function codes and the whole procedure was reiterated 10 times and the results are average.
Phantoms with different concentrations of gelatin in the medium could be segregated with a classification accuracy of 91.8% with PCA and 100% without (Table 2). While 2% and 10% gelatin solutions could be classified accurately in 96% and 99% of cases, respectively, only 74% of 5% gelatin solution was truly discriminated by PCA and SVM (Figure 5). We found that OCT texture generated by a “5% solution” can mimic the texture of “2% and 10% gelatin solutions” in 16% and 9% of cases, respectively. These ‘false positive’ and ‘false negative’ results can be the consequences of the local variations of the texture within the gelatin solution.
Phantoms with Ø 1 µm, 2 µm, 5 µm and 15 µm of latex beads could be categorized correctly in 100% of cases using SVM with and without PCA (Figure 6a). However, the level of discrimination was significantly reduced with submicron PBs (384 nm), where only 27% of 384 nm PBs were detected correctly (Figure 6b). The latter was not unexpected given the axial resolution limit of the optical coherence tomography in the range of 1–5 µm.
The SVM-based classification of various scatterers’ concentrations with PCA reached 86.7% of accuracy and 99.9% without PCA (Table 2). Along with other GLCM properties, contrast and angular second moment (ASM) discriminated the most benefit to the classification performance during the feature selection process, the example of which is illustrated in Figure 7a: clusters of various phantom types were separable in the feature space, except 20 µL and 30 µL of scatterers in 2% gelatin solution. Figure 7b shows the similarity of textures generated by these two phantoms: 60% of 30 µL PBs was classified as a 20 µL PBs sample.
With a refractive index (RI) of PBs equal to 1.57, SiO2 has the lower RI—1.43 [29]. Classification with and without PCA in both scenarios correctly discriminated the texture of differing scatterers in all cases. The principal component scores of each scattering particle for the 3 components are plotted in X, Y and Z dimensions (Figure 8a). According to the type of scatterers (PBs = red, SiO2 = blue), the segregation of the clusters into different types along the components can be detected. To illustrate the distribution of the groups along with individual components, plots (b), (c) and (d) are projected.

4. Discussion

Although commercial clinical OCT machines with an axial resolution of 3–5 μm are widely used for the diagnosis of retinal diseases, high-resolution OCT allows imaging of the biological tissue structure with the axial resolution of 2–3 μm [30]. Neither of these resolutions allows the unequivocal imaging of subcellular components. In this study, we show that texture data can be extracted that correlates with light scatter from particles that lie within and beyond the resolution limits of the OCT. Importantly, the texture information can be used to classify phantoms with a high degree of accuracy.
The use of texture-based image analysis is gaining in popularity and has a number of applications in the analysis of biological structures. GLCM has been used to quantify the necrosis in cell cultures from microscope images [31], to discriminate the various prostatic tissues from ultrasonic B-scans [32] and to detect the normal and pathologic tissues from OCT images [10]. Gossage et al. [10,33] reported that GLCM texture analysis provides better outcomes than other features as it provides more valuable texture-context information than the intermediate matrices of other texture analysis algorithms.
For the purpose of analysis of multidimensional data, we used an n-dimensional PCA (nD-PCA) as suggested by Hongchuan and Bennamoun [34]. nD-PCA extends the PCA method to a higher dimensional dataset and reduces the dimensionality of such datasets. Moreover, the algorithm increases the interpretability while minimizing the information loss as seen in the results (Table 2).
In this study, the classification of OCT scans was based solely on linear SVM. Although other types of non-linear SVM were used in the study of Anantrasirichai et al. [12], linear SVM significantly outperformed the radial basis and polynomial function SVM kernels in our study.
Due to the inhomogeneities in the refractive index of the tissue structures, light is reflected at various angles [7,35], which can contribute to the texture signal. Speckle arises from the source of optical information about the microscopic structures of the tissue and as noise [7]. Hence, in the process of noise filtering, some valuable data can be removed. Consequently, this can lead to misinterpretation of the OCT results. Efficient noise reduction is one of the main goals of image processing but remains one of the most challenging as it needs to balance noise reduction and texture preservation.
Our data support the application of OCT derived speckle signatures from biological structures. In the context of retinal imaging, one of the most popular applications of OCT, texture analysis has great potential for the quantification of retinal neuronal health since the fragmentation of neuronal organelles (in particular mitochondria) will generate texture changes within the resolution of existing OCT devices. Gelatin-based matrix has the desired absorbance, scattering, and background fluorescence. In the study of De Grand et al. (2006), the optical properties of gelatin-containing medium were constant from 600 to 1000 nm for 2 weeks and more [36]. The index of refraction of gelatin phantom is 1.35 and the scattering coefficient amounts to 1 at the central wavelength of 1280 nm, computed by Mie theory [37]. Due to their unique optical properties (controllable scattering coefficient and refractive index), micro particles based on polystyrene beads are the first choice for OCT phantom preparation. In gelatin-based phantoms, polystyrene nanoparticles are used frequently as a scattering constituent.
Scattering and absorption properties of gelatin phantoms can be controlled and recreated by mixing with lipid emulsion (Cubeddu et al. 1997; Wagnieres et al. 1997).
Further investigation into the utility of texture-based analysis will benefit from the availability of white light superluminescent diodes with broader spectral bandwidth and axial resolutions in the range 1–2 μm. However, robust evaluation of the potential of this method will require the use of custom devices where speckle data has not been discarded as a pre-processing step for tissue segmentation.

5. Conclusions

We introduce a semi-automated approach for image classification of high-resolution OCT imagery using SVM-based machine-learning analysis. Although the OCT has insufficient resolution to differentiate subcellular components, the study results propose that the changes in light scatter generated by particles distributed within the phantoms produce meaningful optical signals. The quantification of speckle by texture analysis with machine learning classification tools provides a convenient method that can be more widely applied to the analysis of biological structures such as the retinal inner plexiform layer in the onset of glaucoma and Alzheimer’s disease.

Author Contributions

Conceptualization, J.E.M., J.A. and M.K.; methodology, J.E.M. and M.K.; software, M.K., I.E. and N.W.; validation, N.A., A.A. and I.E.; formal analysis, M.K.; investigation, M.K. and R.J.B.; resources, J.E.M. and J.A.; data curation, J.E.M. and J.A.; writing—original draft preparation, M.K.; writing—review and editing, J.E.M., J.A., I.E., N.A. and A.A.; visualization, M.K.; supervision, J.E.M.; project administration, J.E.M. and J.A.; funding acquisition, J.E.M. All authors have read and agreed to the published version of the manuscript.

Funding

M. Kulmaganbetov was supported by a scholarship from the Vice-Chancellor’s International Scholarships for Research Excellence, Cardiff University, Cardiff, UK. James Morgan was supported by Medical Research Council (MRC): G0800547—Optophysiological characterisation of retinal ganglion cell function by ultrahigh-resolution optical coherence tomography. A Achim was supported by a Leverhulme Trust Research Fellowship (INFHER).

Conflicts of Interest

The authors declare no conflict of interest. The funders had no role in the design of the study; in the collection, analyses, or interpretation of data; in the writing of the manuscript, or in the decision to publish the results.

References

  1. Huang, D.; Swanson, E.A.; Lin, C.P.; Schuman, J.S.; Stinson, W.G.; Chang, W.; Hee, M.R.; Flotte, T.; Gregory, K.; Puliafito, C.A.; et al. Optical Coherence Tomography. Science 1991, 254, 1178–1181. [Google Scholar] [CrossRef] [PubMed] [Green Version]
  2. De Amorim Garcia Filho, C.A.; Yehoshua, Z.; Gregori, G.; Farah, M.E.; Feuer, W.; Rosenfeld, P.J. Optical Coherence Tomography. In Retina, 5th ed.; Wilkinson, C., Hinton, D., Sadda, S., Wiedemann, P., Ryan, S., Eds.; W.B. Saunders: London, UK, 2013; pp. 82–110. [Google Scholar] [CrossRef]
  3. Jonnal, R.S.; Kocaoglu, O.P.; Zawadzki, R.J.; Liu, Z.; Miller, D.T.; Werner, J.S. A Review of Adaptive Optics Optical Coherence Tomography: Technical Advances, Scientific Applications, and the Future. Investig. Ophthalmol Vis. Sci. 2016, 57, 51–68. [Google Scholar] [CrossRef] [PubMed]
  4. Leitgeb, R.; Hitzenberger, C.K.; Fercher, A.F. Performance of fourier domain vs. time domain optical coherence tomography. Opt. Express 2003, 11, 889–894. [Google Scholar] [CrossRef] [PubMed]
  5. Uttam, S.; Liu, Y. Fourier phase in Fourier-domain optical coherence tomography. J. Opt. Soc. Am. 2015, 32, 2286–2306. [Google Scholar] [CrossRef] [PubMed] [Green Version]
  6. Ma, Y.; Chen, X.; Zhu, W.; Cheng, X.; Xiang, D.; Shi, F. Speckle noise reduction in optical coherence tomography images based on edge-sensitive cGAN. Biomed. Opt. Express 2018, 9, 5129–5146. [Google Scholar] [CrossRef] [PubMed]
  7. Schmitt, J.M.; Xiang, S.H.; Yung, K.M. Speckle in optical coherence tomography. J. Biomed. Opt. 1999, 4, 95–105. [Google Scholar] [CrossRef]
  8. Gossage, K.W.; Cynthia, M.S.; Elizabeth, M.K.; Lida, P.H.; Alice, L.S.; Jeffrey, J.R.; Williams, S.K.; Jennifer, K.B. Texture analysis of speckle in optical coherence tomography images of tissue phantoms. Phys. Med. Biol. 2006, 51, 1563–1575. [Google Scholar] [CrossRef] [Green Version]
  9. Oberholzer, M.; Östreicher, M.; Christen, H.; Brühlmann, M. Methods in quantitative image analysis. Histochem. Cell Biol. 1996, 105, 333–355. [Google Scholar] [CrossRef]
  10. Gossage, K.W.; Tkaczyk, T.S.; Rodriguez, J.J.; Barton, J.K. Texture analysis of optical coherence tomography images: Feasibility for tissue classification. J. Biomed. Opt. 2003, 8, 570–575. [Google Scholar] [CrossRef]
  11. Bhattacharjee, M.; Ashok, P.C.; Rao, K.D.; Majumder, S.K.; Verma, Y.; Gupta, P.K. Binary Tissue Classification Studies on Resected Human Breast Tissues Using Optical Coherence Tomography Images. J. Innov. Opt. Health Sci. 2011, 4, 59–66. [Google Scholar] [CrossRef]
  12. Anantrasirichai, N.; Achim, A.; Morgan, J.E.; Erchova, I.; Nicholson, L. SVM-based texture classification in Optical Coherence Tomography. In Proceedings of the 2013 IEEE 10th International Symposium on Biomedical Imaging, San Francisco, CA, USA, 7–11 April 2013; pp. 1332–1335. [Google Scholar] [CrossRef] [Green Version]
  13. Kajić, V.; Považay, B.; Hermann, B.; Hofer, B.; Marshall, D.; Rosin, P.L.; Drexler, W. Robust segmentation of intraretinal layers in the normal human fovea using a novel statistical model based on texture and shape analysis. Opt. Express 2010, 18, 14730–14744. [Google Scholar] [CrossRef] [PubMed]
  14. González-López, A.; Remeseiro, B.; Ortega, M.; Penedo, M.; Charlón, P. A Texture-Based Method for Choroid Segmentation in Retinal EDI-OCT Images; Springer International Publishing: Cham, Switzerland, 2015. [Google Scholar] [CrossRef]
  15. Costantini, R.; Sbaiz, L.; Susstrunk, S. Higher Order SVD Analysis for Dynamic Texture Synthesis. IEEE T. Image Process 2008, 17, 42–52. [Google Scholar] [CrossRef] [PubMed] [Green Version]
  16. Baxi, J.; Calhoun, W.; Sepah, Y.J.; Hammer, D.X.; Ilev, I.; Pfefer, T.J.; Nguyen, Q.D.; Agrawal, A. Retina-simulating phantom for optical coherence tomography. J. Biomed. Opt. 2014, 19, 21106. [Google Scholar] [CrossRef] [PubMed] [Green Version]
  17. Kennedy, B.F.; Loitsch, S.; McLaughlin, R.A.; Scolaro, L.; Rigby, P.; Sampson, D.D. Fibrin phantom for use in optical coherence tomography. J. Biomed. Opt. 2010, 15, 030507. [Google Scholar] [CrossRef] [PubMed] [Green Version]
  18. Esmonde-White, F.W.L.; Esmonde-White, K.A.; Kole, M.R.; Goldstein, S.A.; Roessler, B.J.; Morris, M.D. Biomedical tissue phantoms with controlled geometric and optical properties for Raman spectroscopy and tomography. Analyst 2011, 136, 4437–4446. [Google Scholar] [CrossRef] [PubMed] [Green Version]
  19. Erickson, S.J.; Martinez, S.L.; DeCerce, J.; Romero, A.; Caldera, L.; Godavarty, A. Three-dimensional fluorescence tomography of human breast tissues in vivo using a hand-held optical imager. Phys. Med. Biol. 2013, 58, 1563. [Google Scholar] [CrossRef] [Green Version]
  20. Nivetha, K.B.; Sujatha, N. Development of thin skin mimicking bilayer solid tissue phantoms for optical spectroscopic studies. Biomed. Opt. Express 2017, 8, 3198–3212. [Google Scholar] [CrossRef] [Green Version]
  21. Pan, Y.; Birngruber, R.; Rosperich, J.; Engelhardt, R. Low-coherence optical tomography in turbid tissue: Theoretical analysis. Appl. Opt. 1995, 34, 6564–6574. [Google Scholar] [CrossRef]
  22. Schmitt, J.M.; Lee, S.L.; Yung, K.M. An optical coherence microscope with enhanced resolving power in thick tissue. Opt. Commun. 1997, 142, 203–207. [Google Scholar] [CrossRef]
  23. Williams, D.R. Visual consequences of the foveal pit. Investig. Ophthalmol. Vis. Sci. 1980, 19, 653–667. [Google Scholar]
  24. Zhang, Q.; Zhong, L.; Tang, P.; Yuan, Y.; Liu, S.; Tian, J.; Lu, X. Quantitative refractive index distribution of single cell by combining phase-shifting interferometry and AFM imaging. Sci. Rep. UK 2017, 7, 2532. [Google Scholar] [CrossRef] [PubMed]
  25. Rappaz, B.; Marquet, P.; Cuche, E.; Emery, Y.; Depeursinge, C.; Magistretti, P.J. Measurement of the integral refractive index and dynamic cell morphometry of living cells with digital holographic microscopy. Opt. Express 2005, 13, 9361–9373. [Google Scholar] [CrossRef] [PubMed] [Green Version]
  26. Haseda, K.; Kanematsu, K.; Noguchi, K.; Saito, H.; Umeda, N.; Ohta, Y. Significant correlation between refractive index and activity of mitochondria: Single mitochondrion study. Biomed. Opt. Express 2015, 6, 859–869. [Google Scholar] [CrossRef] [PubMed] [Green Version]
  27. Rogowska, J.; Bryant, C.M.; Brezinski, M.E. Cartilage thickness measurements from optical coherence tomography. J. Opt. Soc. Am. A 2003, 20, 357–367. [Google Scholar] [CrossRef] [PubMed]
  28. Qiao, X.; Chen, Y.-W. A Statistical Texture Model of the Liver Based on Generalized N-Dimensional Principal Component Analysis (GND-PCA) and 3D Shape Normalization. Int. J. Biomed. Imaging 2011, 2001, 7. [Google Scholar] [CrossRef] [PubMed] [Green Version]
  29. Kischkat, J.; Peters, S.; Gruska, B.; Semtsiv, M.; Chashnikova, M.; Klinkmüller, M.; Fedosenko, O.; Machulik, S.; Aleksandrova, A.; Monastyrskyi, G.; et al. Mid-infrared optical properties of thin films of aluminum oxide, titanium dioxide, silicon dioxide, aluminum nitride, and silicon nitride. Appl. Optics 2012, 51, 6789–6798. [Google Scholar] [CrossRef] [PubMed]
  30. Drexler, W.; Morgner, U.; Ghanta, R.K.; Kärtner, F.X.; Schuman, J.S.; Fujimoto, J.G. Ultrahigh-resolution ophthalmic optical coherence tomography. Nat. Med. 2001, 7, 502. [Google Scholar] [CrossRef] [PubMed]
  31. Yogesan, K.; Jørgensen, T.; Albregtsen, F.; Tveter, K.J.; Danielsen, H.E. Entropy-based texture analysis of chromatin structure in advanced prostate cancer. Cytometry 1996, 24, 268–276. [Google Scholar] [CrossRef]
  32. Basset, O.; Sun, Z.; Mestas, J.L.; Gimenez, G. Texture Analysis of Ultrasonic Images of the Prostate by Means of Co-occurrence Matrices. Ultrason. Imaging 1993, 15, 218–237. [Google Scholar] [CrossRef]
  33. Conners, R.W.; Harlow, C.A. A theoretical comparison of texture algorithms. IEEE T. Pattern Anal. 1980, 2, 204–222. [Google Scholar] [CrossRef]
  34. Hongchuan, Y.; Bennamoun, M. 1D-PCA, 2D-PCA to nD-PCA. In Proceedings of the 18th International Conference on Pattern Recognition (ICPR’06), Hong Kong, China, 20–24 August 2006; pp. 181–184. [Google Scholar] [CrossRef]
  35. Schmitt, J.M.; Knüttel, A.; Yadlowsky, M.; Eckhaus, M.A. Optical-coherence tomography of a dense tissue: Statistics of attenuation and backscattering. Phys. Med. Biol. 1994, 39, 1705. [Google Scholar] [CrossRef] [PubMed]
  36. De Grand, A.M.; Lomnes, S.J.; Lee, D.S.; Pietrzykowski, M.; Ohnishi, S.; Morgan, T.G.; Gogbashian, A.; Laurence, R.G.; Frangioni, J.V. Tissue-like phantoms for near-infrared fluorescence imaging system assessment and the training of surgeons. J. Biomed. Opt. 2006, 11, 014007. [Google Scholar] [CrossRef] [PubMed]
  37. Schmitt, J.M. OCT elastography: Imaging microscopic deformation and strain of tissue. Opt. Express 1998, 3, 199–211. [Google Scholar] [CrossRef] [PubMed] [Green Version]
Figure 1. OCT system structure (explained in the text).
Electronics 11 00669 g001
Figure 2. The preparation procedure of the retinal phantoms for the OCT.
Electronics 11 00669 g002
Figure 3. Image processing and data preparation for the classifier: (a)—OCT scan of phantom and the VOI cube image; (b)—schematic view of the 3D cube of the size 30 × 30 × 30 pixels; (c)—extraction of grey level of each pixel for further grey-level co-occurrence matrix analysis.
Electronics 11 00669 g003
Figure 4. Original OCT image scans and threshold images of 384 nm (a), 1 µm (b), 2 µm (c), 5 µm (d) and 15 µm (e) PBs. Scatterers are more discernible in the threshold images.
Electronics 11 00669 g004
Figure 5. Confusion matrix of different concentrations of gelatin solution.
Electronics 11 00669 g005
Figure 6. Confusion matrix of different sizes of scatterers: (a)—without 384 nm PBs; (b)—with 384 nm PBs.
Electronics 11 00669 g006
Figure 7. Different concentration of scatterers: (a)—clusters in the feature space: two most discriminating GLCM features—contrast and angular second moment (ASM)—demonstrated better classification performance; (b)—confusion matrix.
Electronics 11 00669 g007
Figure 8. Principle component analysis of the different refractive indices of scatterers. (a)—3-dimensional principal component scores of PBs and SiO2; (b)—the distribution of the groups along with 1st and 2nd components; (c)—the distribution of the groups along with 1st and 3rd components; (d)—the distribution of the groups along with 2nd and 3rd components. The 3-component solution included 95% of the variance within the data.
Electronics 11 00669 g008aElectronics 11 00669 g008b
Table 1. Groups and types of phantoms.
Phantom GroupsPhantom TypesNumber of OCT Scans
Different concentrations of gelatin solution2% gelatin solution (2% GS)10
5% gelatin solution10
10% gelatin solution10
Different size of scatterers2% GS + 384 nm 50 µL PBs10
2% GS + 1 µm 50 µL PBs10
2% GS + 2 µm 50 µL PBs10
2% GS + 5 µm 50 µL PBs10
2% GS + 15 µm 50 µL PBs10
Different concentration of scatterers2% GS + 1 µm 5 µL PBs10
2% GS + 1 µm 10 µL PBs10
2% GS + 1 µm 20 µL PBs10
2% GS + 1 µm 30 µL PBs10
2% GS + 1 µm 40 µL PBs10
2% GS + 1 µm 50 µL PBs10
Different refractive index of scatterers2% GS + 1 µm 50 µL PBs10
2% GS + 1 µm 50 µL SiO210
Table 2. Classification accuracy of different phantom groups.
Phantom GroupsAccuracy of SVMAUC
with PCAwithout PCAwith PCAwithout PCA
Different concentrations of gelatin solution91.9%100%0.991.00
Different size of scatterers100%100%1.001.00
Different size of scatterers with submicron particles82.5%100%1.001.00
Different concentration of scatterers86.7%99.9%1.001.00
Publisher’s Note: MDPI stays neutral with regard to jurisdictional claims in published maps and institutional affiliations.

