Abstract
Natural language processing is still an emerging field in machine learning. Access to more and more data sets in textual form, new applications for artificial intelligence and the need for simple communication with operating systems all simultaneously affect the importance of natural language processing in evolving artificial intelligence. Traditional methods of textual representation, such as Bag-of-Words, have some limitations that result from the lack of consideration of semantics and dependencies between words. Therefore, we propose a new approach based on graph representations, which takes into account both local context and global relationships between words, allowing for a more expressive textual representation. The aim of the paper is to examine the possibility of using graph representations in natural language processing and to demonstrate their use in text classification. An innovative element of the proposed approach is the use of common cliques in graphs representing documents to create a feature vector. Experiments confirm that the proposed approach can improve classification efficiency. The use of a new text representation method to predict book categories based on the analysis of its content resulted in accuracy, precision, recall and an F1-score of over 90%. Moving from traditional approaches to a graph-based approach could make a big difference in natural language processing and text analysis and could open up new opportunities in the field.
1. Introduction
In modern times, with vast amounts of textual data available, an efficient representation of text is a key factor in many natural language processing tasks, in particular, in the classification of texts. Traditional textual representations based on statistical models, such as Bag-of-Words (BoW) or T-IDF models, are commonly used to represent text for machine learning purposes. However, these approaches often fail to consider semantics and word relationships, which can lead to the loss of important information and limit their use in more complex tasks [1].
In recent years, the flourishing of the field of graph representations has brought new possibilities in representing texts and modeling their semantics. Graph representations allow for both local context and global word dependencies, leading to more expressive textual representations. Moving from traditional models to a graph-based approach could be a breakthrough in effective text processing and analysis [2]. However, in order to be able to extract knowledge from the text, it must first be properly processed and presented. One way to represent text is the graph approach. In graph techniques, words are treated as nodes, and a shared-word methodology is used to create edges between them [3]. We want to analyze the graph representation for text analysis in a real book content classification problem.
Every day, the number of books available on the market increases. Nowadays, we have access to both paper and electronic books. Automatic classification of books would be applicable not only to libraries or physical stores, but also to digital repositories. Appropriately assigning a category to a book could improve the process of accessing this book to readers [4]. A librarian or bookseller knowing which shelf to put the book on will do their job much faster, and the reader looking for a book in a given genre will find it much faster. In addition, a proper classification could benefit book authors, as they would be able to find books more quickly that could compete with their own. For these reasons, we felt the urge to test our approach on a collection of books.
The aim of this paper is to study a new approach to text representation, which is based on a new graph representation, and demonstrate its use in text classification. Our methodology studies the applicability of the mentioned text representation method, which is then used to teach machine learning models for classification. The innovation of our approach is in finding common cliques in graphs representing documents and creating feature vectors based on them. The purpose of the experiments is to analyze the matrices derived from the text representation method proposed by us and to evaluate the classification measures (accuracy, precision, recall and F1-score) depending on the text representation used. Evaluation of classification measures is used to check whether the obtained results are similar to traditional methods. Our hypothesis is that the proposed approach based on graph representations will open new possibilities in the field of natural language processing and will contribute to improving the efficiency of text classification.
In summary, our main contributions presented in this paper are as follows:
- We obtain and process real long texts such as full books—this approach aims to extend the possibilities of text analysis and representation, which were previously limited to short fragments;
- We propose an innovative approach based on graph representations, taking into account both the local context and global relationships between words—graphs are a structural reflection of the text, which can provide new insights and information that are not taken into account in traditional methods of text representation;
- We find and use common cliques of words in graphs representing documents, which is a new perspective in text analysis—cliques are collections of words that occur together in context that can have semantic meaning, which is a new perspective in text analysis and can provide additional information when classifying text;
- We assess the effectiveness of classification by comparing the effectiveness of text classification based on a graph representation with the results of traditional methods—we use classification measures such as accuracy, precision, recall and F1-score to assess the new method’s effectiveness compared to existing approaches.
Our main scientific contributions include the development of a graph-based text representation methodology and, more specifically, a new approach related to the use of cliques in natural language processing. We analyze the usefulness of the proposed approach and evaluate the effectiveness of the classification compared to traditional methods. The introduction of graph representations into natural language processing aims to open up new possibilities and improve the efficiency of text classification.
This paper is organized as follows. Section 1 provides an introduction to the subject of this paper. Section 2 provides an overview of related works on natural language processing (NLP) methods, text classification and the graph representation of text, while Section 3 provides the needed theoretical background. In Section 4, we present our methodology for using a graph representation in the book classification process. We describe how we built mechanisms for visualizing relationships between various entities in the texts of books. In Section 5, we present our experiments and discuss the results. Finally, in Section 6, we conclude with general remarks about this paper and indicate some directions for future research.
2. Related Works
Natural language processing (NLP) is a piece of artificial intelligence that uses computational techniques to understand and create language content [5]. NLP is a vast and complex field. Language content may be oral or written and come from any language used for human communication [6]. Although natural language processing is a relatively young field, there have already been many publications on NLP and its application to real-world problems. One of them is creating a synopsis of a text.
B. Sharifi et al. [7] presented algorithms for summarizing microblog posts originating from Twitter. The authors proved that, by processing collections of short posts with the help of a graph, one could create short summaries that can be successfully compared to man-made summaries. M.A. Mosa et al. [8] summarized short texts using graphs. In this case, the authors proved that graph coloring can be successfully applied to the abstract. They [9] proposed an algorithm for summarizing comments based on ant colony optimization combined with Jensen–Shannon divergence. The algorithm was evaluated on a collection of Facebook posts with their related comments and achieved excellent performance compared to traditional document summary algorithms. In contrast, R.Y. Rumagit et al. [10] compared the results of the graph-based method and the method of weighting terms in order to determine the best method for summarizing the text. Ultimately, the results showed that the term-weighting method produced a better summary compared to the graph-based method. S.A. Crossley et al. [11] introduced an automatic abstract scoring model that effectively classified summaries as low or high quality with an accuracy of more than 80%. B. Liang et al. [12] showed that a model containing a graph convolutional network was able to outperform state-of-the-art methods on many public datasets.
There have also been studies comparing graph and vector approaches to text abstraction, showing that graph-based approaches yield better results. S.M. Ali et al. [3] used the vertices in their graph as entities of tweets, with keywords determined using the KeyGraph algorithm. A keyword-based summary was then successfully created and sentiment analysis was created for the keywords. Another example of using a graph representation is in [13]. The authors assigned weight to the edges of the graph, on the basis of which the similarity in the graph was found. Then, a synopsis was performed. The results of the evaluation of the proposed method showed a significant improvement in the quality of the abstract in relation to existing text summarization techniques. The graph representation can also be successfully used to classify text [14]. During the construction of the graph, homogeneous text graphs with word nodes are created, causing the learning system to be able to make inferences about new documents without having to rebuild the entire text graph. The authors used the experimental results on five benchmarks to show the superiority of the proposed method.
The problem of book classification was also raised in [15], where a system was proposed that successfully assigned books to the appropriate category, and in [16], in which BERT (Bidirectional Encoder Representations from Transformers) models supported automatic subject indexing for digital library collections. In contrast, T. Betts et al. [17] investigated the usefulness of information extraction techniques in a text categorization task, automatically extracting structured information from the full text of books.
We know that text classification problems are not a new phenomenon. However, considering the number of publications on these topics, this problem is still relevant. We believe that our representation could also be used for clustering, filtering or summarizing the text while allowing the document structure to be preserved, as well as the use of machine learning algorithms that operate on vectors.
3. Theoretical Background
The development of information technology has enabled not only the storage of a huge amount of texts in digital form, but also opened the door to the use of advanced natural language processing techniques. Due to the process of digitization of books, millions of people around the world have the opportunity to use the rich resources of literature without having to physically access the books. The electronic form of texts and NLP techniques enable easy searching and sharing, as well as processing and analysis of the information contained therein.
In addition, the phenomenon of book digitization in Project Gutenberg has created enormous challenges in processing and analyzing a huge amount of text. Therefore, natural language processing and graph representation of text play an increasingly important role, which enable effective analysis and extraction of valuable information from texts. For this reason, we present below the main theoretical aspects that are relevant in the context of the Gutenberg project, such as natural language processing, graph representation of text, and book classification.
3.1. Project Gunteberg
The Gutenberg (https://www.gutenberg.org/, accessed on 12 May 2023) project is an online library of free eBooks. Michael Hart, founder of Project Gutenberg, invented eBooks in 1971, and Project Gutenberg was the first provider of free eBooks [18]. By 1987, Project Gutenberg’s library had more than 300 publications; in 2016, it already had over 50,000 publications.
The main goal of the Project was the digitization of books and publications that have never been subject to copyright or whose copyright has expired. The mission of the project is to encourage all interested people to create eBooks and help in their dissemination [19]. In addition, the project partners want to make as many eBooks available in as many formats as possible, so that the whole world can read them in as many languages as possible.
3.2. Natural Language Processing
Natural language processing (NLP) combines the power of linguistics, computer science and mathematics to study the principles and structure of language. NLP is applicable to both written and speech and can be applied to all human languages. Natural language processing can be successfully used for automatic text or speech translation, message and spam filtering, document summarization, mood analysis and grammar and spell checking [20]. Some programs automatically suggest a reply to a message based on its content. In the context of Project Gutenberg, NLP plays a key role in the analysis and processing of large text collections such as books, articles and other documents.
Text preprocessing is an essential part of any NLP system because the characters, words and sentences identified at this stage are the basic units passed on to further processing steps [21]. Because text data often contains some special formats, such as number, date and common word formats, one must process them appropriately to support the whole process. The preprocessing methods include the process of tokenization [22], which consists of dividing the analyzed text into the so-called tokens, which can be sentences, words, parts of words, etc. In addition, during the pre-processing of real text data, a normalization process can be performed on all words in the text. Popular normalization methods in NLP are stemming and lemmatization [23].
Stemming consists of extracting from the core from a word, i.e., the constant part that does not change—regardless of the inflection by persons, cases or numbers. The purpose of stemming is, therefore, to cut off the inflection ending and leave the invariable part, which is often only a fragment of a correct word existing in the dictionary [24].
Lemmatization is often confused with stemming due to the fact that, in many cases, it returns similar results. However, lemmatization concsists of extracting from the word its basic form (the so-called lemma), which is not inflected by any cases, persons or forms over time. For the correct operation of the lemmatizer, dictionaries are needed, on the basis of which it is possible to associate different forms of the same word [25].
3.3. Text Representation
Text representation plays a key role in natural language analysis and processing. It consists of a way of presenting text in a form that can be easily processed and analyzed by computers. There are many different ways to represent text, depending on the context and purpose of the analysis.
One of the simplest ways to represent text is stepwise representation, where text is broken down into individual units, such as words or characters, and processed sequentially. This representation is used, for example, in lexical analysis, where words are treated as base units and the analysis focuses on identifying and assigning appropriate labels (e.g., parts of speech) to individual words [26].
In NLP, statistical methods are commonly used to analyze texts, which consist of counting the occurrence of words in texts. They provide the necessary variables used in string processing. For this purpose, the representation of the document as term vectors is used, which consists of terms, and the values of the vector are the corresponding term weights. This representation can be represented as one of three measures of word weights: TF [27], T-IDF [28] and a binary measure [29]. Based on such types of text representation, together with machine learning methods, the classification [30,31] was successfully studied.
Another frequently used NLP method is the word embedding model, which involves representing words or text entities in a vector space to capture the semantic and syntactic relationships between words, allowing machine learning models to understand the meaning and context of words in a more efficient and effective way. These techniques are based on the hypothesis that words in similar contexts tend to have similar meanings. To this end, word embedding models such as Word2Vec, GloVe and FastText learn to assign similar vectors to words that have similar meanings or are used in similar contexts [32,33]. This means that words with similar semantic or syntactic properties have similar vector representations, and their embedding space distances reflect their relationships [34]. For example, words such as “king” and “queen” should have similar vector representations and be closer in embedding space compared to words such as “dog” or “cat”. Conversely, using vector arithmetic by performing vector addition or subtraction, we can get vectors of other words. For example, by subtracting the vector representation of “male” from “king” and adding “female”, we can approximate the vector representation of the word “queen”.
Word embedding models use large text corpora [35], but there are difficulties with rare words that are not common in training corpora [36]. Word embedding models have difficulty discriminating between the different meanings of ambiguous words, as most often these models combine different meanings into a single embedding. Moreover, these models analyze words in isolation, ignoring the context in which they occur, which means that two identical words used in different contexts may have the same embedding, which can lead to the loss of semantic information [37].
There are also mind-based models as input representations, where word embedding is commonly used [38]. During training, the model learns to pay attention to different parts of the input sequence, using attention mechanisms to capture information relevant to the task at hand. Word embedding allows the model to understand the semantics and contextual relationships between words, allowing it to make more accurate predictions or generate meaningful output.
3.4. Graph Representation
The graph representation of text is another key element that adds value to the analysis of texts in the context of Project Gutenberg. By a graph representation of text, we mean a graph representation of text where words, sentences or documents are vertices, and the semantic or syntactic relationships between them are edges [39]. Such a graph structure allows the use of advanced graph analysis techniques to identify patterns or thematic relationships in or to perform semantic analysis of the text. Because of this, it is possible to discover hidden information, classify texts and extract knowledge from the large amount of textual data collected in Project Gutenberg [40].
A graph is the basic object of consideration in graph theory, where it is defined as a mathematical structure used to represent and study relationships between objects. The graph is a set of vertices V that can be connected by edges in such a way that each edge ends and begins at one of the vertices. E is a set of edges that can repeat. If every two vertices are connected by an edge, the graph is complete. When vertices contain certain labels, then the graph is labeled. Depending on the use of NLP, nodes and edges can represent different entities and associations related to the language [41].
The C clique of the G graph is a fragment of the G graph that is complete and not contained in any major full subgraph of G (i.e., C is a maximum full subgraph of G) [42]. In 1973, the Bron–Kerbosch Algorithm [43] was proposed. It was constructed to find all maximal cliques in an undirected graph. It enumerates all subsets of vertices with two properties. First, each pair of vertices in one of the enumerated subsets is connected by an edge. Secondly, none of the enumerated subsets can have additional vertices added while maintaining complete connectivity.
Graph-based methods focus on how to represent text documents in the shape of a graph to take advantage of their properties [44]. A graph allows one to capture connections between different pieces of text, such as entities, sentences and documents [45]. Research has been conducted on combining graph representation with machine learning [46], which has shown that semi-supervised graph-based learning is superior to semi-supervised Bag-of-Words learning.
The graph-based representation of words can store and use more advanced information about the semantics of words [47]. Graphs can include semantic relationships between words, such as synonyms, antonyms, hyperonyms, hyponyms and other semantic relationships. This allows the graph-based representation to convey a more precise meaning of words in context than classical word representations [48]. Graphs allow onr to model various relationships between words, such as semantic, synectic, semantic–syntactic relationships, etc. They can reflect relationships between words along different dimensions, which can be useful in understanding the context and syntax of a sentence.
Graph-based representation can better deal with word ambiguity [49]. By taking into account the context and the relationships between words in the graph, one can better distinguish the different meanings of a word and determine which meaning is appropriate in which context. Graphs can be a more flexible representation in solving word ambiguity problems. In cases where ambiguity is common, a graph-based representation may be more useful.
3.5. Classification
Text classification is one of the fundamental tasks in natural language processing [50], and book classification is an important aspect in the context of Project Gutenberg. Classification is also one of the main tasks of machine learning. Assigning objects from the set to one of the previously defined classes is handled by the classification model. Many classical classification models are good at classifying textual data. One of them is the Classification and Regression Trees (CART) [51] algorithm. It is used to construct decision trees. In a decision tree, nodes are divided into subnodes based on an attribute’s threshold value. The root node is treated as a training set and is split in two by considering the best attribute and the threshold value. Then, the subsets are also split using the same logic. This continues until either the last pure subset in the tree or the maximum possible number of leaves in that growing tree is found. The main task of CART is to divide the data into parts which are as homogeneous or equal as possible.
Another algorithm proposed by Breiman in 1996 is Bagging. Bagging is a set of multiple [52] classifiers. This algorithm has three basic steps: Bootstrapping (using the bootstrapping sampling technique to create varied samples; this resampling method generates different subsets of the training dataset by selecting data points randomly and with replacement), Parallel training (bootstrapping samples are trained independently and in parallel with each other using weak or base trainers) and Aggregation (finally, there is a majority vote).
In 2001, Breiman proposed another refinement—random forest [53]. A random forest consists of a large number of individual decision trees that act as a team. Each individual tree in the random forest yields a class prediction, and the class with the most votes becomes the model’s prediction.
An alternative to the presented algorithms is the AdaBoost [54] classifier, which aims to combine many weak classifiers in order to build one strong classifier. A single classifier may not be able to accurately predict the class of an object, but, when many weak classifiers are grouped together, each of which gradually learns from the others’ misclassified objects, one strong model can be built.
Another algorithm is Support Vector Machine (SVM) [55]. SVM performs classification tasks by constructing hyperplanes in a multidimensional space, separating cases belonging to different classes. The dimension of the hyperplane depends on the number of features. If the number of input features is two, then the hyperplane is just a line. If the number of input features is three, then the hyperplane becomes a two-dimensional plane. It becomes difficult to imagine when the number of features exceeds three.
Recently, we have seen the development of innovative approaches in the field of text classification. In addition to the use of advanced models such as Transformers [56,57], two particularly promising approaches are based on the use of teams and the architectures of Convolutional Neural Networks (CNN) and Hybrid Long Short-Term Memory (LSTM) [58]. These involve combining the predictions of many different models that are trained on the same input. Each model in the assembly can have a different architecture and hyperparameter configuration. After each model makes a prediction, the results are aggregated to produce a final classification. This approach aims to take advantage of the diversity in model predictions to improve overall classification performance.
One modern approach is to use deep learning models to detect irony and disseminate stereotypes [59]. The proposed model was based on a data augmentation (DA) layer followed by a convolutional neural network (CNN) and achieved a maximum accuracy of 0.92 and an average accuracy of 0.89 over 5 turns. The irony detection problem has also been solved using classical machine learning methods. The authors of the paper [60] used a text vectorization layer to generate a sequence of Bag-of-Words, which were then passed to three different text classifiers (decision tree, convolutional neural network, naive Bayes). However, the final classifier was SVM, and experiments of the proposed approach were able to achieve a maximum binary accuracy on the best validation division of 0.9474.
NLP models are also used to detect sarcasm [61,62] and fake news [63,64]. Detecting sarcasm in text is a difficult task due to the need to understand the hidden meaning and intention of the utterance. NLP models can use a variety of methods, such as sentiment analysis, contradiction detection and context analysis, to recognize sarcasm [65]. In addition, NLP models can analyze text content for source credibility, analyze sentence structure, detect contradictions or analyze content in the context of other messages to assess the truthfulness of information [66,67].
The results of these papers indicate the promising effectiveness of innovative approaches based on CNN and Hybrid LSTM or Transformers networks. However, in the context of text classification, classical machine learning methods are still valuable due to their stability, interpretability and lower computational and resource requirements.
4. Research Methodology
The basis for starting the research was the need to find a new way of representing the text, which takes into account the relationships between words. One of the key elements of natural language processing is the way text is represented, so we attempted to find an alternative way to represent text based on graphs that take into account both the local context and global relationships between words in documents. Finding an appropriate way to represent text would significantly improve not only text classification, but could also improve the process of clustering or summarizing texts. The innovation of our approach is in finding common cliques in graphs representing documents as a basis for creating feature vectors. This new approach to text analysis, that takes into account the relationships between words, can yield more expressive textual representations and contribute to better analysis of semantics.
We decided to test our graph-based text representation to see if the results would be similar to traditional methods. This could be used to solve the problem of finding similar documents, so as to allow an easier and faster way to find other similar documents. In our experiments, we focused on the problem of matching books to appropriate categories so that readers have easier access to them. This problem can be overcome by providing libraries with a tool to support the correct classification of books.
Our research methodology was to explore a new approach to text representation, which was based on an innovative graph representation using the creation of word-based cliques. Our methodology focused on studying the usefulness of the proposed text representation and using it to teach machine learning models for classification. We wanted to demonstrate the application of this method in the classification of texts by conducting an analysis in the context of using text representations to classify books based on their content. One of the key elements of our approach was finding common cliques in graphs representing documents and creating a feature vector based on them. We analyzed the effectiveness of this method of text representation in the context of book classification based on their content and compared it to classic text representations. Our approach is based on text processing and concerns its representation.
Figure 1 shows a diagram of the algorithm of the proposed approach. The first step of our approach was to pre-process the content of the documents (see Step 1 on Figure 1). For this purpose, we removed stop words and other diacritical marks and carried out the word normalization process, where we applied lemmatization algorithms. We also removed the punctuation marks outside the dots, which were necessary for us in the next step. Then, we presented the text in the form of a labeled graph (see Step 2 on Figure 1). The vertices of the graph are words that appear in the text, but each word appears only once in the graph. An edge in a graph means that a given word appeared in a sentence next to another word. Periods are necessary at this stage, as they separate sentences, so that the last word of one sentence should not be connected by an edge to the first word of the next sentence. This keeps track of the order in which words appear in each sentence. Since the occurrence of a dot caused the edge in the graph between two words to not occur, the graphs we received were inconsistent.
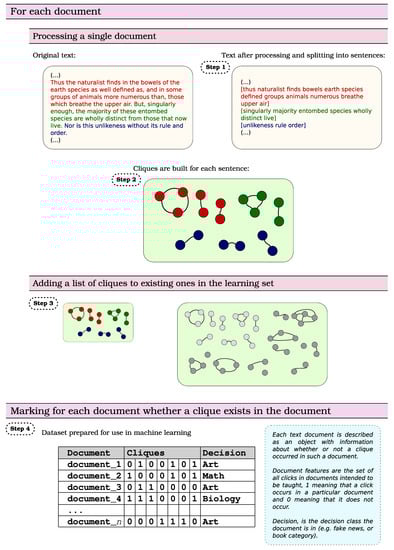
Figure 1.
Diagram of the algorithm of the proposed approach.
In the texts we studied, there were situations in which a given word was preceded by and ended with a dot (e.g., website addresses), which resulted in the creation of a single-element graph in an inconsistent graph. On the graph prepared in this way, the Bron–Kerbosch algorithm [43] was run in order to find all possible cliques (see Step 3 on Figure 1). In addition, common one-element subgraphs were also determined. In this way, a set of cliques and one-element subgraphs was created.
The next step (see Step 4 on Figure 1) was to create a binary matrix, containing information as to whether a given element of the set appeared in the text of the book (“1”—if it occurs in the text, or “0”—if it does not occur). Since we have proven in our previous research that better results are obtained using term weighting (TF) compared to binary [15], we decided to use this fact in our approach as well. We also created matrices in which we weighted the frequency of occurrence of the elements of the set. We counted the number of times a given element appeared in the document (weight) in three different ways:
- max—clique weight is the largest number of occurrences of two elements in the text from all elements of the clique;
- min—clique weight is the smallest number of occurrences of two elements in the text of all clique elements;
- sum—clique weight is the sum of the number of occurrences of two elements in the text from all clique elements.
The occurrence of two clique elements was taken into account, because there could be situations in the text in which (for example) three words did not occur together in a sentence, while every two had to occur together at least once (otherwise they would not be connected by an edge). In the case of a graph with one vertex, the weight was the number of occurrences of that word in the text.
In addition, two things are worth mentioning. First, we decided to examine both the vector containing the common elements of the set for all documents and the common elements only in the class. In this way, we wanted to check whether the type of determination of common elements in the matrix can affect the subsequent classification results:
- true—common elements were determined only in the class;
- false—set common elements in all documents.
Secondly, because there have been instances of a single-element subgraph, we also examined our approach depending on the inclusion of the elements of the set in the creation of the vector:
- all—all elements of the set;
- clique—cliques containing more than two items.
Then, on such constructed vectors, we carried out classification using the algorithms AdaBoost, Bagging, CART, Random Forest and SVM.
5. Experiments and Results
The purpose of our experiments was to evaluate the effectiveness of the proposed approach on a real dataset, based on Project Gutenberg books, as described in Section 3.1. We wanted to see if our method performed well in classification, as measured by quality measures such as accuracy, precision, recall and F1-score. To conduct the experiments, we created a dataset that consisted of book content assigned to specific categories. We selected two categories from Project Gutenberg to test our approach. These were “Philosophy” and “Technology”. The categories were chosen to correspond to major themes and currents in science. Our dataset contained 320 books—102 in the “Philosophy” category and 218 in ”Technology”. All book texts were processed according to the steps described in Section 4. We compared our results to the algorithm used in [15]. The results showed that the content of the set had a large impact on the classification results. However, classification using the new text representation performed slightly worse than those obtained using the standard representation.
5.1. Text Representation
Our text representation was compared with the classic vector approach–binary, TF and T-IDF, as used in [15]. In the case of the classical approach, the matrices we obtained contained 63,280 features. In the case of common elements of the set in the class, the number of features we obtained was 112,869 cliques. The matrix composed of common elements of the set from all documents was 140,465. The number of elements of each set is in Table 1.

Table 1.
Number of elements in set, common in classes and in all documents.
5.2. Classification
For classifiers, we used a training set containing 70% of all books and a test set containing the remaining 30% of books. Below are the classification results for the following measures: accuracy (Table 2), precision (Table 3), recall (Table 4) and F1-score (Table 5).
Table 2.
Classification results for the measure accuracy.
Table 3.
Classification results for the measure precision.
Table 4.
Classification results for the measure recall.
Table 5.
Classification results for the measure F1-score.
For each of the measures, the best results were obtained using classical approaches. In the case of accuracy and recall, the highest scores of all were obtained for AdaBoost and the TF measure. The highest precision scores of all were also obtained for AdaBoost, but this time for the TF and Binary measures. For F1-score, the highest scores of all were obtained for AdaBoost with a TF or Binary measure and SVM with a Binary measure.
In the case of the approach proposed by us, the most similar results to the classical approaches for each measure were achieved by the approach in which all elements of the set (cliques and one-element graphs) and the AdaBoost algorithm were taken into account. Scores over 90% were also obtained for the Bagging algorithm and all approaches containing all elements of the set (see Table 2).
Analyzing the accuracy measure, the results presented in Table 2 indicate that the SVM algorithm obtained the worst results when combined with the approach that takes into account cliques larger than two elements. However, the best was achieved by the AdaBoost and Bagging algorithms in combination with the approach containing all elements of the set. For different clique weights (sum, max, min), accuracy results were at a similar level (all of them were in the range of 90–95%). This means that, in this particular case, using more cliques may lead to lower classification accuracy.
For the precision and recall measures, shown in Table 3 and Table 4, AdaBoost and Bagging also scored above 90%. In addition, for the precision measure, the Random Forest algorithm with all elements of the set also achieved a score of over 90%. This is an important observation because high precision demonstrates the algorithm’s ability to accurately identify positive cases in the classification. In contrast, the worst results were obtained by the CART algorithm in combination with a binary approach, which considered common cliques larger than two-element in the class. On the other hand, for the recall measure, the worst results were achieved by the SVM algorithm in combination with the max approach, which took into account cliques larger than two-element size. This means that, for these combinations, the algorithms had difficulty correctly identifying all positive cases, resulting in lower precision and recall.
Analyzing the F1-score measure (see Table 5), we notice that the worst results were obtained by the SVM algorithm in combination with the max approach, which considered cliques larger than two-element size. This means that, for this particular combination, the algorithm struggled to achieve both high precision and recall, resulting in a lower F1-score.
On the other hand, the best F1-score results were achieved by the AdaBoost and Bagging algorithms, combined with an approach that takes into account all elements of the set, with different weights of cliques (sum, max, min). This means that these algorithms have demonstrated their ability to achieve high precision and recall simultaneously, resulting in a higher F1-score.
These results suggest that the AdaBoost and Bagging algorithms, together with a full range of dataset elements and different clique weights, may be more effective in classifying text and achieving a higher F1-score. Different clique weights allow one to flexibly adjust the impact of differently sized cliques on the classification score, which can lead to a better balance between precision and recall.
The results in Table 2, Table 3, Table 4 and Table 5 are promising and indicate the effectiveness of approaches that use the full spectrum of information available in the dataset. Including both cliques and single-element graphs allows for a more comprehensive representation of data and a better understanding of its structure. Algorithms such as AdaBoost and Bagging, which use different models to improve overall classification performance, also yield good results.
Scores above 90% indicate that our approaches are competitive with classical classification methods. They also open up the possibility of further research and development to further optimize these methods and apply them to various fields where classification is relevant. The conclusion of our research suggests that the full use of the elements of the dataset and the use of appropriate classification algorithms can lead to high scores and better performance in text classification tasks.
6. Conclusions
The aim of this paper was to analyze the method of text representation proposed by us. The method of text representation proposed by us was based on a graph representation from which we determined a set containing cliques and single-element graphs. On the basis of the set, a vector was created, from which the matrix was built. In addition, we performed a classification using our text representation and checked whether the obtained results were similar to those obtained using the traditional text representation. We used machine learning algorithms (CART, Bagging, Random Forest, AdaBoost, SVM) to classify the books. Accuracy, precision, recall and F1-score were selected to assess the quality of the classification. We compared the results to the classification results using classical approaches (using three measures of word weights).
The analysis of the matrices obtained, both the classical ways of representing the text and the one proposed by us, showed that, in the case of a set containing both cliques and single-element graphs, the number of features was more than twice as high. However, in the case of a set containing more than two-element cliques, the number of features obtained compared to the number of features from the classical approaches was 89% lower in the case of cliques common in the class and 88% lower in the case of cliques common in all documents. Such a huge difference is due to the fact that there were more two-element cliques than features in the vectors from the classical approaches. In addition, as a result of the analysis, it was noticed that there were 27,596 more common set elements in all documents compared to the common set elements in the class. However, 26,614 of these elements were two-element cliques.
Based on the observations of the conducted experiments, it was confirmed that the use of a new method of text representation for predicting book categories, based on the analysis of its content, allowed us to achieve accuracy, precision, recall and F1-score at a level of over 90%. This was achieved when all elements of the set were used together with the AdaBoost algorithm. However, it should be noted that higher accuracy, precision, recall and F1-score were obtained using the standard text representation. In addition, it should be noted that the use of a set containing only cliques with a size of more than two elements affected the subsequent classification results, making them worse. This leads to the conclusion that the content of the set is important in the classification process.
In the future, it is planned to use the selection of parameters in research. The conducted analyses indicate that better results are obtained using a set containing both cliques and single-element graphs. It is also worth testing our text representation for a set of shorter texts to see if the content of the set also matters in the case of a much smaller number of words in the document. The application of text representations to other NLP tasks, such as summarizing, is also an issue worth exploring. The way the text is represented in this publication contains information about the occurrence of words, which can be extremely useful in the case of a text summary.
Author Contributions
Conceptualization, B.P., A.H. and J.K.; Methodology, B.P. and J.K.; Software, A.H.; Validation, A.H.; Formal analysis, B.P.; Investigation, B.P. and J.K.; Resources, B.P. and J.K.; Data curation, J.K.; Writing—original draft, B.P., A.H. and J.K.; Writing—review & editing, B.P. and J.K.; Visualization, B.P.; Supervision, B.P. and J.K.; Project administration, B.P. and J.K.; Funding acquisition, J.K. All authors have read and agreed to the published version of the manuscript.
Funding
This research received no external funding.
Data Availability Statement
Data sharing not applicable.
Conflicts of Interest
The authors declare no conflict of interest.
References
- Bales, M.E.; Wright, D.N.; Oxley, P.R.; Wheeler, T.R. Bibliometric Visualization and Analysis Software: State of the Art, Workflows, and Best Practices; Cornell University: Ithaca, NY, USA, 2020. [Google Scholar]
- Jaradeh, M.Y.; Oelen, A.; Farfar, K.E.; Prinz, M.; D’Souza, J.; Kismihók, G.; Stocker, M.; Auer, S. Open research knowledge graph: Next generation infrastructure for semantic scholarly knowledge. In Proceedings of the 10th International Conference on Knowledge Capture, Marina Del Rey, CA, USA, 19–21 November 2019; pp. 243–246. [Google Scholar]
- Ali, S.M.; Noorian, Z.; Bagheri, E.; Ding, C.; Al-Obeidat, F. Topic and sentiment aware microblog summarization for twitter. J. Intell. Inf. Syst. 2020, 54, 129–156. [Google Scholar] [CrossRef]
- Wanigasooriya, A.; Silva, W.P.D. Automated Text Classification of Library Books into the Dewey Decimal Classification (DDC); University of Kelaniya: Kelaniya, Sri Lanka, 2021. [Google Scholar]
- Hirschberg, J.; Manning, C.D. Advances in natural language processing. Science 2015, 349, 261–266. [Google Scholar] [CrossRef] [PubMed]
- Liddy, E.D. Natural Language Processing; Syracuse University: Syracuse, NY, USA, 2001. [Google Scholar]
- Sharifi, B.; Hutton, M.A.; Kalita, J.K. Experiments in microblog summarization. In Proceedings of the 2010 IEEE Second International Conference on Social Computing, Minneapolis, MN, USA, 20–22 August 2010; pp. 49–56. [Google Scholar]
- Mosa, M.A.; Hamouda, A.; Marei, M. Graph coloring and ACO based summarization for social networks. Expert Syst. Appl. 2017, 74, 115–126. [Google Scholar] [CrossRef]
- Mosa, M.A.; Hamouda, A.; Marei, M. Ant colony heuristic for user-contributed comments summarization. Knowl.-Based Syst. 2017, 118, 105–114. [Google Scholar] [CrossRef]
- Rumagit, R.Y.; Setiyawati, N.; Bangkalang, D.H. Comparison of graph-based and term weighting method for automatic summarization of online news. Procedia Comput. Sci. 2019, 157, 663–672. [Google Scholar] [CrossRef]
- Crossley, S.A.; Kim, M.; Allen, L.; McNamara, D. Automated summarization evaluation (ASE) using natural language processing tools. In Proceedings of the International Conference on Artificial Intelligence in Education, Chicago, IL, USA, 25–29 June 2019; pp. 84–95. [Google Scholar]
- Liang, B.; Su, H.; Gui, L.; Cambria, E.; Xu, R. Aspect-based sentiment analysis via affective knowledge enhanced graph convolutional networks. Knowl.-Based Syst. 2022, 235, 107643. [Google Scholar] [CrossRef]
- Belwal, R.C.; Rai, S.; Gupta, A. A new graph-based extractive text summarization using keywords or topic modeling. J. Ambient. Intell. Humaniz. Comput. 2021, 12, 8975–8990. [Google Scholar] [CrossRef]
- Dai, Y.; Shou, L.; Gong, M.; Xia, X.; Kang, Z.; Xu, Z.; Jiang, D. Graph fusion network for text classification. Knowl.-Based Syst. 2022, 236, 107659. [Google Scholar] [CrossRef]
- Probierz, B.; Kozak, J.; Hrabia, A. A comparative study of classification and clustering methods from text of books. In Proceedings of the Intelligent Information and Database Systems: 14th Asian Conference, ACIIDS 2022, Ho Chi Minh City, Vietnam, 28–30 November 2022; Proceedings, Part II. Springer: Cham, Switzerland, 2022; pp. 13–25. [Google Scholar]
- Chou, C.; Chu, T. An Analysis of BERT (NLP) for Assisted Subject Indexing for Project Gutenberg. Cat. Classif. Q. 2022, 60, 807–835. [Google Scholar] [CrossRef]
- Betts, T.; Milosavljevic, M.; Oberlander, J. The utility of information extraction in the classification of books. In Proceedings of the European Conference on Information Retrieval, Rome, Italy, 2–5 April 2007; pp. 295–306. [Google Scholar]
- Brooke, J.; Hammond, A.; Hirst, G. GutenTag: An NLP-driven tool for digital humanities research in the Project Gutenberg corpus. In Proceedings of the Fourth Workshop on Computational Linguistics for Literature, Denver, CO, USA, 4 June 2015; pp. 42–47. [Google Scholar]
- Bean, R. The use of Project Gutenberg and hexagram statistics to help solve famous unsolved ciphers. In Proceedings of the 3rd International Conference on Historical Cryptology HistoCrypt 2020, Budapest, Hungary, 15–17 June 2000; Linköping University Electronic Press: Linköping, Sweden, 2020; Volume 171, pp. 31–35. [Google Scholar]
- Chowdhary, K. Fundamentals of Artificial Intelligence; Springer: Berlin/Heidelberg, Germany, 2020. [Google Scholar]
- Kannan, S.; Gurusamy, V.; Vijayarani, S.; Ilamathi, J.; Nithya, M.; Kannan, S.; Gurusamy, V. Preprocessing techniques for text mining. Int. J. Comput. Sci. Commun. Netw. 2014, 5, 7–16. [Google Scholar]
- Webster, J.J.; Kit, C. Tokenization as the initial phase in NLP. In Proceedings of the COLING 1992 Volume 4: The 15th International Conference on Computational Linguistics, Nantes, France, 5–9 August 1992. [Google Scholar]
- Lovins, J.B. Development of a stemming algorithm. Mech. Transl. Comput. Linguist. 1968, 11, 22–31. [Google Scholar]
- Amirhosseini, M.H.; Kazemian, H. Automating the process of identifying the preferred representational system in Neuro Linguistic Programming using Natural Language Processing. Cogn. Process. 2019, 20, 175–193. [Google Scholar] [CrossRef]
- Straková, J.; Straka, M.; Hajic, J. Open-source tools for morphology, lemmatization, POS tagging and named entity recognition. In Proceedings of the Proceedings of 52nd Annual Meeting of the Association for Computational Linguistics: System Demonstrations, Baltimore, MD, USA, 22–27 June 2014; pp. 13–18. [Google Scholar]
- El-Kassas, W.S.; Salama, C.R.; Rafea, A.A.; Mohamed, H.K. Automatic text summarization: A comprehensive survey. Expert Syst. Appl. 2021, 165, 113679. [Google Scholar] [CrossRef]
- Adeva, J.G.; Atxa, J.P.; Carrillo, M.U.; Zengotitabengoa, E.A. Automatic text classification to support systematic reviews in medicine. Expert Syst. Appl. 2014, 41, 1498–1508. [Google Scholar] [CrossRef]
- Zhang, Y.-T.; Ling, G.; Yong-cheng, W. An improved TF-IDF approach for text classification. J. Zhejiang Univ.-Sci. A 2005, 6, 49–55. [Google Scholar] [CrossRef]
- Bedekar, P.P.; Bhide, S.R. Optimum coordination of directional overcurrent relays using the hybrid GA-NLP approach. IEEE Trans. Power Deliv. 2010, 26, 109–119. [Google Scholar] [CrossRef]
- Sabri, T.; El Beggar, O.; Kissi, M. Comparative study of Arabic text classification using feature vectorization methods. Procedia Comput. Sci. 2022, 198, 269–275. [Google Scholar] [CrossRef]
- Hajibabaee, P.; Malekzadeh, M.; Ahmadi, M.; Heidari, M.; Esmaeilzadeh, A.; Abdolazimi, R.; James, H., Jr. Offensive language detection on social media based on text classification. In Proceedings of the 2022 IEEE 12th Annual Computing and Communication Workshop and Conference (CCWC), Virtual, 26–29 January 2022; pp. 0092–0098. [Google Scholar]
- Dharma, E.M.; Gaol, F.L.; Warnars, H.; Soewito, B. The accuracy comparison among Word2vec, Glove, and Fasttext towards convolution neural network (CNN) text classification. J. Theor. Appl. Inf. Technol. 2022, 100, 31. [Google Scholar]
- Sitender; Sangeeta; Sushma, N.S.; Sharma, S.K. Effect of GloVe, Word2Vec and FastText Embedding on English and Hindi Neural Machine Translation Systems. In Proceedings of Data Analytics and Management: ICDAM 2022; Springer: Berlin/Heidelberg, Germany, 2023; pp. 433–447. [Google Scholar]
- Grohe, M. word2vec, node2vec, graph2vec, x2vec: Towards a theory of vector embeddings of structured data. In Proceedings of the 39th ACM SIGMOD-SIGACT-SIGAI Symposium on Principles of Database Systems, Portland, OR USA, 14–19 June 2020; pp. 1–16. [Google Scholar]
- Sakketou, F.; Ampazis, N. A constrained optimization algorithm for learning GloVe embeddings with semantic lexicons. Knowl.-Based Syst. 2020, 195, 105628. [Google Scholar] [CrossRef]
- Jatnika, D.; Bijaksana, M.A.; Suryani, A.A. Word2vec model analysis for semantic similarities in english words. Procedia Comput. Sci. 2019, 157, 160–167. [Google Scholar] [CrossRef]
- Galassi, A.; Lippi, M.; Torroni, P. Attention in natural language processing. IEEE Trans. Neural Netw. Learn. Syst. 2020, 32, 4291–4308. [Google Scholar] [CrossRef]
- Yi, J.; Tao, J. Self-attention based model for punctuation prediction using word and speech embeddings. In Proceedings of the ICASSP 2019—2019 IEEE International Conference on Acoustics, Speech and Signal Processing (ICASSP), Brighton, UK, 12–17 May 2019; pp. 7270–7274. [Google Scholar]
- Mirończuk, M.M.; Protasiewicz, J. A recent overview of the state-of-the-art elements of text classification. Expert Syst. Appl. 2018, 106, 36–54. [Google Scholar] [CrossRef]
- Paulheim, H. Knowledge graph refinement: A survey of approaches and evaluation methods. Semant. Web 2017, 8, 489–508. [Google Scholar] [CrossRef]
- Ji, S.; Pan, S.; Cambria, E.; Marttinen, P.; Philip, S.Y. A survey on knowledge graphs: Representation, acquisition, and applications. IEEE Trans. Neural Netw. Learn. Syst. 2021, 33, 494–514. [Google Scholar] [CrossRef]
- Hamelink, R.C. A partial characterization of clique graphs. J. Comb. Theory 1968, 5, 192–197. [Google Scholar] [CrossRef]
- Bron, C.; Kerbosch, J. Algorithm 457: Finding all cliques of an undirected graph. Commun. ACM 1973, 16, 575–577. [Google Scholar] [CrossRef]
- Osman, A.H.; Barukub, O.M. Graph-based text representation and matching: A review of the state of the art and future challenges. IEEE Access 2020, 8, 87562–87583. [Google Scholar] [CrossRef]
- Liu, B.; Wu, L. Graph Neural Networks in Natural Language Processing. In Graph Neural Networks: Foundations, Frontiers, and Applications; Springer: Berlin/Heidelberg, Germany, 2022; pp. 463–481. [Google Scholar]
- Widmann, N.; Verberne, S. Graph-based semi-supervised learning for text classification. In Proceedings of the ACM SIGIR International Conference on Theory of Information Retrieval, Amsterdam, The Netherlands, 1–4 October 2017; pp. 59–66. [Google Scholar]
- Mallick, C.; Das, A.K.; Dutta, M.; Das, A.K.; Sarkar, A. Graph-based text summarization using modified TextRank. In Soft Computing in Data Analytics: Proceedings of International Conference on SCDA 2018; Springer: Singapore, 2019; pp. 137–146. [Google Scholar]
- Nath, N.; Lee, S.H.; McDonnell, M.D.; Lee, I. The quest for better clinical word vectors: Ontology based and lexical vector augmentation versus clinical contextual embeddings. Comput. Biol. Med. 2021, 134, 104433. [Google Scholar] [CrossRef] [PubMed]
- Gui, T.; Zou, Y.; Zhang, Q.; Peng, M.; Fu, J.; Wei, Z.; Huang, X.J. A lexicon-based graph neural network for Chinese NER. In Proceedings of the 2019 Conference on Empirical Methods in Natural Language Processing and the 9th International Joint Conference on Natural Language Processing (EMNLP-IJCNLP), Hong Kong, China, 3–7 November 2019; pp. 1040–1050. [Google Scholar]
- Li, Q.; Peng, H.; Li, J.; Xia, C.; Yang, R.; Sun, L.; Yu, P.S.; He, L. A Survey on Text Classification: From Traditional to Deep Learning. ACM Trans. Intell. Syst. Technol. (TIST) 2022, 13, 1–41. [Google Scholar] [CrossRef]
- Breiman, L.; Friedman, J.H.; Olshen, R.A.; Stone, C.J. Classification and Regression Trees; Chapman & Hall: New York, NY, USA, 1984; p. 358. [Google Scholar]
- Breiman, L. Bagging Predictors. Mach. Learn. 1996, 24, 123–140. [Google Scholar] [CrossRef]
- Breiman, L. Random Forests. Mach. Learn. 2001, 45, 5–32. [Google Scholar] [CrossRef]
- Schapire, R.E. The Strength of Weak Learnability. Mach. Learn. 1990, 5, 197–227. [Google Scholar] [CrossRef]
- Cortes, C.; Vapnik, V. Support-Vector Networks. Mach. Learn. 1995, 20, 273–297. [Google Scholar] [CrossRef]
- Jiang, T.; Wang, D.; Sun, L.; Yang, H.; Zhao, Z.; Zhuang, F. Lightxml: Transformer with dynamic negative sampling for high-performance extreme multi-label text classification. In Proceedings of the AAAI Conference on Artificial Intelligence, Virtual, 22 February–1 March 2021; Volume 35, pp. 7987–7994. [Google Scholar]
- Tezgider, M.; Yildiz, B.; Aydin, G. Text classification using improved bidirectional transformer. Concurr. Comput. Pract. Exp. 2022, 34, e6486. [Google Scholar] [CrossRef]
- Luan, Y.; Lin, S. Research on text classification based on CNN and LSTM. In Proceedings of the 2019 IEEE International Conference on Artificial Intelligence and Computer Applications (ICAICA), Dalian, China, 29–31 March 2019; pp. 352–355. [Google Scholar]
- Mangione, S.; Siino, M.; Garbo, G. Improving Irony and Stereotype Spreaders Detection using Data Augmentation and Convolutional Neural Network. In Proceedings of the CEUR Workshop Proc, Nancy, France, 12–15 September 2022; Volume 3180, pp. 2585–2593. [Google Scholar]
- Croce, D.; Garlisi, D.; Siino, M. An SVM Ensamble Approach to Detect Irony and Stereotype Spreaders on Twitter. In Proceedings of the CEUR Workshop Proc, Nancy, France, 12–15 September 2022; Volume 3180, pp. 2426–2432. [Google Scholar]
- Farha, I.A.; Oprea, S.V.; Wilson, S.; Magdy, W. Semeval-2022 task 6: Isarcasmeval, intended sarcasm detection in english and arabic. In Proceedings of the 16th International Workshop on Semantic Evaluation (SemEval-2022), Online, 14–15 July 2022; pp. 802–814. [Google Scholar]
- Godara, J.; Batra, I.; Aron, R.; Shabaz, M. Ensemble classification approach for sarcasm detection. Behav. Neurol. 2021, 2021, 9731519. [Google Scholar] [CrossRef]
- Buda, J.; Bolonyai, F. An Ensemble Model Using N-grams and Statistical Features to Identify Fake News Spreaders on Twitter. In CLEF (Working Notes); Eötvös Loránd University: Budapest, Hungary, 2020. [Google Scholar]
- Probierz, B.; Stefański, P.; Kozak, J. Rapid detection of fake news based on machine learning methods. Procedia Comput. Sci. 2021, 192, 2893–2902. [Google Scholar] [CrossRef]
- Verma, P.; Shukla, N.; Shukla, A. Techniques of sarcasm detection: A review. In Proceedings of the 2021 International Conference on Advance Computing and Innovative Technologies in Engineering (ICACITE), Greater Noida, India, 4–5 March 2021; pp. 968–972. [Google Scholar]
- Wang, M.; Adel, H.; Lange, L.; Strötgen, J.; Schütze, H. NLNDE at SemEval-2023 Task 12: Adaptive Pretraining and Source Language Selection for Low-Resource Multilingual Sentiment Analysis. arXiv 2023, arXiv:2305.00090. [Google Scholar]
- Nasir, J.A.; Khan, O.S.; Varlamis, I. Fake news detection: A hybrid CNN-RNN based deep learning approach. Int. J. Inf. Manag. Data Insights 2021, 1, 100007. [Google Scholar] [CrossRef]
Disclaimer/Publisher’s Note: The statements, opinions and data contained in all publications are solely those of the individual author(s) and contributor(s) and not of MDPI and/or the editor(s). MDPI and/or the editor(s) disclaim responsibility for any injury to people or property resulting from any ideas, methods, instructions or products referred to in the content. |
© 2023 by the authors. Licensee MDPI, Basel, Switzerland. This article is an open access article distributed under the terms and conditions of the Creative Commons Attribution (CC BY) license (https://creativecommons.org/licenses/by/4.0/).