
High-Performance Amorphous InGaSnO Thin-Film Transistor with ZrAlOx Gate Insulator by Spray Pyrolysis
by
 , and
, and
Yeoungjin Chang
1,2, 
Ravindra Naik Bukke
1,
Youngoo Kim
1,
Kiwan Ahn
1,
Jinbaek Bae
1 and
Jin Jang
1,* 1
Advanced Display Research Center, Department of Information Display, Kyung Hee University, Seoul 02447, Republic of Korea
2
Department of Semiconductor Display, Gachon University, Seongnam-si 13120, Republic of Korea
*
Author to whom correspondence should be addressed.
Electronics 2023, 12(3), 688; https://doi.org/10.3390/electronics12030688
Submission received: 28 December 2022
/
Revised: 18 January 2023
/
Accepted: 26 January 2023
/
Published: 30 January 2023
(This article belongs to the Special Issue Thin Film Transistors for Flexible Electronics)
Abstract
:Here, we report the high-performance amorphous gallium indium tin oxide (a-IGTO) thin-film transistor (TFT) with zirconium aluminum oxide (ZAO) gate insulator by spray pyrolysis. The Ga ratio in the IGTO precursor solution varied up to 20%. The spray pyrolyzed a-IGTO with a high-k ZAO gate insulator (GI) exhibits the field-effect mobility (μFE) of 16 cm2V−1s−1, threshold voltage (VTH) of −0.45 V subthreshold swing (SS) of 133 mV/dec., and ON/OFF current ratio of ~108. The optimal a-IGTO TFT shows excellent stability under positive-bias-temperature stress (PBTS) with a small ΔVTH shift of 0.35 V. The enhancements are due to the high film quality and fewer interfacial traps at the a-IGTO/ZAO interface. Therefore, the spray pyrolyzed a-IGTO TFT can be a promising candidate for flexible TFT in the next-generation display.
1. Introduction
Nowadays, there is increasing interest in amorphous metal oxide semiconductor (MOS) thin-film transistors (TFTs) to replace silicon-based TFTs [1,2,3,4,5]. Wide bandgap MOSs, such as zinc oxide (ZnO), amorphous indium gallium zinc oxide (a-IGZO), and amorphous indium tin zinc oxide (a-ITZO), are widely studied for high-performance TFT [1,2,3,4,5,6]. The metal oxide TFTs can be manufactured via vacuum [1] or solution process [7,8,9,10,11,12]. Spray coating and spin coating [2,7,8,12] are popular deposition methods in the solution process. Solution-processed oxide semiconductor shows a polycrystalline structure when the substrate temperature is high (≥200 °C) [2,6,9]. The grain boundary has a lot of defects in polycrystalline MOs [2,3,10,13].
To obtain highly stable, solution-processed multicomponent amorphous MOS TFTs, various MOS are studied by doping metal cations such as aluminum (Al), gallium (Ga), hafnium (Hf), lanthanum (La), magnesium (Mg), yttrium (Y), and zirconium (Zr) into ZnO, InOx, or IZO [2,10,14,15,16]. The mixing of two or more metal cations with different ionic radii and ionic charges is adequate to have an amorphous phase by suppressing crystallization [2,5,10]. The doping of a carrier suppressor can improve the electrical performance of MO TFTs [2,11,17,18,19,20,21,22,23]. Note that the doping of the metal cations with a lower standard electrode potential (SEP) can reduce the trap density due to their ability to form a strong bond with oxygen [2,10,19].
In this study, we introduced the high-performance amorphous indium-gallium-tin oxide (a-IGTO) TFT by spray pyrolysis. The Ga concentration was varied up to 20% in the InSnO precursor solution. The 10% Ga mixed a-IGTO TFT exhibits the field-effect mobility (μFE) of 16 cm2V−1s−1, threshold voltage (VTH) of −0.45 V, subthreshold swing (SS) of 133 mV/dec., and ON/OFF current (ION/IOFF) ratio of ~108. The a-IGTO TFT exhibits excellent stability under PBTS with a small threshold voltage shift (ΔVTH) of ~0.35 V at 5 V for 1 h. The improvements in the electrical properties of the a-IGTO TFT are due to the high quality of the film and smaller interfacial traps at the a-IGTO and zirconium aluminum oxide (ZAO) interface. Therefore, the spray pyrolyzed a-IGTO TFT with high-k ZAO can be a favorable candidate for high-performance, low-voltage MOS TFTs.
2. Materials and Methods
A 0.1 mole (M) IGTO precursor solution was synthesized by mixing indium nitrate hydrate (In(NO3)·xH2O), gallium nitrate hydrate (Ga(NO3)3.xH2O), and tin chloride hydrate (SnCl2.xH2O) into a 2-methoxyethanol. The molar ratio of indium to tin is 3:1(In:Sn). The molar ratio of indium:tin is kept at 3:1(In:Sn) for InGaSnO and the Ga ratio varies from 1% to 15%. For example, for 1%, 3%, 8%, 10%, and 15% Ga in IGTO, the molar ratios of In:Ga:Sn are 3:0.04:1, 3:0.12:1, 3:0.35:1, 3:0.44:1, and 3:0.70:1, respectively. The molar ratio of Zr:Al is 1:1(Zr:Al) for ZAO as reported elsewhere [4]. All precursor solutions were vigorously stirred to obtain a transparent/homogeneous solution. Finally, all the precursor solutions were filtered through a 0.45 μm polytetrafluoroethylene (PTFE) filter.
The ZAO gate insulator layer was deposited by spray pyrolysis on a glass substrate at the substrate temperature of 400 °C for 20 cycles in an air environment, and a detailed process flow for ZAO appears elsewhere. [4] The spray-pyrolyzed ZAO exhibits the surface RMS roughness of 0.32 nm, film density of 4.16 g cm−3, leakage current density of 2.26 × 10⁻⁶ Acm−2, breakdown electric field of 5.15 MVcm−1, and negligible frequency-dependent capacitance [4].
We fabricated a bottom gate, top contact a-IGTO TFTs. First, a 40 nm molybdenum (Mo) film was deposited by sputtering and patterned through wet etching to form the gate electrodes (Mask #1). After the deposition of the ZAO film, the sample was kept on a hotplate for 3 min. The IGTO solution was deposited at the substrate temperature of 350 °C by spray pyrolysis. An Alpha-Step D-500 Stylus Profiler was used to analyze the thickness of the IGTO films. The thickness of all the IGTO films is ~9.2 nm. The a-IGTO layer was patterned through wet etching to have an active island by conventional photolithography (Mask #2). Then, immediately, a ZAO layer was patterned through wet etching to form via contacts (Mask #3). Finally, a 40 nm thick IZO layer was deposited by sputter and patterned through wet etching for source/drain electrodes (Mask #4). The Agilent 2902C semiconductor device parameter analyzer was used to measure the I-V curves for the electrical properties of a-IGTO TFTs.
2.1. Results and Discussions
Figure 1a displays the fabrication process flow on a glass substrate and schematic representation for the cross-sectional view of an a-IGTO TFT as shown at the bottom of the figure. The channel width (W) and channel length (L) of the TFTs are 50 and 10 μm, respectively. Figure 1b shows the cross-sectional TEM image of spray pyrolyzed IGTO/ZAO stacked film, where a clear interface can be seen between IGTO (~10 nm) and ZAO (~40 nm). Figure 2 shows the XRD spectra of IGTO films, where the Ga ratio in the IGTO precursor solution varied from 1 to 15%. The XRD spectra of all the IGTO films show no crystalline peaks indicating an amorphous structure. The peak at 25° is related to glass. Ga has a low standard electrode potential (SEP) of −0.54 V, low electronegativity of 1.81, and high bonding energy with oxygen (354 kJ/mole), which leads to a good nominee as a structure transformer of ITO.
The optical bandgaps of IGTO films (Ga: 1 to 10%) are shown in Figure 3a. For UV-Vis measurement, the a-IGTO films were deposited on the glass (Corning eagle), where the glass absorption can be negligible [2,22,23,24]. The increase in bandgap with an increase in Ga ratio in IGTO from 3.62 (1% Ga) to 3.69 eV(10% Ga). The bandgap of IGTO is higher than that of ITO (3.19 eV) due to a higher bandgap of GaO (4.8 eV) [3,6,10]. The optical bandgap, Eg, was extracted using the relationship: αhν = A (hν − Eg)1/n, where α, hν, A, and n are the absorption coefficient, photon energy, a proportionality constant, and optical transition exponent in the absorption process, respectively. XPS valance band spectra of IGTO ((Ga: 0 to 15%)) films measured are shown in Figure 3b. The Fermi energy level (EF) shifts from 2.44 (1% Ga) to 2.27 eV (15% Ga) above the valence band edge, as shown in Figure 3b. To achieve the accurate Fermi-level position, the Ultra-violet photoelectron spectroscopic (UPS) experiment was conducted for the IGTO thin films with different Ga fractions. The work function (Φ) values for IGTO films with the different (1, 10, and 15%) Ga ratios are 4.49, 4.56, and 4.59 eV, respectively. With increasing Ga incorporation Fermi level shifts away from the conduction band (CB) as shown in Figure 3c. This indicates the shift of EF toward the valance band (VB) edge, as shown in Figure 3d. The energy difference between the Fermi energy level (EF) and the conduction band (CB) edge for IGTO is 1.18 eV (1% Ga) and 1.44 eV(15% Ga). Note that the general trend for the electron concentration in the oxide semiconductor decreases with an increase in Ga doping ratio in IGTO [12,13,14,25]. The surface morphology of spray pyrolyzed IGTO film can be seen in Figure 3e. The root means square roughness (RRMS) for 1, 3, 10, and 15% Ga-doped IGTO films are 2.31, 1.34, 0.74, and 0.81 nm, respectively. With the increase in the Ga ratio in the IGTO film, the surface roughness became smoother. The smooth surface morphology of the IGTO film could provide a good interface with the gate insulator. Therefore, these results confirm that an appropriate Ga ratio in IGTO film could enhance the electrical characteristics of IGTO TFT.
To elucidate the physical mechanism, we studied and compared O1s XPS spectra for the chemical bonding analysis of the a-IGTO films by varying Ga ratios as shown in Figure 4a–f. The O1s spectra are deconvoluted into three regions with the binding energies centered around ~529 eV (M-O-M), ~531 eV (Vo), and ~532 eV (−OH), respectively. The M-O m percentages in IGTO films with different Ga ratios (1, 3, 8, 10, and 15%) are 56.67, 61.16, 63.01, 69.22, and 61.86%, Vo ratios are 32.34, 28.42, 28.12, 23.59, and 28.11%, and the −OH ratios are 10.99, 10.42, 8.87, 7.19, and 10.03%, respectively. M-O m bonds, fewer oxygen-related defects (VO + OH) were obtained in Ga (10%) case compared to the others. The decrease in Vo is compensated by a higher M-O-M ratio [12]. The percentages of M-O, Vo, and -OH of O1s peak summarized in Figure 4f and Table S1.
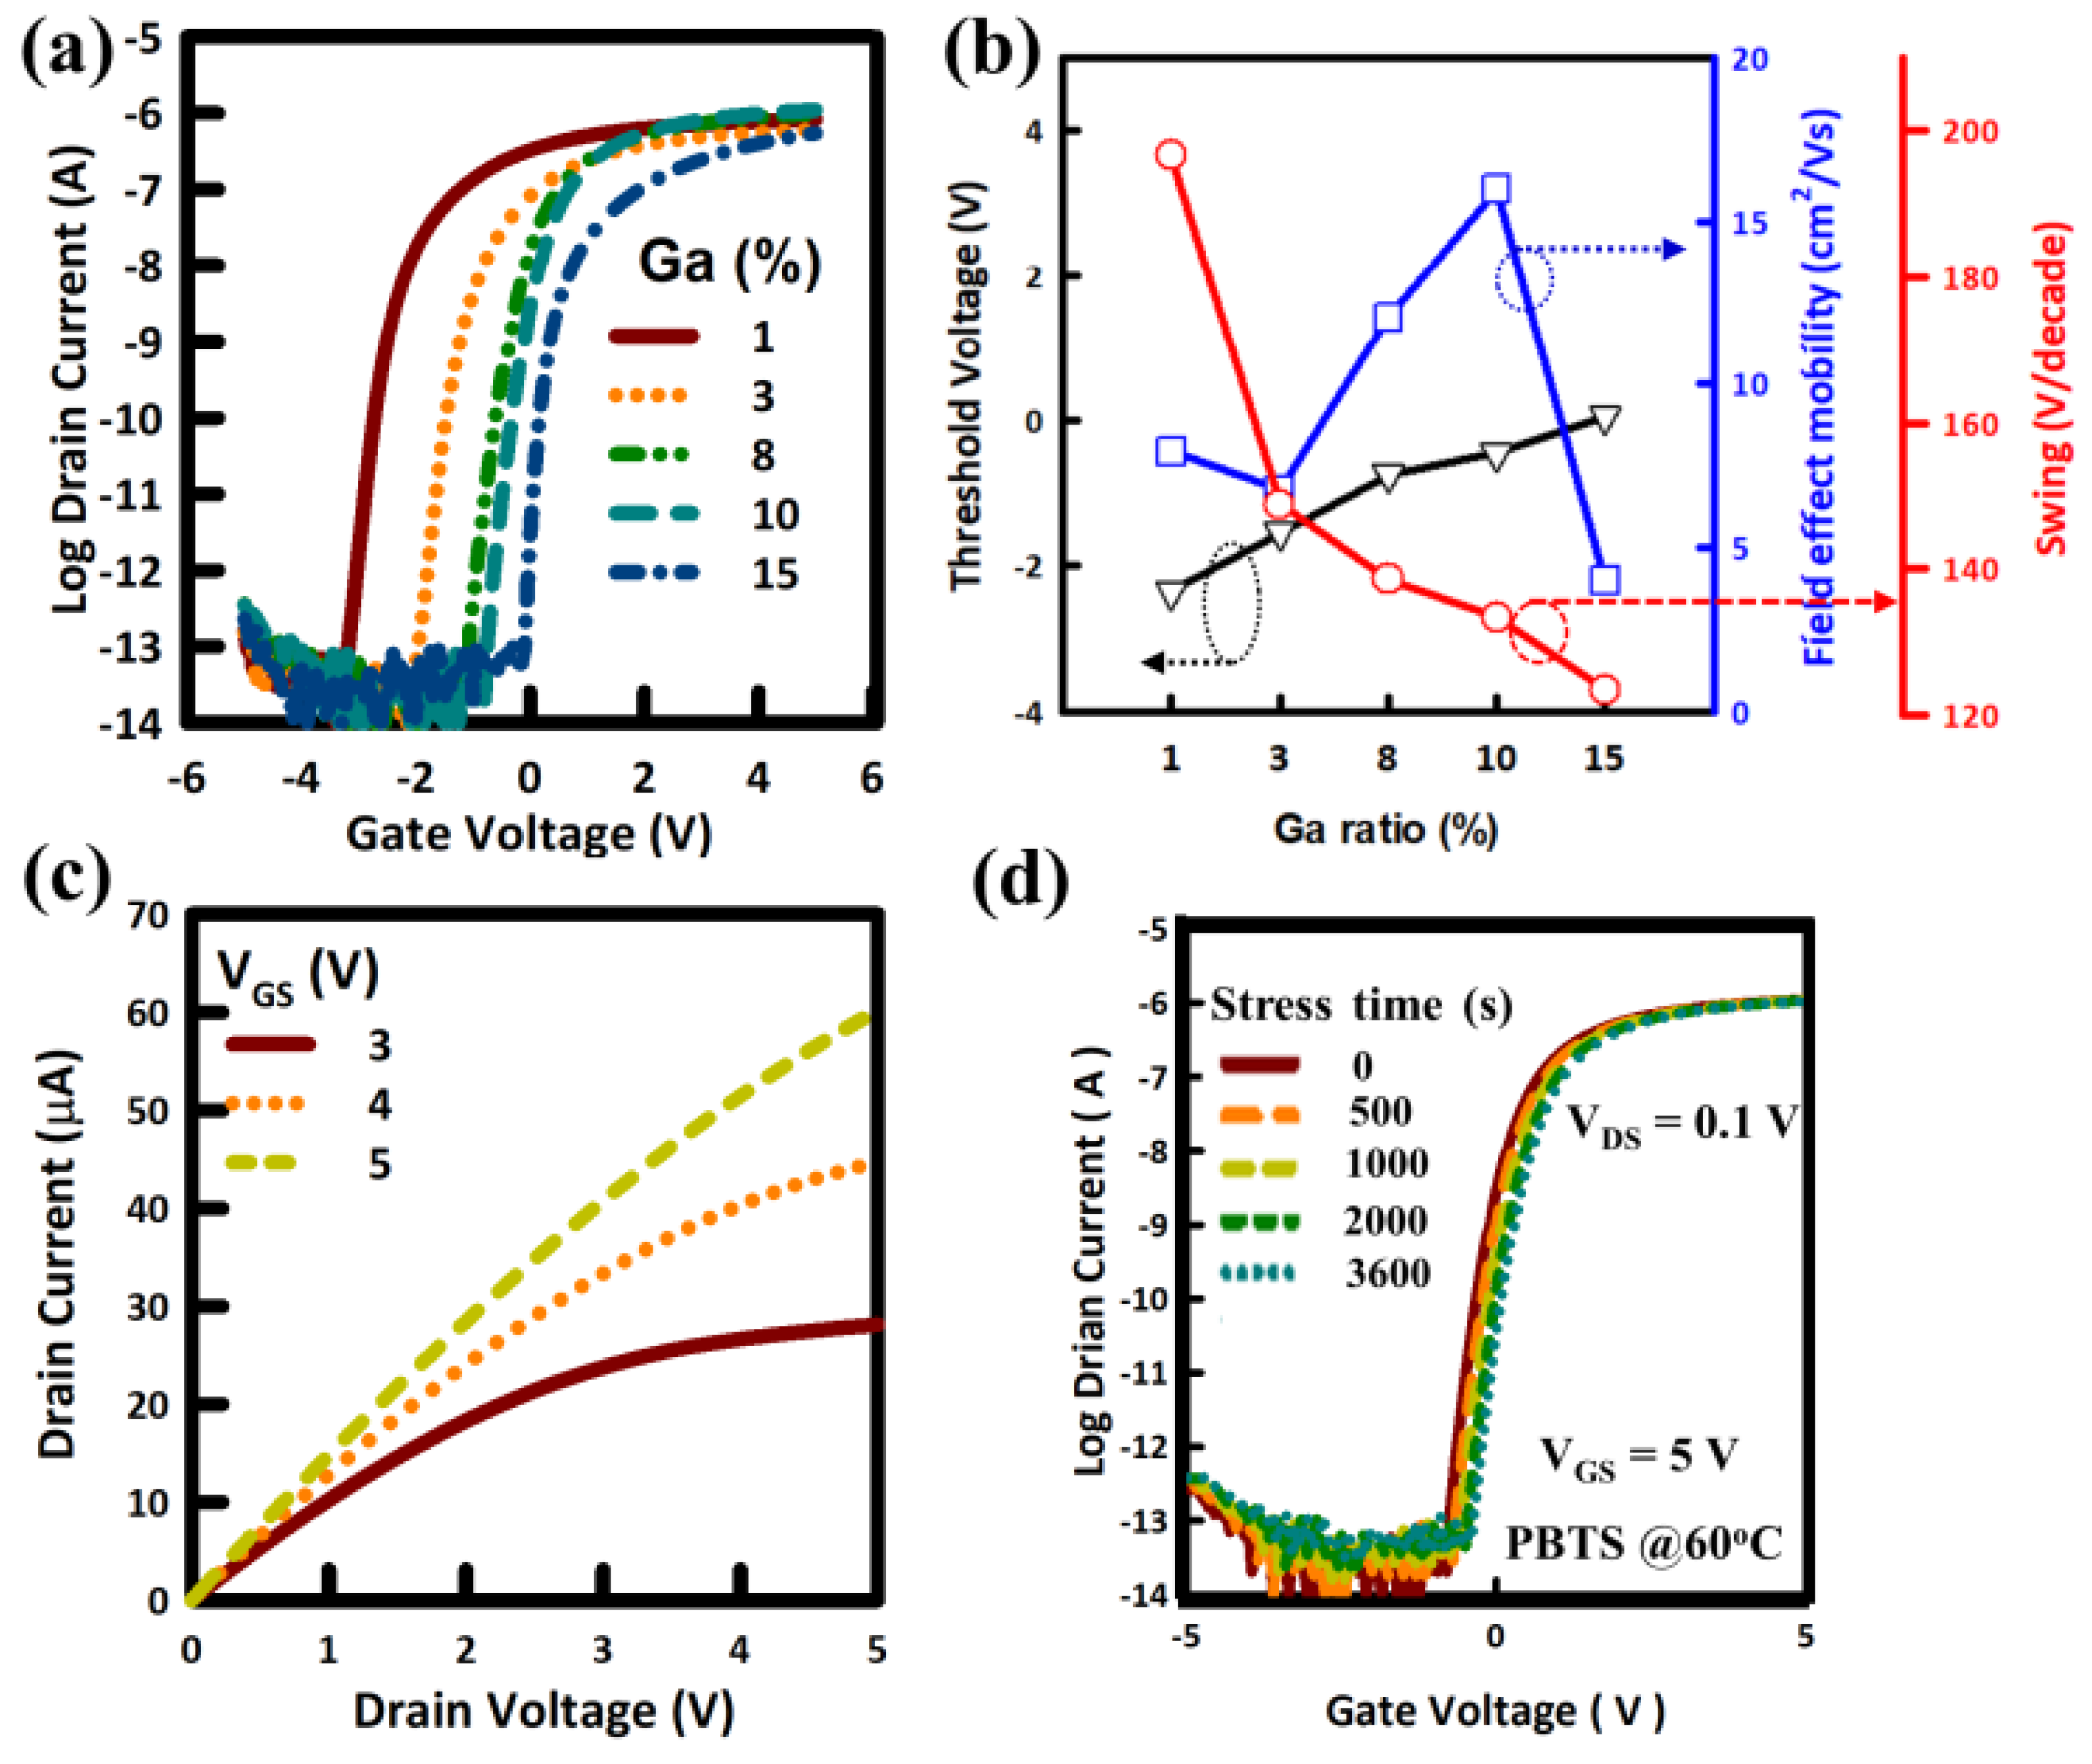
The charge transport properties in a-IGTO as a variation of the Ga ratio were studied by measuring the transfer curves of the a-IGTO TFTs. Figure 5a shows the transfer curves of IGTO TFTs with different Ga (1, 3, 8, 10, and 15%) ratios, and the corresponding electrical properties such as μFE (7.93, 6.76, 12.05, 16.0, and 4.0) cm2V−1s−1, VTH (−2.35, −1.55, −0.75, −0.45, and 0.0) V, and SS (196.6, 148.5, 138.2, 133, and 123) mV/dec can be seen in Figure 5b. The transconductance (gm, ΔID/ΔVG) of the IGTO TFTs with different Ga ratios (1, 3, 8, 10, and 15%) are (1.91, 1.75, 3.02, 3.77, and 3.08) 10−7S, respectively, as can be seen in Figure S1. The electronic configuration (4d105s0) of In3+ is similar to Sn4+, leading to a highly conductive nature with a very depletion mode of TFT characteristics [5]. In an amorphous metal oxide semiconductor, Ga acts as a good carrier killer owing to its higher binding energy of Ga-O (374 kJ/mole) and higher bandgap of GaOx (4.78 eV). In this work, we studied 1, 3, 8, 10, and 15% Ga doping in IGTO TFT performances. From the XPS analysis of IGTO film, upon the increase in the Ga ratio in IGTO, the M-O ratio increases and consequently, the oxygen-related defects (Vo and –OH) are reduced [25]. This change is favorable for forming a good interface with the underlayer (i.e., gate insulator). Higher M-O m bonds lead to an increase in the overlapping of the metal s orbital. Therefore, the increase in overlapping can also explain the higher mobility of the optimum Ga-doped IGTO TFT. The selection of an appropriate ratio of carrier suppressor is an important parameter to control the carrier concentration. However, an excess doping ratio can modify the material structure, which leads to deteriorating mobility. The optimum Ga doping concentration is found to be 10% from the TFT data, this is due to the 10% Ga doped IGTO film giving a good interface with the gate insulator. Due to fever traps at the interface between GI/semiconductor, the TFT exhibits lower SS and a higher ION, as shown in Figure 5b. Upon the Ga doping, the VTH shifts towards positive VGS due to gallium acting as a carrier killer since Ga+ has a higher binding energy with oxygen [2,10,13,14,15,26]. The decrease in the SS of IGTO TFT indicates the reduction in traps at the IGTO/ZAO interface. Figure 5c shows the output curves of IGTO TFT with a different VGS showing clear pinch-off and saturation behavior.
To test the electrical stability of the IGTO TFT, the PBTS (at VGS = 5 V for 1 h) on the TFT performances was investigated. The evaluation of the transfer curve of IGTO TFT under PBTS for 1 h, shows the threshold voltage shift (ΔVTH) of less than 0.4 V, as can be seen in Figure 5d. Small VTH shift indicates fewer electron traps at the interface between the gate dielectric and the semiconductor channel layers [5,10,13,14,16]. The interfacial trap density was calculated for the IGTO TFT at different stress times from 0 to 3600 s; negligible change in trap density obtained after 1 h of bias stress is shown in Figure 4d. Note the insignificant change in SS even after bias stress because of fewer trap states at the interface [2,3,10,11,12,13,24,25,26,27]. Comparison of the electrical properties of oxide TFTs using spray pyrolysis appears in the literature [17,18,19,20,21,26] (Table 1). The improvement in the electrical properties is due to its better interface quality with the GI because of fewer interfacial defects [25,26]. Therefore, it is concluded that the better electrical properties of IGTO TFTs can be achieved by optimizing the Ga ratio.
A higher M-O m ratio leads to an increase in the overlapping of the metal s orbitals [5,9,13,14,15,16]. The increase in overlapping can clarify the higher field-effect mobility and excellent bias stability of the a-IGTO TFT. The electrical properties of IGTO TFT exhibit relatively high mobility and superior stability under positive bias temperature stress (PBTS) at 60 °C, compared to the nanocrystalline ZnO and doped ZnO TFTs. Therefore, it is believed that the electrical properties of optimum IGTO TFTs can be achieved by altering the Ga ratio [25]. Hence, amorphous ZAO and IGTO are promising candidates for high-performance flexible TFT, and their application in the next-generation low-cost display industry.
2.2. Materials and Thin-Film Characterization
Transmittance and absorbance were measured by UV–visible spectroscopy (Scinco, S-4100). An alpha-step analyzer was used to measure the film’s thickness. The structural properties of IGTO films were measured by X-ray diffraction (XRD). Atomic force microscopy (AFM) for surface morphology. X-ray photoelectron spectroscopy (XPS) measurement was carried out to examine the elemental and chemical composition in IGTO films using PHI 5000 Versa Probe (PHI 5000 Versa Probe, Ulvac-PHI) at a basic pressure of 7.5 × 10⁻⁵ mTorr.
Electrical characterization of IGTO TFTs was performed by Agilent 4156C semiconductor parameter analyzer at room temperature in dark. The output curve was measured at the VGS of 5 V with a step of 1 V by sweeping the VDS from 0 to +5 V. The field-effect mobility in the saturation region (VDS ≥ VGS–VTH) was obtained by using Equation (1):
Here, the threshold voltage (VTH) and saturation mobility were determined from the x-axis intercept and linear part of the (IDS)1/2 vs VGS plot by linear extrapolation method. The subthreshold swing (SS) was obtained from the linear region of the log (IDS) versus VGS fit by using the equation:
Here, interfacial trap density (Nit) was obtained from the following Equation (3):
where IDS, μsat, W/L, Cox, VTH, and VGS are the drain current, saturation mobility, channel width/length, capacitance of the gate oxide, threshold voltage, and gate voltage, respectively.
3. Conclusions
In summary, we report the high performance of a-IGTO TFT by spray pyrolysis. The optimal Ga ratio is found to be 10% in the a-IGTO precursor. The spray pyrolyzed a-IGTO and ZAO layers were integrated with TFT as channel and gate insulator layers, respectively. The TFT with 10% Ga exhibits the μFE of 16 cm2V−1 s−1, SS of 133 mV/dec., VTH of −0.45 V, and ION/IOFF of ~108. The improvement is due to the high film quality with fewer trap states at the interface between a-IGTO and ZAO. Hence, the solution-processed a-IGTO is a promising candidate for the high performance of amorphous metal-oxide TFT.
Supplementary Materials
The following supporting information can be downloaded at: https://www.mdpi.com/article/10.3390/electronics12030688/s1.
Author Contributions
Conceptualization, Y.C., R.N.B. and J.J.; methodology, Y.C. and R.N.B.; formal analysis, Y.C. and R.N.B.; investigation, Y.C. and R.N.B.; resources, R.N.B. and J.J.; data curation, Y.C., R.N.B., Y.K., K.A., J.B. and J.J.; writing—original draft preparation, Y.C. and R.N.B.; writing—review and editing, R.N.B. and J.J.; supervision, J.J.; funding acquisition, J.J. All authors have read and agreed to the published version of the manuscript.
Funding
This work was supported by the Industrial Strategic Technology Development Program (20010082) funded By the MOTIE, Korea.
Data Availability Statement
Not Applicable.
Conflicts of Interest
The authors declare no conflict of interest.
References
- Zhang, L.; Li, J.; Zhang, X.W.; Jiang, X.Y.; Zhang, Z.L. High Performance ZnO-Thin-Film Transistor with Ta2O5 Dielectrics Fabricated at Room Temperature. Appl. Phys. Lett. 2009, 95, 23–26. [Google Scholar] [CrossRef]
- Bukke, R.N.; Saha, J.K.; Mude, N.N.; Kim, Y.; Lee, S.; Jang, J. Lanthanum Doping in Zinc Oxide for Highly Reliable Thin-Film Transistors on Flexible Substrates by Spray Pyrolysis. ACS Appl. Mater. Interfaces 2020, 12, 35164–35174. [Google Scholar] [CrossRef]
- Jeong, H.-J.; Ok, K.-C.; Park, J.; Lim, J.; Cho, J.; Park, J.-S. Stability Improvement of In-Sn-Ga-O Thin-Film Transistors at Low Annealing Temperatures. IEEE Electron Device Lett. 2015, 36, 1160–1162. [Google Scholar] [CrossRef]
- Fan, W.-T.; Liu, P.-T.; Kuo, P.-Y.; Chang, C.-M.; Liu, I.-H.; Kuo, Y. Numerical Analysis of Oxygen-Related Defects in Amorphous In-W-O Nanosheet Thin-Film Transistor. Nanomaterials 2021, 11, 3070. [Google Scholar] [CrossRef] [PubMed]
- Hernández-Gutiérrez, C.A.; Avila-Avendano, C.; Solis-Cisneros, H.I.; Conde, J.; Sevilla-Camacho, P.Y.; Quevedo-López, M.A. Modeling and SPICE Simulation of the CdS/CdTe Neutron Detectors Integrated with Si-Poly TFTs Amplifiers. IEEE Trans. Nucl. Sci. 2022, 69, 1310–1315. [Google Scholar] [CrossRef]
- Shin, S.W.; Cho, J.E.; Lee, H.-M.; Park, J.-S.; Kang, S.J. Photoresponses of InSnGaO and InGaZnO thin-film transistors. RSC Adv. 2016, 6, 83529–83533. [Google Scholar] [CrossRef]
- Liu, Y.; Liu, C.; Qin, H.; Peng, C.; Lu, M.; Chen, Z.; Zhao, Y. Steep Subthreshold Swing and Enhanced Illumination Stability InGaZnO Thin-Film Transistor by Plasma Oxidation on Silicon Nitride Gate Dielectric. Membranes 2021, 11, 902. [Google Scholar] [CrossRef]
- Bukke, R.N.; Avis, C.; Naik, M.N.; Jang, J. Remarkable Increase in Field Effect Mobility of Amorphous IZTO Thin-Film Tran-sistors with Purified ZrOx Gate Insulator. IEEE Electron Device Lett. 2018, 39, 371–374. [Google Scholar] [CrossRef]
- Yeom, H.-I.; Ko, J.B.; Mun, G.; Park, S.-H.K. High mobility polycrystalline indium oxide thin-film transistors by means of plasma-enhanced atomic layer deposition. J. Mater. Chem. C 2016, 4, 6873–6880. [Google Scholar] [CrossRef] [Green Version]
- Lee, J.; Kim, D.; Lee, S.; Cho, J.; Park, H.; Jang, J. High Field Effect Mobility, Amorphous In-Ga-Sn-O Thin-Film Transistor with No Effect of Negative Bias Illumination Stress. IEEE Electron Device Lett. 2019, 40, 1443–1446. [Google Scholar] [CrossRef]
- Parthiban, S.; Kwon, J.Y. Role of Dopants as a Carrier Suppressor and Strong Oxygen Binder in Amorphous Indi-um-Oxide-Based Field Effect Transistor. J. Mater. Res. 2014, 29, 1585–1596. [Google Scholar] [CrossRef] [Green Version]
- Bukke, R.N.; Mude, N.N.; Islam, M.; Jang, J. Improvement of metal-oxide films by post atmospheric Ar/O2 plasma treatment for thin film transistors with high mobility and excellent stability. Appl. Surf. Sci. 2021, 568, 150947. [Google Scholar] [CrossRef]
- Kim, H.-A.; Kim, J.O.; Hur, J.S.; Son, K.-S.; Lim, J.H.; Cho, J.; Jeong, J.K. Achieving High Mobility in IGTO Thin-Film Transistors at a Low Temperature via Film Densification. IEEE Trans. Electron Devices 2018, 65, 4854–4860. [Google Scholar] [CrossRef]
- Mude, N.N.; Bukke, R.N.; Saha, J.K.; Avis, C.; Jang, J. Highly Stable, Solution-Processed Ga-Doped IZTO Thin Film Transistor by Ar/O2 Plasma Treatment. Adv. Electron. Mater. 2019, 5, 1–9. [Google Scholar] [CrossRef]
- Han, Y.-J.; Lee, S.H.; Bak, S.-Y.; Han, T.-H.; Kim, S.; Yi, M. Performance Improvement of ZnSnO Thin-Film Transistors with Low-Temperature Self-Combustion Reaction. Electronics 2021, 10, 1099. [Google Scholar] [CrossRef]
- Kim, H.; Maeng, S.; Lee, S.; Kim, J. Improved Performance and Operational Stability of Solution-Processed InGaSnO (IGTO) Thin Film Transistors by the Formation of Sn–O Complexes. ACS Appl. Electron. Mater. 2021, 3, 1199–1210. [Google Scholar] [CrossRef]
- Chen, S.; Li, Y.; Lin, Y.; He, P.; Long, T.; Deng, C.; Chen, Z.; Chen, G.; Tao, H.; Lan, L.; et al. Inkjet-Printed Top-Gate Thin-Film Transistors Based on InGaSnO Semiconductor Layer with Improved Etching Resistance. Coatings 2020, 10, 425. [Google Scholar] [CrossRef]
- Li, J.; Huang, C.X.; Zhao, C.Y.; Zhong, D.Y.; Zhang, J.H.; Li, X.F. Feasibility of Atomic Layer Deposited AlZrOx Film to Achieve High Performance and Good Stability of ZnSnO-TFT. IEEE Trans. Electron Devices 2017, 64, 4959–4964. [Google Scholar] [CrossRef]
- Zhu, L.; He, G.; Zhang, C.; Yang, B.; Xia, Y.; Alam, F.; Zhang, Y. Water-Derived All-Oxide Thin-Film Transistors with ZrAlOx Gate Dielectrics and Exploration in Digital Circuits. IEEE Trans. Electron Devices 2019, 66, 4198–4204. [Google Scholar] [CrossRef]
- Liu, W.-S.; Hsu, C.-H.; Jiang, Y.; Lai, Y.-C.; Kuo, H.-C. Improving Device Characteristics of Dual-Gate IGZO Thin-Film Transistors with Ar–O2 Mixed Plasma Treatment and Rapid Thermal Annealing. Membranes 2022, 12, 49. [Google Scholar] [CrossRef]
- Girtan, M.; Hrostea, L.; Boclinca, M.; Negulescu, B. Study of oxide/metal/oxide thin films for transparent electronics and solar cells applications by spectroscopic ellipsometry. AIMS Mater. Sci. 2017, 4, 594–613. [Google Scholar] [CrossRef]
- Saha, J.K.; Bukke, R.N.; Jang, J. Extremely Stable, High Performance Gd and Li Alloyed ZnO Thin Film Transistor by Spray Pyrolysis. Adv. Electron. Mater. 2020, 6, 1–11. [Google Scholar] [CrossRef]
- Bukke, R.N.; Jang, J. Gel-based precursors for the high-performance of n-channel GaInSnZnO and p-channel CuGaSnSO thin-film transistors. RSC Adv. 2021, 11, 34392–34401. [Google Scholar] [CrossRef] [PubMed]
- Bahubalindruni, P.G.; Martins, J.; Santa, A.; Tavares, V.; Martins, R.; Fortunato, E.; Barquinha, P. High-Gain Transimpedance Amplifier for Flexible Radiation Dosimetry Using InGaZnO TFTs. IEEE J. Electron Devices Soc. 2018, 6, 760–765. [Google Scholar] [CrossRef]
- Kim, D.H.; Cha, H.S.; Jeong, H.S.; Hwang, S.H.; Kwon, H.I. Effects of Active Layer Thickness on the Electrical Characteristics and Stability of High-Mobility Amorphous Indium–Gallium–Tin Oxide Thin-Film Transistors. Electronics 2021, 10, 1295. [Google Scholar] [CrossRef]
- Bukke, R.N.; Mude, N.N.; Bae, J.; Jang, J. Nano-Scale Ga O Interface Engineering for High-Performance of ZnO-Based Thin-Film Transistors. ACS Appl. Mater. Interfaces 2022, 14, 41508–41519. [Google Scholar] [CrossRef]
- Hernández-Gutiérrez, C.A.; Kudriavtsev, Y.; Cardona, D.; Hernández, A.G.; Camas-Anzueto, J.L. Optical, electrical, and chemical characterization of nanostructured InxGa1-xN formed by high fluence In+ ion implantation into GaN. Opt. Mater. 2021, 111, 110541. [Google Scholar] [CrossRef]
Figure 1.
(a) Fabrication process flow of IGTO TFT on a glass substrate and schematic representation of the cross-sectional view of IGTO TFT. (b) Cross-sectional transmission electron microscopy (TEM) image of spray pyrolyzed IGTO/ZAO stacked film.
Figure 1.
(a) Fabrication process flow of IGTO TFT on a glass substrate and schematic representation of the cross-sectional view of IGTO TFT. (b) Cross-sectional transmission electron microscopy (TEM) image of spray pyrolyzed IGTO/ZAO stacked film.
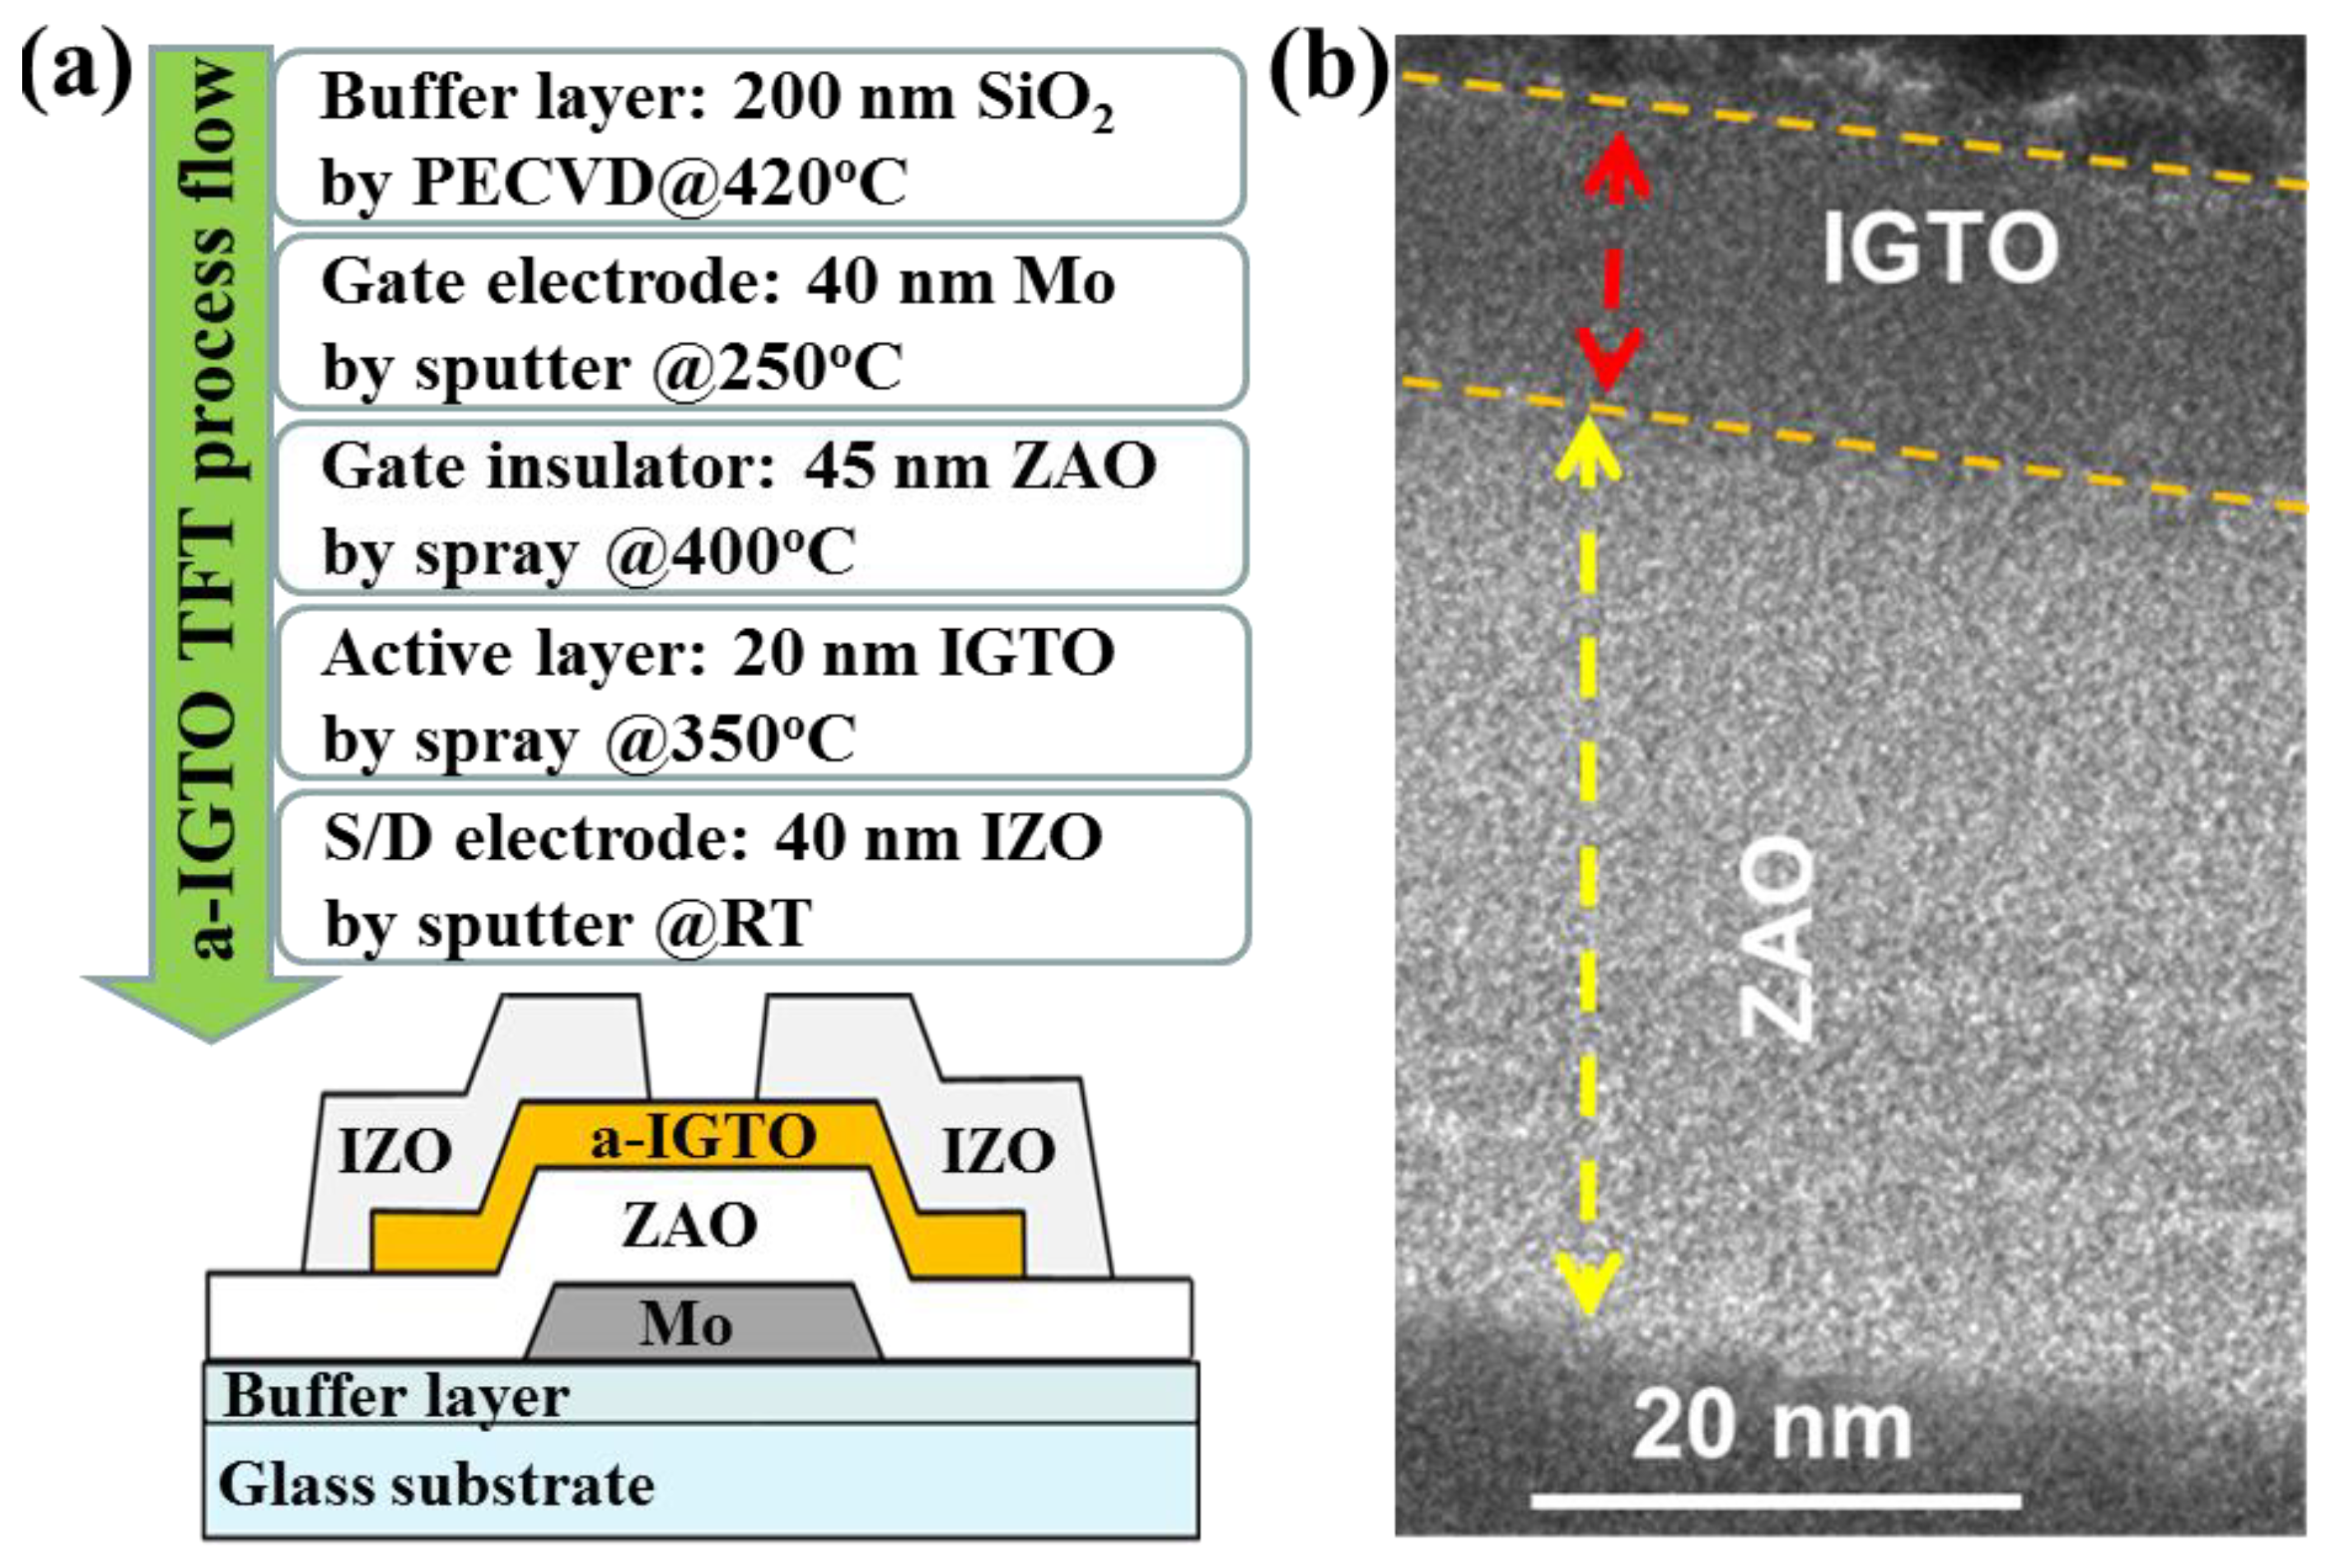
Figure 2.
XRD spectra of the IGTO films deposited at a substrate temperature of 350 °C by spray pyrolysis, where Ga concentration varied from 1 to 20%. The peak at 25° is related to glass.
Figure 2.
XRD spectra of the IGTO films deposited at a substrate temperature of 350 °C by spray pyrolysis, where Ga concentration varied from 1 to 20%. The peak at 25° is related to glass.
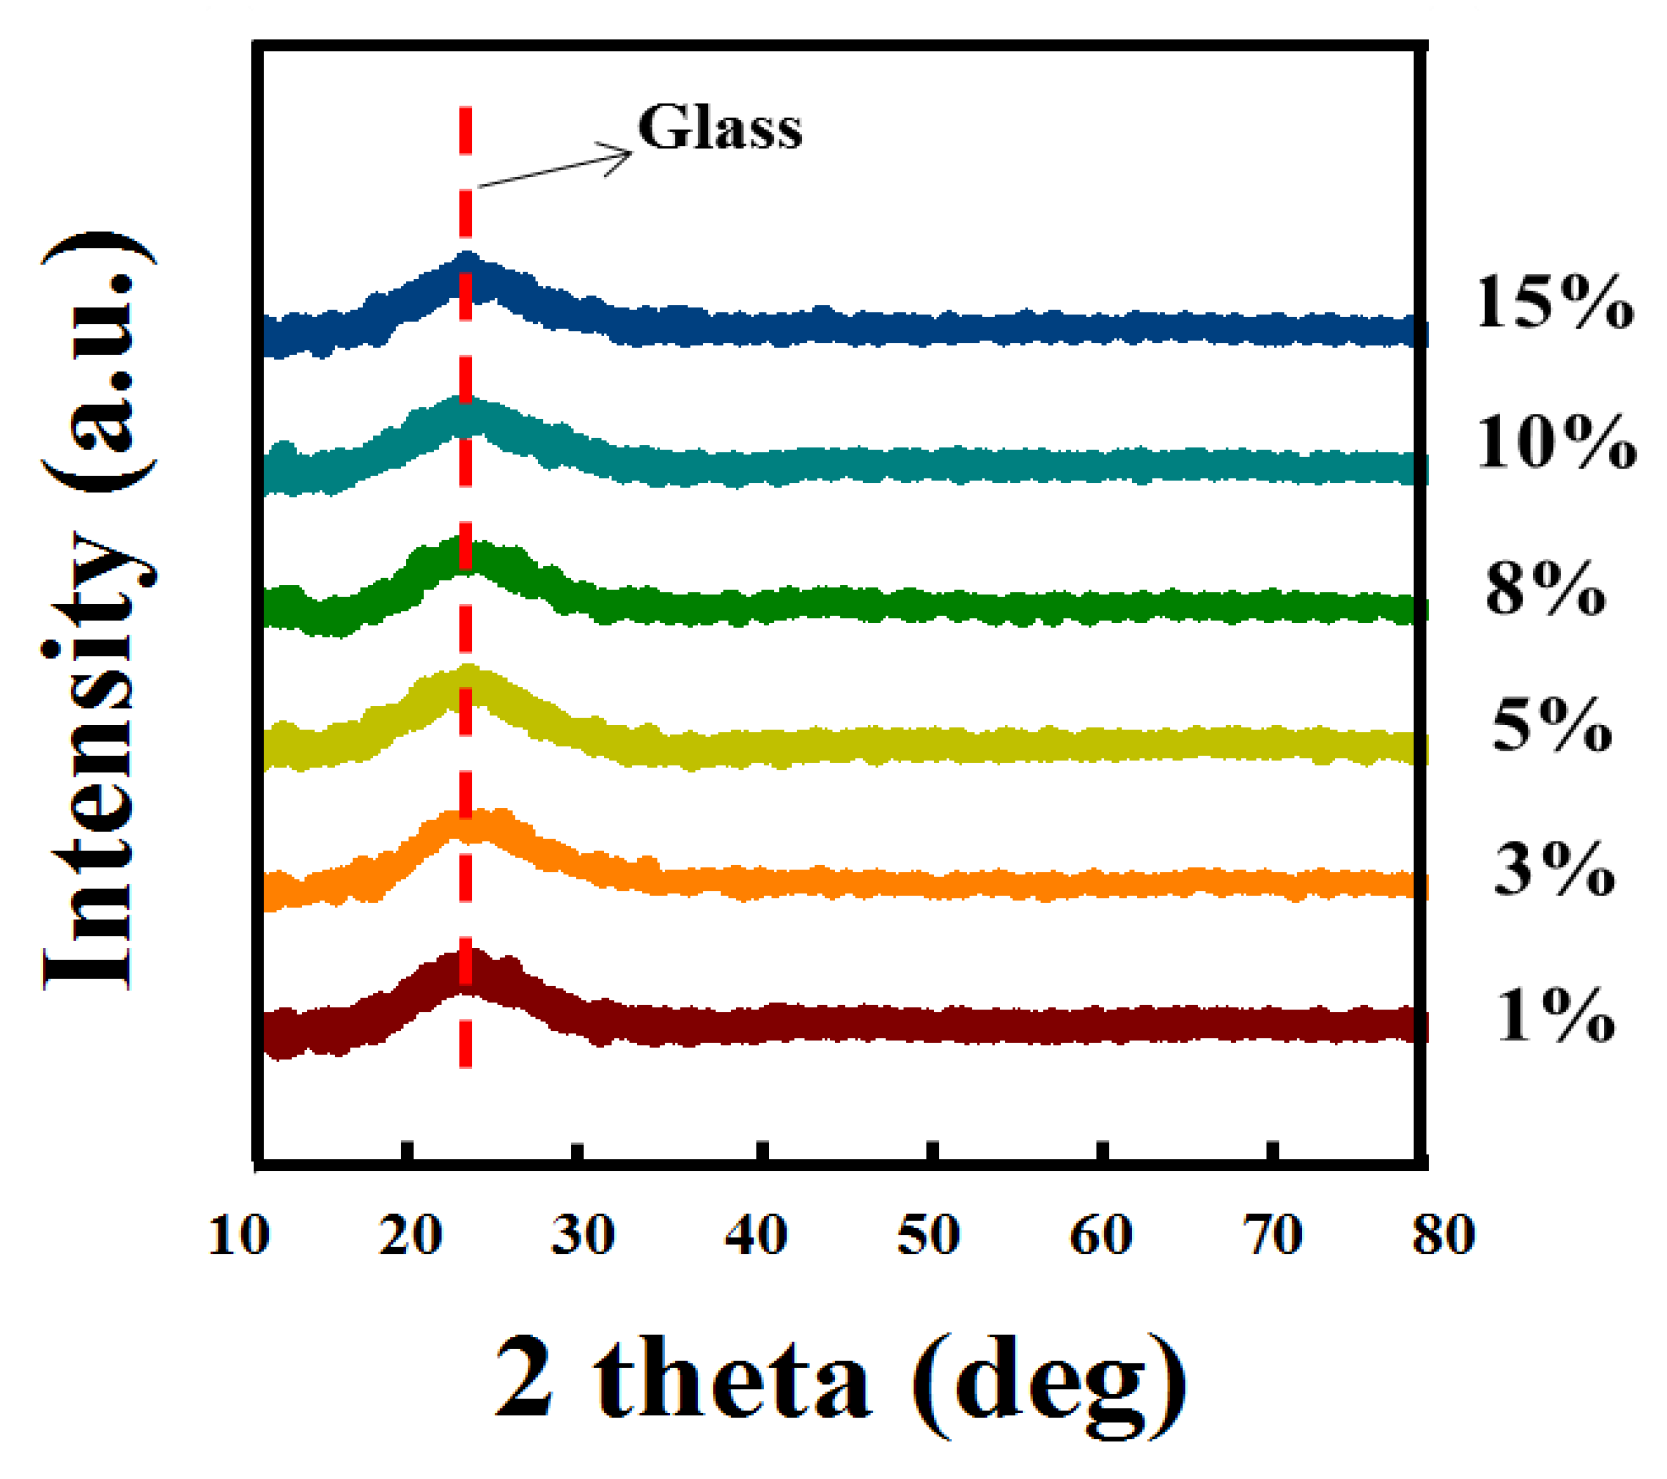
Figure 3.
(a) Tauc plot and (b) XPS valance band edge (VBEdge) spectra of the IGTO films with different Ga (from 1 to 15%) ratios. (c) Ultra-violet photoelectron spectroscopic (UPS) spectra of the IGTO films with different Ga (1, 10, and 15%) ratios. (d) Energy level diagram of the IGTO films with the different Ga (from 1 to 15%) ratio. The Fermi energy level (EF) decreases with increasing Ga ratio. (e) AFM images (scan size 5 μm × 5 μm) of 1, 3, 10, and 15% Ga-doped IGTO thin films.
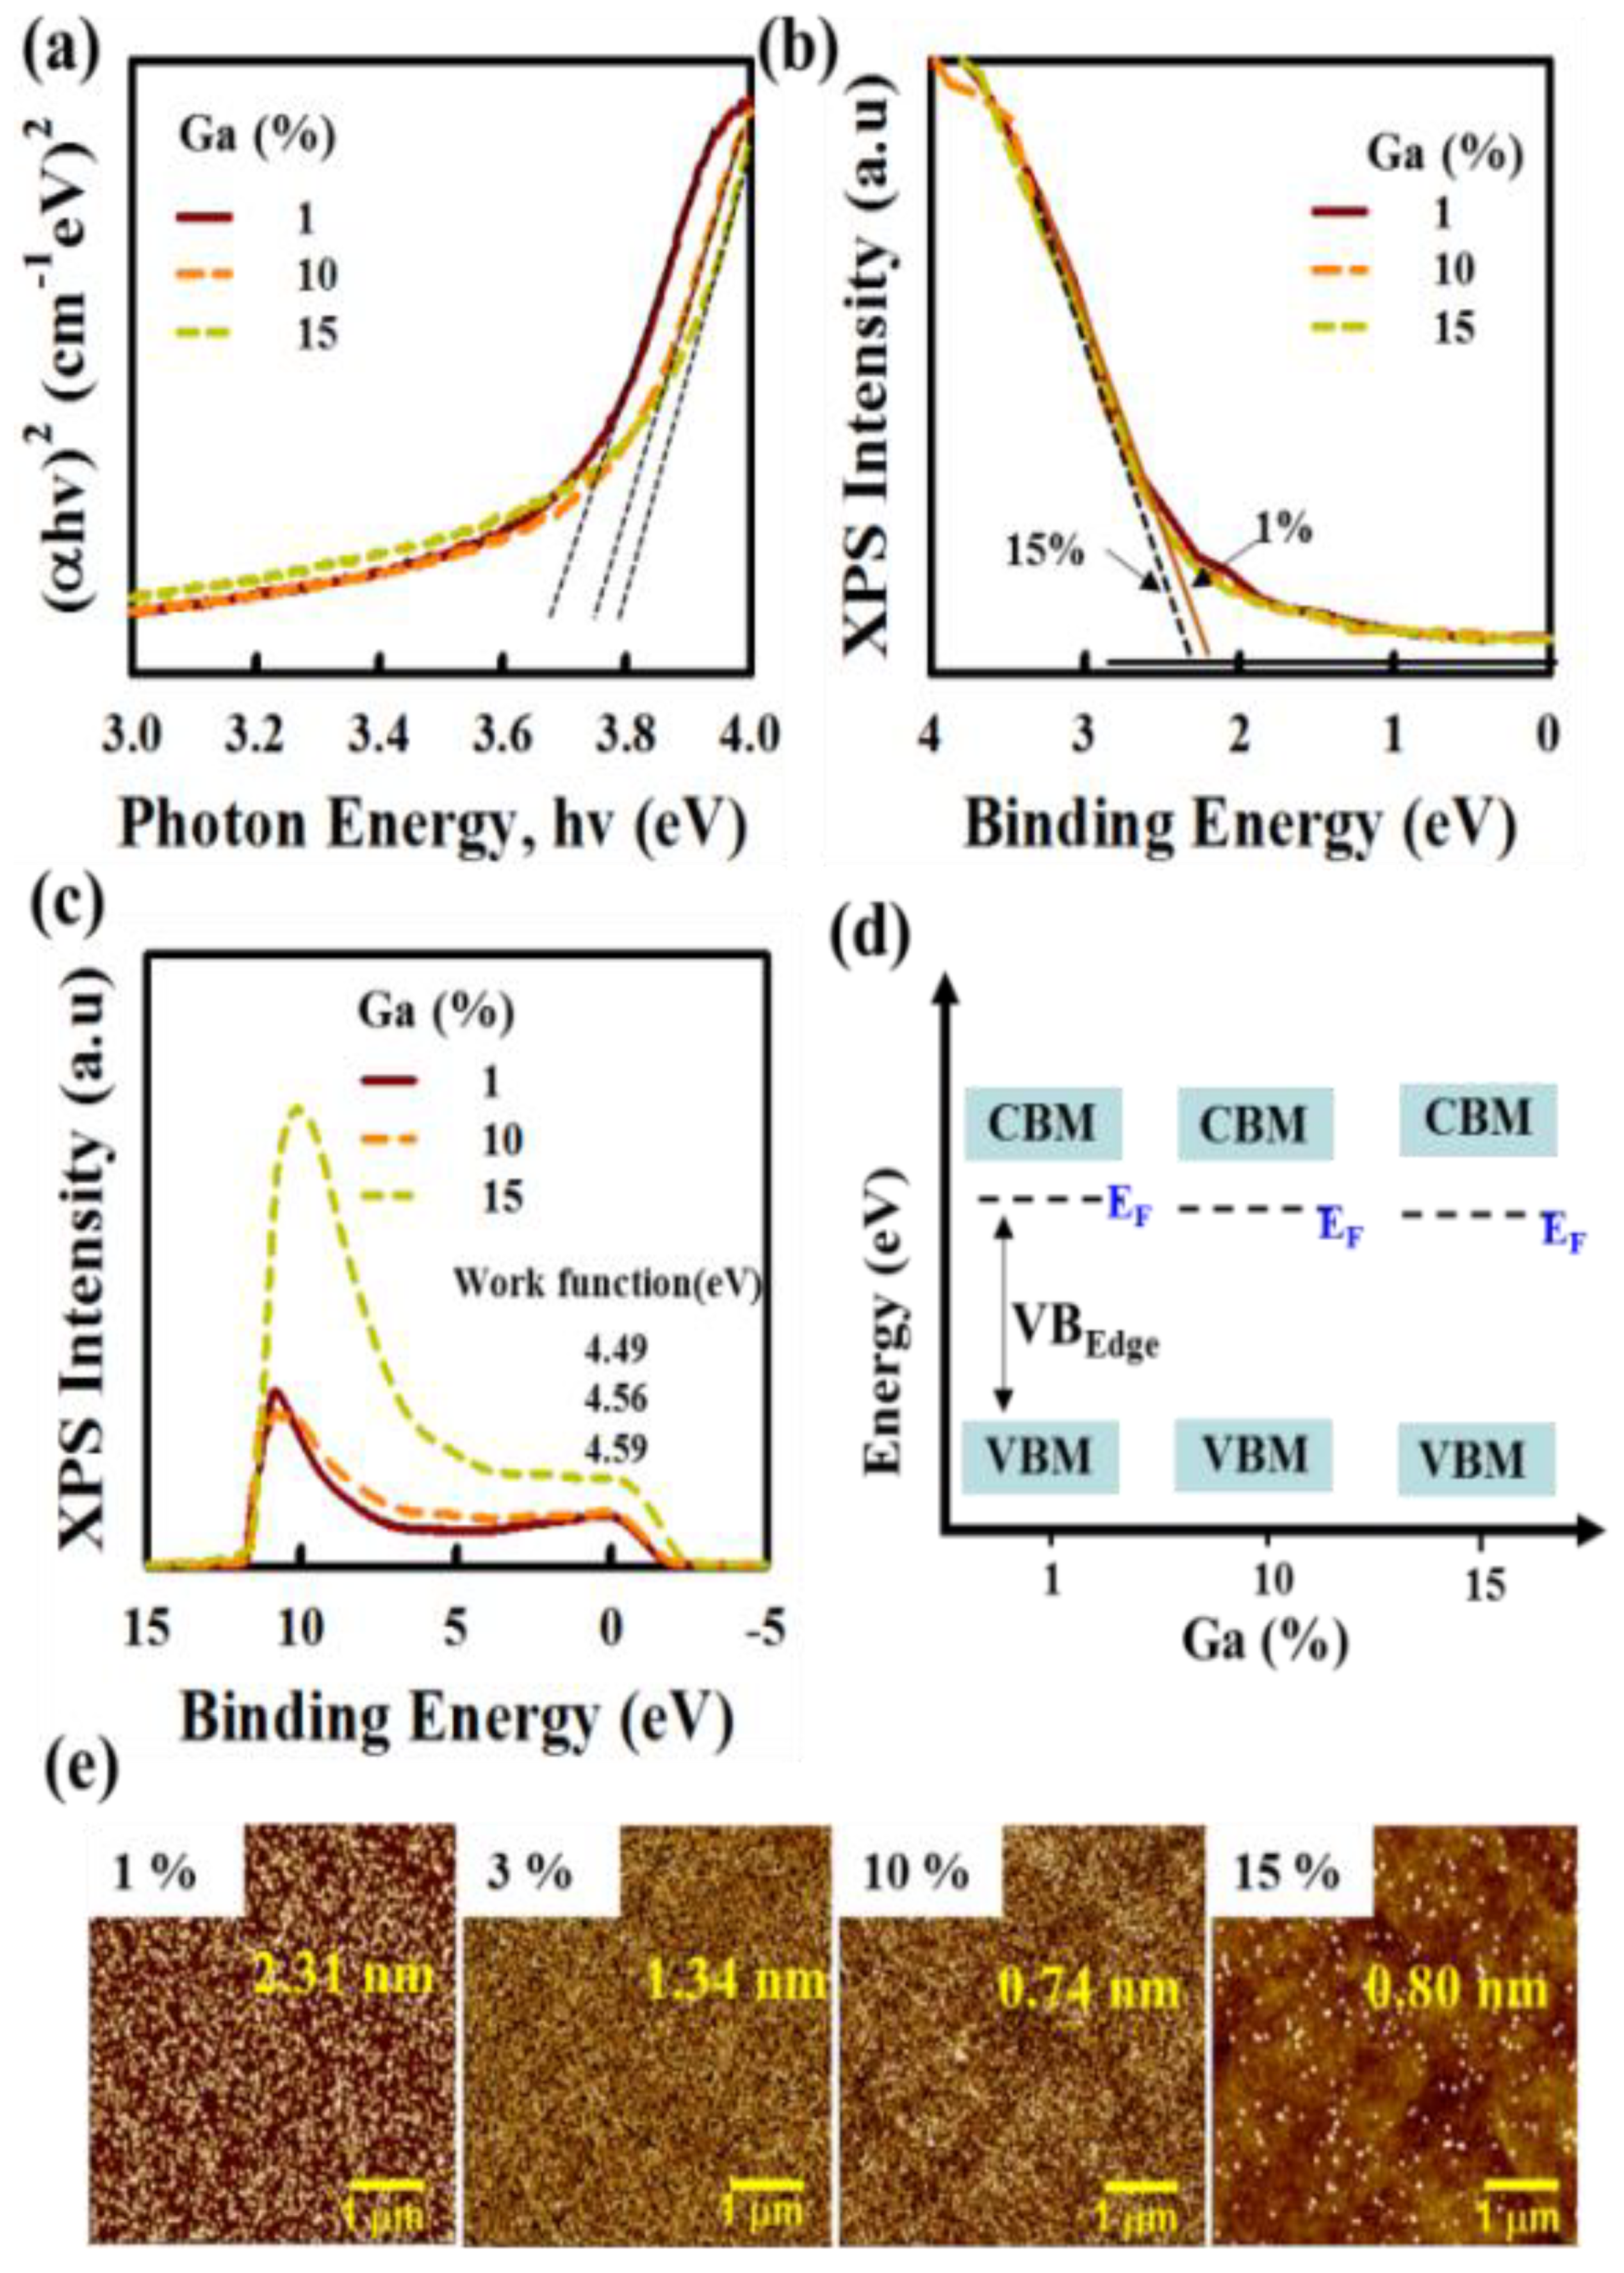
Figure 4.
(a–e) Deconvoluted O1s binding energy spectra for spray pyrolyzed IGTO film deposited at a substrate temperature of 350 °C, where Ga ratio varied from 1 to 15%. (f) The atomic ratios of M-O, Vo, and -OH in IGTO films. The M-O bond ratio increases by Ga concentration until 10%.
Figure 4.
(a–e) Deconvoluted O1s binding energy spectra for spray pyrolyzed IGTO film deposited at a substrate temperature of 350 °C, where Ga ratio varied from 1 to 15%. (f) The atomic ratios of M-O, Vo, and -OH in IGTO films. The M-O bond ratio increases by Ga concentration until 10%.
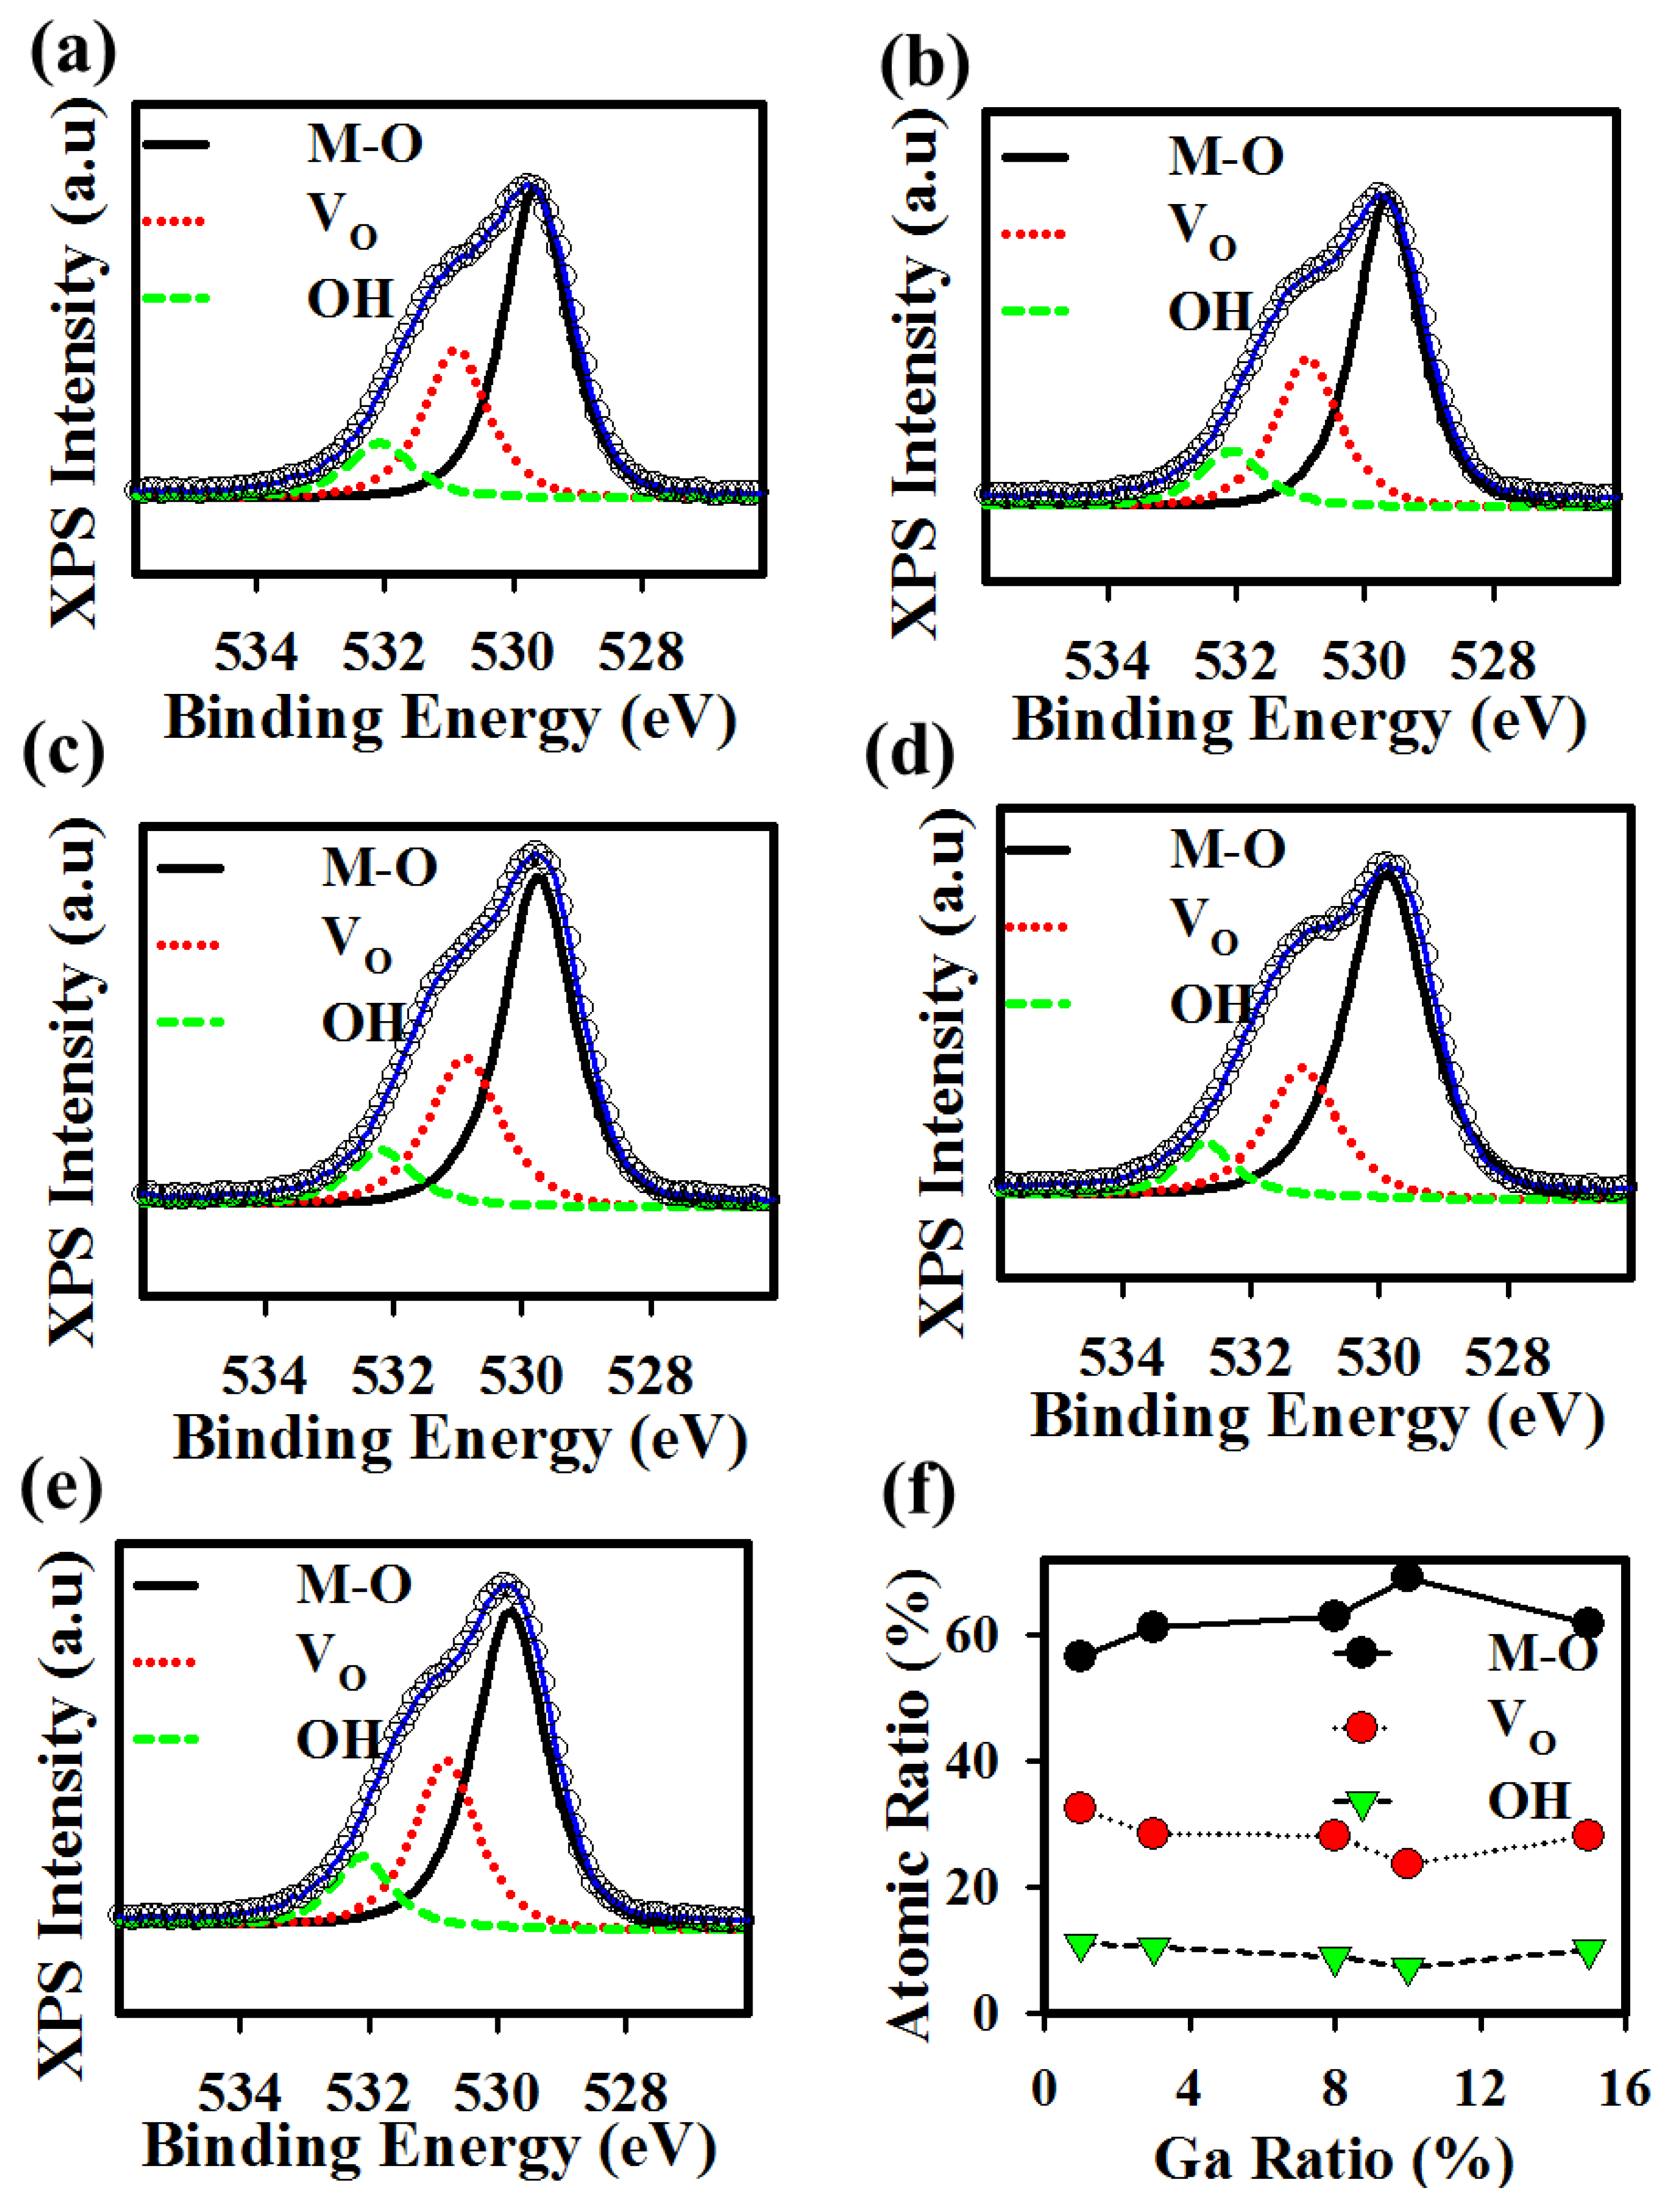
Figure 5.
(a) Comparison of the transfer curves for IGTO TFTs, where Ga ratio varied from 1 to 15%. (b) Summary of the electrical parameters (VTH, μFE, and SS) of IGTO TFTs with different Ga ratios. (c) Output curves of the 10% Ga doped IGTO TFTs. (d) The transfer curves under PBTS of the 10% Ga doped IGTO TFTs at a VDS = 0.1 V for 1 h at 60 °C.

Table 1.
Comparison of the electrical properties of oxide TFTs fabricated by spray pyrolysis reported in the literature.
Table 1.
Comparison of the electrical properties of oxide TFTs fabricated by spray pyrolysis reported in the literature.
| Active/GI | TFT W/L [μm] | Mobility [cm2 V−1 s−1] | SS [mV dec−1] | Stability (ΔVTH, [V]) | Ref. |
|---|---|---|---|---|---|
| (a)IGTO/(a)AlOx | 200/10 | 3.00 | 210 | PBS (0.90) | [17] |
| (b)IGTO/(c)SiO2 | 1000/50 | 2.13 | 2440 | PBS (2.10) | [18] |
| (d)ZTO/(e)ZAO | 1000/100 | 12.50 | 150 | PBS (2.90) | [19] |
| (b)In2O3/(b)ZAO | 1000/100 | 10.14 | 100 | PBS (0.47) | [20] |
| (f)ZnO/(b)ZrOx | 50/10 | 12.76 | 260 | PBS (0.0) | [21] |
| (f)IGTO/(f)ZAO | 50/10 | 16.00 | 133 | PBTS (0.40) | This Work |
(a) Ink-jet Printing; (b) Spin Coating; (c) Thermal Growth; (d) Sputtering; (e) ALD; (f) Spray Pyrolysis.
Disclaimer/Publisher’s Note: The statements, opinions and data contained in all publications are solely those of the individual author(s) and contributor(s) and not of MDPI and/or the editor(s). MDPI and/or the editor(s) disclaim responsibility for any injury to people or property resulting from any ideas, methods, instructions or products referred to in the content. |
© 2023 by the authors. Licensee MDPI, Basel, Switzerland. This article is an open access article distributed under the terms and conditions of the Creative Commons Attribution (CC BY) license (https://creativecommons.org/licenses/by/4.0/).
Share and Cite
MDPI and ACS Style
Chang, Y.; Bukke, R.N.; Kim, Y.; Ahn, K.; Bae, J.; Jang, J. High-Performance Amorphous InGaSnO Thin-Film Transistor with ZrAlOx Gate Insulator by Spray Pyrolysis. Electronics 2023, 12, 688. https://doi.org/10.3390/electronics12030688
AMA Style
Chang Y, Bukke RN, Kim Y, Ahn K, Bae J, Jang J. High-Performance Amorphous InGaSnO Thin-Film Transistor with ZrAlOx Gate Insulator by Spray Pyrolysis. Electronics. 2023; 12(3):688. https://doi.org/10.3390/electronics12030688
Chicago/Turabian StyleChang, Yeoungjin, Ravindra Naik Bukke, Youngoo Kim, Kiwan Ahn, Jinbaek Bae, and Jin Jang. 2023. "High-Performance Amorphous InGaSnO Thin-Film Transistor with ZrAlOx Gate Insulator by Spray Pyrolysis" Electronics 12, no. 3: 688. https://doi.org/10.3390/electronics12030688
Note that from the first issue of 2016, this journal uses article numbers instead of page numbers. See further details here.