Article

A Dual Long Short-Term Memory Model in Forecasting the Number of COVID-19 Infections

1
Ph.D. Program in Strategy and Development of Emerging Industries, National Chi Nan University, Nantou 54561, Taiwan
2
Department of Information Management, National Chi Nan University, Nantou 54561, Taiwan
*
Author to whom correspondence should be addressed.
Electronics 2023, 12(3), 759; https://doi.org/10.3390/electronics12030759
Submission received: 10 December 2022 / Revised: 27 January 2023 / Accepted: 31 January 2023 / Published: 2 February 2023
(This article belongs to the Special Issue Recent Advances in Data Science and Information Technology)

Abstract

:
Since the outbreak of the Coronavirus Disease 2019 (COVID-19), the spread of the epidemic has been a major international public health issue. Hence, various forecasting models have been used to predict the infectious spread of the disease. In general, forecasting problems often involve prediction accuracy decreasing as the horizon increases. Thus, to extend the forecasting horizon without decreasing performance or prediction, this study developed a Dual Long Short-Term Memory (LSTM) with Genetic Algorithms (DULSTMGA) model. The model employed predicted values generated by LSTM models in short-forecasting horizons as inputs for the long-term prediction of LSTM in a rolling manner. Genetic algorithms were applied to determine the parameters of LSTM models, allowing long-term forecasting accuracy to increase as long as short-term forecasting was accurate. In addition, the compartment model was utilized to simulate the state of COVID-19 and generate numbers of infectious cases. Infectious cases in three countries were employed to examine the feasibility and performance of the proposed DULSTMGA model. Numerical results indicated that the DULSTMGA model could obtain satisfactory forecasting accuracy and was superior to many previous studies in terms of the mean absolute percentage error. Therefore, the designed DULSTMGA model is a feasible and promising alternative for forecasting the number of infectious COVID-19 cases.

1. Introduction

Since the beginning of 2020, COVID-19 has spread rapidly and globally. Studies forecasting the spread of epidemics have attracted much more attention ever since. Infection rates related to government policy, medical resources, vaccine coverage rates, and culture have been provided by countries or regions. Modeling infectious disease cases is a mechanism for investigating disease dissemination and is an effective way to develop strategies for assessing and controlling epidemics [1]. The compartment model simplifying the mathematical modeling of the spread of an epidemic is a popular way of forecasting epidemics. The Susceptible-Infected-Recovered (SIR) model [2,3] is an essential compartment model commonly used in epidemiology.
The Long Short-Term Memory model [4,5], one of the deep learning techniques in time series, has been broadly explored in forecasting COVID-19 infections. Verma et al. [6] designed six recurrent and convolutional neural networks to forecast daily confirmed cases of COVID-19 for 7, 14, and 21-day time windows. The study reported that the stacked LSTM model and the hybrid LSTM model outperformed other models. Prasant et al. [7] proposed a hybrid Grey Wolf Optimizer and LSTM model to predict daily new cases, cumulative cases, and COVID-19 deaths. Using specific search terms related to COVID-19 and data on its spread published by the European Centre for Disease Prevention and Control, the study indicated that the hybrid LSTM model was superior to the other models in terms of forecasting accuracy. Darry et al. [8] investigated data on confirmed and recovered COVID-19 cases in seven countries and used different deep learning models to conduct the forecast. Numerical results revealed that the developed LSTM with convolutional neural network models could generate more accurate forecasting results than other models. Shastri et al. [5] developed three recurrent neural networks—stacked LSTM, bidirectional LSTM, and convolutional LSTM—to predict confirmed and fatal cases of COVID-19 in the coming month in India and the United States. The authors reported that, of the three models, the convolutional LSTM was superior in terms of forecasting accuracy. Nabi et al. [9] utilized four deep learning models to predict outbreak scenarios in Brazil, Russia, and the United Kingdom. The study employed limited features and historical data while forecasting. Numerical results reported that the convolutional neural network model outperformed the LSTM model in terms of forecasting accuracy. Rguibi et al. [10] used the autoregressive integrated moving average method and LSTM models to predict the outbreak of COVID-19 in Morocco for the next two months. The study indicated that the LSTM model could obtain more accurate forecasting results than the autoregressive integrated moving average method. Ketu and Mishra [11] designed a hybrid LSTM model that could accurately forecast the COVID-19 outbreak in India. The proposed model employed an additional convolutional layer in the LSTM layer. Notably, the additional layer improved the performance of the hybrid model. Jiao et al. [12] proposed an improved LSTM model integrating the seasonal trend decomposition technique with multiple features to predict COVID-19 deaths. The forecasting results were satisfactory. Tuli et al. [13] presented a Weibull-based LSTM (W-LSTM) model for predicting COVID-19. Moreover, this study employed the W-LSTM model to forecast the start and end of COVID-19 cycles in many countries. The presented model achieved satisfactory results in 50 countries. Table 1 lists the related studies and forecasting accuracy of COVID-19 predictions based on LSTM models and the mean absolute percentage error (MAPE). In general, the forecasting accuracy declines as the forecasting horizon increases [14,15,16].
This study developed the DULSTMGA model to forecast infectious COVID-19 cases using predicted values provided by LSTMGA models in a rolling manner. When forecasting, theoretically and practically, the accuracy decreases as the forecasting horizon increases. Thus, in general, using accurately predicted values as input for the other forecasting model can improve forecasting accuracy. The main contribution of this study is to employ predicted values provided by an LSTM model as the input to predict infectious cases of COVID-19 in the long term in a rolling way.
The rest of this study is organized as follows. Section 2 depicts the DULSTMGA model in forecasting infectious cases of COVID-19. Numerical examples are illustrated in Section 3 to demonstrate the performance of the designed DULSTMGA model in forecasting infectious COVID-19 cases. Conclusions are provided in Section 4.

2. The DULSTMGA in Forecasting Infectious Cases of COVID-19

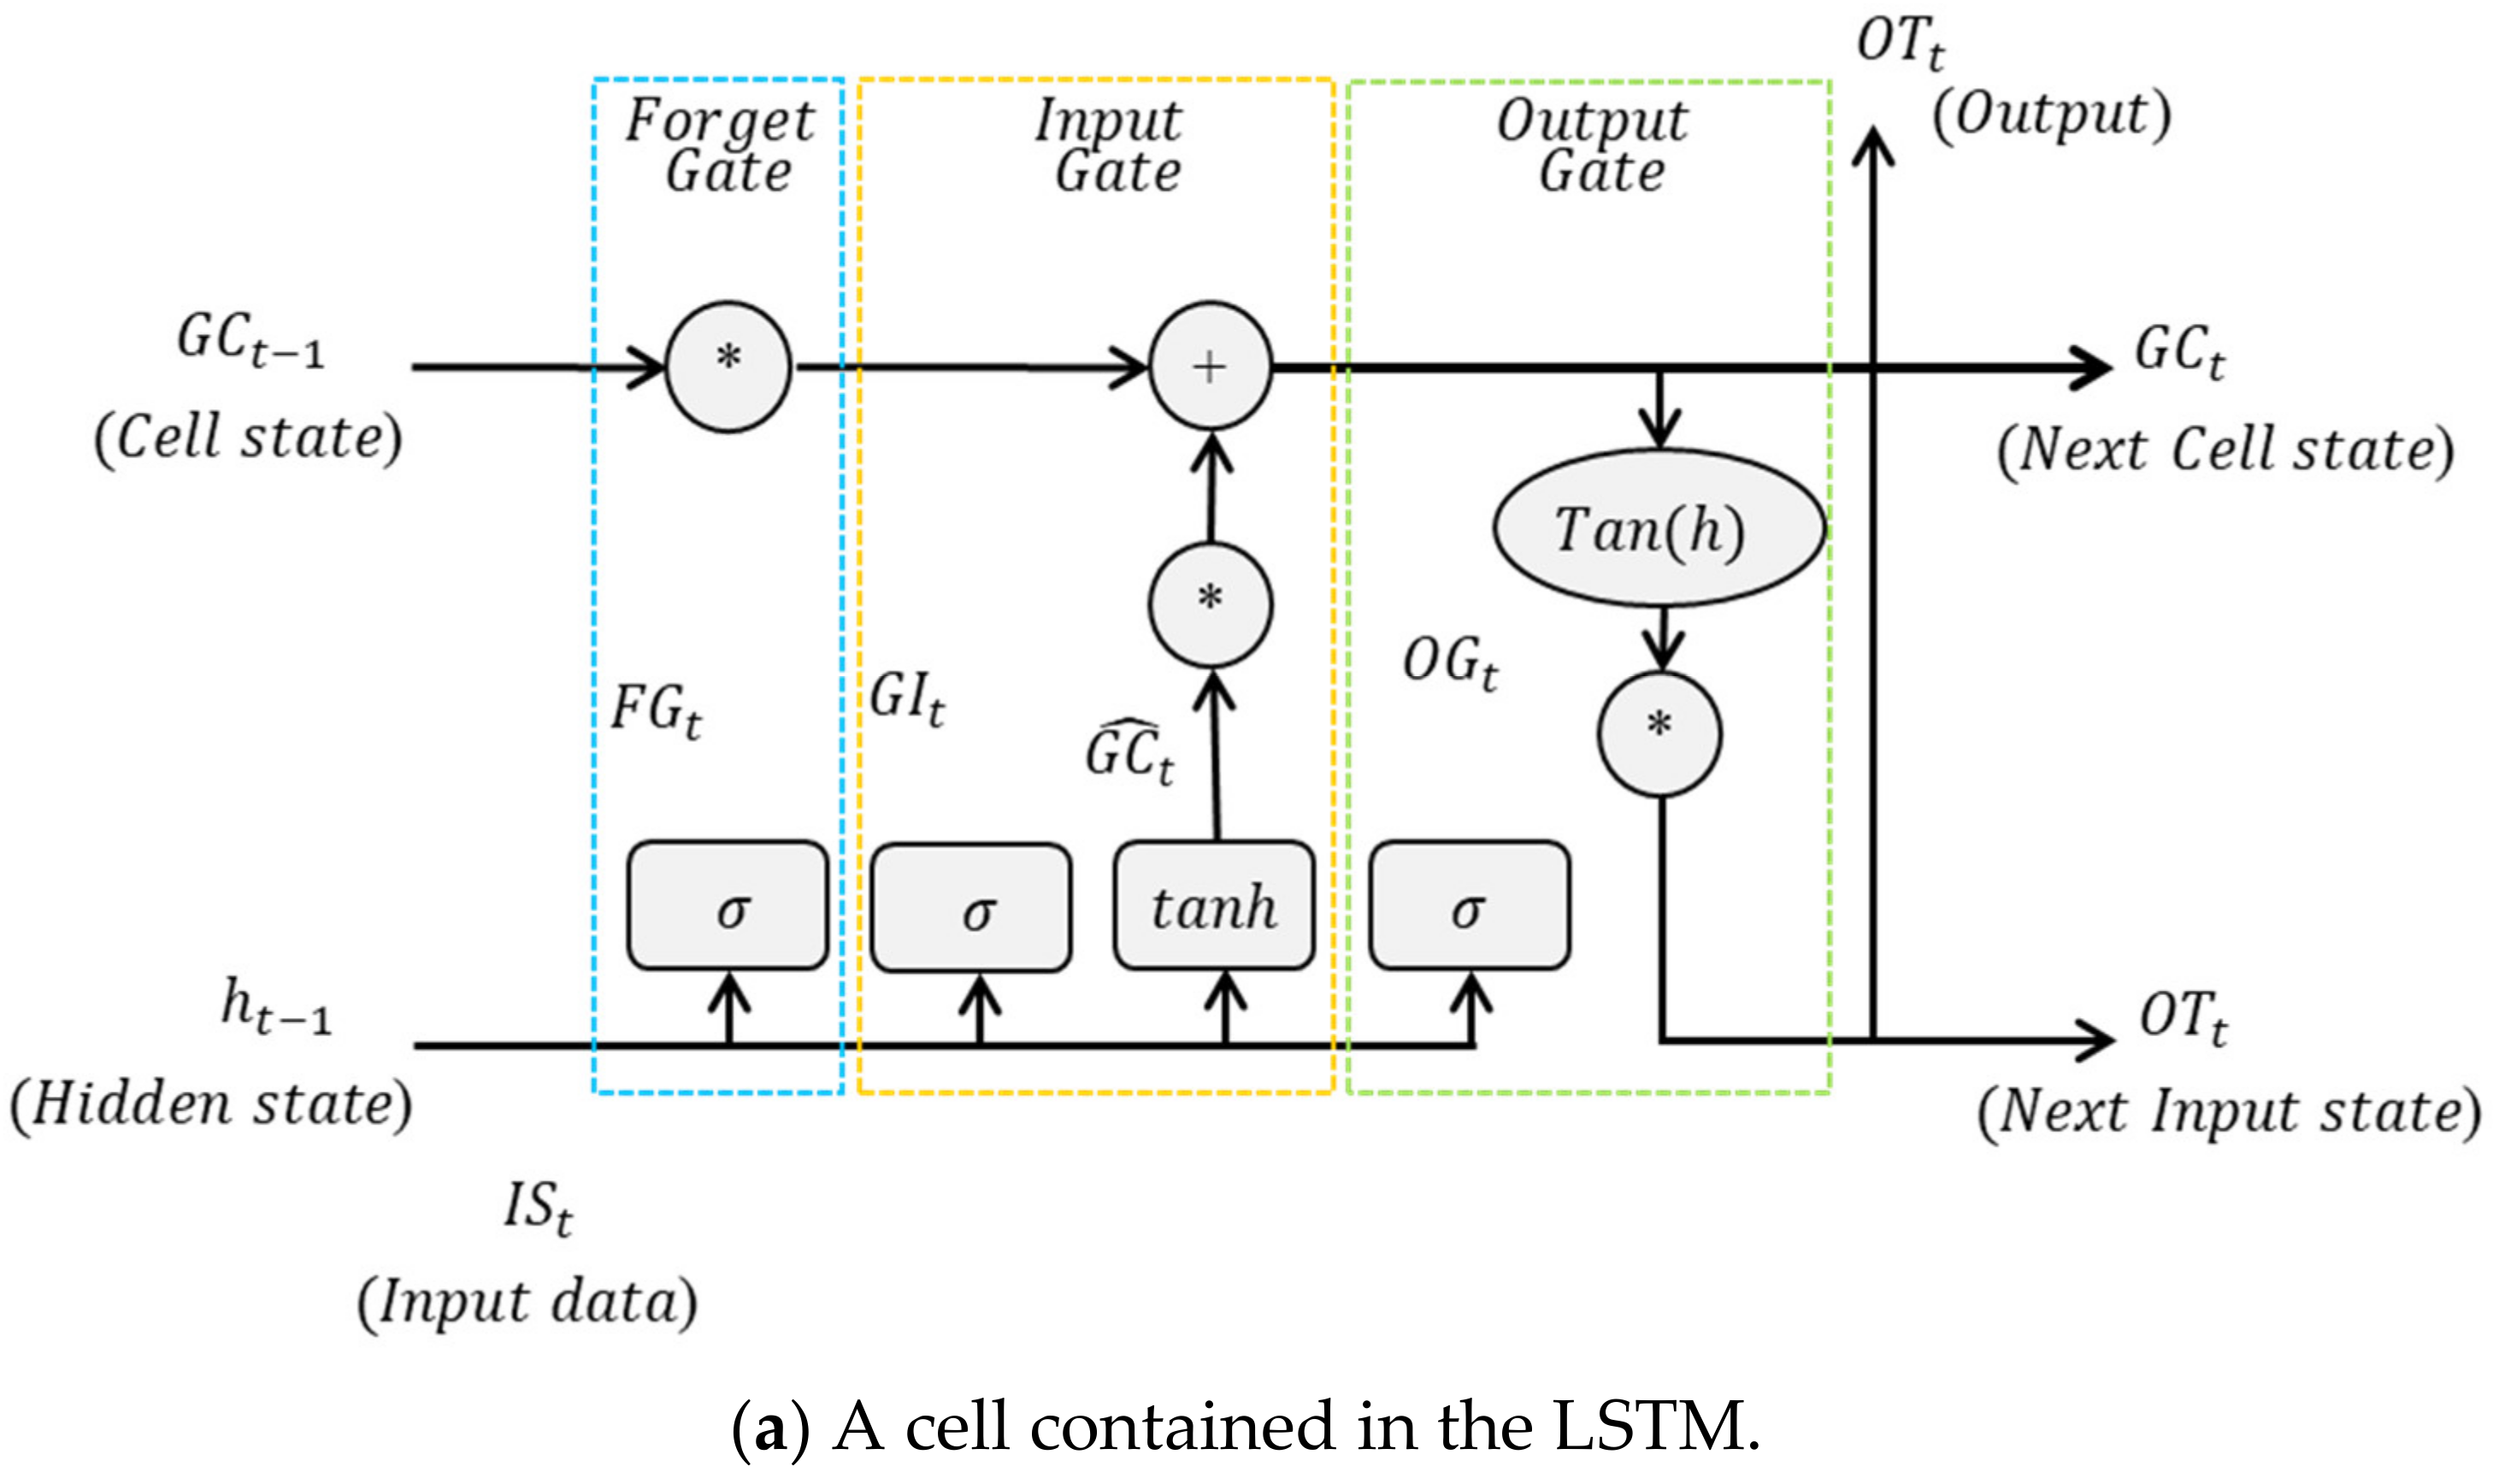
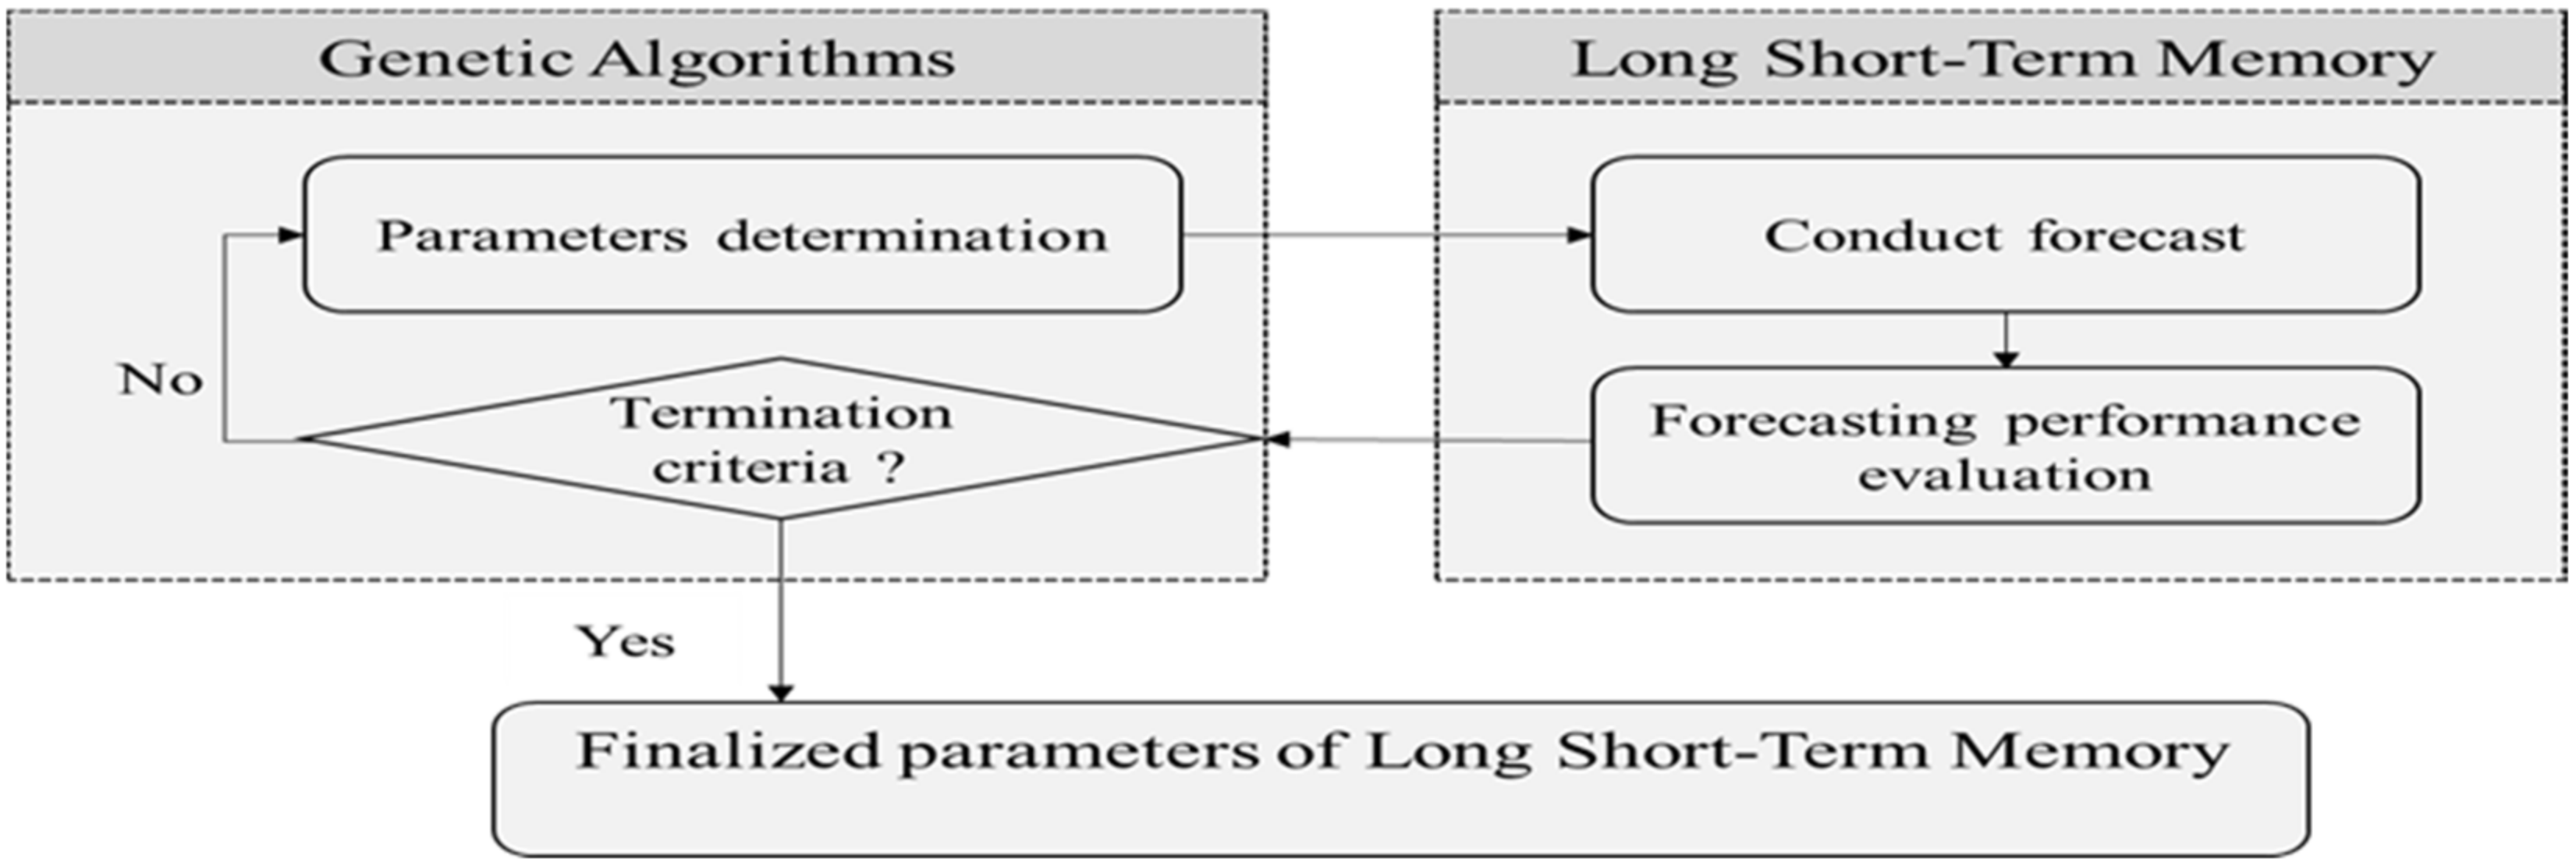
2.1. Long Short-Term Memory with Genetic Algorithms

By solving gradient problems of recurrent neural networks with long-term dependencies, the Long Short-Term Memory [17] model is a recurrent neural network that learns and predicts long sequences to perform forecasting tasks. Thus, LSTM is more effective than recurrent neural networks in learning dependencies with long-term features. However, the LSTM cell structure is relatively complex. A single cell is basically a memory unit; however, each cell contains four units, rather than a single unit, such as the cells of recurrent neural networks. Figure 1a,b illustrate a cell contained in the LSTM model and the LSTM architecture, respectively [18,19]. The * indicates the operation of multiplication.
A cell comprises the input gate, the forget gate, the output gate, and the cell state. The forget gate determines which information in the memory of the previous cell is permitted to be conveyed to the new cell. The function of the input gate is to update the cell state and decide the proportions of new data information delivered into the memory. The output gate determines ways of updating the memory and the amount of information fed to the next layer. The LSTM network calculates the mapping from the input sequence I S = ( I S t I S t + n ) to the output sequence O S = ( O S t O S t + n ) , initially with the input gates denoted as G I t and represented as seen in Equation (1):
G I t = S i g ( W i I S t + U i h t 1 + β i )
In Equation (1), Sig is the sigmoid activation function, which normalizes the variable to [0,1]. The input gate activation vector stores new information in the cell state, and G C t ^ is created by each tanh layer and can be illustrated as Equation (2).
G C t ^ = t a n h ( W c I S t + U c h t 1 + β c )
Furthermore, the forget gate activation vector F G t is calculated by Equation (3).
F G t = S i g ( W f x t + U f h t 1 + β f )
The forget gate removes the message from the cell state and reorganizes the memory cell by G C t ^ and F G t to generate the new state of the memory cell G C t represented as Equation (4).
G C t = G I t × G C t ^ + F G t × G C t 1
Then, the output gate activation vector O G t is generated, as illustrated by Equation (5).
O G t = S i g ( W o I S t + U o h t 1 + β o )
Finally, the output vector O T t of the LSTM is obtained and expressed as Equation (6).
O T t = O G t tanh ( G C t )
where U i ,   U c ,   U f ,   U o are Input weights; W i ,   W c ,   W f ,   W o are recurrent weights; and β i ,   β c ,   β f ,   β o are biases.
The output gate can compute the output by the cell state and cell activation function. The training phase uses the weight matrix to learn according to the bias vector. This study used a single hidden layer for LSTM models, and the ReLU function served as the activation function. In addition, a gradient-based Adam optimizer was employed to adjust the weights of the network.
For the LSTM training phases, a genetic algorithm [21,22] was employed to determine the parameters, including dropout rates, learning rates, and batch sizes of LSTM models. The forecasting MAPE is the fitness of the genetic algorithm in this study. Thus, for each iteration, the genetic algorithm provided parameters for LSTM models to generate the MAPE value not larger than the previous iteration. If the parameters yielded by the genetic algorithm did not result in a smaller MAPE value, the new parameter set did not replace the original parameter set. The genetic algorithm was conducted iteratively to decrease the MAPE value until the termination condition was reached [23,24,25,26,27,28]. A finalized LSTMGA model was used to perform forecasting tasks. According to a literature review [29], the population size, crossover rate, mutation rate, and the number of iterations of genetic algorithms are 8, 1.0, 0.2, and 40, respectively. In addition, genetic algorithms tend to converge when a satisfactory number of iterations is conducted [30,31]. Figure 2 illustrates the interactive procedure of using genetic algorithms to determine LSTM parameters.

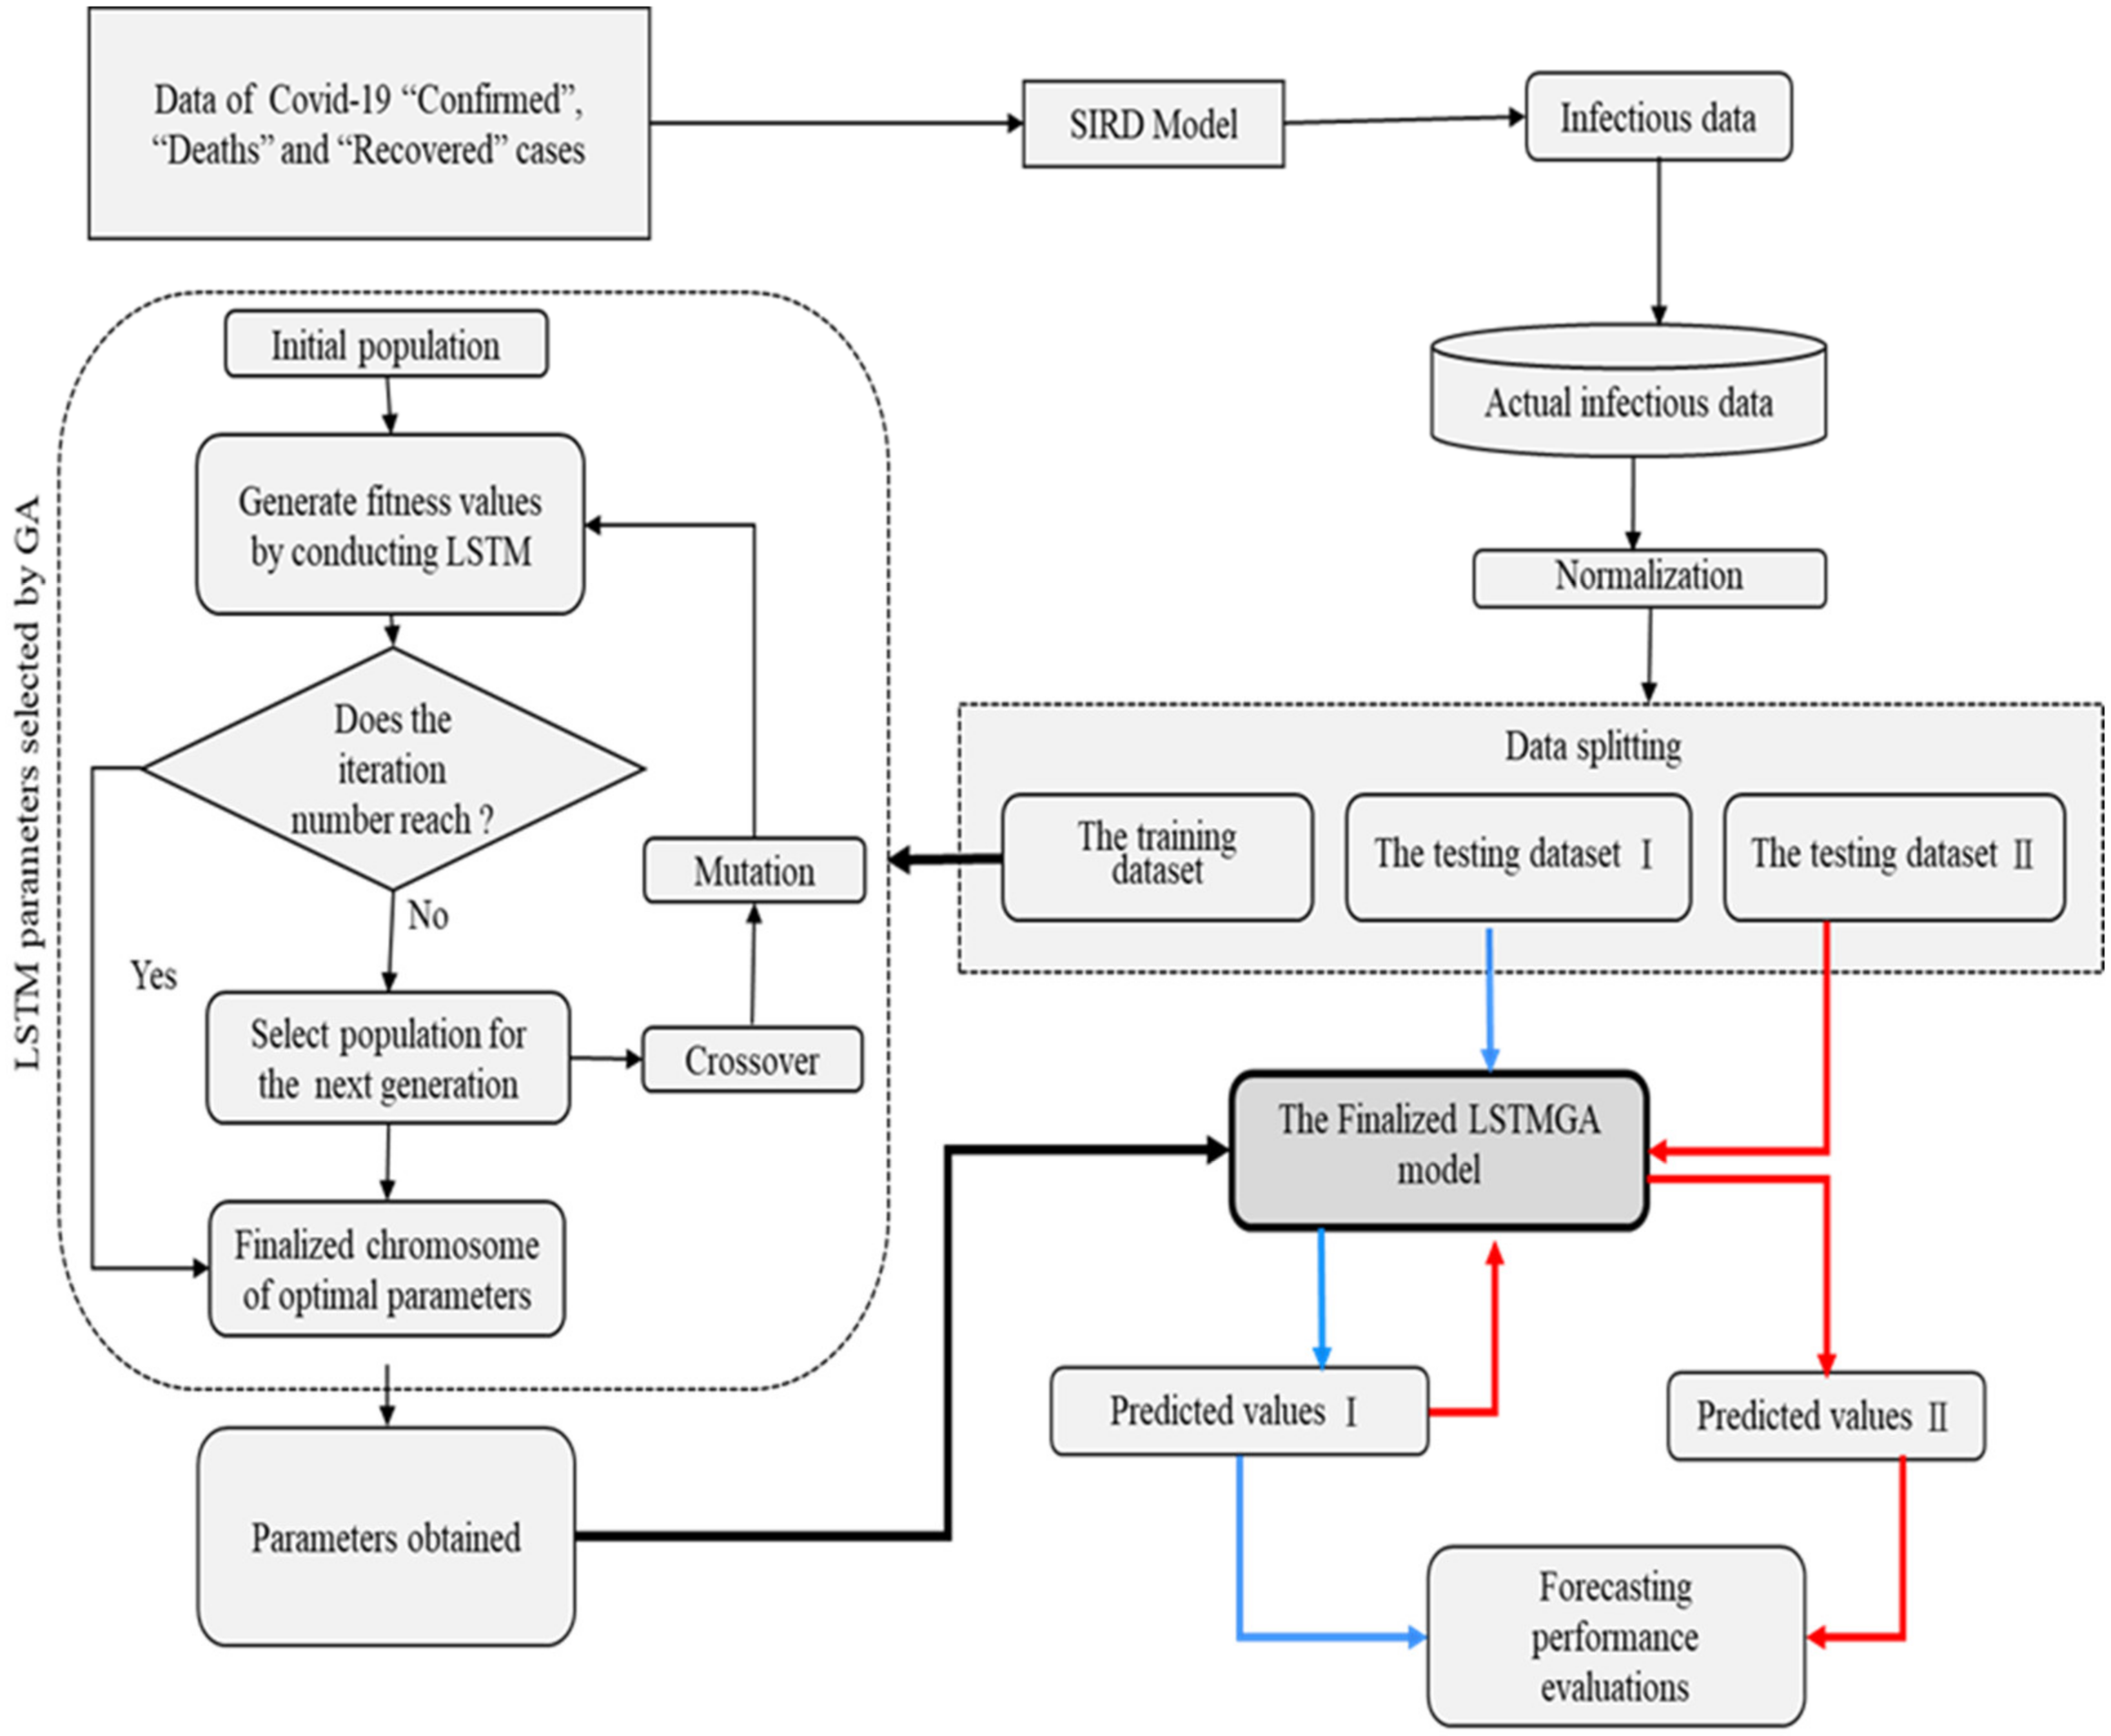
2.2. The Proposed Dual Long Short-Term Memory with Genetic Algorithms (DULSTMGA) Model

Figure 3 illustrates the flowchart of the proposed DULSTMGA model for forecasting infectious COVID-19 cases. The initial phase was carried out by collecting data, including confirmed cases, deaths, and recovered cases. After gathering original data, the Susceptible-Infected-Recovered-Deceased (SIRD) model procedure was performed to obtain the number of infectious cases. Normalization was further conducted for infectious data, which was then divided into the training dataset and the testing dataset. The training dataset was used to determine forecasting models by parameter tuning. The testing dataset was employed to examine the performance of finalized forecasting models. In this study, two testing datasets, namely testing dataset I and testing dataset II, were used to investigate the performance of the proposed DULSTMGA model. Figure 4 depicts the forecasting procedure using testing dataset I and testing dataset II, respectively. Testing dataset I was used to measure forecasting performance when forecasting infectious cases using actual data. In contrast, testing dataset II was employed to measure forecasting performance by adding predicted values generated from actual data in a rolling manner in order to forecast numbers of infectious cases. In this study, infectious cases from the past 30 days were used to forecast future infectious cases.
For testing dataset I, the LSTMGA models were used to predict infectious cases in the next 14 days using infectious cases from the past 30 days. For testing dataset II, the DULSTMGA models used predicted values provided by the LSTMGA models, as well as actual values, with a total of 30 data occurring in a rolling manner to forecast the infectious cases from the 15th to the 28th day.

3. Numerical Examples

3.1. Forecasting of Infectious COVID-19 Cases
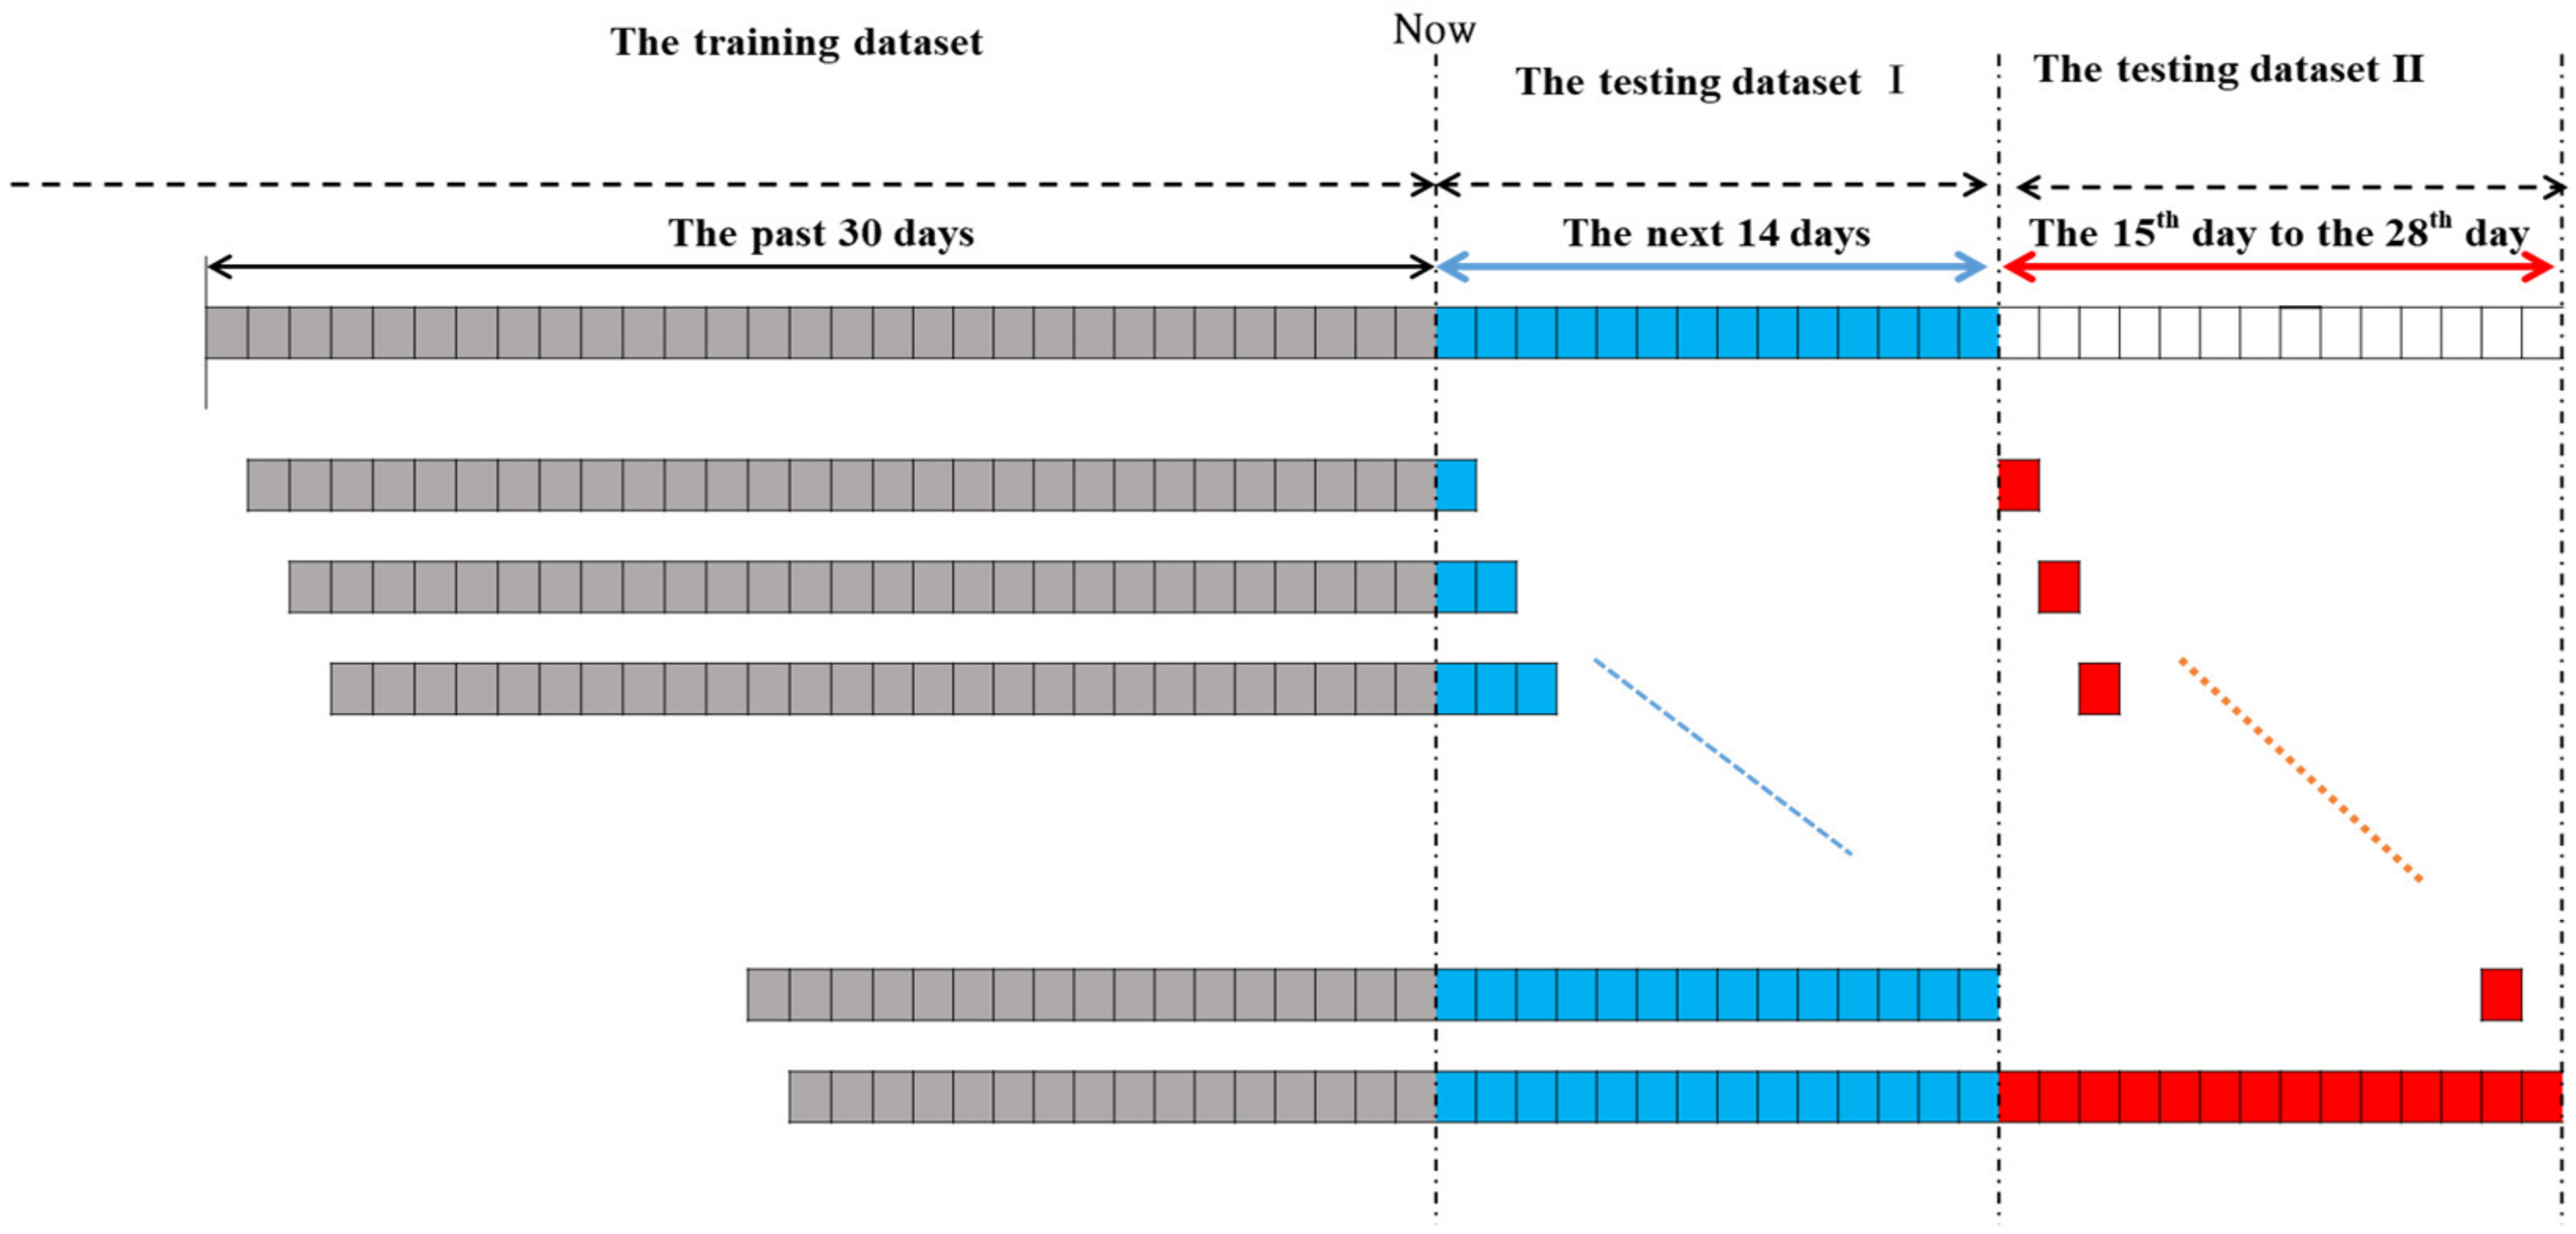
The designed DULSTMGA model was created using the Keras application programming interface. The interval of the forecast data is daily, limited to a certain range. Before training the LSTM models, the selected dataset needs to be preprocessed to obtain a time series of daily infectious data, which is used to create an input sequence for the dataset. First, the number of infected people was calculated through the SIRD model and used as input datasets. Then, the input data for the LSTM models were normalized using Equation (7).
D n = D D m i n D m a x D m i n
where D , D n , D m i n , and D m a x represent the original time series data, the normalized time series data, and the minimum and maximum values of the time series data, respectively. Then, a time series dataset was converted to a supervised learning dataset, where previous time steps ( t n ) were used as input, and current time steps ( t ) or future time steps ( t + n ) were used as output for observational data. The data were split into training data and test data. Notably, the data shape needed to be reshaped because the LSTM input was in the matrix of three dimensions: samples, time steps, and features. The original dataset was a two-dimensional array of samples and features; hence, it was converted into a three-dimensional array. The network structure for establishing the LSTM model consists of one hidden layer and two LSTM units, and the activation function uses ReLU. The optimizer uses the Adam algorithm. In other studies [32,33,34], the values of exponential decay rate β 1 and β 2 were proposed as 0.9 and 0.999, respectively. In addition, a small value of epsilon was suggested for LSTM models. The learning rates, batch sizes, and dropout rates were determined by GA with MAPE as the fitness function. According to previous studies [35,36], 100 epochs can obtain satisfactory results in LSTM models. Thus, LSTM is equipped with 100 epochs.
Three measurements—namely mean absolute error (MAE), root mean square error (RMSE), and mean absolute percentage error (MAPE)—were used to evaluate forecast performance and are represented by Equations (8)–(10), respectively.
M A E = 1 m i = 1 m | X i Y i |
R M S E = 1 m i = 1 m ( X i Y i ) 2
M A P E = 100 m i = 1 m | Y i X i Y i |
where m is the number of forecasting periods, X i is the i th actual value, and Y i is the i th forecasting value.

3.2. Datasets

COVID-19 data provided by Johns Hopkins University, including daily confirmed deaths and recovery [37] cases, were used in this study. The Susceptible-Infected-Recovered-Deceased (SIRD) model was applied to generate infectious cases. Aimed at the initial outbreak of COVID-19 and fast-spreading periods, data from three countries, France, Germany, and the UK, were appropriate for short and long-term analyses to demonstrate the performance of the DULSTMGA model. The outbreak and fast-spreading time periods differed between countries; thus, the days used for training and testing were different within the three countries. Data used to train the models were depicted as follows: The France dataset included 424 days from 22 January 2020 to 20 March 2021; the Germany dataset contained 435 days from 22 January 2020 to 31 March 2021; and the United Kingdom dataset included 273 days from 22 January 2020 to 20 October 2020. The days immediately after the training datasets of three countries were used as the testing datasets of LSTMGA and DULSTMGA models to measure forecasting performance. Training datasets and testing datasets for the three countries are listed in Table 2. The GA was used to determine the parameters of the LSTM models during the training phases. Based on the parameters generated, the LSTMGA models were used to predict both the first term, from the first day to the fourteenth day, and the second term, from the fifteenth day to the twenty-eighth day. The DULSTMGA models were employed for the second term forecasting only using the predicted values provided by LSTMGA models in a rolling manner.

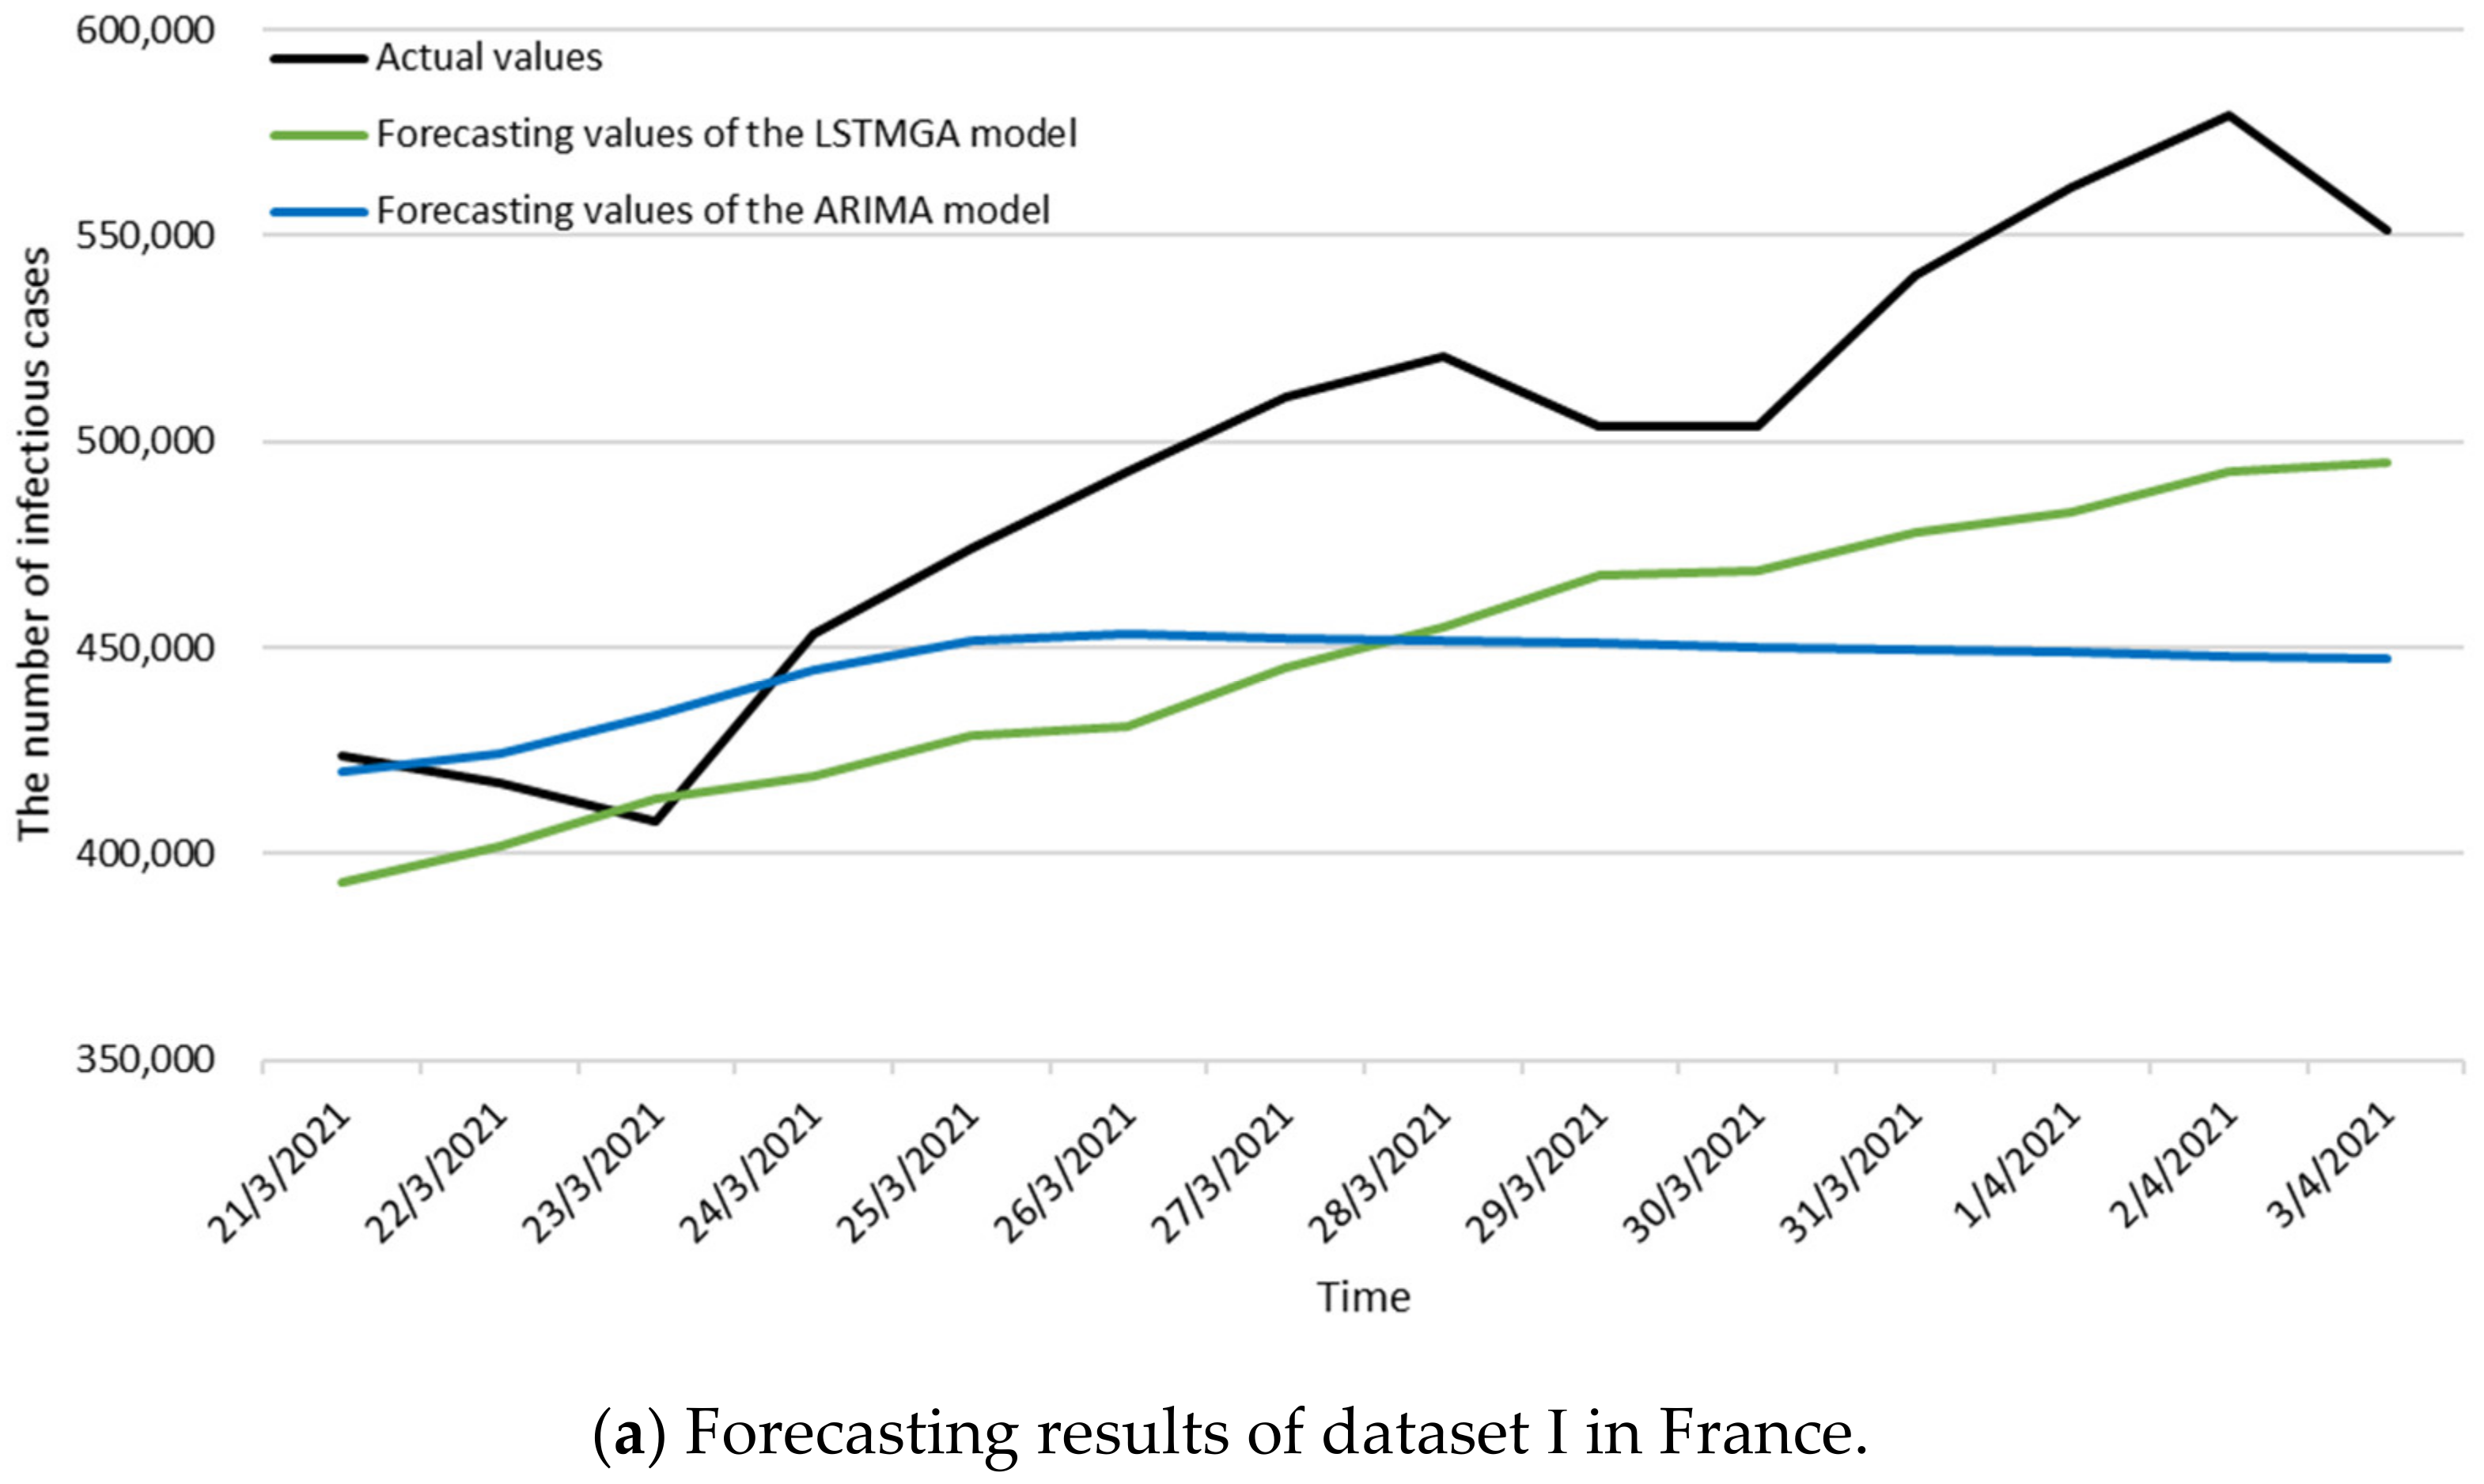
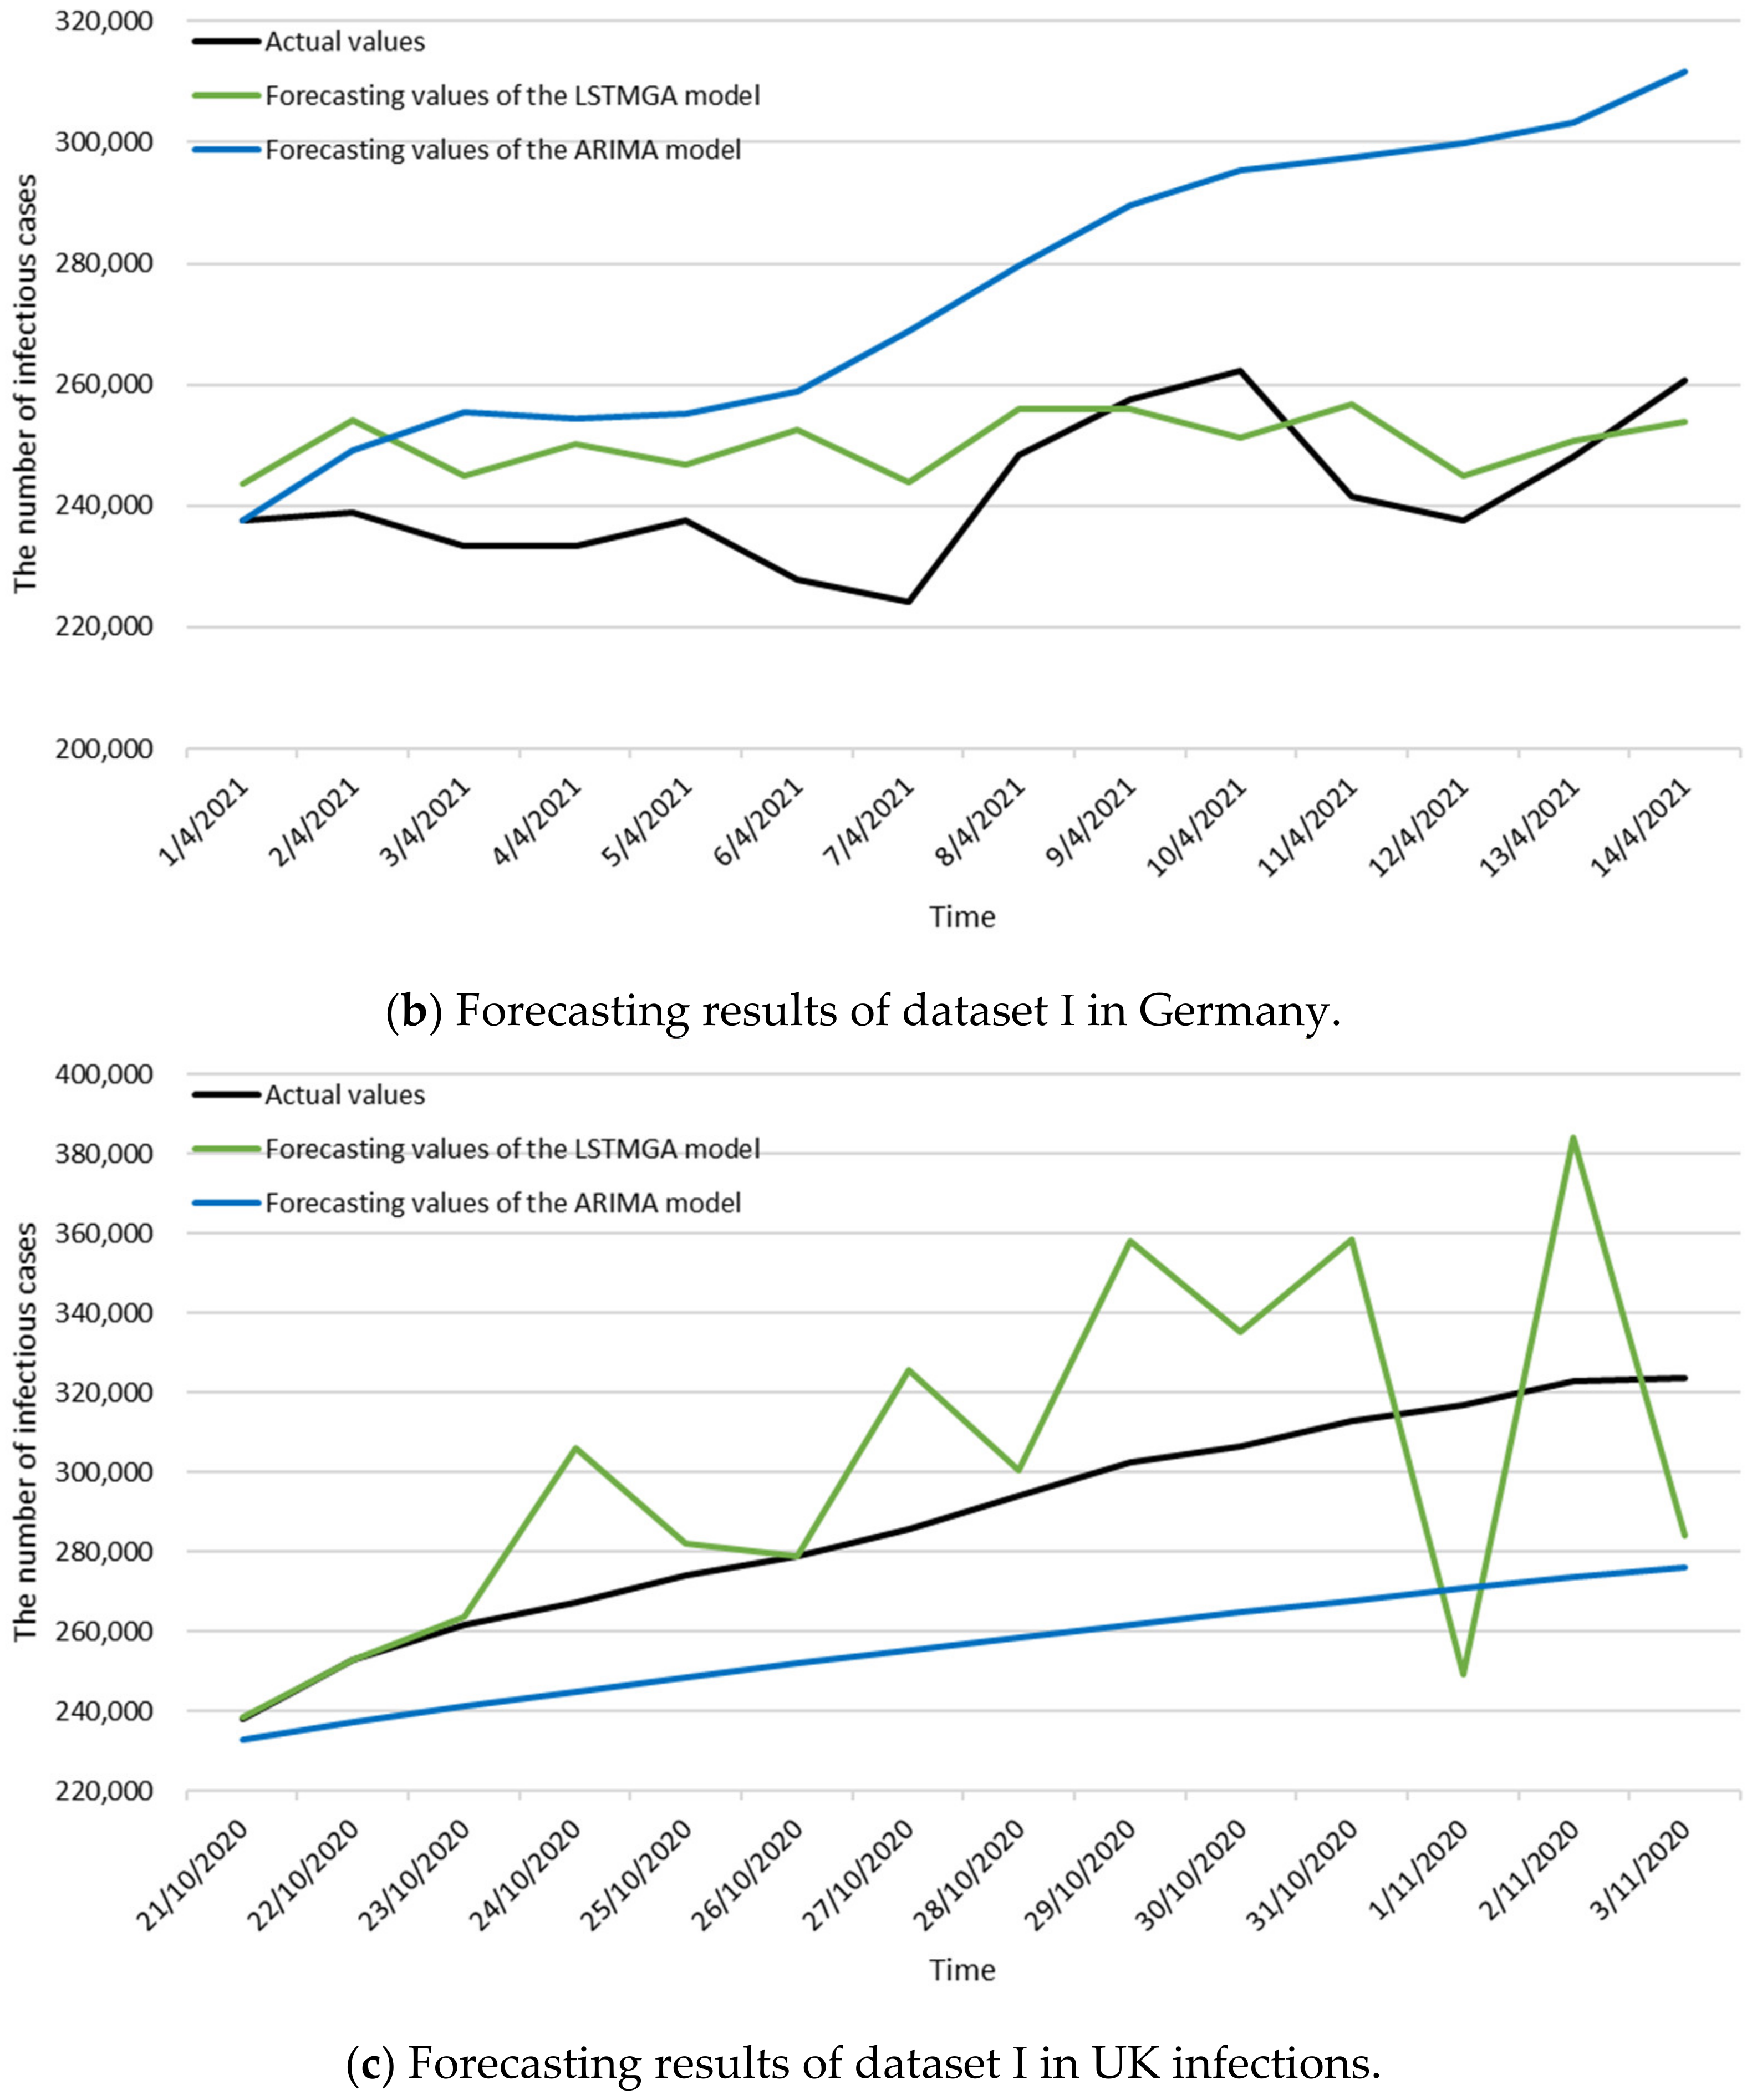
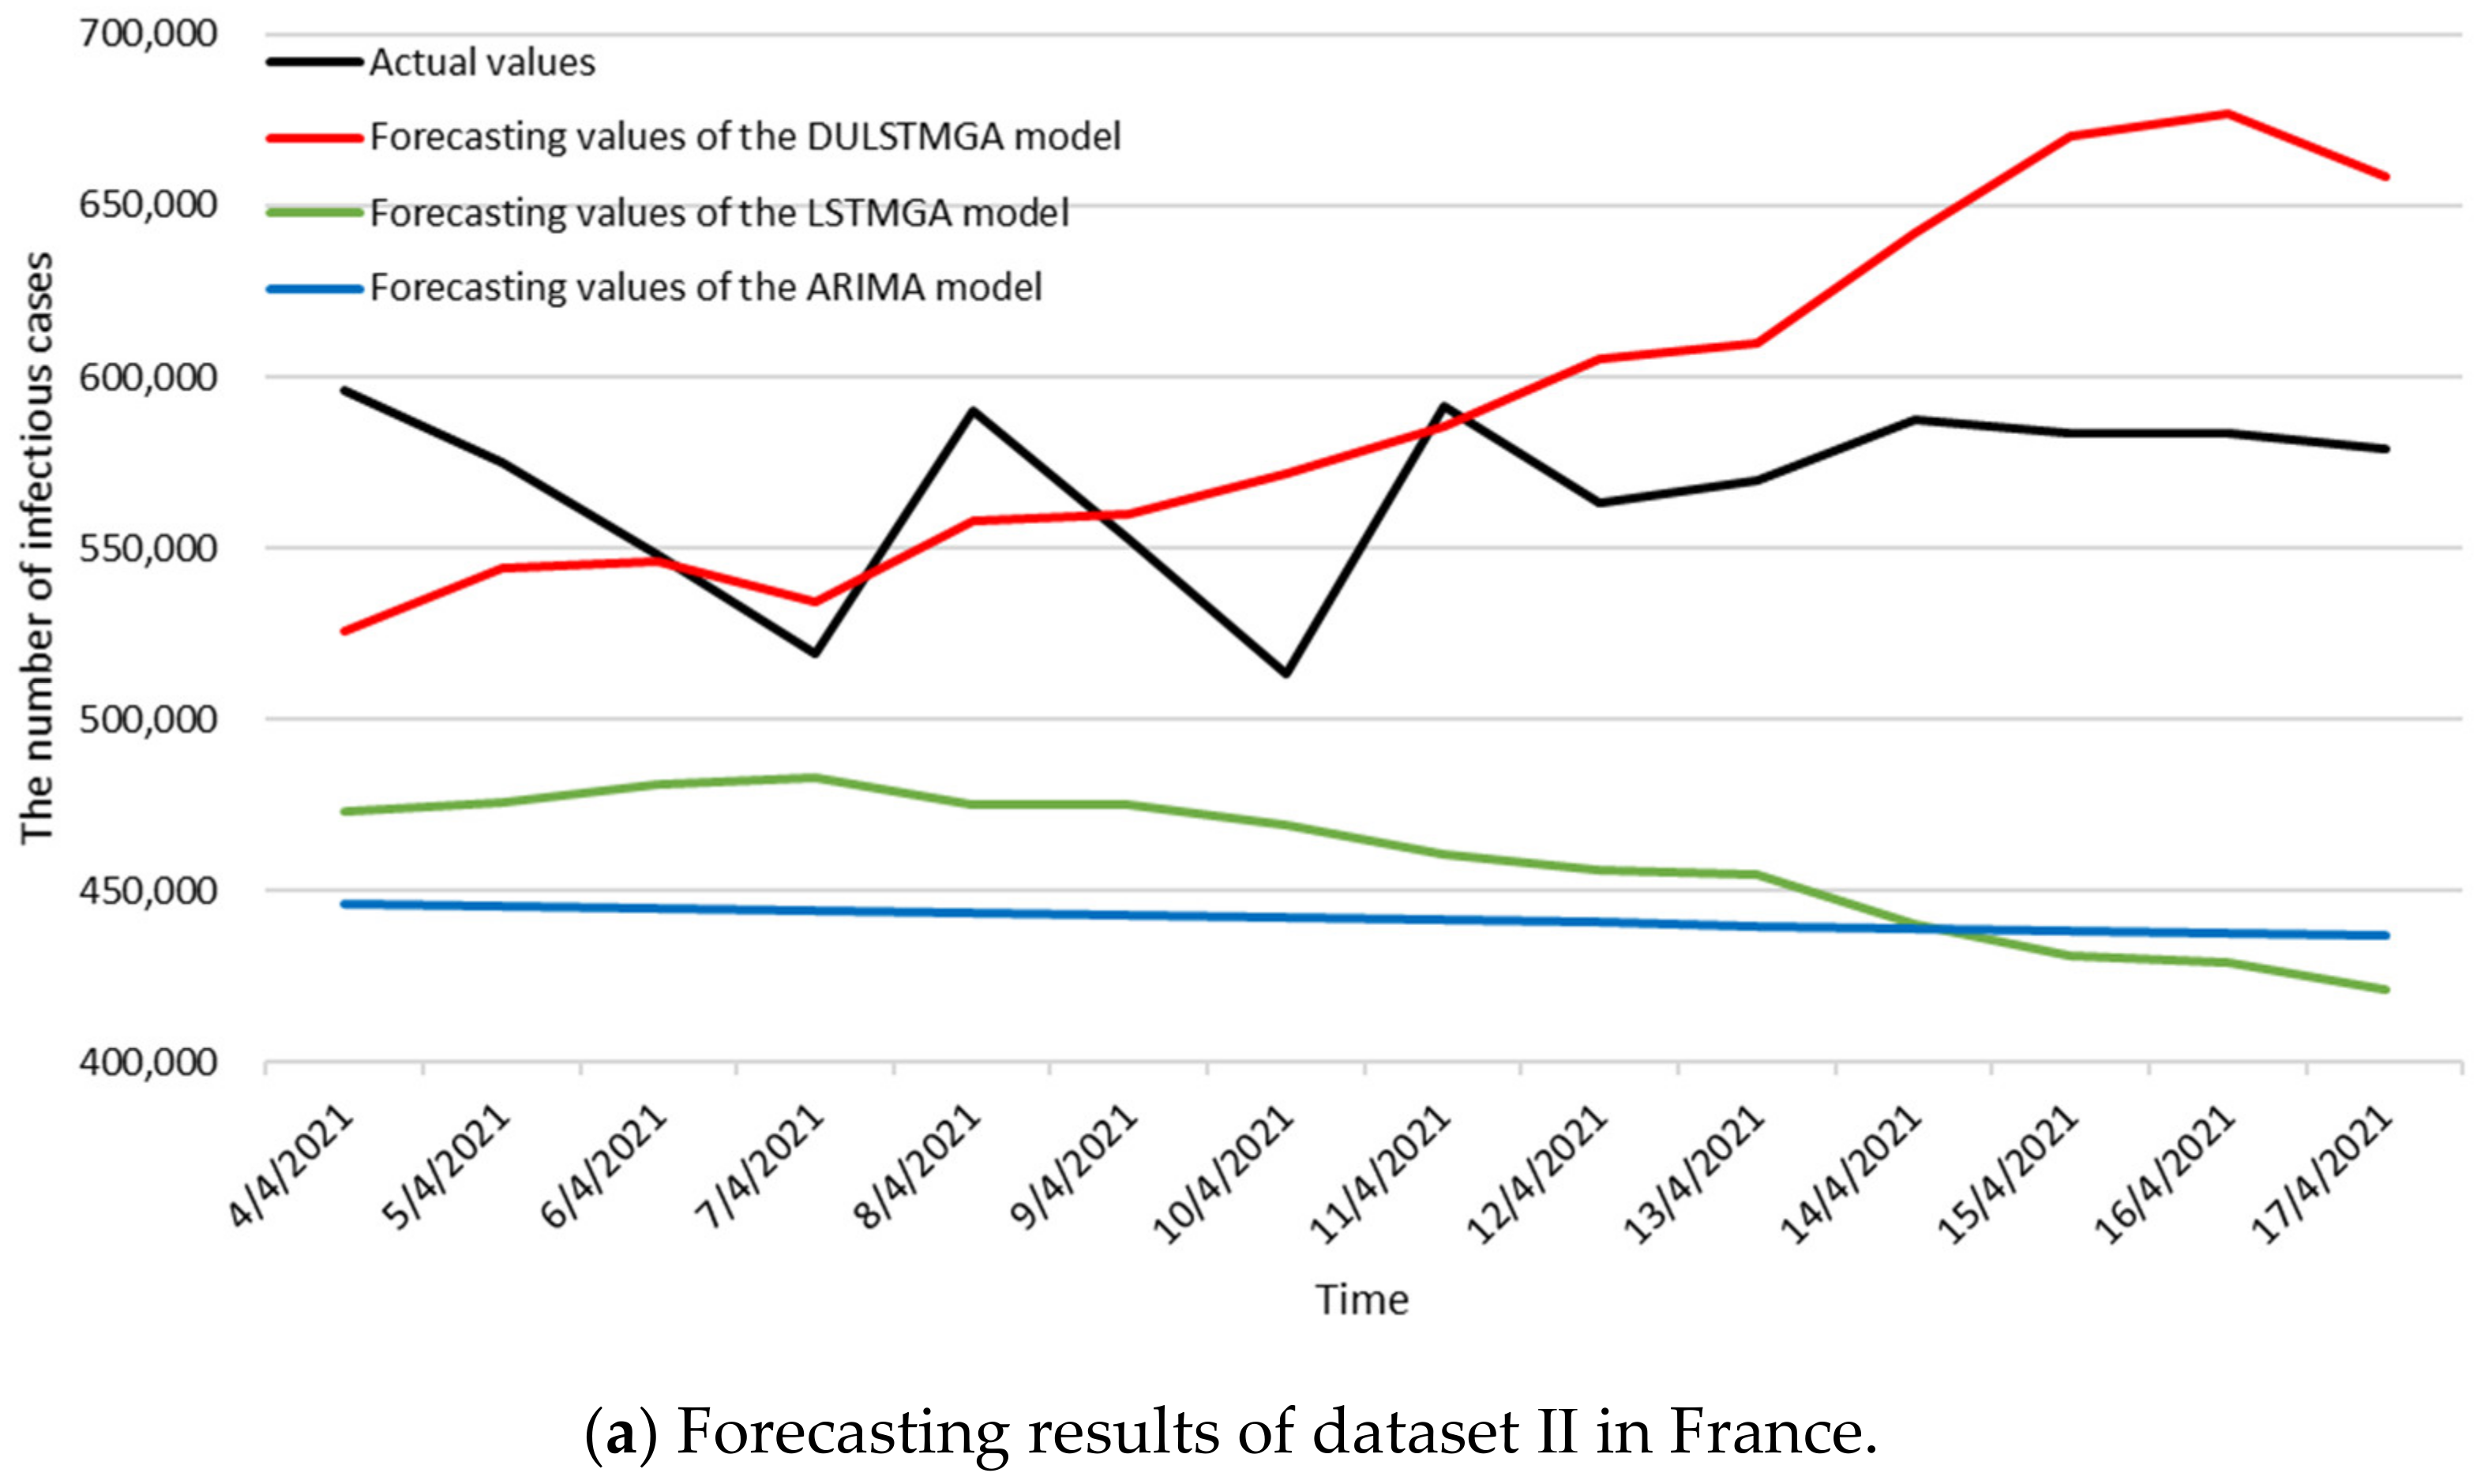
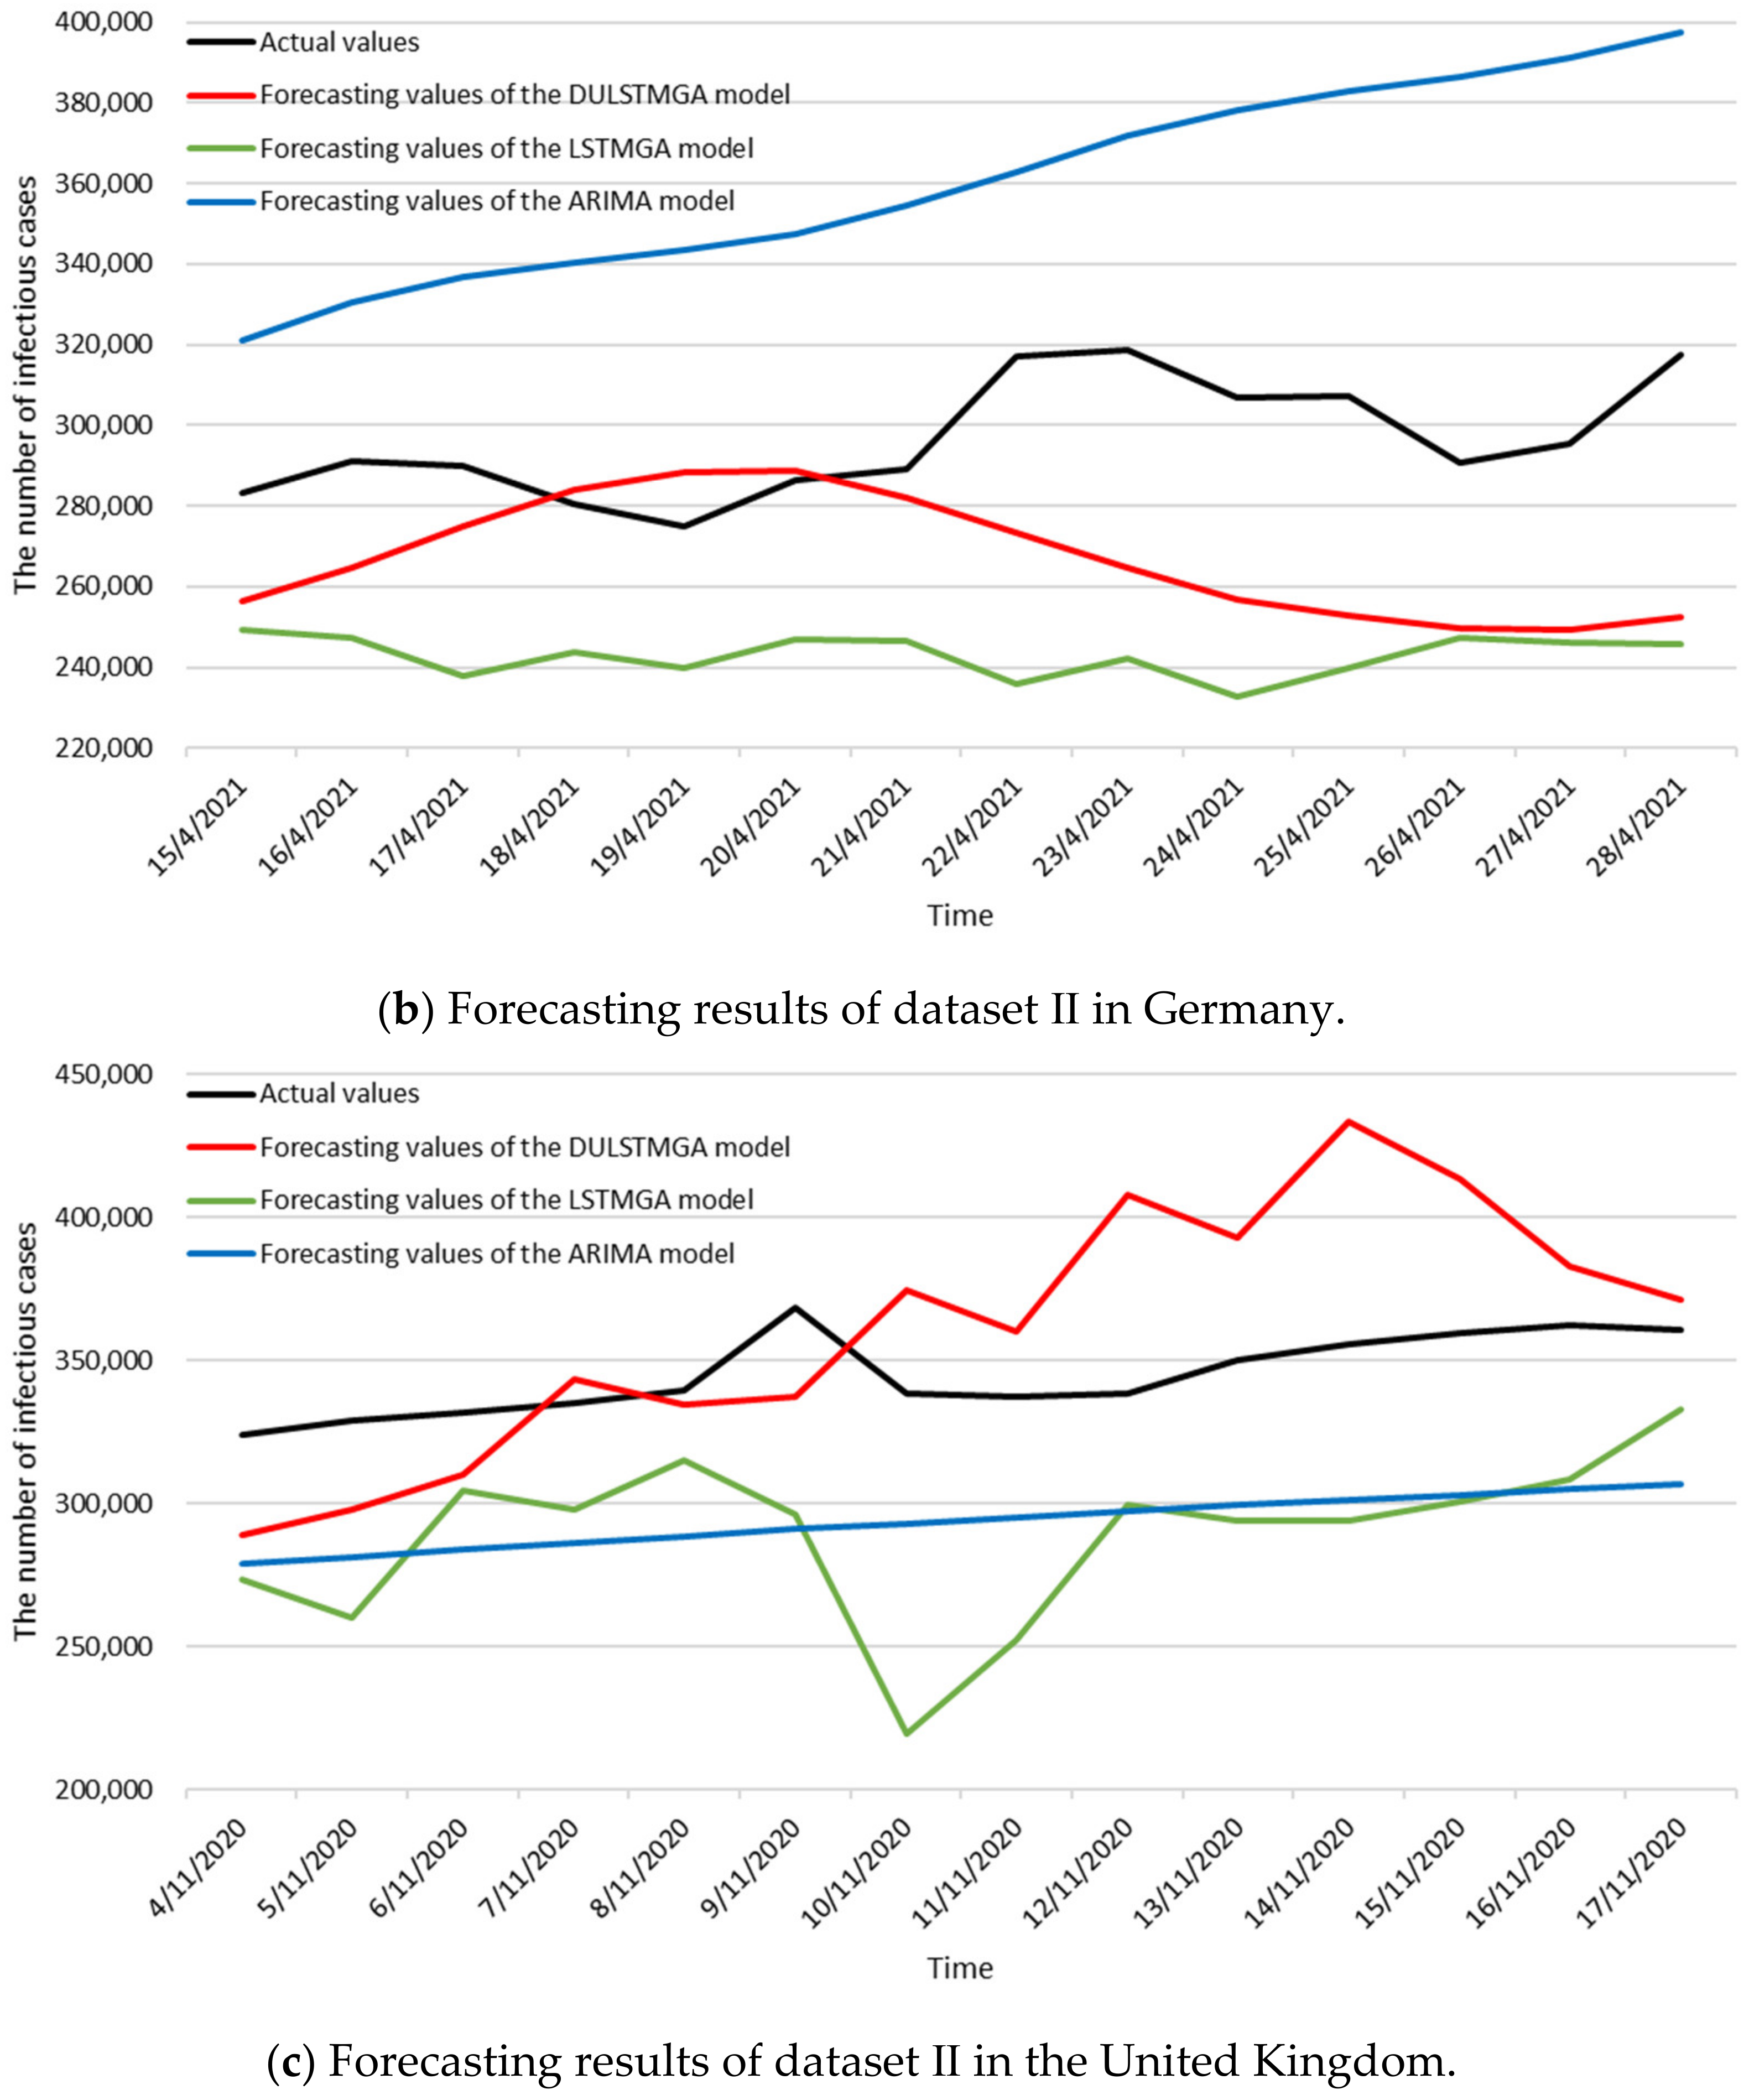
3.3. Numerical Results

The first part of this study employed LSTMGA models to perform the next fourteen days of forecasting. Table 3 and Table 4 illustrate the measurements of forecasting accuracy for three countries by LSTMGA models and ARIMA models, receptively. Due to the fact that the values of MAE and RMSE tend to be influenced by actual values of testing data, the MAPE values are relatively stable when measuring and comparing forecasting accuracy. The MAPE values generated by LSTMGA models are less than 10%. According to the report provided by Lewis [38], Table 5 indicates the ranks of the forecasting accuracy of the MAPE values. Thus, the LSTMGA models are suitable and accurate in forecasting numbers of infectious COVID-19 cases for the forecasting horizon of 1–14 days. The point-to-point comparisons of actual and predicted values of France, Germany, and the United Kingdom are illustrated in Figure 5. Thus, the numerical results reveal that the LSTMGA models were able to capture numbers and trends of infectious cases one to fourteen days ahead across three countries.
The dropout rates were used randomly to adjust the neural network structure and to prevent neuronal coadaptation. Basically, the large dropout rate resulted in fewer connections between two consecutive neurons; therefore, neural networks with less complicated structures were generated. The dropout rate used for Germany was smaller than the dropout rates employed for France and the United Kingdom. Thus, during the training stage of LSTMGA models, the data pattern of Germany was more complex than the data patterns of France and the United Kingdom. Further, batch size influences the generalization ability of LSTM models; generally, a small batch size leads to better generation by the LSTM model [39].
The second part of this study involved applying ARIMA models, LSTMGA models, and DULSATMGA models to forecast from the 15th to the 28th days and compare the results. The point-to-point comparisons between the actual and the predicted values in France, Germany, and the United Kingdom are illustrated in Figure 6. In addition, the measurement forecasting accuracies for France, Germany, and the United Kingdom are listed in Table 6, Table 7 and Table 8. It can be concluded that the DULSTMGA models outperformed the LSTMGA models and ARIMA models in terms of forecasting accuracy across the three countries. Furthermore, the MAPE values generated by the DULSTMGA models for the three countries were less than 10. In addition, the DULSTMGA models captured data patterns in long-term forecasting and outperformed the ARIMA models and LSTMGA models in terms of forecasting accuracy. Thus, the developed DULSTM models using predicted values as inputs are useful in generating more accurate results for longer-period forecasting.

4. Conclusions

This study designed a DULSTMGA model incorporated with the SIRD technique to forecast infectious COVID-19 cases in three countries. The developed DULSTMGA model employed predicted values to conduct longer-term forecasting in a rolling manner. The infectious COVID-19 cases in France, Germany, and the United Kingdom were used to demonstrate the performance of the proposed model. The main finding of this study involves identifying the effectiveness of employing predicted values generated by LSTMGA models as inputs of other LSTM models. The contribution of the proposed DULSTMGA model is to moderate the problem of decreasing forecasting accuracy as the forecasting horizon grows. The promising numerical results reveal two clues for increasing the long-term forecasting accuracy of infectious COVID-19 cases. The first clue is that using predicted values as inputs is a feasible way to perform long-term forecasting. The second clue is that accurate long-term forecasting can be achieved when short-term forecasting is reliable. This finding can be duplicated to integrate different forecasting models together and conduct forecasting tasks in a rolling way in order to increase long-term forecasting accuracy. Another possibility is to use other parameter-selection approaches to determine model parameters. Finally, infectious data from other countries or regions can be used to verify the feasibility of the proposed DULSTMGA model.

Author Contributions

Conceptualization, J.-P.L. and P.-F.P.; data curation, J.-P.L.; formal analysis, J.-P.L. and P.-F.P.; methodology, J.-P.L. and P.-F.P.; software, J.-P.L.; visualization, J.-P.L. and P.-F.P.; writing—original draft, J.-P.L.; review and editing, P.-F.P. All authors have read and agreed to the published version of the manuscript.

Funding

This research received no external funding.

Data Availability Statement

The dataset is available at https://data.humdata.org/dataset/novel-coronavirus-2019-ncov-cases (accessed on 15 May 2021). The algorithms used in the proposed model are available on reasonable request from the corresponding author.

Conflicts of Interest

The authors declare no conflict of interest.

References

  1. Daley, D.J.; Gani, J. Epidemic Modelling: An Introduction; Cambridge University Press: Cambridge, UK, 2005. [Google Scholar]
  2. Kermack, W.O.; McKendrick, A.G. A contribution to the mathematical theory of epidemics. Proc. R. Soc. Lond. Ser. A Contain. Pap. A Math. Phys. Character 1927, 115, 700–721. [Google Scholar]
  3. Harko, T.; Lobo, F.S.; Mak, M. Exact analytical solutions of the susceptible-infected-recovered (sir) epidemic model and of the sir model with equal death and birth rates. Appl. Math. Comput. 2014, 236, 184–194. [Google Scholar] [CrossRef]
  4. Cruz-Mendoza, I.; Quevedo-Pulido, J.; Adanaque-Infante, L. Lstm Perfomance Analysis for Predictive Models Based on COVID-19 Dataset. In Proceedings of the 2020 IEEE XXVII International Conference on Electronics, Electrical Engineering and Computing (INTERCON), Lima, Peru, 3–5 September 2020; IEEE: New York, NY, USA, 2020; pp. 1–4. [Google Scholar]
  5. Shastri, S.; Singh, K.; Kumar, S.; Kour, P.; Mansotra, V. Time series forecasting of COVID-19 using deep learning models: India-USA comparative case study. Chaos Solitons Fractals 2020, 140, 110227. [Google Scholar] [CrossRef]
  6. Verma, H.; Mandal, S.; Gupta, A. Temporal deep learning architecture for prediction of COVID-19 cases in India. Expert Syst. Appl. 2022, 195, 116611. [Google Scholar] [CrossRef]
  7. Prasanth, S.; Singh, U.; Kumar, A.; Tikkiwal, V.A.; Chong, P.H. Forecasting spread of COVID-19 using google trends: A hybrid gwo-deep learning approach. Chaos Solitons Fractals 2021, 142, 110336. [Google Scholar] [CrossRef]
  8. Dairi, A.; Harrou, F.; Zeroual, A.; Hittawe, M.M.; Sun, Y. Comparative study of machine learning methods for COVID-19 transmission forecasting. J. Biomed. Inform. 2021, 118, 103791. [Google Scholar] [CrossRef]
  9. Nabi, K.N.; Tahmid, M.T.; Rafi, A.; Kader, M.E.; Haider, M.A. Forecasting COVID-19 cases: A comparative analysis between recurrent and convolutional neural networks. Results Phys. 2021, 24, 104137. [Google Scholar] [CrossRef]
  10. Rguibi, M.A.; Moussa, N.; Madani, A.; Aaroud, A.; Zine-Dine, K. Forecasting COVID-19 transmission with arima and lstm techniques in morocco. SN Comput. Sci. 2022, 3, 1–14. [Google Scholar] [CrossRef]
  11. Ketu, S.; Mishra, P.K. India perspective: Cnn-lstm hybrid deep learning model-based COVID-19 prediction and current status of medical resource availability. Soft Comput. 2022, 26, 645–664. [Google Scholar] [CrossRef]
  12. Jiao, F.; Huang, L.; Song, R.; Huang, H. An improved stl-lstm model for daily bus passenger flow prediction during the COVID-19 pandemic. Sensors 2021, 21, 5950. [Google Scholar] [CrossRef]
  13. Tuli, S.; Tuli, S.; Verma, R.; Tuli, R. Modelling for prediction of the spread and severity of COVID-19 and its association with socioeconomic factors and virus types. Biomed. Res. Clin. Rev. 2020. [Google Scholar] [CrossRef]
  14. Cao, R.-M.; Liu, X.F.; Xu, X.-K. Why cannot long-term cascade be predicted? Exploring temporal dynamics in information diffusion processes. R. Soc. Open Sci. 2021, 8, 202245. [Google Scholar] [CrossRef]
  15. Lai, J.-P. Intervention and Prediction of the Spread of COVID-19 Infectious Disease. Ph.D. Thesis, National Chi Nan University, Taiwan, China, 2021, (unpublished doctoral dissertation). Available online: https://hdl.handle.net/11296/z3gr7k (accessed on 30 May 2021).
  16. Okamura, H.; Osada, Y.; Nishijima, S.; Eguchi, S. Novel robust time series analysis for long-term and short-term prediction. Sci. Rep. 2021, 11, 11938. [Google Scholar] [CrossRef]
  17. Hochreiter, S.; Schmidhuber, J. Long short-term memory. Neural Comput. 1997, 9, 1735–1780. [Google Scholar] [CrossRef]
  18. Hua, Y.; Zhao, Z.; Li, R.; Chen, X.; Liu, Z.; Zhang, H. Deep learning with long short-term memory for time series prediction. IEEE Commun. Mag. 2019, 57, 114–119. [Google Scholar] [CrossRef]
  19. Zeroual, A.; Harrou, F.; Dairi, A.; Sun, Y. Deep learning methods for forecasting COVID-19 time-series data: A comparative study. Chaos Solitons Fractals 2020, 140, 110121. [Google Scholar] [CrossRef]
  20. Chandra, R.; Jain, A.; Singh Chauhan, D. Deep learning via lstm models for COVID-19 infection forecasting in india. PloS ONE 2022, 17, e0262708. [Google Scholar] [CrossRef] [PubMed]
  21. Holland, J.H. Adaptation in Natural and Artificial Systems; The University of Michigan Press: Ann Arbor, MI, USA, 1975. [Google Scholar]
  22. Holland, J.H. Genetic algorithms. Sci. Am. 1992, 267, 66–73. [Google Scholar] [CrossRef]
  23. Armano, G.; Marchesi, M.; Murru, A. A hybrid genetic-neural architecture for stock indexes forecasting. Inf. Sci. 2005, 170, 3–33. [Google Scholar] [CrossRef]
  24. Kostiantis, S. Supervised machine learning: A review of classification techniques. Informatica 2007, 31, 249–268. [Google Scholar]
  25. Bhasin, H.; Bhatia, S. Application of genetic algorithms in machine learning. IJCSIT 2011, 2, 2412–2415. [Google Scholar]
  26. Bouktif, S.; Fiaz, A.; Ouni, A.; Serhani, M.A. Multi-sequence lstm-rnn deep learning and metaheuristics for electric load forecasting. Energies 2020, 13, 391. [Google Scholar] [CrossRef]
  27. Stajkowski, S.; Kumar, D.; Samui, P.; Bonakdari, H.; Gharabaghi, B. Genetic-algorithm-optimized sequential model for water temperature prediction. Sustainability 2020, 12, 5374. [Google Scholar] [CrossRef]
  28. Yu, T.; Zhu, H. Hyper-parameter optimization: A review of algorithms and applications. arXiv 2020, arXiv:2003.05689. [Google Scholar]
  29. Hassanat, A.; Almohammadi, K.; Alkafaween, E.a.; Abunawas, E.; Hammouri, A.; Prasath, V.S. Choosing mutation and crossover ratios for genetic algorithms—A review with a new dynamic approach. Information 2019, 10, 390. [Google Scholar] [CrossRef]
  30. Rudolph, G. Convergence analysis of canonical genetic algorithms. IEEE Trans. Neural Netw. 1994, 5, 96–101. [Google Scholar] [CrossRef]
  31. Katoch, S.; Chauhan, S.S.; Kumar, V. A review on genetic algorithm: Past, present, and future. Multimed. Tools Appl. 2021, 80, 8091–8126. [Google Scholar] [CrossRef]
  32. Kingma, D.P.; Ba, J. Adam: A method for stochastic optimization. In Proceedings of the ICLR 2015-Conference Track Proceedings, San Diego, CA, USA, 7–9 May 2015. [Google Scholar]
  33. Alqahtani, F.; Abotaleb, M.; Kadi, A.; Makarovskikh, T.; Potoroko, I.; Alakkari, K.; Badr, A. Hybrid deep learning algorithm for forecasting sars-cov-2 daily infections and death cases. Axioms 2022, 11, 620. [Google Scholar] [CrossRef]
  34. Hamed, H.; Helmy, A.; Mohammed, A. Holy quran-italian seq2seq machine translation with attention mechanism. In Proceedings of the 2022 2nd International Mobile, Intelligent, and Ubiquitous Computing Conference (MIUCC), Cairo, Egypt, 8–9 May 2022; IEEE: New York, NY, USA, 2022; pp. 11–20. [Google Scholar]
  35. Chen, W.; Wu, H.; Ren, S. Cm-lstm based spectrum sensing. Sensors 2022, 22, 2286. [Google Scholar] [CrossRef]
  36. Wang, Y.; Chen, Z.; Chen, Z. Dynamic graph conv-lstm model with dynamic positional encoding for the large-scale traveling salesman problem. Math. Biosci. Eng. 2022, 19, 9730–9748. [Google Scholar] [CrossRef]
  37. 2019. Available online: https://data.humdata.org/dataset/novel-coronavirus-2019-ncov-cases (accessed on 15 May 2021).
  38. Lewis, C.D. Industrial and Business Forecasting Methods: A Practical Guide to Exponential Smoothing and Curve Fitting; Butterworth-Heinemann: Oxford, UK, 1982. [Google Scholar]
  39. Shen, M.; Yang, J.; Li, S.; Zhang, A.; Bai, Q. Nonlinear hyperparameter optimization of a neural network in image processing for micromachines. Micromachines 2021, 12, 1504. [Google Scholar] [CrossRef] [PubMed]
Figure 1. Long Short-Term Memory neural networks. [20].
Electronics 12 00759 g001aElectronics 12 00759 g001b
Figure 2. LSTM with GA for parameter selection.
Electronics 12 00759 g002
Figure 3. The proposed DULSTMGA model.
Electronics 12 00759 g003
Figure 4. The training dataset, the testing dataset I, the testing dataset II for the DULSTMGA model.
Electronics 12 00759 g004
Figure 5. Forecasting results of dataset I for three countries.
Electronics 12 00759 g005aElectronics 12 00759 g005b
Figure 6. Forecasting results of dataset II for three countries.
Electronics 12 00759 g006aElectronics 12 00759 g006b
Table 1. LSTM models for COVID-19 predictions.
ReferencesScenariosTime Intervals of DataMAPE
[6]Predicting COVID-19
cases in India
30 January 2020 to 10 July 202117.01% (confirmed cases)
[7]Forecasting spread of
COVID-19
24 February 2020 to 20 May 20208.808% (total cumulative cases)
[8]Comparative study for
COVID-19 transmission forecasting
22 January to 6 September 202020.394% (averaged for confirmed and recovered cases)
[5]Prediction and analysis of COVID-19 cases7 February 2020 to 7 July 2020 (USA, confirmed cases);
26 February 2020 to 7 July 2020 (USA, deaths)
10.00% (confirmed cases)
[9]Forecasting COVID-19 cases2 February 2020 to
18 November 2020
8.00% (deaths)
[10]Forecasting COVID-19 transmission22 January 2020 to
22 November 2020
13.33% (confirmed cases)
[11]COVID-19 prediction and current status of medical resource availability30 January to 10 June 202040.98% (confirmed cases)
[12]Prediction during COVID-19 pandemic22 January 2020 to 21 January 202135.94% (deaths)
[13]Modeling for prediction of spread and severity of COVID-197 March 2020 to 22 August 202015.7 % (confirmed cases)
Table 2. Training datasets and testing datasets for three countries.
Datasets/CountriesForecasting ModelsFranceGermanyUnited Kingdom
Training dataLSTMGA DULATMGAFrom 22 January 2020
to 20 March 2021
From 22 January 2020 to 31 March 202122 January 2020
to 20 October 2020
Testing dataset I (1st to 14th day)LSTMGAFrom 21 March 2021
to 3 April 2021
From 1 April 2021 to 14 April 2021From 21 October 2020
to 3 November 2020
Testing dataset II (15th to 28th day)LSTMGA
DULATMGA
From 4 April 2021
to 17 April 2021
From 15 April 2021
to 28 April 2021
From 4 November 2020 to 17 November 2020
Table 3. Measurements and parameters of LSTMGA models for predicting the first day to the fourteenth day into the future.
FranceGermanyUnited Kingdom
MAPE (%)9.4494.6929.261
RMSE53,59012,81536,961
MAE48,54511,13028,186
Parameters of LSTMGA
Dropouts0.170.060.25
Learning rates0.00820.01590.02784
Batch sizes272823
Table 4. Measurements of ARIMA models for predicting the first day to the fourteenth day into the future.
FrenchGermanyUnited Kingdom
ARIMA(p,d,q)ARIMA(1,0,6)ARIMA(6,2,6)ARIMA(4,1,0)
MAPE (%)10.57113.76410.858
RMSE68,543.6237,880.5334,821.33
MAE55,773.4233,412.5932,285.87
Table 5. Ranks of forecasting accuracy of ranges of MAPE values.
Ranges of MAPE Values (%)Ranks
Less than 10Highly accurate prediction
From 10 to 20Good prediction
From 20 to 50Reasonable prediction
Larger than 50Inaccurate prediction
Table 6. Forecasting measurements in France for dataset II.
Performance
Measurements
ARIMALSTMGADULSTMGA
MAPE (%)22.0618.9507.711
RMSE128,907.91115,65253,090
MAE126,251.57109,02044,162
ARIMA(p,d,q)ARIMA(1,0,6)
Parameters of DULSTMGA
Dropouts 0.17
Learning rates 0.0082
Batch sizes 27
Table 7. Forecasting measurements in German for dataset II.
Performance
Measurements
ARIMALSTMGADULSTMGA
MAPE (%)21.6317.79710.572
RMSE66,508.5655,81337,987
MAE64,025.7853,34632,048
ARIMA(p,d,q)ARIMA(6,2,6)
Parameters of DULSTMGA
Dropouts 0.06
Learning rates 0.0159
Batch sizes 28
Table 8. Forecasting measurements in UK for dataset II.
Performance
Measurements
ARIMALSTMGADULSTMGA
MAPE (%)14.8216.1789.628
RMSE52,054.2160,99439,332
MAE51,324.3955,76833,297
ARIMA(p,d,q)ARIMA(4,1,0)
Parameters of DULSTMGA
Dropouts 0.25
Learning rates 0.02784
Batch sizes 23
Disclaimer/Publisher’s Note: The statements, opinions and data contained in all publications are solely those of the individual author(s) and contributor(s) and not of MDPI and/or the editor(s). MDPI and/or the editor(s) disclaim responsibility for any injury to people or property resulting from any ideas, methods, instructions or products referred to in the content.

