Abstract
Dynamic binary instrumentation (DBI) is a technique that enables the monitoring and analysis of software, providing enhanced performance compared to other analysis tools. However, to provide the robust dynamic analysis capabilities, it commonly requires the setup of separate environments for analysis, thereby increasing the contrast with normal execution and the distinctive features that may reveal the presence of the DBI environment. Malware adapts to detect the presence of DBI environments, and it consequently leads to the expansion of the attack surface. In this paper, we provide an in-depth exploration of anti-instrumentation techniques that can be exploited by malware, with a specific focus on the Windows operating system. Leveraging the unique features of the DBI environment, we introduce and categorize DBI detection techniques. Additionally, we conduct a comprehensive analysis of the techniques through the implementation algorithms with bypassing methods for the techniques. Our experiments showcase the effectiveness of these techniques on the latest versions of several DBI frameworks. Furthermore, we address associated concerns with the aim of contributing to the development of enhanced tools to combat malicious activities exploiting DBI and propose directions for future research.
1. Introduction
Nowadays, the scale of damage through various types of attacks is increasing, from using malicious codes and malware to not only steal program information and technology but also to infect computer systems. According to the research, approximately 60 million samples of new malware were discovered on Windows, constituting 96% of all malware found during the last three quarters of the previous year [1]. Furthermore, the number of malicious code instances is exponentially increasing over time, highlighting the growing need for binary analysis methods and tools targeted at these malicious codes. Analysis tools can be classified into static analysis tools and dynamic analysis tools. Static analysis tools can analyze the source code without executing the program but have the disadvantage of being vulnerable to techniques such as binary obfuscation or runtime self-modifying code. On the other hand, dynamic analysis tools can analyze a program while the program is running. It is possible to control and manipulate execution flow by monitoring programs through DBI tools, a representative dynamic analysis tool, and inserting user instructions into the program at runtime. However, malware engages in malicious behavior to evade or disrupt the analysis process, detecting and bypassing analysis environments such as static, dynamic analysis tools and virtual machines [2,3,4].
For users aiming to analyze malware while countering the interference from DBI tools among analysis tools, the transparency of the DBI engine is crucial. To achieve this, approaches ranging from architectural modifications to the development of plugins that render the engine transparent or the integration of tools can be considered. However, these methods demand a profound understanding of the DBI engine and in-depth knowledge of evasion techniques.
In the case of DBI frameworks, they possess various features necessary for providing robust analytical capabilities by constructing and running specialized environments [5,6]. Consequently, DBI frameworks typically need to establish an environment for dynamically analyzing processes, relying heavily on features unique to the DBI environment, including virtual machines, compilers, and code caches, which differ from normal program execution. Detecting the features of a typical DBI environment and the differences from the normal environment makes it possible to identify DBI frameworks in general. Some malware already includes several anti-instrumentation techniques within their code to disrupt analysis tools [7], and the number of anti-instrumentation techniques will increase proportionally with the volume of malicious code. Hence, there is a necessity to analyze DBI detection techniques to prevent malicious activities aimed at interfering with analysis tools and to enhance the security of the analysis environment.
To address these requirements, we not only introduce and analyze DBI environment detection techniques through algorithms based on pseudocode for implementation in Windows but also countermeasures for evasion techniques for each technique. Through these works, we expect to contribute to the improvement of transparency in the DBI environment. Furthermore, through experiments on the latest version of several DBI frameworks operating in the Windows environment, we verify the DBI features that malicious code can detect and validate the effectiveness of the techniques. While there are materials and papers that have implemented some DBI detection techniques, we include techniques that have not been implemented or are non-operational in the current environment from existing implementation. In addition to implementation, there are various methods to distinguish the difference between a program’s normal execution and a DBI framework environment. However, the primary focus of this paper is on identifying techniques that can be applied within the Windows environment and have the potential to be exploited as part of malicious code. Our work comprises a total of 24 DBI detection techniques in the Windows environment, including implementation algorithms for all these techniques.
The structure of the paper is as follows. In Section 2, background knowledge is provided that describes the features of the DBI environments and introduces several DBI frameworks operational in Windows. Section 3 covers the related work. In Section 4, we classify DBI detection techniques based on the features of general DBI environments and provide descriptions and analysis of the techniques using implementation algorithms with countermeasures against each technique. Section 5 discusses the results of the experiments conducted with several DBI frameworks within the Windows environment. Finally, in Section 6, we draw conclusions.
2. Background
In this section, we discuss the features of DBI environments and introduce several DBI frameworks available for Windows environments.
2.1. Features of General DBI Environment
D’Elia et al. [8] suggest that a DBI system can be generally regarded as an application virtual machine that provides monitoring and modification capabilities for instructions and data in user-written components of an analysis tool. In order to establish an environment that allows for the observation and potential modification of the entire architecture state of the target program, a separate execution environment is typically required, and DBI engines in such environments mainly have a common structure.
Through the architecture of a DBI system in Figure 1, it shows the features of the general DBI environment and the execution flow of DBI. It is primarily composed of the target process to be analyzed, a virtual machine for analyzing this process, and the analysis program, which is the DBI tool [9]. Additionally, it provides an API for creating custom DBI tools that specify the code to be instrumented and the instrumentation methods. Typically, the DBI tool is loaded in the form of a shared library for usage. Since the DBI engine does not directly transform the target binary into a process within the virtual machine, the initial process involves fetching the code to be analyzed through a dispatcher and code fetcher and includes the instrumentation code through the instrumentation engine and the DBI tool. The monitored code is compiled by a just-in-time (JIT) compiler, which can translate bytecode into machine code at runtime. This allows DBI to maintain control during execution. The finalized code is executed and analyzed within the code cache.
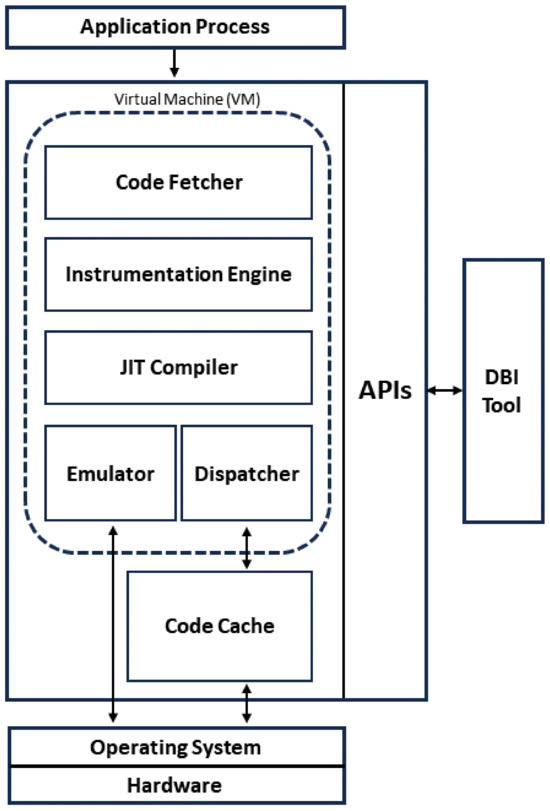
Figure 1.
Architecture of a DBI system.
Due to the features of the DBI environment within the process, not only detecting the DBI features themselves, such as APIs, JIT compiler, and code cache, but also significant differences inevitably arise compared to a normal execution environment, including the runtime overhead, exception handling, memory usage, and more.
2.2. DBI Frameworks
There are prominent DBI frameworks such as Pin [10] and DynamoRIO [11] that support Windows, along with frameworks like Valgrind [12] and Dyninst [13], primarily functioning in Linux environments, with limited or no support for Windows. Furthermore, other frameworks such as Frida [14] and QBDI [15] that interact with target processes are operational on multiple platforms.
In this paper, we present an introduction and analysis of detection techniques targeting Pin and DynamoRIO, especially Pin, which construct DBI environments closed to the common architecture. Additionally, to compare detection rates based on the DBI features, we included Frida as an experimental subject, a framework operating in a Windows environment with relatively different DBI environment and instrumentation processes compared to the previous two frameworks.
2.2.1. Intel Pin
Pin, a DBI framework from Intel, is a binary file analyzer that supports x64 and x86 binaries on Windows, Linux, and macOS. When executing the process of analyzing through a shared library called Pin tool, it is executed using the API provided by Pin. Pin has a structure that gives the executable file to be analyzed and the instrumentation API as input to the virtual machine inside Pin through a JIT compiler and automatically instruments and analyzes it [6]. The information of the program can be dynamically obtained through the analysis code inserted between the program codes, and the code can be changed by the user using C language and the API provided by Pin.
2.2.2. DynamoRIO
DynamoRIO is a binary optimization system, a binary instrumentation tool that helps by manipulating code during runtime when a program runs through code translation, acting as a process virtual machine. DynamoRIO is compatible Windows, Linux, and Android environments, and it has the advantage of not being restricted to callouts and trampoline insertions, unlike many other dynamic tool systems. DynamoRIO also supports interfaces for creating dynamic tools for a variety of applications, including program analysis and understanding, profiling, instrumentation, optimization, and transformation [16].
2.2.3. Frida
Frida has a different structure from other DBI frameworks, where the main operation for DBI is via JavaScript and it operates in a C/S structure. In other words, the framework library is initially injected into the binary to make a pipe, and binary investigation can be conducted while exchanging commands through the pipe [17]. While the previous two frameworks operate alongside the target process by copying it for instrumentation, Frida injects and operates code directly within the target process, leading to significant differences in the DBI environment. It provides JavaScript, C, and Swift APIs to help users acquire information, such as runtime information, data types, and function addresses through APIs, and dynamically analyze applications from various operating systems, such as Windows, macOS/iOS, Linux, Android, and QNX.
3. Related Works
Since the advent of DBI frameworks, various works and research studies have been undertaken by security companies and conferences to explore materials and programs related to detection techniques and methods targeting these DBI frameworks. In this section, we introduce and compare the works and studies on detection techniques specifically designed for DBI frameworks such as Pin and DynamoRIO, aiming to provide a deeper understanding of this topic and emphasize the new contributions and distinctions in the research. The relevant works can be broadly categorized into two main groups: those adopting a practical approach with a focus on the detection methods within the DBI framework itself and those following an academic approach focusing on common features of the DBI environment and the theoretical aspects of detection techniques.
3.1. Practical Approach
With the aim of detecting Pin by leveraging the unique characteristics exclusive to Pin, Falcón et al. [18] introduced the anti-instrumentation techniques employed in the program “eXait”. In this work, Pin is detected through patterns of code and data that persist in memory, attributed to Pin’s pinvm.dll and JIT compiler. The approach also includes checks for Pin’s name within processes and inter process communication (IPC) handles, which are used among processes for exchanging data or the methods and paths associated with it, employed during Pin’s runtime. Furthermore, they suggest a method to differentiate between the instruction pointer (IP) inside the code cache and the actual IP using floating-point unit (FPU) instructions, while also comparing overall execution times.
To preserve the transparency of DynamoRIO, DBI detection case studies based on DynamoRIO were conducted by Li et al. [19]. They detected DynamoRIO’s internal code cache by altering the stack pointer and comparing the sizes of allocated memory or file handles to differentiate between normal and instrumented environments. It also distinguishes differences in signal mask values in Linux and employs other methods, such as finding DynamoRIO’s APIs or triggering exceptions to be handled by different exception handlers from the structured exception handling (SEH), which is the default exception handling mechanism in Windows that handles both hardware and software exceptions.
Rather than focusing on the individual characteristics of Pin or DynamoRIO, as in previous works, the emphasis is on the common features of the DBI environment to detect Pin and DynamoRio. In this regard, Sun et al. [20] mainly categorizes techniques into two methodologies: passive detection utilizing instructions not supported in the DBI environment or application compatibility mode and active detection, which involves unsupported behaviors in DBI environment, checking for the presence of code cache, and DBI’s use of thread local storage (TLS), a memory area individually allocated for each thread, for data storage.
3.2. Academic Approach
The research with an academic approach typically provides detailed categorizations of detection techniques. Kirsch et al. [21] categorize the detection techniques into three groups: code cache/instrumentation artifacts, which detect anomalies arising from differences between the code cache and the general environment; JIT compiler overhead, which identifies overhead resulting from the use of JIT compilers; and finally, environment artifacts, which detect anomalies occurring in the execution environment such as memory traces.
Unlike the prior works that exclusively addressed DBI detection techniques, Polino et al. [7] not only cover detection techniques but also provide a system named Arancino, which includes a set of countermeasures for the categorized anti-instrumentation techniques. The detection techniques are categorized into four types: code cache Artifacts, responsible for differences between the main module of the binary and the memory region where the code cache resides; JIT compiler detection, which looks for process activity related to API calls and page allocations; overhead detection, identifying execution time differences; and environment artifacts, used to differentiate the presence of DBI tools based on variations in the memory layout.
D’Elia et al. conducted a more detailed categorization based on the attack surface, classifying the detection methods into seven categories [8]. Their categories include time overhead, utilizing code execution time comparisons; leaked code pointers, using differences in the actual IP caused by the code cache environments; memory contents and permissions, detecting information exposed by DBI engines sharing address space with analyzed code; DBI engine internals, identifying CPU context exposed for DBI runtime support; interactions with the OS, detecting interactions with the operating system, including process-related information; exception handling, identifying differences due to DBI-specific exception handling; and translation defects, detecting issues related to unsupported instructions or compatibility.
3.3. Discussion
As a practical approach primarily addressing methodologies for detection techniques, Ref. [18] targets Pin, while Ref. [19] focuses on DynamoRIO. Nevertheless, they share a commonality in conducting detection within the shared DBI environment, such as code cache. Ref. [20] expands upon the research from [18,19], introducing detection techniques that emphasize the DBI environment, enabling detection of both DynamoRIO and Pin.
Works under the academic approach do not specifically identify the targeted DBI but reveal differences in categorizing techniques. Refs. [7,21] encompass common classifications such as code cache, JIT overhead, and environment artifacts. Additionally, Ref. [7] includes detection categories for changes caused by JIT compilers and countermeasures for some techniques. Ref. [20] provides the most detailed categorization of detection techniques, including countermeasures similar to those in [7].
In this paper, considering these aspects, we propose a classification of techniques along with implementation algorithms to simultaneously address both practical and academic approaches. This includes the direct nature of techniques through implementation algorithms, allowing for the classification of techniques and proposing countermeasures.
4. DBI Detection Techniques
DBI detection techniques in this article prioritize detecting Intel Pin, which has various common aspects of the DBI environment, and the techniques are categorized based on five characteristics, as illustrated in Figure 2. These categories include “Time Overhead”, which identifies differences in program execution time between DBI and regular execution environments; “Code Cache Artifact”, which pertains to the creation of an independent execution environment called code cache and the execution of internally instrumented code within a DBI framework; “Memory Fingerprints”, which detects fingerprints of DBI left in the memory of processes running in a DBI environment; “JIT Compiler”, which identifies the characteristics of process and code that is transformed and executed in real-time by a just-in-time compiler; and “Environment Artifact”, which detects the presence of DBI by observing situations that can occur both inside and outside the process in the execution environment. Each category includes a total of 24 techniques.
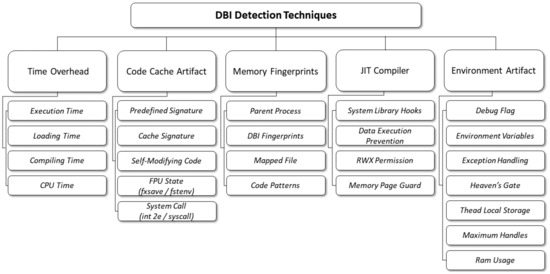
Figure 2.
Classification for DBI Detection Techniques.
4.1. Time Overhead Detection
The most fundamental method for detecting a DBI environment is by comparing the computational cost required for program execution. In other words, this technique leverages the characteristic of runtime overhead that occurs during the instrumentation process in a DBI execution environment compared to when the program is executed directly. It involves measuring the time taken for execution, setting a threshold, and distinguishing the execution environment, making use of instructions or APIs to measure the execution time for detection.
4.1.1. Execution Time
Despite the improved instrumentation performance of the DBI framework, a certain amount of overhead occurs even through small-scale benchmark tests [7]. Therefore, it is possible to detect the DBI environment by calculating the clock number due to the inevitable overhead.
QueryPerformanceCounter is used due to its higher precision and resolution compared to other Windows APIs, providing an elapsed tick count. By calling QueryPerformanceCounter twice and storing the counter values in structure variables in Algorithm 1, the elapsed time can be calculated by the difference between the field values of the variables. This allows for determining the presence of a DBI based on a predefined threshold n.
| Algorithm 1 Execution Time |
| Data: Pointer to a Counter Value () if then end if |
Since this technique calls Windows API and compares its return value with a threshold, if forging the return value is possible, the technique can be bypassed. Therefore, by recognizing the relevant API in the trace, hooking it, and patching the return value with a new one, detection becomes impossible.
4.1.2. Loading Time
In situations where a program is being instrumented while loading a certain number of libraries, it takes significantly more time [18]. Since DBI reuses binary instructions that are initially compiled and analyzed, library loading and unloading are performed faster after the first one. However, this task’s overhead varies depending on the computing power of the CPU and can yield different results based on the framework used. Therefore, by comparing the difference in time taken for library loading and unloading as a ratio, it becomes possible to distinguish execution environments without being influenced by CPU or platform, even when using specific threshold values [21].
In Algorithm 2, commonly used dynamic link libraries (DLL), a file format that dynamically loads and shares the required functions and data for a program, in Windows are loaded and unloaded using the LoadLibraryA and FreeLibrary APIs. The elapsed cycles are measured using the assembly instruction rdtsc through an intrinsic function, capturing the time it takes for two consecutive library loading and unloading operations. The difference in time is then calculated as a ratio for comparison.
| Algorithm 2 Loading Time |
| for to 1 do for to N do end for end for if then end if |
According to [7], Pintool can detect the execution of the rdtsc instruction, and it is possible to apply a user-defined constant and divide the return value of rdtsc. This allows for the alteration of the return value, providing a way to bypass the detection technique.
4.1.3. Compiling Time
DBI saves and reuses trace blocks consisting of consecutive basic blocks in the cache, so a large amount of time is consumed in the process of compiling traces for the first time. When DBI needs to obtain a new trace of the program to be analyzed, the JIT compiler first searches for it in the hash table and recompiles it if the compiled trace does not exist [21], resulting in poor performance during the process.
In Algorithm 3, the time taken from each iteration to the next iteration is stored as a value. Considering the process of recreating the static context before executing the newly created trace in the VM, the maximum value of the values stored is set as the result value. When the measured value deviates significantly from the time measured during normal execution, it is implemented to trigger detection.
| Algorithm 3 Compiling Time |
|
for to N do end for if then end if |
As described earlier, for the DBI detection technique using rdtsc, it is possible to bypass by recognizing rdtsc in the trace and forging the return value.
4.1.4. CPU Time
Since the DBI tool runs programs on its own virtual machine, running cpuid instruction on the guest OS through Intel VT-x requires a process of switching root authority compared to running on the host OS through normal execution [22], which results in consuming more execution time. When the cpuid instruction is executed in the guest OS, it operates in VMX non-root operation mode, necessitating a switch to root authority through a “VM Exit”.
In a VM environment, the time consumed by the authority conversion process increases. Hence, the measurement of time intervals before and after executing the cpuid instruction, as illustrated in Algorithm 4, serves as a detection method.
| Algorithm 4 CPU Time |
|
for to N do end for if then end if |
As described earlier, for the DBI detection technique using rdtsc, it is possible to bypass by recognizing rdtsc in the trace and forging the return value.
4.2. Code Cache Artifact Detection
In the normal execution environment, when running a program, the target binary is loaded directly into a process. In contrast, in the case of DBI, it executes a code cache that includes instrumentation code. In other words, DBI does not load the code directly into memory for immediate execution during runtime. Instead, it caches the original code along with the instrumentation code in a separate cache area and executes that particular region. The distinction in memory regions can be leveraged to detect the DBI environment.
4.2.1. Predefined Signature
Due to the process of caching and executing the code of the target program in memory, when searching for specific code or data from memory using predefined signature values, it results in two searches in the DBI environment, including the portable executable (PE) image, the image of executable file format used in the Windows operating system, and code cache, in contrast to normal execution where it is searched for in the memory only once [20].
In Algorithm 5, predefined signature values are searched for throughout the entire memory, with a threshold for the count of these values to differentiate between the normal execution environment and the DBI environment.
In techniques that involve scanning memory to find allocated pages and searching for unique strings or codes in the DBI environment, specific API calls related to the state of certain memory pages are used during the memory scanning process. In this study, the Windows API, VirtualQuery, is predominantly utilized, and by monitoring and controlling such functions, queries can be detected and managed [7]. Therefore, if one is aware of the memory regions where artifacts related to DBI exist, it is possible to bypass the technique by preventing the detection or alteration of those artifacts during the memory scanning process.
| Algorithm 5 Predefined Signature |
| Data: Predefined Signature () for to N do if then end if end for if then end if |
4.2.2. Cache Signature
In the case of Pin, it caches the code of the target program in the memory and, as a result, can detect the presence of DBI while running by searching for the signatures in the cached memory [20].
Since Pin’s signature values are stored at the beginning address of each page, the memory is sliced into pages for internal searching as in Algorithm 6, and if a signature is found at each corresponding address, the count is incremented. As this signature value is unique to Pin, setting the threshold to 0 confirms the presence of a DBI if any one of them is detected.
| Algorithm 6 Cache Signature |
| Data: Current Memory Pages () for to N do if 0xFEEDBEAF then end if end for if then end if |
As described above, for detection techniques that require memory scanning, bypassing the techniques can be achieved by managing the accessible memory regions.
4.2.3. Self-Modifying Code
DBI tools, in order to analyze a program, do not load the code directly into memory during execution but cache it separately for instrumentation purposes before execution. Consequently, in a DBI environment, if the code is modified at runtime, DBI ends up executing the code that remains unchanged in the cached area.
In Algorithm 7, modifications are made to the code that are executed after the currently executing code. It begins by obtaining the address of the presently executing instruction and then defines the location of the code to be altered by adding an offset. Subsequently, it creates code to overwrite the new code at the specified address. The value stored at that location is checked, and if the code is not modified, it is considered to be executed from within the cache.
| Algorithm 7 Self-Modifying Code |
|
+ 0x9 0xABABABAB 0xFFFFFFFF if 0xABABABAB then end if |
Monitoring the memory write instructions enables the detection of instruction modifications during runtime. Consequently, by forcing the application of modified code in the code cache of the DBI environment, the technique can be bypassed. Additionally, using the Pin option ‘smc_strict’ initiates the monitoring for blocks that modify their own code. Upon detection, Pin triggers a code cache invalidation alert, followed by recompiling the existing code in the code cache. Through these methods, detection can be bypassed.
4.2.4. FPU State (Fxsave/Fstenv)
DBI only executes the measured and translated code within the cache, which means that to maintain compatibility with the program, it attempts to mask the VM’s IP value to the actual IP value of the executing program whenever necessary [15]. Therefore, by using the method of storing FPU status in memory through FPU instructions, it is possible to retrieve the unmasked IP value.
There are two FPU state retrieval instructions that can be used to implement this technique, which are fstenv and fxsave. Since the implementation mechanism is nearly identical, we only explain the algorithm using the fstenv instruction.
In Algorithm 8, when executing the FPU instruction fldz and then the fstenv instruction, the FPU state is stored in the stack. From the stack, it retrieves the IP value of the executed FPU instruction. The IP value obtained from the stack is not masked, and it represents the same actual IP value regardless of the execution environment. Therefore, it is compared with the current instruction location address within the cache to distinguish the cache environment.
| Algorithm 8 FPU State |
|
0x1C] 0x10] if then end if |
When monitoring and detecting the execution of instructions in the returning FPU state, it is possible to bypass the detection technique by replacing the IP register value in memory from the cache address to the actual address of the code.
4.2.5. System Call (Int 2e/Syscall)
When executing a system call using an instruction, the current instruction pointer value, before accessing the kernel, is copied to a specific register, and the return is made from the kernel to the previously saved address. In contrast, in the case of execution within a DBI environment, such as emulating all system calls performed by the application outside of the VM, it is necessary to save the program’s register state before terminating the VM [23]. Consequently, specific register values in the application remain unchanged, and the values stored before the system call execution are preserved as is.
The instructions for system call include int 2e in 32-bit and syscall in 64-bit environments. The difference is that int 2e stores the IP value in the EDX register, while syscall stores it in the RCX register. Other than this distinction, the implementation mechanism is almost identical. Therefore, we only explain the algorithm for the syscall instruction.
By placing an arbitrary value into the RCX register, such as 0 × 0, and inserting the desired number of a system call into RAX, we then invoke the system call through an instruction in Algorithm 9. In a normal execution environment, after the syscall, RCX contains the return address. However, in a DBI environment, where there is no change in the original value, the determination is based on whether the value of RCX is 0x0 or the restored IP value.
| Algorithm 9 System Call |
|
0x0 0xN if 0x0 then end if |
Similar to the FPU state detection technique, detecting the execution of system call instructions and modifying the value stored in the RCX register, where the return value is stored, to the actual address, can bypass the detection.
4.3. Memory Fingerprints Detection
The memory fingerprints detection is a technique that searches for fingerprints left in memory related to DBI. It allows the detection of the DBI environment through exposed information from the DBI tool as the parent process of the process to be analyzed or by identifying the data or code patterns stored in the memory for analysis.
4.3.1. Parent Process
First, we obtain the PID of the current process from the process entry as in Algorithm 10. Using the PID, we retrieve the path of the parent process and compare it to check if the filename matches the name of the DBI tools.
| Algorithm 10 Parent Process |
| Data:
Process Entry (), Current Process ID () if then if or then end if end if |
It can be bypassed by altering the data containing the name of the parent process. For instance, in the case of Pin, changing the string “pin.exe” to another string would suffice.
4.3.2. DBI Fingerprints
In the case of programs analyzed under the DBI environment, there are features where the parent process loads the DBI tool and specific DLLs. The PE structure of the DBI tool and DLLs includes exported functions, section names, and more [18,19]. However, attempting to detect DBI based solely on the DLL name is unreliable because the name can change. Therefore, it is possible to scan the memory where the DLL binary is loaded to find DBI-related fingerprints.
By searching the memory page regions of the parent process at the page level, as in Algorithm 11, if specific strings associated with the DBI tools and DBI libraries are found, it is considered that the program is undergoing analysis by DBI.
| Algorithm 11 DBI Fingerprints |
| Data:
Memory Pages of Parent Process () for in do while do if is in then end if end while end for if then end if |
As a specific method to bypass this technique, monitoring the memory scan APIs or system calls before specific strings are searched and compared and pre-checking the values passed as parameters to bypass them is one approach [24]. Additionally, as a comprehensive method, it seems possible to control memory searches by hooking functions such as OpenProcess, which are invoked during the process of obtaining handles to inspect the memory space of the parent process.
4.3.3. Mapped File
Depending on the operating system, there are cases where a file storing the memory mapping information of a process is created when the process is loaded into memory [23]. However, in the case of Windows, the information is not saved as a separate file, allowing the retrieval of process memory mapping details to detect if a DBI is mapped.
When searching for the name of a DBI in the current process’s memory at the page level, as in Algorithm 12, it may find a string that includes the name. However, since even processes not analyzed by DBI can also have this string in the memory, an appropriate threshold n is set to distinguish between regular execution and execution in a DBI environment.
| Algorithm 12 Mapped File |
| Data:
Memory Pages of Current Process (), Name of DBI System () while do if is in then end if end while if then end if |
As described earlier, monitoring parameters from API calls or system calls related to memory scans enables bypassing detection through comparison with specific values.
4.3.4. Code Patterns
Processes undergoing analysis by DBI may contain specific code patterns [18]. DBI saves the current VM context on the stack and restores the registers of the program being analyzed, during which a unique specific code pattern required for this operation is identified.
It identifies the DBI environment in Algorithm 13 by searching for particular code patterns in the memory of the current process and applying a threshold count.
| Algorithm 13 Code Patterns |
| Data:
Specific Code Pattern (), Memory Pages of Current Process () while do if is in then end if end while if then end if |
As described earlier, monitoring parameters from API calls or system calls related to memory scans enables bypassing detection through comparison with specific values.
4.4. JIT Compiler Detection
One of the components in the DBI environment, the JIT compiler, compiles the code of the provided application as input to optimize it for storage and execution within a code cache. During this process, the JIT compiler hooks into system calls and libraries and accesses memory to properly adjust memory permissions. Detecting these processes can be used to distinguish the presence of DBI.
4.4.1. System Library Hooks
The DBI engine modifies certain functions within system libraries through hooking to maintain control of the application. In the case of Pin, to transfer control to the VM monitor, intercepting system calls at the instruction is needed [25]. These low-level API hooks are implemented by the JIT compiler and can be found at the beginning of modified functions, making it possible to inspect them and detect the DBI environment.
At the beginning of specific functions, a jump instruction overwrites the entry points as trampolines in the ntdll.dll system library and jumps to the corresponding event dispatchers by executing those functions from the code cache. The presence of jmp instructions (0xE9), as illustrated in Algorithm 14, can be checked to confirm the existence of the JIT compiler. It is possible to bypass by hooking the API or system call used to verify instructions at specific memory addresses, altering the return value to produce different results.
| Algorithm 14 System Library Hooks |
| Data:
Handle of NTDLL () for to N do if 0xE9 then end if end for if then end if |
4.4.2. Date Execution Protection
Data execution prevention (DEP) is a system-level feature that restricts the execution of specific memory pages such as the heap, stack, and memory pool. Executing code within that address space triggers DEP, leading to exceptions [18]. However, in the case of DBI, it demands various permissions, preventing DEP from activation.
In Algorithm 15, the process involves storing the assembly instructions to be executed, setting the access type for the memory allocated by VirtualAlloc as read/write and copying the stored instructions to that memory. The differentiation in the DBI environment is determined by whether exceptions occur when calling this memory.
According to [24], PinVMShield provides a countermeasure for memory region permission inconsistencies. It creates a table to record all events such as allocation, deallocation, memory permission changes, or any events that can alter the address space. Through this table, it monitors memory access. If a violation is detected, it enables evasion, such as triggering exceptions.
| Algorithm 15 Data Execution Prevention |
|
0x90, 0x90, 0x90, 0xC3} …, PAGE_READWRITE) try: except: |
4.4.3. RWX Permission
The characteristic feature of a JIT engine is the presence of pages with read, write, and execute permissions. The compiler records pre-compiled instructions in memory through the VM. Therefore, compared to the scarcity of memory regions marked as RWX in a normal execution environment, the code cache in a JIT engine has a larger number of memory pages with RWX permissions [18].
When using the VirtualQueryEx function to examine the pages within the virtual address space of a specified process, if the memory allocated at valid addresses with RWX permissions is detected, the count is incremented, as in Algorithm 16.
| Algorithm 16 RWX Permission |
| Data:
Current Process Handle (), Memory Basic Information Structure () while do if PAGE_EXECUTE_READWRITE then end if end while if then end if |
As described above, it becomes possible to bypass the technique by monitoring and detecting memory region permission inconsistencies.
4.4.4. Memory Page Guard
According to [8], DBI has the capability to bypass the deactivation (PAGE_NOACCESS) and protection (PAGE_GUARD) of memory page access permissions, enabling the execution of code in memory pages without code execution permissions. Therefore, if the target program performs actions that violate these permissions and continues to operate without any exceptions, it can be identified as a DBI environment.
In Algorithm 17, the process involves allocating memory space and applying execution, read, and write permissions, along with the page guard protection option, to the allocated memory pages. The page guard option triggers an exception when the page is initially accessed, and since the page guard status is subsequently deactivated, the detection of DBI is achieved based on the occurrence of exceptions when the page is executed.
As described above, it becomes possible to bypass the technique by monitoring and detecting memory region permission inconsistencies.
| Algorithm 17 Memory Page Guard |
|
…, PAGE_EXECUTE_READWRITE) 0xC3 , …, PAGE_EXECUTE_READWRITE | PAGE_GUARD, …) try: except: |
4.5. Environment Artifact Detection
Environment artifacts, including interactions with OS, exception handling, and more, have the most varied detection targets in the DBI environment.
4.5.1. Debug Flag
There are several native APIs that offer anti-debugging measures, and among them, the API targeting process, NtQueryInformationProcess, allows for the identification of an environment under analysis by a DBI as being in a debugging state using the debug flag value [26].
By placing 0 × 1F, representing ProcessDebugFlags, in the second parameter of the NtQueryInformationProcess, as in Algorithm 18, it allows for the determination of the debugging state based on the return value, consequently revealing the DBI environment.
If the API or system call that checks the debugging state is hooked to modify the parameter or return value, it becomes possible to bypass the technique.
| Algorithm 18 Debug Flag |
| Data:
Current Process Handle () 0x1F if then end if |
4.5.2. Environment Variables
DBI employs specific environment variables during its execution. DBI frameworks, through the creation of the program to be analyzed as their child process, enable the analyzing process to access these environment variables in the memory allocated by the process under analysis.
In Algorithm 19, the count is increased by calling the GetEnvironmentVariable with the name of the target process environment variable as an argument and verifying that the return value is not equal to zero.
It becomes possible to bypass the technique if the API that checks the environment variables is hooked to modify the parameter or return value. Furthermore, according to [21], in the case of Pin, it is considered possible to bypass this method by cleaning up variables during the initialization process.
| Algorithm 19 Environment Variables |
| Data:
Environment Variables () for in do if then end if end for if then end if |
4.5.3. Exception Handling
There are exceptions that DBI cannot handle properly. For example, when a single step exception occurs due to changing the CPU to single step mode via the trap flag of EFLAGS in a typical environment, Windows utilizes its exception handling mechanism, known as SEH, to manage it, whereas DBI employs its own exception handling approach [26].
Since there is no specific instruction to modify EFLAGS, the trap flag value of EFLAGS can be altered to 1 using the stack as in Algorithm 20, which, in turn, changes the CPU to single step mode. While executing instructions in single step mode, exceptions occur, and in handling these exceptions, DBI distinguishes whether SEH is invoked or not.
| Algorithm 20 Exception Handling |
|
try: 0x100 except: |
In the case of Pin, by adding a feature to disable exception handling through plugin code, it becomes possible to bypass it.
4.5.4. Heaven’s Gate
DBI and system emulators may have defects and limitations in the process of translating machine code [20]. For example, in an ×64 environment, when a 32-bit program is executed, there is a technique called “Heaven’s Gate” that allows the process to execute ×64 assembly code instead of ×86 assembly. DBI fails to execute this properly in some cases.
In Algorithm 21, the retf instruction (0xCB) is used to push the value 0 × 33 into the stack, along with the code segment (CS) register value, representing the 64-bit native mode. Then, it calls the address of the retf instruction, pushing the current IP onto the stack. Consequently, by changing the CS register value to 0 × 33, it executes the retf instruction, allowing execution in the ×64 assembly code. Detection is determined based on whether exceptions occur or not.
| Algorithm 21 Heaven’s Gate |
| try: 0xCB0033 except: |
4.5.5. Thread Local Storage
Thread local storage, which allows each thread to have its unique storage space, may lead to the expectation of additional storage usage in the parent process when the program being analyzed is executed by DBI. Using TLS, a process can be accessed using global indices, and values allocated in one thread can be accessed by other threads through the index of the respective value [20]. This allows us to identify the additional TLS usage by DBI.
In Algorithm 22, it iterates through all TLS indices via TLS functions to check if data exist in the storage space and detects DBI based on the number of storage spaces in use.
Based on the fact that interactions with TLS occur through OS APIs, Ref. [24] employs a method of redirecting any attempts to read or write to TLS to different locations to circumvent the technique. Moreover, in the case of Pin, it seems possible to bypass by using a plugin program to set the value of TLS slots to 0, making it appear as if TLS is not being used.
| Algorithm 22 Thread Local Storage |
| Data:
Index of Thread Local Storage () for to N do if then end if end for if then end if |
4.5.6. Maximum Handles
Due to differences in the handles used between processes analyzed by DBI and the normal execution environment, the number of handles also varies [19].
All handles from the current process are duplicated in Algorithm 23. When the function’s return value becomes 0, indicating that no more handles can be copied, it calculates the maximum handle count. This is used as a threshold to differentiate the handle count in the execution environment.
| Algorithm 23 Maximum Handles |
| Data:
Current Process Handle () (NULL, …) for to N do if then end if end for if then end if |
It seems possible to bypass the technique by creating a counter for the number of process handles in a normal environment and hooking the API that returns the handle’s status to make the results consistent with those in a normal environment.
4.5.7. Ram Usage
DBI may lead to increased RAM usage compared to regular execution due to activities such as instrumentation, tracing, logging, data collection, and analysis required for analyzing processes.
First, it retrieves the memory information of the current process, accesses the process memory counters structure, and measures the memory usage. It then distinguishes the in-use RAM size based on a predefined threshold in Algorithm 24.
| Algorithm 24 Ram Usage |
| Data:
Process Memory Counters Structure (), Current Process Handle () (PROCESS_MEMORY_COUNTERS*) if then end if |
It seems possible to bypass by hooking the API that returns memory-related information and modifying the parameters and return values.
5. Discussions
Experiments were conducted to determine whether the distinction between a regular execution environment and a DBI environment could be established using the previously mentioned DBI detection techniques. The executables, including evasion techniques, were built using Visual Studio 2022, and the experiments were conducted on Windows 10 21H2, targeting Pin 3.27, DynamoRIO 10.0.0, and Frida 16.0.18. The executable was built for both 32-bit and 64-bit, but notably, since the Heaven’s Gate technique is applicable only to 32-bit programs, the experiments were performed only on 32-bit executable for Heaven’s Gate. There are also differences in register names due to the transition from 32-bit to 64-bit.
The experimental results for the 24 techniques provided in Table 1 with the checkmark indicates the unveiling of the DBI framework by the technique. As this work primarily aimed to detect the features of the Pin DBI environment, it is evident that all techniques confirm the detection of Pin. In the case of DynamoRIO, which shares common features of the DBI environment with Pin, 19 of the techniques successfully detected it, while Frida, which operates within the target process by injecting and executing code, could only be detected by 7 of the techniques, due to the lack of common DBI features, unlike the previous two frameworks. While the detection rate for Frida was low in the experimental results, there is always the potential for an expanded attack surface when focusing primarily on features of the Frida environment.

Table 1.
Experimental Result for Detection Techniques.
We implement and provide algorithms for the existing techniques that currently go undetected, as well as techniques that have not been implemented for the purpose of DBI detection and those implemented in non-Windows operating systems. All of these techniques are designed to operate and be detectable in both Windows and the latest DBI framework environments. Through this effort, we can ensure compatibility with various DBI techniques in the latest environments and contribute to enhancing the transparency of DBI environments through the utilization of these techniques.
Most detection techniques rely on threshold values to detect the DBI environment, leading to a higher risk of false positives and false negatives in the experimental results. Particularly in the case of overhead detection methods based on execution time, the result values vary for each execution, and the execution time differs based on the environment. This diversity introduces concerns about setting inappropriate threshold values, which can lead to inaccurate detection outcomes.
For example, when there is a significant difference between result values, finding an appropriate threshold is relatively straightforward. However, when the results exhibit similarity, it becomes necessary to conduct multiple experiments to derive average values or employ methods such as calculating ratios. Considering the uncertainty of experiments, adjusting the threshold values and iteratively fine-tuning the experiments is essential to obtain accurate results. It is anticipated that through such adjustments, the reliability of experiments can be enhanced, contributing to increased accuracy in result interpretation.
The results imply that DBI systems still have a significant exposure to malicious code and are susceptible to exploitation at any given time. It already has been revealed that a large volume of malware is equipped with anti-instrumentation techniques [7], and also, software protection tools such as VMProtect, Obsidium, and ACProtect can detect and bypass the DBI environment and exploit vulnerabilities within the DBI system [4]. Furthermore, the increase in configuration components for enhancing analytical capabilities may inadvertently expand the attack surface, necessitating security precautions.
As a response to these issues, open-source anti-instrumentation tools implementing countermeasures against some of the DBI framework detection techniques exist, such as Arancino [7] and PinVMShield [24]. We recognize the need for improving and expanding these tools to build a robust system. Furthermore, the technological advancement of the DBI framework, including memory protection and access control technologies, is a critical component in strengthening the DBI architecture. Since identifying vulnerabilities leads directly to their prevention and enhancement, the necessity for a wide range of detection techniques and a high detection rate is essential. Therefore, we believe that our research contributes to the field of security by addressing vulnerabilities in DBI systems and assisting users in mitigating these issues.
The priority of enhancement in this study is as follows:
- (1)
- Detection techniques targeting other operating systems: While this research introduces and implements techniques targeting Windows, the most accessible and frequently targeted OS for malicious activities, there is a need to extend these techniques to accommodate OS-specific features. This is particularly relevant due to the existence of commands and functions supported exclusively in Linux environments.
- (2)
- Experiments targeting various DBI frameworks: As the current techniques are tailored for Windows, the experiments are limited to DBI frameworks operating on this platform. However, by expanding the scope beyond a specific OS, the experiments can encompass a broader array of DBI frameworks. This approach would provide a more comprehensive understanding of the effectiveness of the techniques across different environments.
- (3)
- Concrete countermeasures and their integration: Given that multiple DBI detection techniques may coexist within a program, it is crucial to develop specific and combinable countermeasures. These countermeasures, when integrated, should be capable of detecting each technique individually. This approach facilitates more efficient experiments while minimizing potential errors.
6. Conclusions
In the software reverse engineering process, malware and obfuscation tools (protectors) equipped with anti-reversing techniques that delay and disrupt program analysis can lead to deviations from the normal program execution flow or even its abrupt termination, causing potential exploitation issues. Among the reverse engineering tools, the DBI system is a powerful tool in the field of security, providing valuable analytical techniques by dynamically manipulating and analyzing programs. However, DBI is also susceptible to exposure by attackers, and understanding and preparing for these threats is crucial.
In this paper, the features of the DBI environment that can be exposed by attackers were identified, and based on this, the techniques for detecting DBI were classified. In addition, implementation algorithms were provided with detection techniques to analyze and understand the techniques, and their effectiveness was demonstrated by conducting experiments in the latest versions of DBI frameworks.
Consequently, while we were not able to analyze detection techniques for all features of the various DBI frameworks or DBI environments, it seems that practical measures to counter anti-instrumentation can be devised in a way to strengthen the DBI environment through the proposed approach in this paper. As discussed earlier, DBI systems can be vulnerable due to distinctive artifacts and implementation flaws, and efforts to protect against malicious code and adversarial attacks can be enhanced through the research and development of new detection methods, collaboration, and knowledge sharing. In the future, we plan to conduct an analysis and implementation of countermeasures for the discovered detection techniques.
Author Contributions
Conceptualization, S.P.; Software, S.P.; Investigation, S.P.; Writing—original draft, S.P.; Supervision, Y.P. All authors have read and agreed to the published version of the manuscript.
Funding
This research received no external funding.
Data Availability Statement
Data are contained within the article.
Conflicts of Interest
The authors declare no conflicts of interest.
Abbreviations
The following abbreviations are used in this manuscript:
| DBI | Dynamic binary instrumentation |
| API | Application programming interface |
| JIT | Just-in-time |
| C/S | Client/Server |
| IPC | Inter process communication |
| IP | Instruction pointer |
| FPU | Floating point unit |
| SEH | Structured exception handling |
| TLS | Thread local storage |
| DLL | Dynamic link library |
| VM | Virtual machine |
| PE | Portable executable |
| DEP | Data execution Protection |
| CS | Code segment |
| RAM | Random access memory |
References
- Ruth, C. Over 95% of All New Malware Threats Discovered in 2022 Are Aimed at Windows. Available online: https://atlasvpn.com/blog/over-95-of-all-new-malware-threats-discovered-in-2022-are-aimed-at-windows (accessed on 2 April 2023).
- Chen, X.; Andersen, J.; Mao, Z.M.; Bailey, M.; Nazario, J. Towards an understanding of anti-virtualization and anti-debugging behavior in modern malware. In Proceedings of the 2008 IEEE International Conference on Dependable Systems and Networks With FTCS and DCC (DSN), Anchorage, AK, USA, 24–27 June 2008; pp. 177–186. [Google Scholar] [CrossRef]
- Branco, R.R.; Barbosa, G.N.; Neto, P.D. Scientific but Not Academical Overview of Malware Anti-Debugging, Anti-Disassembly and Anti-VM Technologies. Black Hat 2012, 1, 1–27. [Google Scholar]
- Lee, Y.B.; Suk, J.H.; Lee, D.H. Bypassing Anti-Analysis of Commercial Protector Methods Using DBI Tools. IEEE Access 2021, 9, 7655–7673. [Google Scholar] [CrossRef]
- Nicholas, N.; Seward, J. Valgrind: A Framework for Heavyweight Dynamic Binary Instrumentation. ACM SIGPLAN Notices 2007, 42, 89–100. [Google Scholar] [CrossRef]
- Chi-Keung, L.; Cohn, R.; Muth, R.; Patil, H.; Klauser, A.; Lowney, G.; Wallace, S.; Reddi, V.J.; Hazelwood, K. Pin: Building Customized Program Analysis Tools with Dynamic Instrumentation. ACM SIGPLAN Notices 2005, 40, 190–200. [Google Scholar] [CrossRef]
- Polino, M.; Continella, A.; Mariani, S.; D’Alessio, S.; Fontata, L.; Gritti, F.; Zanero, S. Measuring and defeating anti-instrumentation-equipped malware. In Detection of Intrusions and Malware, and Vulnerability Assessment; Springer: Berlin/Heidelberg, Germany, 2017; pp. 73–96. [Google Scholar] [CrossRef]
- D’Elia, D.C.; Coppa, E.; Nicchi, S.; Palmaro, F.; Cavallaro, L. SoK: Using dynamic binary instrumentation for security (And how you may get caught red Handed). In Proceedings of the 2019 ACM Asia Conference on Computer and Communications Security, Auckland, New Zealand, 9–12 July 2019; pp. 15–27. [Google Scholar] [CrossRef]
- Dennis, A. Practical Binary Analysis: Build Your Own Linux Tools for Binary Instrumentation, Analysis, and Disassembly; No Starch Press: San Francisco, CA, USA, 2019; pp. 225–235. ISBN 9781593279127. [Google Scholar]
- Pin—A Dynamic Binary Instrumentation Tool. Available online: https://www.intel.com/content/www/us/en/developer/articles/tool/pin-a-dynamic-binary-instrumentation-tool.html (accessed on 2 April 2023).
- DynamoRIO. Available online: https://dynamorio.org/ (accessed on 2 April 2023).
- Nethercote, N.; Seward, J. Valgrind: A Program Supervision Framework. Electron. Notes Theor. Comput. Sci. 2003, 89, 44–66. [Google Scholar] [CrossRef]
- Ravipati, G.; Bernat, A.R.; Rosenblum, N.; Miller, B.P.; Hollingsworth, J.K. Toward the Deconstruction of Dyninst. 2007. Available online: https://api.semanticscholar.org/CorpusID:13327102 (accessed on 2 April 2023).
- FRIDA. Available online: https://frida.re/ (accessed on 2 April 2023).
- QBDI. Available online: https://qbdi.quarkslab.com/ (accessed on 2 April 2023).
- Bruening, D.; Garnett, T.; Amarasinghe, S. An infrastructure for adaptive dynamic optimization. In Proceedings of the International Symposium on Code Generation and Optimization, San Francisco, CA, USA, 23–26 March 2003; pp. 265–275. [Google Scholar] [CrossRef]
- Császár, I.-A.; Slavescu, R.R. Building fast and reliable reverse engineering tools with Frida and Rust. In Proceedings of the 2022 IEEE 18th International Conference on Intelligent Computer Communication and Processing (ICCP), Cluj-Napoca, Romania, 22–24 September 2022; pp. 289–294. [Google Scholar] [CrossRef]
- Falcón, F.; Riva, N. Dynamic Binary Instrumentation Frameworks: I Know You’re There Spying on Me. Recon. 2012. Available online: https://recon.cx/2012/schedule/events/216.en.html (accessed on 24 April 2023).
- Li, X.; Li, K. Defeating the transparency features of dynamic binary instrumentation. In Proceedings of the Black Hat USA, Las Vegas, NV, USA, 2–7 August 2014. [Google Scholar]
- Sun, K.; Li, X.; Ou, Y. Break out of the truman show: Active detection and escape of DBI. In Proceedings of the Black Hat Asia, Marina Bay Sands, Singapore, 29 March–1 April 2016. [Google Scholar]
- Kirsch, J.; Zhechev, Z.; Bierbaumer, B.; Kittel, T. PwIN—Pwning intel piN: Why DBI is unsuitable for security application. In ESORICS; Springer: Berlin/Heidelberg, Germany, 2018; p. 11098. [Google Scholar] [CrossRef]
- Pék, G.; Bencsáth, B.; Buttyán, L. nEther: In-guest detection of out-of-the-guest malware analyzers. In Proceedings of the Fourth European Workshop on System Security, New York, NY, USA, 10 April 2011. [Google Scholar] [CrossRef]
- Zhechev, Z. Security Evaluation of Dynamic Binary Instrumentation Engines. Master’s Thesis, Department of Informatics, Technical Universtity of Munich, Munich, Germany, 2018. [Google Scholar]
- Filho, A.S.; Rodríguez, R.J.; Feitosa, E.L. Reducing the attack surface of dynamic binary instrumentation frameworks. Proc. Dev. Adv. Def. Secur. 2020, 152, 3–13. [Google Scholar] [CrossRef]
- Skaletsky, A.; Devor, T.; Chachmon, N.; Cohn, R.; Hazelwood, K.; Vladimirov, V.; Bach, M. Dynamic program analysis of Microsoft Windows applications. In Proceedings of the 2010 IEEE International Symposium on Performance Analysis of Systems & Software (ISPASS), White Plains, NY, USA, 28–30 March 2010; pp. 2–12. [Google Scholar] [CrossRef]
- Park, J.; Jang, Y.; Hong, S.; Park, Y. Automatic detection and bypassing of anti-debugging techniques for microsoft windows environments. Adv. Electr. Comput. Eng. 2019, 19, 23–29. [Google Scholar] [CrossRef]
Disclaimer/Publisher’s Note: The statements, opinions and data contained in all publications are solely those of the individual author(s) and contributor(s) and not of MDPI and/or the editor(s). MDPI and/or the editor(s) disclaim responsibility for any injury to people or property resulting from any ideas, methods, instructions or products referred to in the content. |
© 2024 by the authors. Licensee MDPI, Basel, Switzerland. This article is an open access article distributed under the terms and conditions of the Creative Commons Attribution (CC BY) license (https://creativecommons.org/licenses/by/4.0/).