
Unveiling Acoustic Cavitation Characterization in Opaque Chambers through a Low-Cost Piezoelectric Sensor Approach


1
CMEMS-UMinho—Centre for Microelectromechanical Systems, University of Minho, Campus of Azurém, 4800-058 Guimarães, Portugal
2
CTAC—Centre for Territorry, Environment and Construction, University of Minho, Campus of Azurém, 4800-058 Guimarães, Portugal
*
Author to whom correspondence should be addressed.
Electronics 2024, 13(8), 1581; https://doi.org/10.3390/electronics13081581
Submission received: 21 March 2024
/
Revised: 7 April 2024
/
Accepted: 18 April 2024
/
Published: 20 April 2024
(This article belongs to the Special Issue Innovations in Digital and Analog Electronic Systems for Next-Generation Devices)
Abstract
:This study investigates the characterization of acoustic cavitation in a water-filled, opaque chamber induced by ultrasonic waves at 20 kHz. It examines the effect of different acoustic radiator geometries on cavitation generation across varying electrical power levels. A cost-effective piezoelectric sensor, precisely positioned, quantifies cavitation under assorted power settings. Two acoustic radiator shape configurations, one with holes and another solid, were examined. The piezoelectric sensor demonstrated efficacy, corroborating with existing literature, in measuring acoustic cavitation. This was achieved through the Fast Fourier Transform (FFT) analysis of voltage data, specifically targeting sub-harmonic patterns, thereby providing a robust method for cavitation detection. Results demonstrate that perforated geometries enhance cavitation intensity at lower power levels, while solid shapes predominantly affect cavitation axially, exhibiting decreased activity at minimal power. The findings recommend using two different shape geometries on the acoustic radiator for efficient cavitation detection, highlighting intense cavitation on radial walls and cavitation generation on the bottom. Due to the stochastic nature of cavitation, averaging data is critical. The spatial limitation of the sensor necessitates prioritizing specific areas over complete coverage, with multiple sensors recommended for comprehensive cavitation pattern analysis.
1. Introduction
Acoustic cavitation relies on high-frequency sound waves emitted through a liquid medium [1]. These waves, generated by ultrasound devices, induce alternating compressive and tensile phases in the liquid, promoting the formation and expansion of bubbles [2]. The cavitation event occurs during the rarefaction phase, characterized by a negative pressure environment. In this phase, the negative pressure exceeds a critical threshold, causing the separation of liquid molecules when the distance between them surpasses a critical value. This critical point, referred to as the threshold, marks the moment when molecule distance becomes extensive enough to trigger bubble formation [1,3,4].
Acoustic cavitation manifests in transient and stable forms [2]. Transient cavitation, occurring for a limited number of cycles, efficiently triggers chemical reactions, mainly on the range of kHz [5]. In contrast, and on the range of MHz, stable cavitation involves consistent bubble oscillations, leading to micro-streaming, commonly applied in medical applications such as ultrasound imaging and drug delivery [2].
During transient cavitation, residual bubbles rise to the liquid interface, serving as a degassing method. This is observed in moderately-sized bubbles, inducing robust micro-streaming flow [2]. Transient cavitation involves gas-filled bubbles undergoing erratic oscillations and rapid implosion, resulting in elevated local temperatures, pressures, and shear forces capable of disintegrating biological cells or organic materials [2].
Studying and monitoring acoustic cavitation, mainly transient cavitation in water, involves two main mechanisms. According to Verhaagen et al. [6] and Zhu et al. [7], the measurements of cavitation phenomena can be distinguished based on primary or secondary effects of acoustic cavitation. Primary effects include pressure and temperature, while the measurement of secondary effects relies on chemical and physical methods based on measurements of the formation of radicals, oxidation reactions, electrochemical effects, and mass transfer coefficients [7].
Sutkar et al. [8] categorize the observable effects of acoustic cavitation in their research, enabling the assessment of cavitation by understanding these effects. Wu et al. [9] classify cavitation detection into mechanical [10,11], optical [12,13], chemical [14,15,16], physical [17] and acoustic [18,19].
Measuring cavitation through acoustic methods shows promise in this field, focusing on monitoring the sub-harmonic frequency by observing oscillations at these specific frequencies. This method is grounded in comprehending the dynamic behavior of gas bubbles within a liquid, experiencing alternating pressure from an acoustic field. The objective of this analysis is to pinpoint the energy transitions from the acoustical mode at frequency to an acoustical mode at frequency f. Santis et al. [18] provide detailed insights into detecting and distinguishing the sub-harmonic signal from the fundamental frequency of the sound field, which will be further analyzed.
Wu et al. [9] classified acoustic measurement methods into three categories based on their approach: active, passive, and self-sensing. Table 1 depicts a comparison between the advantages and disadvantages of each approach and the consequent type of measurement devices used.
Active cavitation detection involves emitting ultrasound waves into the liquid medium and, subsequently, measuring them using a transducer or similar sensor. This method relies on the ultrasonic reflection from cavitation bubbles, known as backscattering [9]. The signal processing of backscattered signals is utilized to detect cavitation. However, this simplistic approach faces challenges due to constraints of the transducer, which can lead to difficulties in focusing and limited sensing volume [20,21]. Enhancements to active detection, such as utilizing the Doppler effect and employing a linear array instead of a single transducer, can improve acoustic cavitation measurement [21,22,23]. The measurement using a linear array involves detecting scattered signals from cavitation bubbles along a scan line and sequentially measuring multiple lines to construct an image [23]. Despite the increased sensitivity and excellent spatial-time resolution of these advanced methods, they are time-consuming and not suitable for real-time monitoring, making them challenging to implement in industrial applications [9].
Regarding passive cavitation detection, this method relies on capturing acoustic emissions produced by cavitation bubbles in a medium exposed to an external ultrasound field, typically utilizing a single-element sensor. The sensor captures acoustic signals across a broad spectrum of frequencies [9]. Cavitation detection using passive methods commonly involves two types of hydrophones: piezoelectric-based [24,25,26,27] or fiber optic-based [28,29,30].
The fiber optic probe hydrophone operates by measuring the amplitude of a sound wave through the reflection of light at the fiber–liquid interface [28]. This method offers significant advantages, such as its small probe diameter, allowing for precise measurements in various environments. Moreover, these probes remain unaffected by chemical degradation when in contact with liquids [29]. Typically, fiber optic sensors are utilized for high-frequency measurements, with limited application below 100 kHz [29]. Bellow this threshold, piezoelectric sensors tend to be more sensitive. However, there are notable drawbacks to this approach. Fiber optic sensors, primarily composed of silica fibers, are susceptible to damage from cavitation, reducing their durability. Additionally, they do not provide a precise localization of acoustic cavitation within the chamber [28,30]. Bull et al. [30] highlighted that fiber optic-based sensors may also be prone to broadband noise fluctuations, potentially affecting their statistical sensitivity and specificity when compared to piezoelectric sensors.
Piezoelectric-based hydrophones are the predominant method employed to measure the primary effects of acoustic cavitation. They excel in capturing dynamic changes in sound pressure over time, offering clear signals with minimal setup complexity [27]. Given that bubble implosions typically last less than 50 nanoseconds, cavitation detection requires pressure sensors with high bandwidth and durability [27]. These hydrophones enable real-time monitoring and serve as the cornerstone of cavitometers used in industrial applications [31]. Their utilization allows for assessing acoustic field distribution in ultrasound chambers, applicable across laboratory and large-scale environments [7]. However, their bulk sensor design may disrupt the acoustic field. Additionally, achieving real-time measurements often necessitates signal conversion to Fast Fourier Transform (FFT) or specialized data acquisition software, increasing complexity and cost. Furthermore, immersing hydrophones in ultrasound chambers poses a risk of damage from cavitation activity [7].
Self-sensing cavitation detectors can be also employed and are often applied in conditions where piezoelectric sensors are not viable [9]. These devices are capable of emitting and receiving acoustic signals and, consequently, can generate the ultrasound waves responsible for acoustic cavitation and, at the same time, capture the signal from acoustic cavitation [32]. The basis behind this method can be classified into two main domains. One is through the evaluation of indicators in the frequency domains, found in the electrical signals of the transducer [33,34] and the other is related to the evaluation of the transducer impedance [32]. However, several frequency portions, such as harmonics and the global noise level, are also part of the characteristic of the transducer; so, it is difficult to estimate the cavitation intensity through the current signal spectrum. A complex system on the transducer control system is more susceptible to interferences. It is more complicated to know the acoustic cavitation in a determined position [9,32].
Comparing potential methods, piezoelectric-based hydrophone sensors emerge as the most appealing option due to their superior sensitivity, simplicity, acceptable time resolution, and compatibility with chambers of large diameter.
Piezo sensors, classified as active materials, establish a robust correlation between mechanical and electrical quantities. These materials exhibit significant mutual coupling, efficiently converting a mechanical stimulus into electrical signals and vice versa [11]. They can be found in various applications and are considered a promising material for the future, according to the study by Zhu et al. [35]. This is due to their ability to generate electrical power from mechanical power, highlighting their valuable properties. The remaining components of the devices fall into the category of passive materials [36]. Piezoelectric materials can respond in two ways: they produce an electrical potential in response to a mechanical load or generate ultrasound waves when an electrical potential is applied across their faces [5,37]. When an external force is applied, electric dipoles within the crystal align, creating a positive and negative face, resulting in an electric field across the crystal. This phenomenon occurs in a poled piezoelectric material, where tensile or compressive stress generates positive or negative voltage across its faces, respectively [38].
The study of cavitation based on acoustic phenomena is connected to frequency indicators that are set as harmonics (f), sub-harmonics (f/n), and ultra-harmonics (n*f), with n being the harmonic index (n = 2, 3, 4,…) [32]. However, Santis et al. [18] focus on using sub-harmonic frequencies to study cavitation, mainly, the sub-harmonic (f/2). The sub-harmonic frequency proves to be a sensitive and rapid method for detecting the onset of cavitation. Piezoelectric detectors register a significant increase in sub-harmonic oscillation amplitude in the initial stages of acoustic cavitation, attributed to the presence of pulsating bubbles within the liquid medium. Additionally, the amplitude of the acoustic field diminishes due to heightened absorption by the cavitation liquid and the subsequent transfer of power to the sub-harmonic mode, as proposed by Edmonds et al. [39].

Table 1.
Comparative analysis of advantages and disadvantages of diverse methods for acoustic cavitation measurement based on primary effects.
Table 1.
Comparative analysis of advantages and disadvantages of diverse methods for acoustic cavitation measurement based on primary effects.
| Acoustic Measurement Type | Description | Type of Sensor | Advantages | Disadvantages | References |
|---|---|---|---|---|---|
| Active | Cavitation is detected by reflecting ultrasound waves off the bubbles | Single transducer, linear array, bubble Doppler | High spatial time resolution and sensitivity when combined in linear array or bubble Doppler | Time-consuming; No real-time monitoring; Single transducer leads to spatial and focus limitations | [9,20,21,22,23] |
| Passive | Based on the spectrum estimation of cavitation noise emitted by cavitation bubbles | Fiber-optic | Low probe diameter; Fibers are completely wet and are not degradable in aggressive media; Measurements at high frequency with similar sensitivity to piezoelectric sensors | Less sensitive than piezoelectric sensors below 100 kHz; Does not allow precise location of cavitation; Low durability and some systems are complex to substitute; More susceptible to broadband noise fluctuations | [28,29,40,41] |
| Piezoelectric | Most commonly applied method; Signal clarity amidst minimal setup complexity; Allows real-time monitoring; Applicable across both laboratory and large-scale environments | May disrupt the acoustic field due to their bulk sensor design; Dependent on signal conversion to FFT by an auxiliary data treatment system; Can be damaged from cavitation activity; Not intended to achieve very high spatial resolutions | [24,25,26,27] | ||
| Self-Sensing | Capable of emitting and receiving acoustic signals from the cavitation of bubbles | Transducer | Sound field is not affected; Can withstand harsh process conditions; Ideal for application at high temperatures | Little research in this field; Difficult estimation of cavitation intensity through the current signal; Complex system on the transducer control; More susceptible to interferences | [9,32,33,34] |
Puga et al. [24] employed an acoustic detection system combining a piezoelectric detector with a molybdenum rod submerged within an aluminum-filled chamber. This method closely aligns with their intended methodology, focusing on sub-harmonic detection and studying ultra-harmonics to enhance cavitation detection precision. Brabec et al. [42] developed an acoustic measurement system combining a piezoelectric sensor with an echocontrast agent, enhancing the ultrasound field and improving cavitation detection.
However, the current literature lacks methodologies for inline systems using a simple piezoelectric sensor. Our methodology distinguishes itself from existing studies by introducing a streamlined method that leverages a single piezoelectric element housed within an entirely sealed chamber. This investigation pioneers a nuanced examination of cavitation phenomena, orchestrating the innovation of a cost-effective acoustic cavitation device designed to bolster advancements in ultrasound technology. Furthermore, this research meticulously evaluates the effects of two disparate geometries on the dynamics of the cavitation field, providing insightful analysis into their respective impacts on cavitation efficiency and distribution. This study intends to provide simple solutions easily applicable to similar systems, contributing a valuable tool for acoustic monitoring and self-control of acoustic cavitation in water. This work aims to develop a piezoelectric-based sensor for inline monitoring of acoustic cavitation inside a close chamber, and as a consequence, assess the cavitation generated by an acoustic radiator with different sections of geometrical shapes. The development of this device is essential due to challenges in detecting acoustic cavitation in opaque chambers during ultrasound application. Optimizing ultrasound systems requires knowing if cavitation occurs and at what power levels it stabilizes, thus ensuring precise control over the treatment process without compromising sample quality or achieving insufficient treatment outcomes. Therefore, a low-cost device is needed to monitor acoustic cavitation inside opaque chambers, where evaluation through video recording is impractical.
2. Materials and Methods
2.1. Piezoelectric Sensor
The analysis of acoustic phenomena, specifically cavitation measurement, was conducted using piezoelectric sensors that convert mechanical energy, from the impact of bubble implosion forces, into electrical energy. The sensor employed was constructed with piezoelectric HS-PC40 provided by Hangzhou Altrasonic Technology Co., Ltd. (Hangzhou, China). These piezoelectric have a square shape measuring 25 mm on each side and a thickness of 2 mm. The piezo displays a resonance impedance of 10 at 1 kHz, a direct capacitance of 11 nF, and an electromechanical coupling coefficient of at least 40%. To safeguard the electrical wire connections, the piezoelectric component is encased in a circular epoxy layer with a diameter of 40 mm, leaving the contact face non-isolated.
2.2. Experimental Set-Up
The experimental setup (Figure 1) comprised a 20 L chamber with a 120 mm diameter, filled with ultra-purified water. The acoustic radiator (HWL), had 360 mm of length, separated into 3 sections and a diameter of 50 mm.
Ultrasonic power supply (1) is regulated by a dedicated computer program to allow electric power variation. Ultrasound converter or transducer (2) is designed to convert electric power into mechanical waves. Booster amplifies the mechanical vibrations produced by the piezoelectric transducer, in this case, on a factor of 2.0 (3). Acoustic radiator (4) transmits ultrasonic waves to the liquid media (5) inside chamber (6). The acoustic radiator is divided into 3 sections, as detailed in Figure 1. On the top is the holed section, and on the bottom the solid section.
Piezoelectric sensors (7) were connected to the data acquisition system, composed of NI9219 module within NI cDAQ 9172 chassis, controlled by LabVIEW® program (8) dedicated to data acquisition, treatment, and signal processing. The system and LabVIEW® program were developed specifically for this study. It enables real-time monitoring of data acquisition, presenting instantaneous voltage readings and FFT graphs. This monitoring capability extends to both real-time and averaged data. Additionally, the system allows customization of acquisition parameters such as acquisition time, sample count, and recording intervals between measurements, enhancing experimental flexibility and data accuracy. Electric signal received is processed to convert piezoelectric response into FFT graphics for acoustic reading. Signal was acquired at 85 k samples/s, and for each power level tested, spectrum was calculated 10 times, with average values evaluated to minimize random errors. The sensor output was connected to a voltage divider to reduce the maximum voltage to less than 10 V and minimize noise during acquisition.
LabVIEW 2016® program developed was configured to transform voltage from piezoelectric signal using LabVIEW 2016® library with FFT.VI routines. A “low-pass filter” was employed to limit data acquisition above 9000 Hz.
2.3. Experimental Procedure
The impedance level of the piezoelectric sensor was assessed using a TRZ analyzer both before and after the final configuration to confirm its consistency throughout the transition. This evaluation aimed to ensure that the characteristics of the sensor aligned with the desired specifications. To mitigate errors, five readings were taken, and their average was considered. Throughout this paper, the term “initial configuration” denotes the original piezoelectric disk, while the “final configuration” refers to the sensor with the ultimate dimensions (25 × 25 mm square), encased in the circular epoxy layer.
Simultaneously, and to evaluate the US treatment system, its impedance level was scrutinized, correlating it with the varying volume of water inside the chamber. The ultrasound transducer was sequentially immersed at different depths: starting with minimal contact at 0 mm (where only the horizontal face of the acoustic radiator touches the water surface), followed by 80 mm (denoted as P1), 180 mm, 280 mm (P2), and, finally, 300 mm.
Having characterized the system in terms of impedance, we proceeded with the monitoring of the acoustic cavitation within the 20 L chamber at two positions, filled with ultra-purified water. These positions (Figure 1), were at depths of 80 mm (P1) and 280 mm (P2). The system operated at a frequency of 19,700 ± 100 Hz, with electric power varying from 70 W to 700 W, including intermediate levels of 140 W, 280 W, 350 W, 420 W, 500 W, and 600 W. For each power level, power sample acquisition was set to a duration of 3 s.
3. Results
3.1. Impedance Level Assessment
According to the specifications of manufacturer, the resonance frequency of the sensor is 44,000 Hz, and the anti-resonance frequency is 46,000 Hz. In comparison with these, the measured resonance frequency (44,555 ± 0.025 Hz) obtained from the TRZ analyzer closely corresponded to the theoretical value. Likewise, the anti-resonance frequency was determined to be 45,480 ± 0.012 Hz, demonstrating close alignment with the anticipated value.
Regarding the impedance level of the ultrasound system, it is evident that an increase in the contact area influences the resonance frequency, as illustrated in Figure 2. Progressing from the first to last position, the ultrasound frequency decreases from 19,650 ± 23 Hz (at 0 mm depth) to approximately 19,220 ± 10 Hz (at 180 mm and 280 mm depths) and 19,150 Hz ± 14 (at 300 mm depth). This decrease in resonance frequency corresponds to an increase in the contact area.
Additionally, it was observed that with an increase in depth, the impedance graph exhibits more fluctuations beyond the curve of resonance and anti-resonance. It can be noticed that from the curve related to “0 mm” and “300 mm”, near the resonance (1) and anti-resonance (2) points, there is a smooth appearance of a deformation on the impedance graph for each power level. Specifically, at the “180 mm” position, there is the formation of a destabilization zone around 19,500 Hz and 20,000 Hz. At “300 mm”, the destabilization is more pronounced and is observed below 19,000 Hz and 19,500 Hz. This last deformation of the graphic can be associated with the emerge of new resonances. At a distance of 300 mm, a minor resonance becomes observable, possibly attributed to the substantial mass of water in direct contact with the upper part of the ultrasound device. At this point, the ultrasound is in full contact with the water, and the contact area increases substantially on its top. This results in the appearance of a new cavitation source above the ultrasound radiator. With the addition of this new resonance, it was observed that the ultrasound lost its effectiveness, causing instability in the system and introducing problematic behavior in the ultrasound operation. Consequently, it can be confirmed that the resonance frequency remains stable for the referred points, labeled as P1 and P2 (see Figure 1). However, beyond 300 mm, this stabilization diminishes.
3.2. Cavitation Monitoring
Following the assessment and validation of the ultrasonic treatment and sensor, the subsequent step involved measuring the acoustic cavitation within the opaque chamber. Figure 3 and Figure 4 display the FFT spectral levels of harmonics, sub-harmonics, and ultra-harmonics in the acquired sound pressure waveforms for Positions 1 and 2 (refer to Figure 1), respectively, across three power levels (260 ± 10 W, 500 ± 10 W, and 700 ± 10 W).
As per Abramov et al. [43], the acoustic threshold is reached when the magnitude at harmonics (f) and ultra-harmonics (3f/2) stabilizes, and the sub-harmonic (1/2f) increases. This threshold is attained when the magnitude at the ultra-harmonic (3f/2) remains consistent as the frequency escalates, with a similar behavior expected for the remaining harmonics. This method serves to validate the proposed threshold range through the observation of ultra-harmonics [24,43].
Because of this, it is important to analyze the FFT spectral along the variation of power levels to confirm the type of cavitation, in Figure 3 and Figure 4. In this case, analyzing the data, it is more valuable to compare the electrical power level of 260 ± 10 W, 500 ± 10 W, and 700 ± 10 W, corresponding to a low power level, an intermediate level where it is possible to notice a more pronounced increase on f/2, and then the higher power level.
Examining Position 1 in Figure 3, it becomes apparent that the amplitude of the sub-harmonic (around 10,000 Hz) increases proportionally with the rise in power. This behavior is similarly observed for the harmonics, displaying a comparable peak amplitude at 260 ± 10 W and 500 ± 10 W, with a more pronounced increase at 700 ± 10 W. Regarding ultra-harmonics, it is noteworthy that an increase in power leads to an escalation in the ultra-harmonic, although this trend is less pronounced for the ultra-harmonic. The rise in magnitude around the sub-harmonic (10,000 Hz) and ultra-harmonic (30,000 Hz), suggest that between 500 ± 10 W and 700 ± 10 W, the cavitation enters a developed phase as mentioned by Abramov et al. [43].
Regarding Position 2, as depicted in Figure 4, it is discernible that at 260 ± 10 W, 3/2f and 2f display a lack of stabilization. This observation strongly suggests that the cavitation threshold has been reached.
However, within the power range from 500 ± 10 W to 700 ± 10 W, it is evident that 3/2f and 2f achieve stability and manifest an increase in magnitude concurrent with the rise in power. The augmentation of the harmonic frequency (20,000 Hz) is more pronounced at the power of 500 ± 10 W. Nevertheless, this is not a concern since, as per the second bibliography by Abramov et al. [43], the ultra-harmonics 3f/2 and 2f serve as better indicators of acoustic cavitation. In this scenario, a consistent rise in the ultra-harmonics followed by stabilization is evident. The fluctuations observed in the harmonics imply that beyond the power threshold of 500 ± 10 W, acoustic cavitation may become more pronounced, potentially serving as the initiation point for acoustic cavitation.
The scrutinized FFT spectra (Figure 3 and Figure 4) reveal discernible peaks emerging around 15,000 Hz, 25,000 Hz, and 35,000 Hz. Notably, these peaks exhibit lower magnitudes compared to those of the sub-harmonics, harmonics, and ultra-harmonics. Through an examination of the frequency at which the maximum voltage is attained for these peaks and its association with the resonance phenomenon, a consistent difference of one harmonic between each noise peak becomes evident. This value aligns with the harmonic, as illustrated in Figure 4.
Based on this identifiable mathematical relation and the consistent presence of a peak between each harmonic, distinct from one complete harmonic, it is suggested that these peaks result from the resonance and refraction occurring within the chamber itself. The refraction of acoustic waves within the ultrasound chamber gives rise to additional frequency peaks.
The results from the sub-harmonic (f/2) has proven to be a reliable parameter for comprehending the progression of acoustic cavitation within a liquid solution [24]. Figure 5 depicts the variation of the sub-harmonic at different power levels (200 W, 400 W, and 800 W) for Positions 1 and 2 (refer to Figure 1).
In accordance with the studies conducted by Eskin et al. [44] and Abramov et al. [43], two distinct zones can be identified. Figure 5 reveals that, at Position 1, there is an increase in voltage values with the rise in power until reaching 500 W. Beyond this point, as evidenced by the moving average of the slope analysis, cavitation appears to stabilize, and voltage acquisition reaches a plateau. This suggests that between 70 W and 500 W, Zone 1 corresponds to incipient cavitation initially, followed by an observed tendency of cavitation increase. According to Eskin et al. [44], this implies that the cavitation threshold may be reached, as before 500 W, there is only an amplitude increase, and after 500 W, cavitation tends to stabilize, leading to Zone 2 characterized by well-developed cavitation. A significant increase in the acoustic signal of the sub-harmonic indicates that the cavitation threshold has been reached. However, as there is no specific zone where this increase is more pronounced in Zone 1, it is not possible to pinpoint a specific point in the initial zone.
On the other hand, analyzing cavitation behavior at Position 2 reveals that, until 500 W, cavitation is not developed and remains incipient. There is a minimal variation in voltage values, as confirmed by the moving average of the slope, suggesting that, until 500 W, cavitation at this position is low [24]. Beyond this point, it becomes evident that the slope increases spontaneously, indicating that cavitation has entered a zone of development and augmentation, analogous to the observed trend in Position 1 between 70 W and 500 W. The cavitation threshold can be referenced to the 500 W point, as a sudden increase in the curve slope is noticeable [43].
The results from the sub-harmonics suggest that cavitation differs in various regimes depending on the geometry of the acoustic radiator. Given this variability in cavitation regimes, it is anticipated that the quantity and behavior of formed bubbles may also differ [42].
As depicted in Figure 1, Positions 1 and 2 are situated at distinct points on the acoustic radiator. Position 1 is located within the field of cavitation formed by the action of the radiator with holes, whereas Position 2 is situated at the bottom of the radiator.
Analyzing Figure 5, a notable deviation between maximum and minimum values, characterized by a high standard deviation, is observed; while this variability does not significantly impact the overall results, as the curve consistently follows a similar growth pattern, the elevated standard deviation prompts further scrutiny. Initially, it suggests the presence of noise and other acoustic waves with varying frequencies, coupled with a non-uniform distribution of cavitation within the chamber.
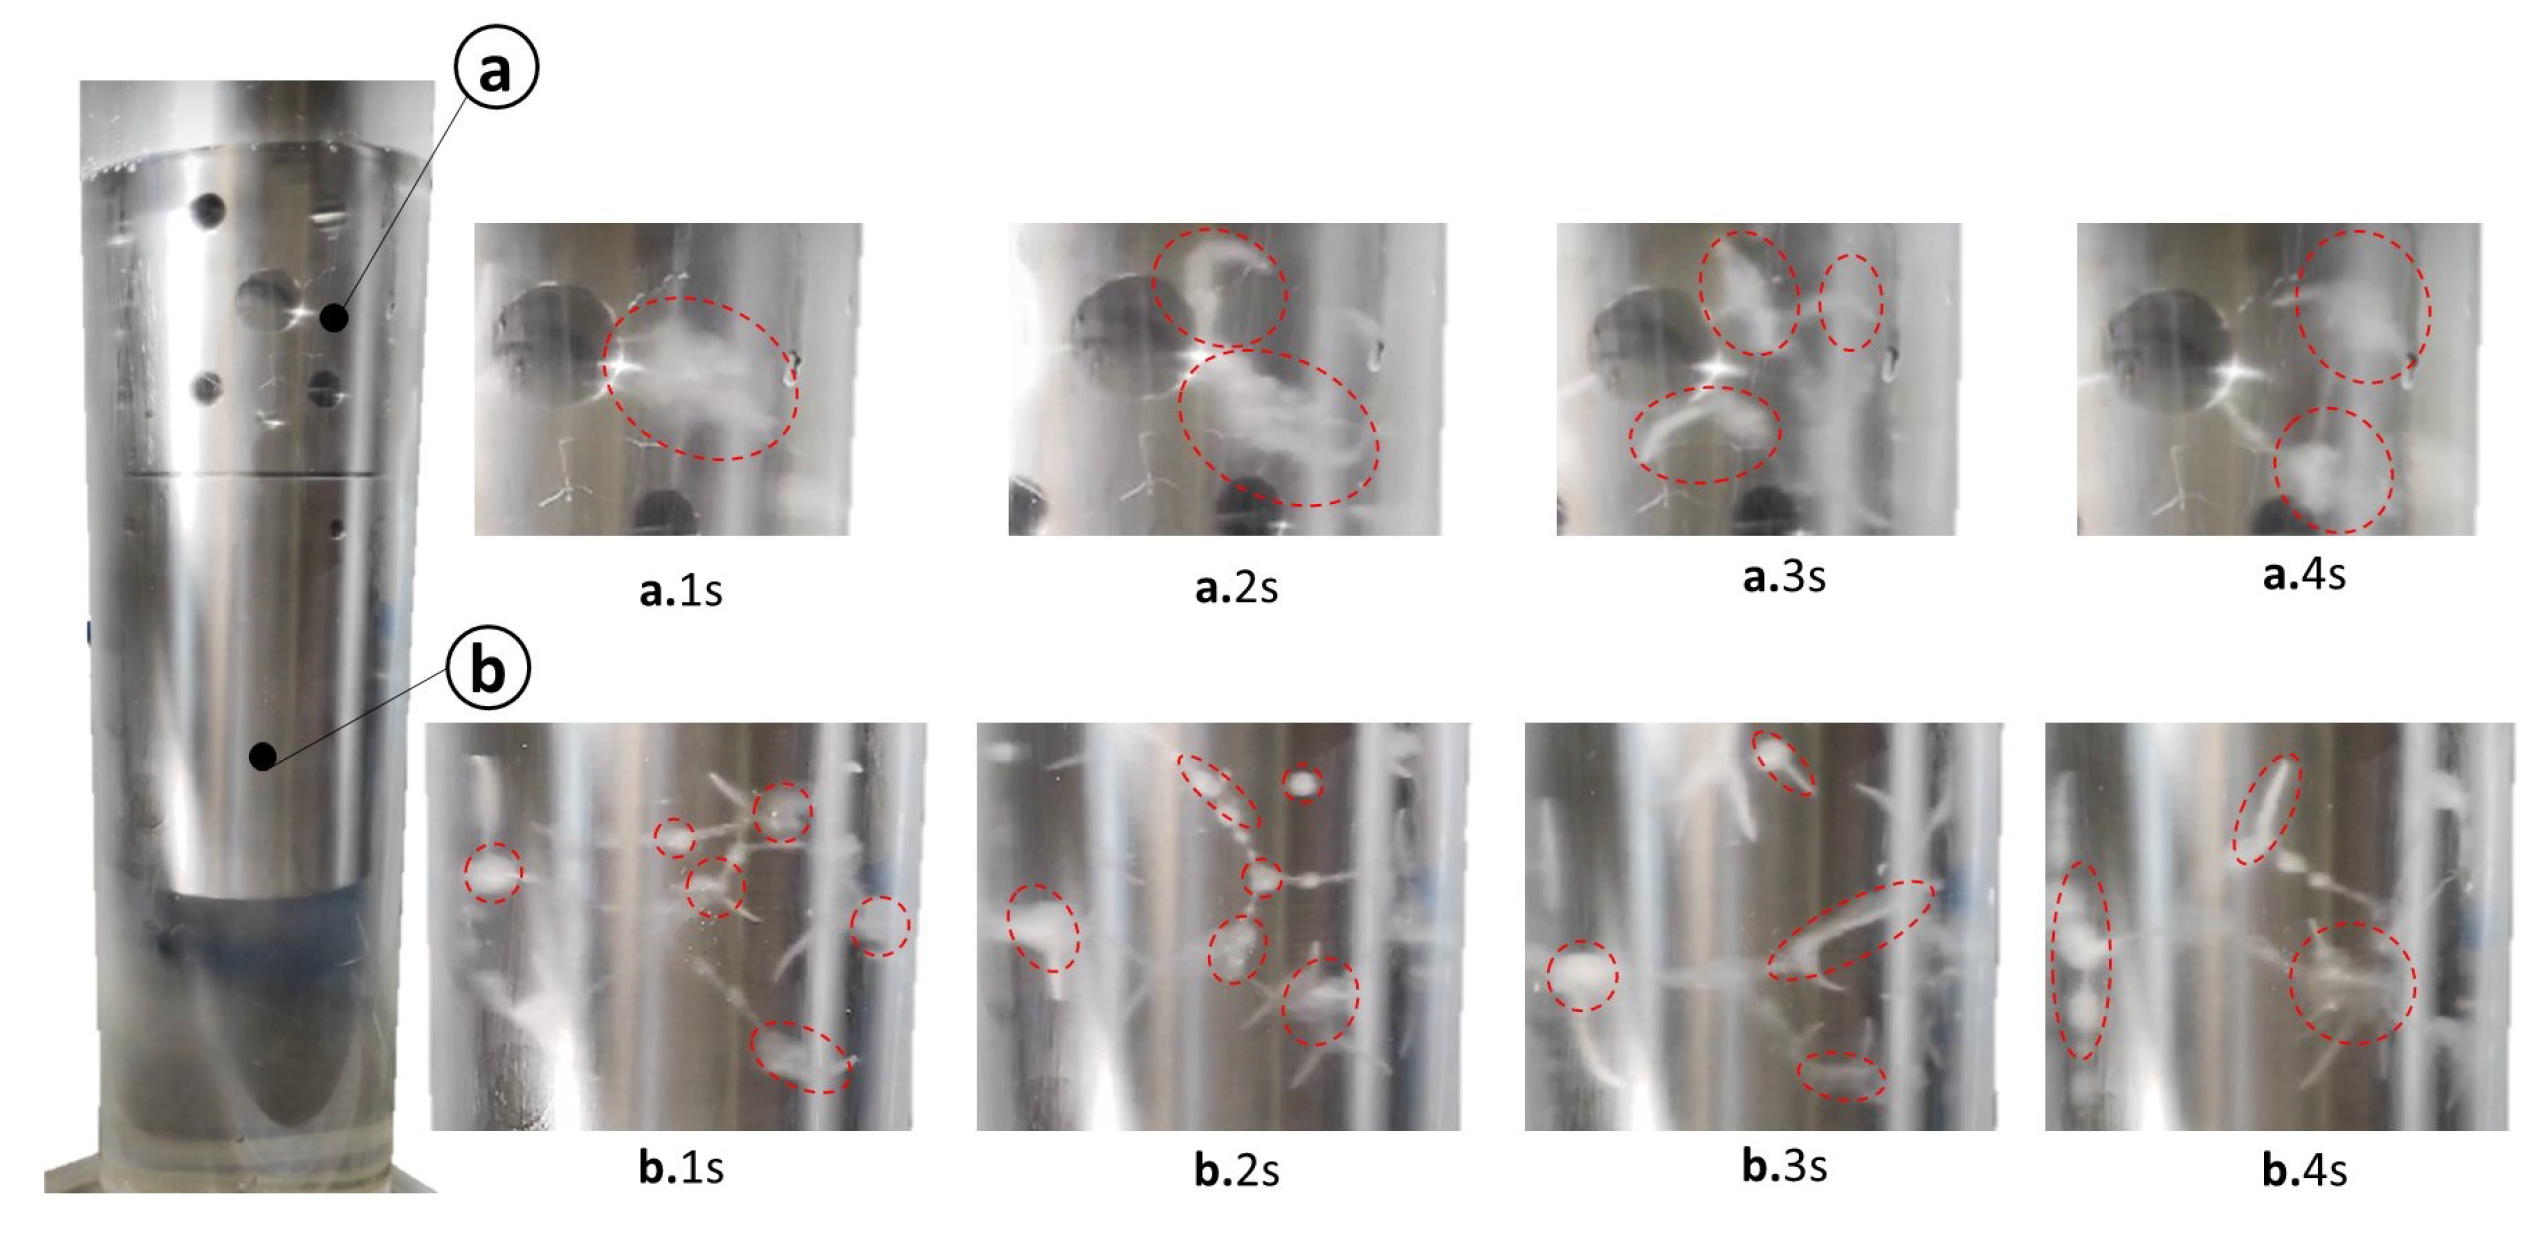
To test this hypothesis, the cavitation induced by ultrasound in water was recorded with a camera. As illustrated in Figure 6, it is evident that cavitation exhibits fluctuations on the radial and axial directions. Across four distinct time points, each with a one-second interval, noticeable variations in bubble water flux are observed. This highlights that water flow is inherently time-dependent, leading to varying pressure fluxes on the water and, consequently, distinct acoustic readings on the piezoelectric sensor. This indicates that a sensor located in a constant position will experience different impact forces over time, depending on the geometry of the acoustic radiator, if it is solid or holed. Thus, for a comprehensive understanding of acoustic activity, it is imperative to consider an average of several points or introduce additional sensors for more accurate field measurements.
Correlating the results obtained from sub-harmonics analysis (Figure 5) with the recorded acoustic cavitation (Figure 6), it is evident that in the holed radiator geometry, there is a prevalent presence of high-intensity cavitation accompanied by widespread microcavitation in a larger area (Figure 6a). This observation is consistent with the analysis of sub-harmonics, where acoustic cavitation is detected from the initial stages at Position 1.
Conversely, examining the cavitation in the solid section of the acoustic radiator (Figure 6b), it is apparent that the acoustic cavitation appears to be less intense and with lower cavitation density per unit area. This observation aligns with findings indicating that the solid shape geometry only exhibits cavitation at 500 W, attributed to the lower radial acoustic cavitation.
Exploring the disparities between the two positions, Figure 7 illustrates the cavitation field in the two distinct regions of the acoustic radiator. As depicted in Figure 7a, the acoustic radiator exhibits two primary sources of acoustic propagation. Along the ultrasound axis, cavitation formation occurs both along this axis and perpendicular to it.
Geometric characteristics impact the acoustic radiator’s response to ultrasound excitement. On the top part, characterized by a geometry with holes, the presence of holes leads to a dislocation in their location. When excited, the holes transform, adopting an elliptical shape oscillating around their central axis. In the bottom part of the acoustic radiator, wave propagation occurs through the acoustic waves along the same axis as the ultrasound.
The formation of bubbles within the holes is evident, showcasing distinct behaviors of the two fields of the acoustic radiator when interacting with water. On the top part (with holes), cavitation primarily occurs around the hole locations, generating elliptical flows outward from these points, known as acoustic streaming. This geometric characteristic, as seen in Figure 6, increases the contact area between water and ultrasound, intensifying cavitation phenomena. However, it is essential to note that cavitation also extends beyond the hole regions to the wall side.
On the other side, on the solid shape radiator, this propagation appears as an inverted mushroom shape at the bottom and a conical shape at the top. Bubble formation is most pronounced at the point of contact with the ultrasound and gradually diminishes with increasing distance, giving it a conical shape. The acoustic propagation gradually expands, resembling a mushroom at the bottom of the chamber. This behavior is typical for the propagation of cavitation bubbles when using solid shape acoustic radiator geometry, with cavitation formation on the same axis as the ultrasound [45].
Directly comparing the cavitation behavior in both fields of the acoustic radiator reveals different configurations and propagation patterns. On the top part, cavitation bubbles from the acoustic radiator suggest higher amplitude at the center and a conical propagation (Figure 7b). Due to the presence of holes, the wave guide’s cavitation propagation seems to amalgamate two distinct types of cavitation bubble structures along with acoustic streaming. In this case, the cavitation bubble structure may not be entirely discernible, but the presence of acoustic streaming is conspicuous. Comparing with studies by Moussatov et al. [46] and Bai et al. [45], along the bored zone, there are zones where acoustic streaming occurs in isolation. Furthermore, it tends to shift from the center towards the periphery in some areas, while in others, it moves from the periphery towards the center, forming a distinctive “X” shape. This behavior suggests that the amplitude of vibrations is influenced by the presence of holes, resulting in a geometric configuration where certain areas exhibit higher amplitudes while being surrounded by regions of lower amplitudes, and vice versa.
On the other hand, cavitation at the contact surface with the acoustic radiator exhibits acoustic streaming propagating from the center to the outside [45] (Figure 7c). This configuration leads to an inverted conical field that reduces the amount of bubble generation near the lateral walls (where the sensor is located) and increases on the bottom of the acoustic radiator. Consequently, the amount of cavitation on this part is lower because the cavitation field is opposite to the location of the sensor. This bubble field generation appears to suggest that only on higher powers (from 500 W) is the amount of bubbles sufficiently high to increase the acoustic cavitation near the walls, where the sensor is located.
4. Conclusions
Examining sensor and system characteristics, the inherent properties of piezoelectric sensors prove consistent despite the addition of an epoxy layer for wire connection protection. Additionally, the electrical impedance level of the system correlates with water depth, exhibiting a decrease as the contact area expands with greater depth. Significantly, at 300 mm, an imbalance occurs in the system due to the emergence of a new resonance frequency.
This economical cavitation measurement approach within an opaque chamber aligns well with expected outcomes found in the existing literature and references, providing validation for its application.
The cavitation intensity at a specific position hinges on both the electrical power intensity of the system and the geometric characteristics of the acoustic radiator. A holed section geometry appears to enhance cavitation generation along the acoustic radiator, leading to increased cavitation. On the other side, a solid shape geometry exhibits reduced cavitation on the lateral walls while emphasizing its occurrence at the bottom. These distinctions arise from the analysis of sensor output measures. The results indicate that a holed section geometry induces elevated cavitation along the lateral side field, while a solid shape geometry, with more rigidity and less flexibility, fosters heightened acoustic generation at the bottom of the acoustic radiator.
These findings indicate temporal and positional variations in acoustic cavitation. This underscores the necessity, for effective cavitation monitoring, to either average measurements across multiple time points or introduce supplementary sensors near predetermined positions.
This study led to the successful development of a cost-effective device using a piezoelectric sensor to detect acoustic cavitation within opaque chambers. While this approach proves effective in chambers filled with water for treatment purposes, it is important to recognize the limited spatial measurement capabilities of the sensor. Its response to cavitation is notably location-dependent. Consequently, the utility of the device lies primarily in measuring specific critical points rather than providing comprehensive spatial coverage.
Author Contributions
J.F. was involved in conceptualization, methodology, software, validation, writing—original draft preparation, and investigation; P.J.R. was involved in supervision, funding acquisition, and writing—original draft preparation; H.P. was involved in conceptualization, methodology, and writing—original draft preparation and supervision. All authors have read and agreed to the published version of the manuscript.
Funding
This research received no external funding.
Data Availability Statement
Research data are not shared.
Conflicts of Interest
The authors declare no conflicts of interest.
References
- Yi, C.; Lu, Q.; Wang, Y.; Wang, Y.; Yang, B. Degradation of organic wastewater by hydrodynamic cavitation combined with acoustic cavitation. Ultrason. Sonochem. 2018, 43, 156–165. [Google Scholar] [CrossRef] [PubMed]
- Mason, T. Advances in Sonochemistry. J. Acoust. Soc. Am. 1994, 96, 613. [Google Scholar] [CrossRef]
- Ameta, S.; Ameta, R. Advanced Oxidation Processes for Wastewater Treatment: Emerging Green Chemical Technology; Elsevier Science: Amsterdam, The Netherlands, 2018. [Google Scholar] [CrossRef]
- Hassani, A.; Malhotra, M.; Karim, A.V.; Krishnan, S.; Nidheesh, P.V. Recent progress on ultrasound-assisted electrochemical processes: A review on mechanism, reactor strategies, and applications for wastewater treatment. Environ. Res. 2022, 205, 112463. [Google Scholar] [CrossRef] [PubMed]
- Ameta, S.; Ameta, R.; Ameta, G. Sonochemistry: An Emerging Green Technology; Apple Academic Press: Palm Bay, FL, USA, 2018. [Google Scholar]
- Verhaagen, B.; Rivas, D.F. Measuring cavitation and its cleaning effect. Ultrason. Sonochem. 2016, 29, 619–628. [Google Scholar] [CrossRef] [PubMed]
- Zhu, X.; Das, R.S.; Bhavya, M.L.; Garcia-Vaquero, M.; Tiwari, B.K. Acoustic cavitation for agri-food applications: Mechanism of action, design of new systems, challenges and strategies for scale-up. Ultrason. Sonochem. 2024, 105, 106850. [Google Scholar] [CrossRef] [PubMed]
- Sutkar, V.S.; Gogate, P.R. Design aspects of sonochemical reactors: Techniques for understanding cavitational activity distribution and effect of operating parameters. Chem. Eng. J. 2009, 155, 26–36. [Google Scholar] [CrossRef]
- Wu, P.; Wang, X.; Lin, W.; Bai, L. Acoustic characterization of cavitation intensity: A review. Ultrason. Sonochem. 2022, 82, 105878. [Google Scholar] [CrossRef]
- Laborde, J.L.; Bouyer, C.; Caltagirone, J.P.; Gérard, A. Acoustic cavitation field prediction at low and high frequency ultrasounds. Ultrasonics 1998, 36, 581–587. [Google Scholar] [CrossRef]
- Krefting, D.; Mettin, R.; Lauterborn, W. High-speed observation of acoustic cavitation erosion in multibubble systems. Ultrason. Sonochem. 2004, 11, 119–123. [Google Scholar] [CrossRef]
- Gelderblom, E.C.; Vos, H.J.; Mastik, F.; Faez, T.; Luan, Y.; Kokhuis, T.J.; van der Steen, A.F.; Lohse, D.; de Jong, N.; Versluis, M. Brandaris 128 ultra-high-speed imaging facility: 10 years of operation, updates, and enhanced features. Rev. Sci. Instrum. 2012, 83, 103706. [Google Scholar] [CrossRef]
- Zijlstra, A.; Rivas, D.F.; Gardeniers, H.J.; Versluis, M.; Lohse, D. Enhancing acoustic cavitation using artificial crevice bubbles. Ultrasonics 2015, 56, 512–523. [Google Scholar] [CrossRef]
- Soare, A.; Dijkink, R.; Pascual, M.R.; Sun, C.; Cains, P.W.; Lohse, D.; Stankiewicz, A.I.; Kramer, H.J.M. Crystal Nucleation by Laser-Induced Cavitation. Cryst. Growth Des. 2011, 11, 2311–2316. [Google Scholar] [CrossRef]
- Sukovich, J.R.; Haskell, S.C.; Xu, Z.; Hall, T.L. A cost-effective, multi-flash, “ghost” imaging technique for high temporal and spatial resolution imaging of cavitation using “still-frame” cameras. J. Acoust. Soc. Am. 2020, 147, 1339–1343. [Google Scholar] [CrossRef]
- Fuchs, J.; Ultrasonics, B.N. Ultrasonic intensity measurement techniques. In CleanTech Symposium Proceedings; Witter Publications: Flemington, NJ, USA, 2002. [Google Scholar]
- Arvanitis, C.D.; McDannold, N. Integrated ultrasound and magnetic resonance imaging for simultaneous temperature and cavitation monitoring during focused ultrasound therapies. Med. Phys. 2013, 40, 112901. [Google Scholar] [CrossRef]
- De Santis, P.; Sette, D.; Wanderlingh, F. Cavitation Detection: The Use of the Subharmonics. J. Acoust. Soc. Am. 1967, 42, 514–516. [Google Scholar] [CrossRef]
- Kuroyama, T.; Ogasawara, H.; Mori, K. Characterization as measurement sound source of acoustic cavitation noise from bubble clusters under ultrasonic horn. Jpn. J. Appl. Phys. 2023, 62, SJ1032. [Google Scholar] [CrossRef]
- Madanshetty, S.I.; Roy, R.A.; Apfel, R.E. Acoustic microcavitation: Its active and passive acoustic detection. J. Acoust. Soc. Am. 1991, 90, 1515–1526. [Google Scholar] [CrossRef]
- Ding, T.; Hu, H.; Bai, C.; Guo, S.; Yang, M.; Wang, S.; Wan, M. Spatial-temporal three-dimensional ultrasound plane-by-plane active cavitation mapping for high-intensity focused ultrasound in free field and pulsatile flow. Ultrasonics 2016, 69, 166–181. [Google Scholar] [CrossRef] [PubMed]
- Li, T.; Khokhlova, T.D.; Sapozhnikov, O.A.; O’Donnell, M.; Hwang, J.H. A new active cavitation mapping technique for pulsed HIFU applications-bubble Doppler. IEEE Trans. Ultrason. Ferroelectr. Freq. Control 2014, 61, 1698–1708. [Google Scholar] [CrossRef]
- Ding, T.; Zhang, S.; Fu, Q.; Xu, Z.; Wan, M. Ultrasound line-by-line scanning method of spatial–temporal active cavitation mapping for high-intensity focused ultrasound. Ultrasonics 2014, 54, 147–155. [Google Scholar] [CrossRef]
- Puga, H.; Barbosa, J.; Gabriel, J.; Seabra, E.; Ribeiro, S.; Prokic, M. Evaluation of ultrasonic aluminium degassing by piezoelectric sensor. J. Mater. Process. Technol. 2011, 211, 1026–1033. [Google Scholar] [CrossRef]
- Zeqiri, B.; Gelat, P.; Hodnett, M.; Lee, N. A novel sensor for monitoring acoustic cavitation. Part I: Concept, theory, and prototype development. IEEE Trans. Ultrason. Ferroelectr. Freq. Control 2003, 50, 1342–1350. [Google Scholar] [CrossRef] [PubMed]
- Chen, J.C.; Chang, H.Y.; Chen, J.J.; Chen, G.S. A Piezoceramic Sensor for Detection of Focused Ultrasound-Induced Cavitation. IEEE Sens. J. 2019, 19, 10379–10385. [Google Scholar] [CrossRef]
- Wang, Y.C.; Huang, C.H.; Lee, Y.C.; Tsai, H.H. Development of a PVDF sensor array for measurement of the impulsive pressure generated by cavitation bubble collapse. Exp. Fluids 2006, 41, 365–373. [Google Scholar] [CrossRef]
- Arvengas, A.; Davitt, K.; Caupin, F. Fiber optic probe hydrophone for the study of acoustic cavitation in water. Rev. Sci. Instrum. 2011, 82, 034904. [Google Scholar] [CrossRef]
- Kimura, K.; Takeuchi, S.; Koike, Y. Investigation of Cavitation Bubble Influence on Frequency Spectrum of Fiber Optic Probe Hydrophone Output. In Proceedings of the 2020 IEEE International Ultrasonics Symposium (IUS), Las Vegas, NV, USA, 7–11 September 2020; pp. 1–4. [Google Scholar] [CrossRef]
- Bull, V.; Civale, J.; Rivens, I.; ter Haar, G. A Comparison of Acoustic Cavitation Detection Thresholds Measured with Piezo-electric and Fiber-optic Hydrophone Sensors. Ultrasound Med. Biol. 2013, 39, 2406–2421. [Google Scholar] [CrossRef]
- Tzanakis, I.; Hodnett, M.; Lebon, G.; Dezhkunov, N.; Eskin, D. Calibration and performance assessment of an innovative high-temperature cavitometer. Sens. Actuators A Phys. 2016, 240, 57–69. [Google Scholar] [CrossRef]
- Saalbach, K.A.; Twiefel, J.; Wallaschek, J. Self-sensing cavitation detection in ultrasound-induced acoustic cavitation. Ultrasonics 2019, 94, 401–410. [Google Scholar] [CrossRef] [PubMed]
- Saalbach, K.A.; Twiefel, J.; Wallaschek, J. Self-sensing cavitation detection capability of horn geometries for high temperature application. J. Vibroeng. 2016, 18, 989–998. [Google Scholar] [CrossRef]
- Bornmann, P.; Hemsel, T.; Sextro, W.; Memoli, G.; Hodnett, M.; Zeqiri, B. Self-sensing ultrasound transducer for cavitation detection. In Proceedings of the 2014 IEEE International Ultrasonics Symposium, Chicago, IL, USA, 3–6 September 2014; pp. 663–666. [Google Scholar] [CrossRef]
- Zhu, J.; Yang, Y.; Zhang, H.; Zhao, Z.; Hu, T.; Liu, L. More Than Energy Harvesting in Electret Electronics-Moving toward Next-Generation Functional System. Adv. Funct. Mater. 2023, 33, 2214859. [Google Scholar] [CrossRef]
- Rupitsch, S. Piezoelectric Sensors and Actuators: Fundamentals and Applications; Topics in Mining, Metallurgy and Materials Engineering; Springer: Berlin/Heidelberg, Geramny, 2018. [Google Scholar] [CrossRef]
- Matei, N.; Scarpete, D. The Use of Ultrasound in the Treatment Process of Wastewater: A Review. Ann. “Dunarea de Jos” Univ. Galati Fascicle IX Metall. Mater. Sci. 2015, 2, 45–50. [Google Scholar]
- Vijaya, M. Piezoelectric Materials and Devices: Applications in Engineering and Medical Sciences; CRC Press: Boca Raton, FL, USA, 2016. [Google Scholar] [CrossRef]
- Apfel, R.E. Acoustic Cavitation. Ultrasonics 1981, 19, 355–411. [Google Scholar] [CrossRef]
- Jiang, Z.; Sujarittam, K.; Yildiz, B.I.; Dickinson, R.J.; Choi, J.J. Passive Cavitation Detection with a Needle Hydrophone Array. IEEE Trans. Ultrason. Ferroelectr. Freq. Control 2022, 69, 233–240. [Google Scholar] [CrossRef] [PubMed]
- Zubalic, E.; Vella, D.; Babnik, A.; Jezeršek, M. Interferometric Fiber Optic Probe for Measurements of Cavitation Bubble Expansion Velocity and Bubble Oscillation Time. Sensors 2023, 23, 771. [Google Scholar] [CrossRef] [PubMed]
- Brabec, K.; Mornstein, V. Detection of ultrasonic cavitation based on low-frequency analysis of acoustic signal. Open Life Sci. 2007, 2, 213–221. [Google Scholar] [CrossRef]
- Abramov, O.V. High-Intensity Ultrasonics, 1st ed.; CRC Press: Boca Raton, FL, USA, 1999. [Google Scholar] [CrossRef]
- Eskin, G.; Eskin, D. Ultrasonic Treatment of Light Alloy Melts; Advances in Metallic Alloys; CRC Press: Boca Raton, FL, USA, 2017. [Google Scholar] [CrossRef]
- Bai, L.; Xu, W.; Deng, J.; Li, C.; Xu, D.; Gao, Y. Generation and control of acoustic cavitation structure. Ultrason. Sonochem. 2014, 21, 1696–1706. [Google Scholar] [CrossRef]
- Moussatov, A.; Granger, C.; Dubus, B. Cone-like bubble formation in ultrasonic cavitation field. Ultrason. Sonochem. 2003, 10, 191–195. [Google Scholar] [CrossRef]
Figure 1.
Schematic of experimental apparatus for measuring the cavitation level: 1, ultrasonic power supply unit; 2, ultrasonic converter or transducer; 3, booster 1:2.0; 4, acoustic radiator; 5, liquid media; 6, chamber; 7, piezoelectric sensor; 8, data acquisition, treatment, and signal processing system.
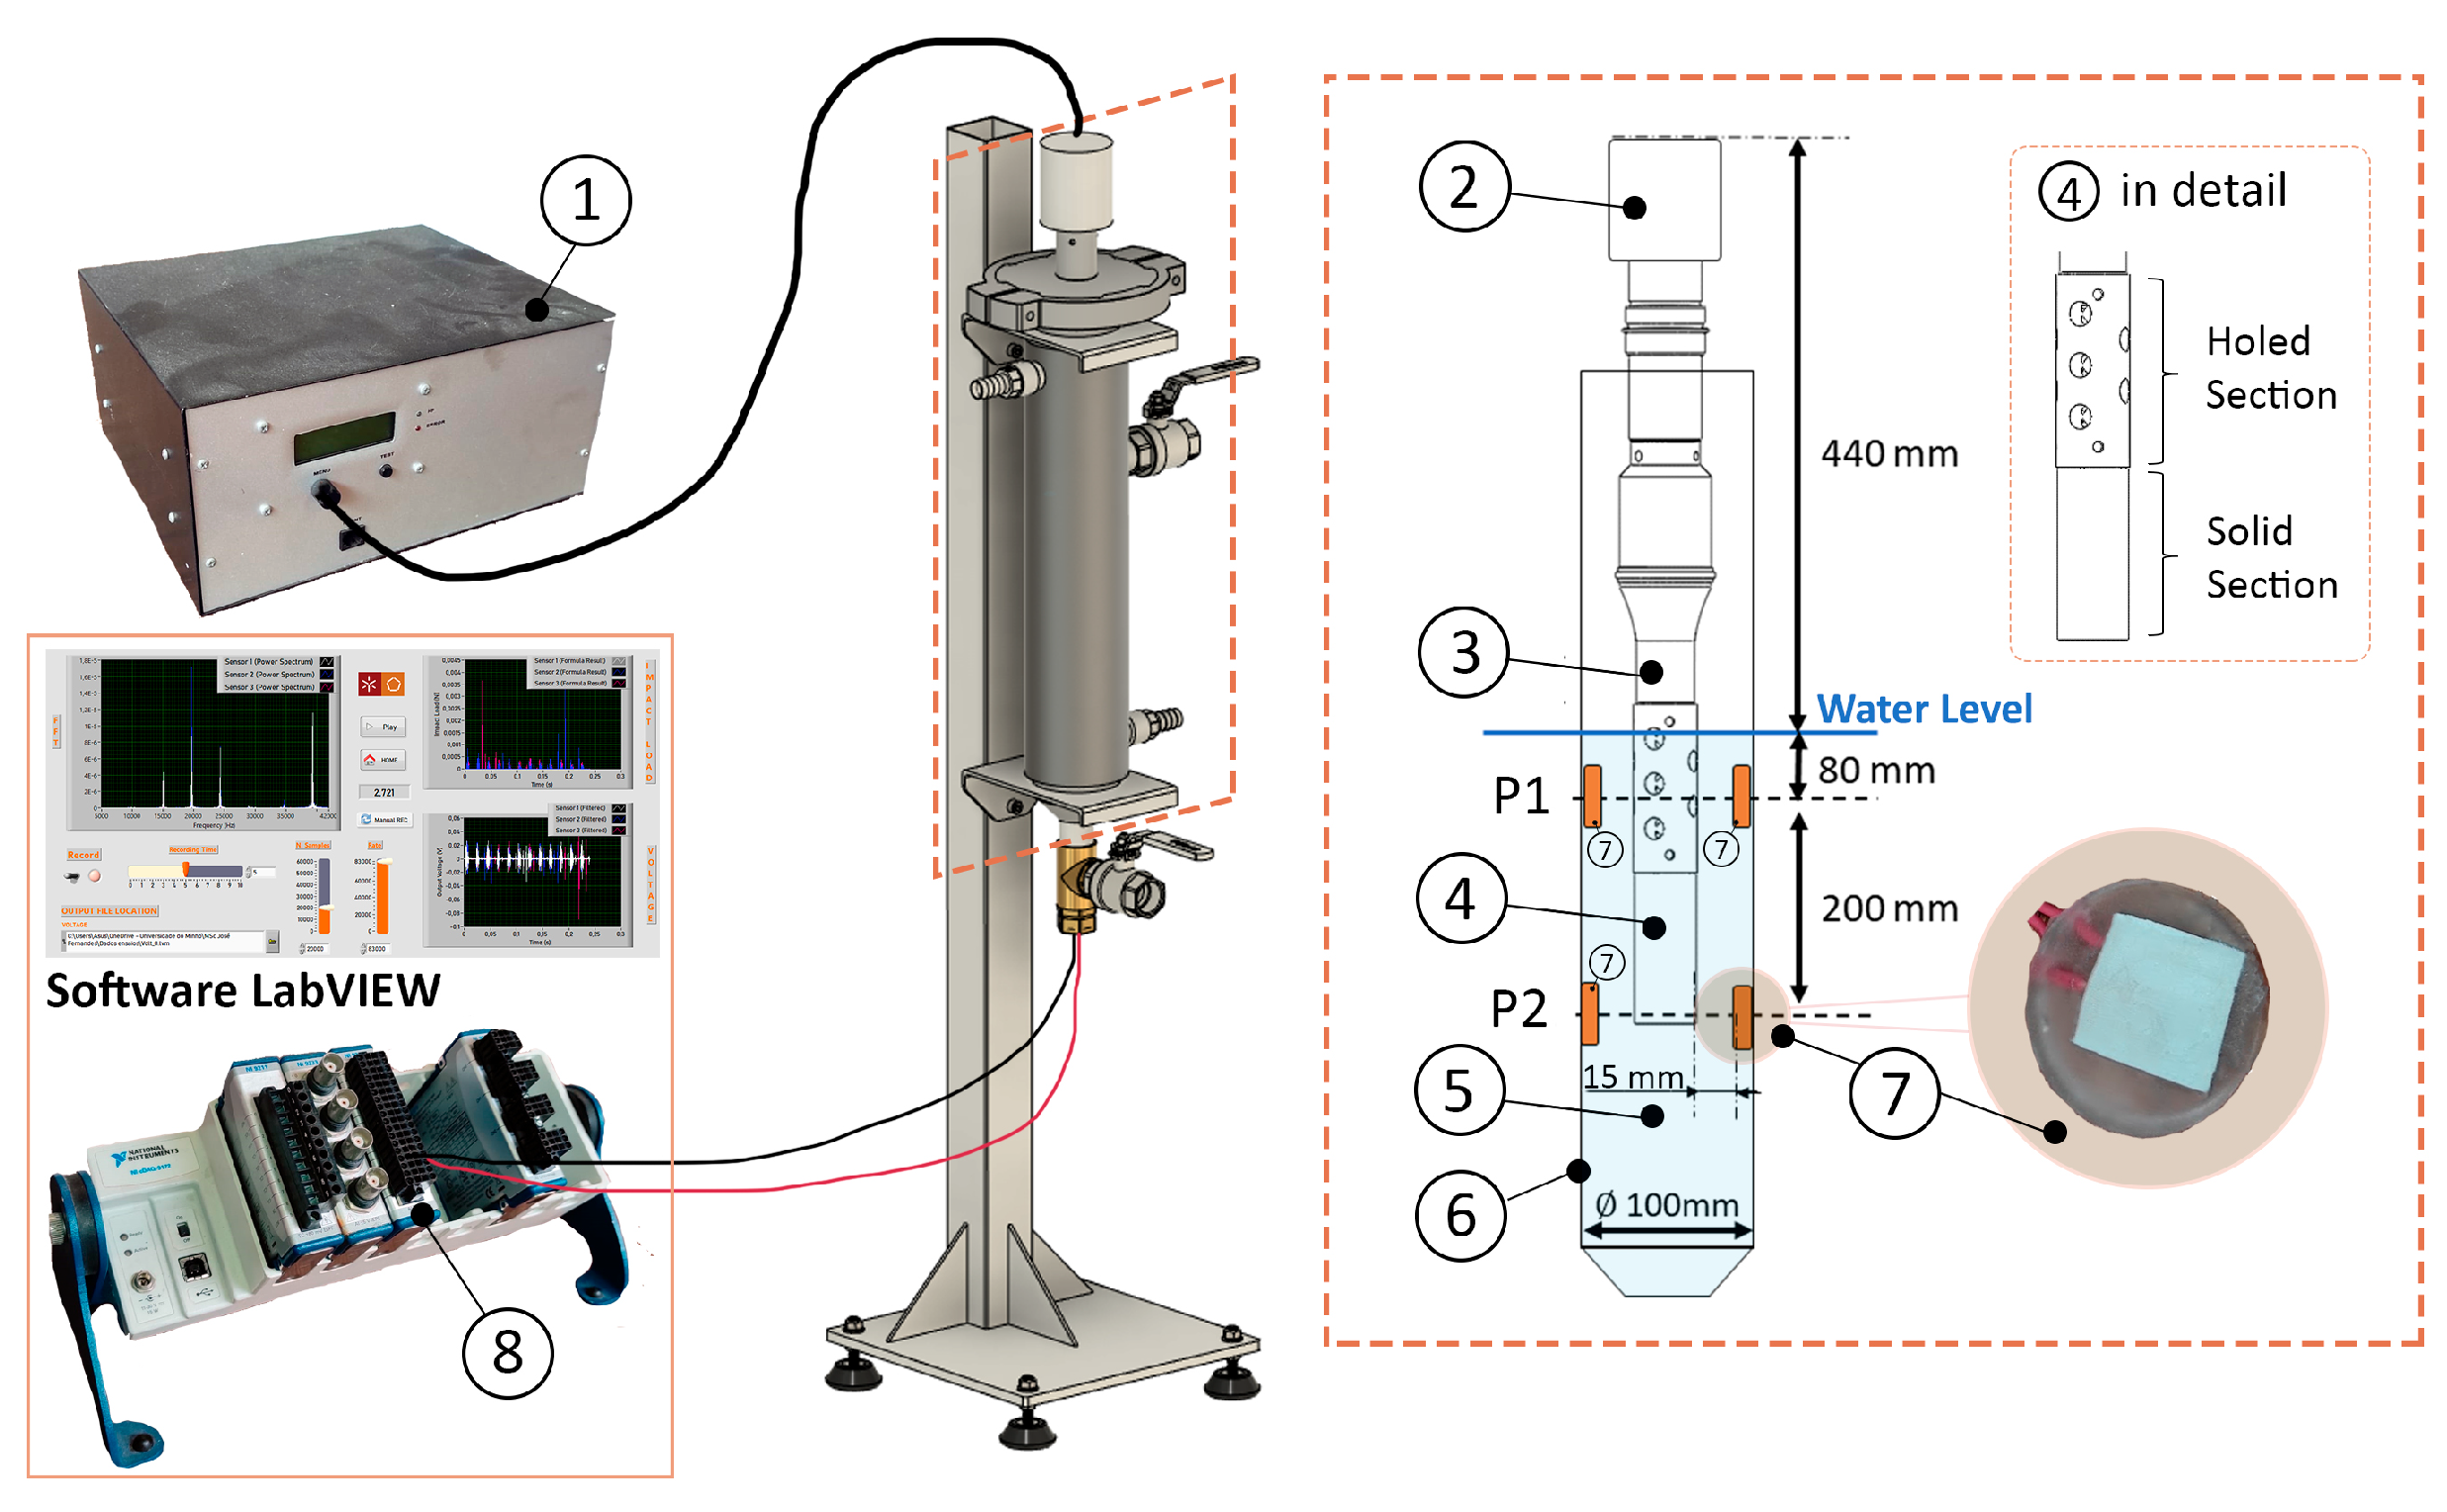
Figure 2.
Impedance level assessment for the US system conducted at different levels of submersion in water.
Figure 2.
Impedance level assessment for the US system conducted at different levels of submersion in water.

Figure 3.
Fast Fourier transform spectral levels of sub-harmonics, harmonics, and ultra-harmonics for 280 ± 10 W, 500 ± 10 W and 700 ± 10 W at Position 1.
Figure 3.
Fast Fourier transform spectral levels of sub-harmonics, harmonics, and ultra-harmonics for 280 ± 10 W, 500 ± 10 W and 700 ± 10 W at Position 1.
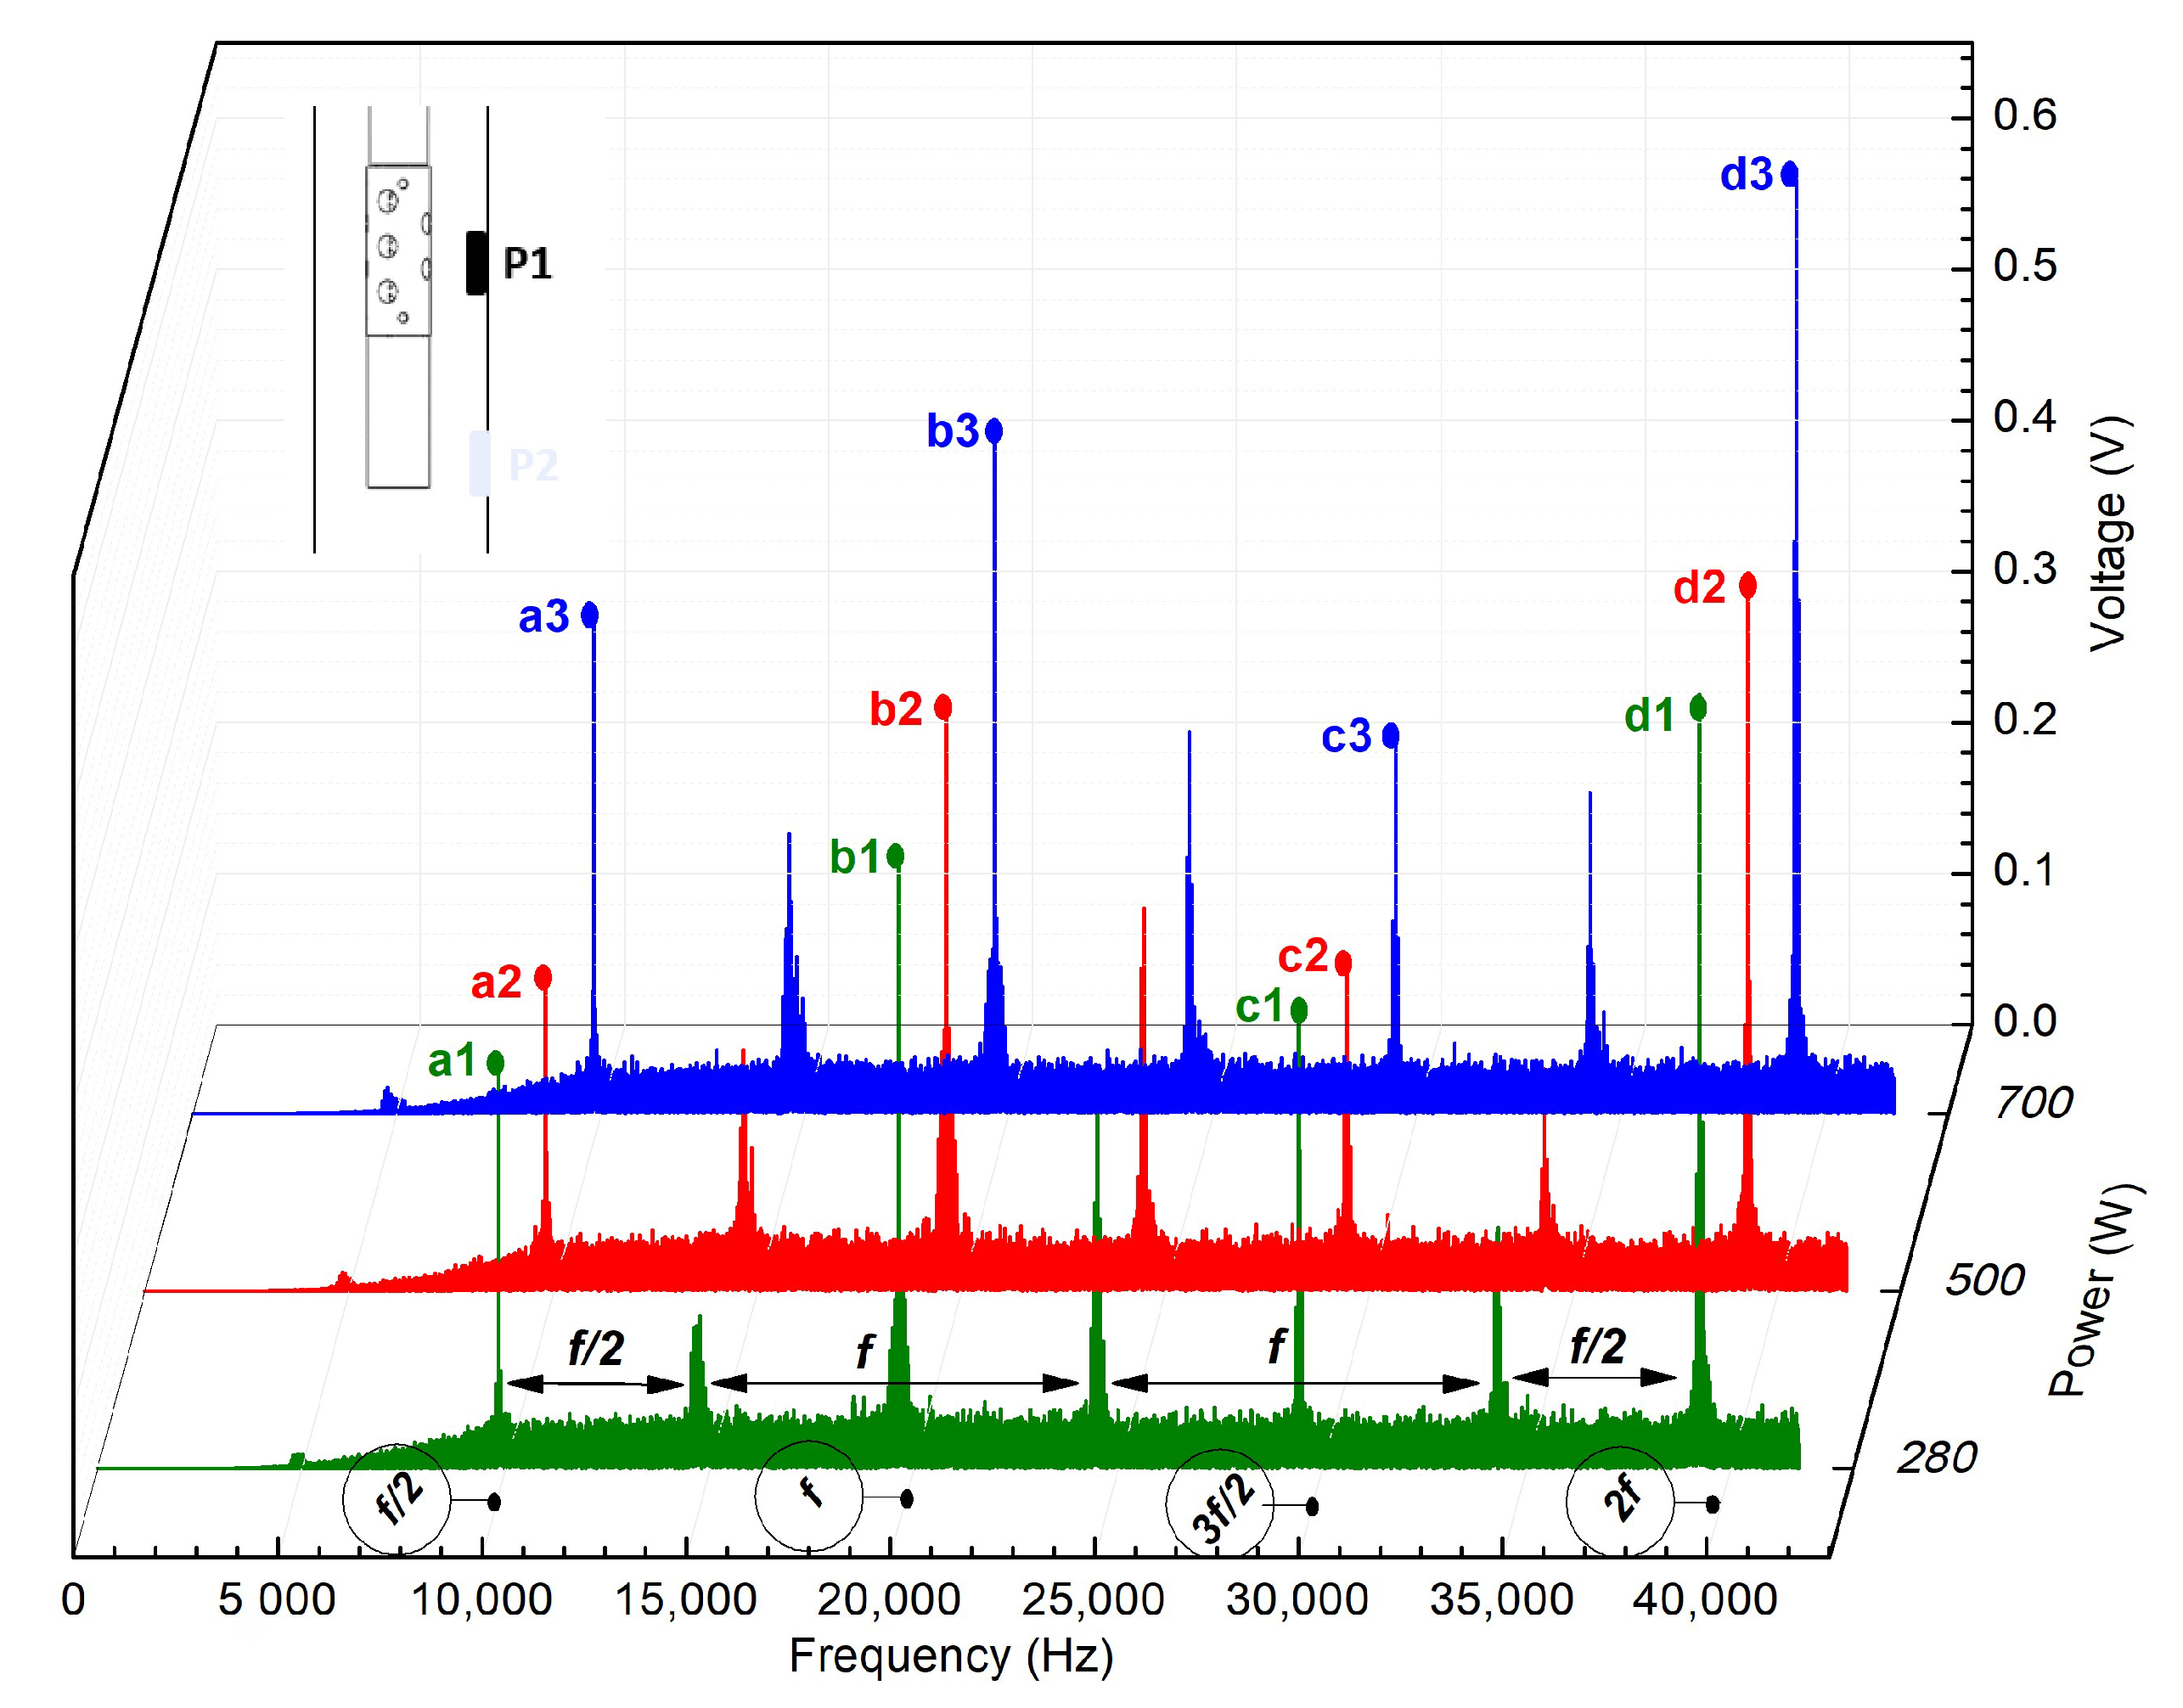
Figure 4.
FFT spectral levels of sub-harmonics, harmonics, and ultra-harmonics for 280 ± 10 W, 500 ± 10 W, and 700 ± 10 W at Position 2.
Figure 4.
FFT spectral levels of sub-harmonics, harmonics, and ultra-harmonics for 280 ± 10 W, 500 ± 10 W, and 700 ± 10 W at Position 2.
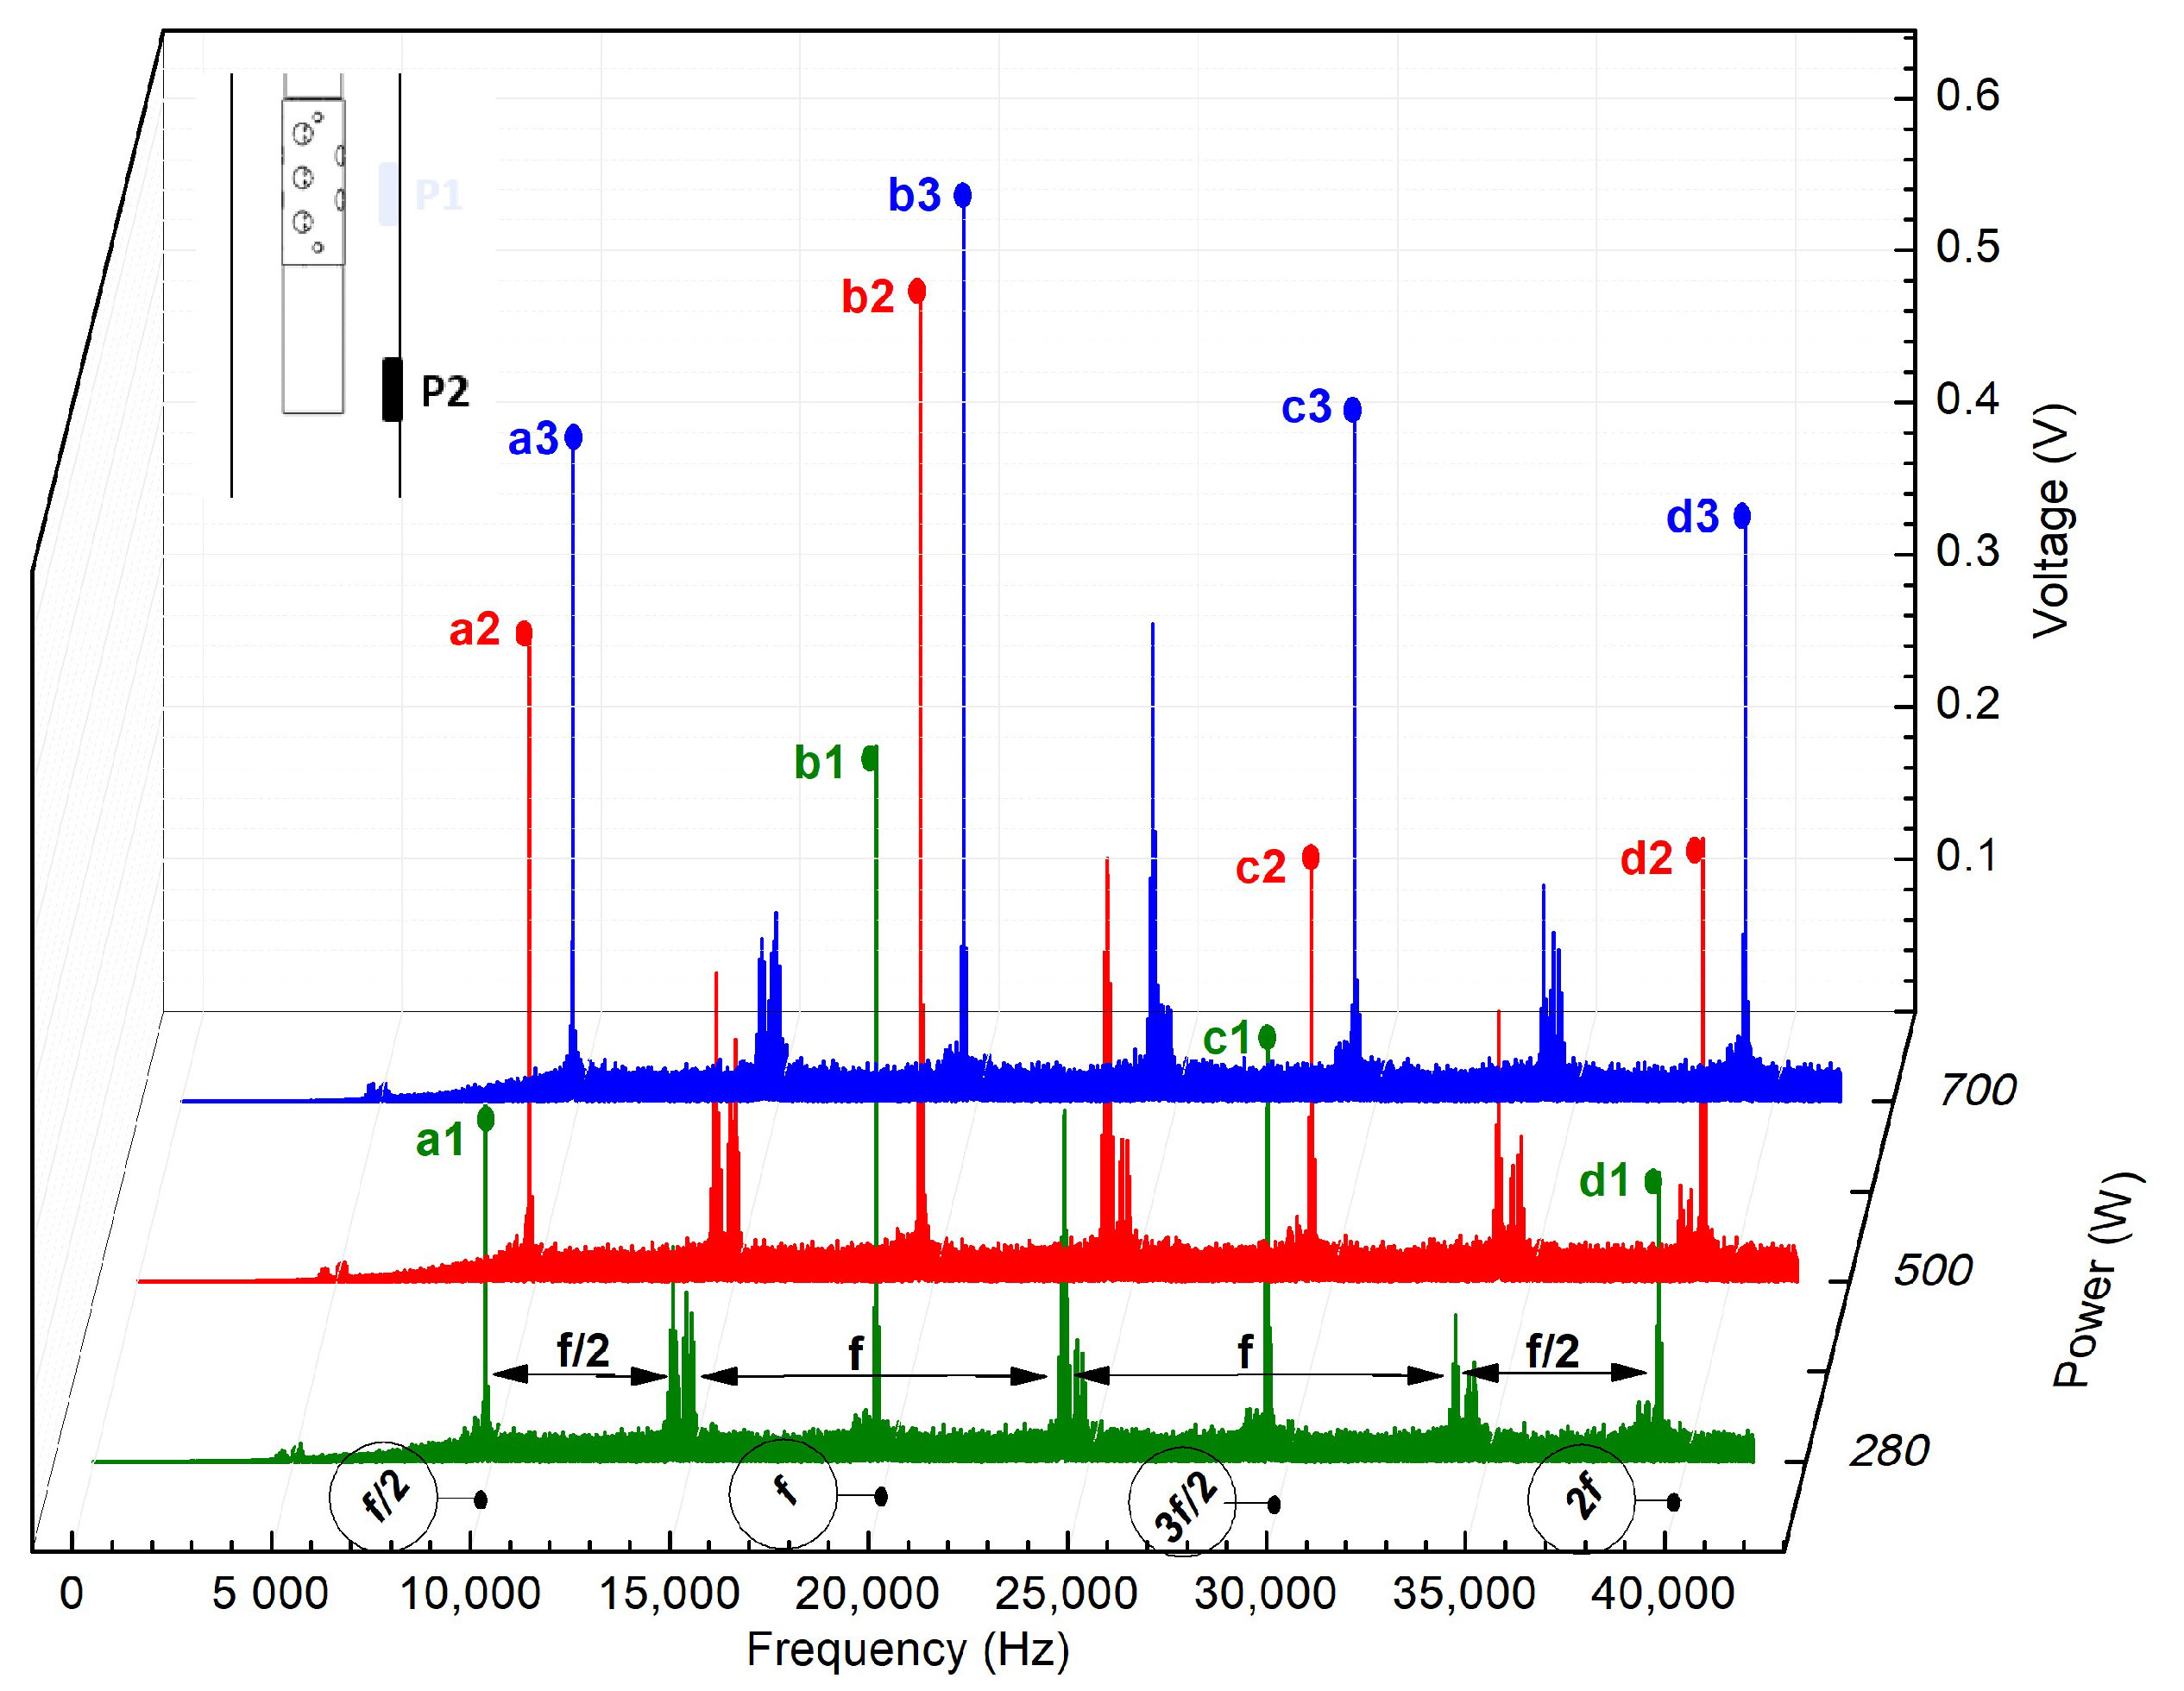
Figure 5.
Amplitude of the sub-harmonics as function of electrical power for Positions 1 and 2.

Figure 6.
Bubble formation due to cavitation over 4 s on (a) the bored zone and (b) solid zone of the acoustic radiator.
Figure 6.
Bubble formation due to cavitation over 4 s on (a) the bored zone and (b) solid zone of the acoustic radiator.

Figure 7.
Cavitation generation by the ultrasound acoustic radiator. (a) Ultrasound induces cavitation with axial and radial movements, creating centrifugal flow. Axial movements at base generate cavitation-aligned acoustic waves. (b) Acoustic streaming distribution along wave guide, low and high center amplitude. (c) Conical bubble structure on ultrasound acoustic radiator tip.

Disclaimer/Publisher’s Note: The statements, opinions and data contained in all publications are solely those of the individual author(s) and contributor(s) and not of MDPI and/or the editor(s). MDPI and/or the editor(s) disclaim responsibility for any injury to people or property resulting from any ideas, methods, instructions or products referred to in the content. |
© 2024 by the authors. Licensee MDPI, Basel, Switzerland. This article is an open access article distributed under the terms and conditions of the Creative Commons Attribution (CC BY) license (https://creativecommons.org/licenses/by/4.0/).
Share and Cite
MDPI and ACS Style
Fernandes, J.; Ramísio, P.J.; Puga, H. Unveiling Acoustic Cavitation Characterization in Opaque Chambers through a Low-Cost Piezoelectric Sensor Approach. Electronics 2024, 13, 1581. https://doi.org/10.3390/electronics13081581
AMA Style
Fernandes J, Ramísio PJ, Puga H. Unveiling Acoustic Cavitation Characterization in Opaque Chambers through a Low-Cost Piezoelectric Sensor Approach. Electronics. 2024; 13(8):1581. https://doi.org/10.3390/electronics13081581
Chicago/Turabian StyleFernandes, José, Paulo J. Ramísio, and Hélder Puga. 2024. "Unveiling Acoustic Cavitation Characterization in Opaque Chambers through a Low-Cost Piezoelectric Sensor Approach" Electronics 13, no. 8: 1581. https://doi.org/10.3390/electronics13081581
Note that from the first issue of 2016, this journal uses article numbers instead of page numbers. See further details here.