Article

Using Data Augmentation to Improve the Accuracy of Blood Pressure Measurement Based on Photoplethysmography

1
Aerospace Information Research Institute, Chinese Academy of Sciences, Beijing 100190, China
2
School of Electronic Engineering, Beijing University of Posts and Telecommunications, Beijing 100876, China
*
Author to whom correspondence should be addressed.
Electronics 2024, 13(8), 1599; https://doi.org/10.3390/electronics13081599
Submission received: 13 March 2024 / Revised: 19 April 2024 / Accepted: 19 April 2024 / Published: 22 April 2024

Abstract

:
Convenient and accurate blood pressure (BP) measurement is of great importance in both clinical and daily life. Although deep learning (DL) can achieve cuff-less BP measurement based on Photoplethysmography (PPG), the performance of DL is affected by few-shot data. Data augmentation becomes an effective way to enhance the size of the training data. In this paper, we use cropping, flipping, DTW barycentric averaging (DBA), generative adversarial network (GAN) and variational auto-encoder (VAE) for the data augmentation of PPG. Furthermore, a PE–CNN–GRU model is designed for cuff-less BP measurement applying position encoding (PE), convolutional neural networks (CNNs) and gated recurrent unit (GRU) networks. Experiment results based on real-life datasets show that VAE is the most suitable method for PPG data augmentation, which can reduce the mean absolute error (MAE) of PE–CNN–GRU when measuring systolic blood pressure (SBP) and diastolic blood pressure (DBP) by 18.80% and 19.84%. After the data augmentation of PPG, PE–CNN–GRU achieves accurate and cuff-less BP measurement, thus providing convenient support for preventing cardiovascular diseases.

1. Introduction

Blood pressure (BP) is one of the most important indicators of the cardiovascular system. Studies show that controlling BP within a reasonable range can effectively prevent cardiovascular diseases [1,2]. Therefore, accurate BP measurement is of great significance in both clinical and daily health. However, conventional cuff-based BP measurement methods, such as Korotkoff sound auscultation [3] and the oscillometric method [4], are quite inconvenient for patients due to the requirement of wearing a cuff on the arm.
Recently, cuff-less BP measurement based on pulse wave has attracted widespread research interest. The pulse wave is caused by the cyclical change of the contraction and relaxation of the ventricles [5] and contains rich physiological information, such as BP. Furthermore, pulse waves can be collected with Photoplethysmography (PPG) thanks to the advancement of hardware. Smartwatches or fingertip oximeters can achieve continuous PPG signal collection to support cuff-less BP measurement. However, the nonlinear relationship between PPG and BP is difficult to calculate directly [6]. Deep learning provides a data-driven method for BP measurement based on PPG [7].
There are mainly two kinds of data-driven BP measurement methods based on PPG: the feature-based method and the data-based method. The main idea of the feature-based method is to extract hand-crafted features, then explore the relationship between features and BP values [8,9,10]. The data-based method directly uses neural networks to fit the relationship between PPG and BP, without the need for hand-crafted feature extraction [11,12,13,14,15,16,17]. Generally, the accuracy of the data-based method is usually lower than the feature-based methods.
The data-driven BP measurement method, whether based on feature or data, requires the support of massive data for training. Most existing works are based on a Multi-parameter Intelligent Monitoring in Intensive Care (MIMIC) dataset, which currently has four open-source versions [18,19,20,21]. Although MIMIC contains physiological data such as BP and PPG from tens of thousands of patients, there exist issues of noise and missing values, resulting in a limited amount of available high-quality data. Considering the high cost of data collection, we can use data augmentation to expand the number of training samples to improve the performance of data-driven BP measurement methods.
The main idea of data augmentation is to generate synthetic data that cover the unexplored input space while maintaining correct data labels. Data augmentation performs well in computer vision [22] and natural language processing [23], but less attention has been paid to data augmentation for time series data [24].
Iwana et al. [25] introduced data augmentation methods of time series based on transformation, pattern mixing, generative models, and decomposition. Experiments on 128 datasets show that data augmentation can improve the accuracy of time series classification. Gao et al. [26] designed a time–frequency data augmentation scheme to improve the performance of time series anomaly recognition. In the time domain, they generated synthetic data through flipping and downsampling. In the frequency domain, they generated synthetic data through making perturbations in magnitude and phase.
There is currently little research on PPG data augmentation. Kiyasseh et al. [27] proposed a data augmentation method based on conditional generative adversarial networks (CGANs), which can lead to an improvement of medical diagnosis tasks by up to 29%. Similarly, Ding et al. [28] designed log-spectral matching GAN (LSM-GAN) to alleviate the class imbalance in a PPG dataset. Experiments show that using LSM-GAN for PPG data augmentation can improve the accuracy of atrial fibrillation detection. Mazumder et al. [29] proved that generating synthetic PPG data to train classifiers can improve performance for coronary artery disease. Variational autoencoder (VAE) can outperform a baseline GAN architecture.
Although some research shows that generating synthetic time series data can improve the performance of regression models [30,31], there is a lack of research on data augmentation in the regression problem of BP measurement based on PPG. Song et al. [32] paid attention to data augmentation in BP measurement, but they used multivariate Gaussian distribution to generate PPG features rather than raw PPG data. Wu et al. [33] designed GAN to generate synthetic remote photoplethysmography (rPPG), which can reduce errors in BP measurement. rPPG is extracted from face image and differs from fingertip PPG. In this paper, we use the data augmentation of PPG to improve the accuracy of cuff-less BP measurements. The contributions of this paper are as follows:
1.
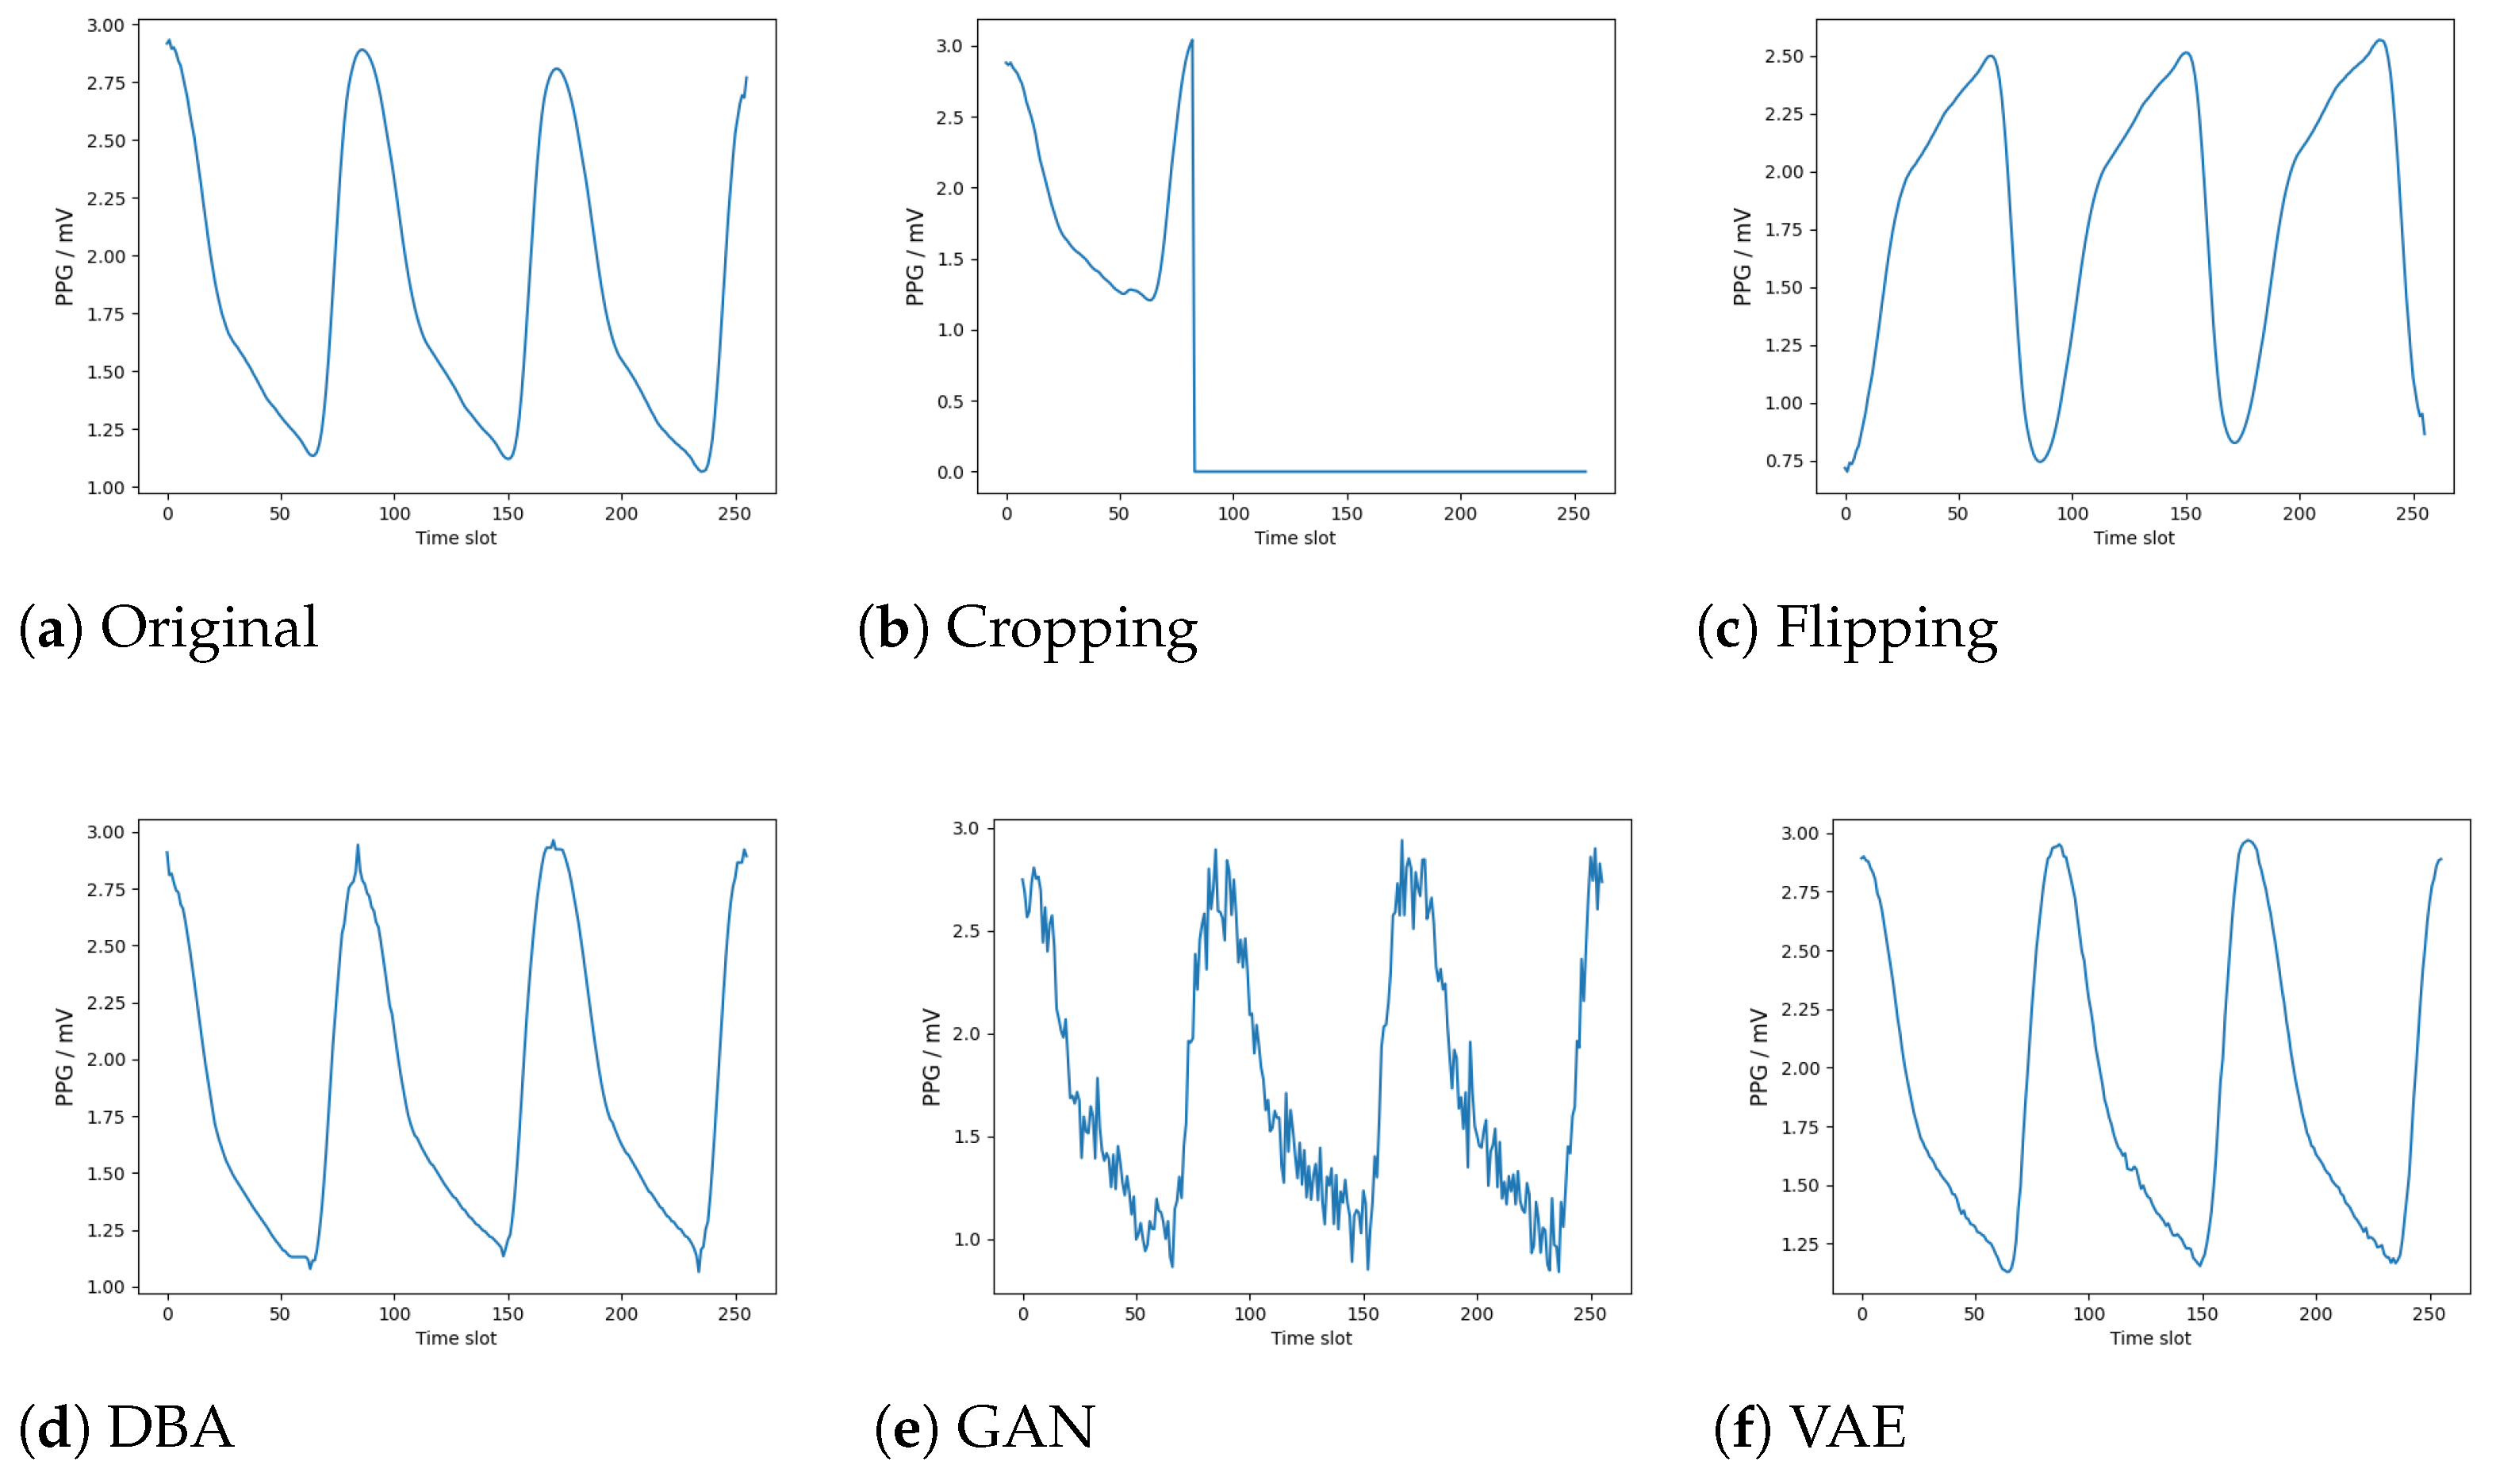
In order to improve the accuracy of BP measurement based on few-show PPG data, we design five PPG data augmentation methods: flipping, cropping, DTW barycentric averaging (DBA), generative adversarial network (GAN) and variational auto-encoder (VAE). Each method can generate synthetic PPG data to expand the size of dataset.
2.
We design a data-driven model applying position encoding (PE), a convolutional neural network (CNN) and a gated recurrent unit (GRU) network to fully utilize the sequence information in PPG. The well-trained model end-to-end outputs BP values based on PPG data as inputs, thus realizing cuff-less BP measurement.
3.
We perform valid experiments based on a MIMIC II dataset. Results show that VAE improves the measurement accuracy most significantly. PE–CNN–GRU after PPG data augmentation performs well in cuff-less BP measurement compared to existing works.
The remainder of this paper is organized as follows. In Section 2, we introduce the preprocessing of PPG and BP data. In Section 3, we introduce all the PPG data augmentation methods. In Section 4, we introduce the PE–CNN–GRU model for BP measurement based on PPG. The numerical results and performance analysis are shown in Section 5. Finally, we make brief conclusions in Section 6.

2. Data Preparation

In this paper, we use PPG and BP data from the processed sub-dataset of MIMIC II. Although Kachuee et al. [34] smoothed signals using average filtering and removed abnormal and irregular segments to form this sub-dataset, there still exist artifacts in PPG. It is necessary to design preprocessing methods based on characteristics of PPG data.

2.1. Detection of Artifacts in PPG

Artifacts are unwanted or erroneous components that distort the original signal, which can be caused by various factors such as motion and sensor displacement, etc. Artifacts can seriously affect the quality of PPG, resulting in the PPG data being unacceptable for model training; thus, it is important to detect and remove artifacts in PPG [35]. However, existing works often focus on the denoising of PPG signals but neglect the detection and removal of artifacts.
Due to the uncertainty of collection devices and test subjects, artifacts are often randomly embedded in PPG signals. In order to detect the range of artifacts accurately, we first divide PPG signals into non-overlapping segments for every 1000 data points. Pulse waves change with the regular contraction and relaxation of the heart, so PPG is a kind of quasi-periodic signal [36]. In detail, PPG shows certain periodicity, but the waveform of each period is not completely consistent. There is even no fixed length of each period. However, there is a strong correlation between periods of PPG, and artifacts break the correlation between normal periods. Therefore, we use the Pearson correlation coefficient to evaluate the correlation between periods of PPG.
Considering that the principal wave of PPG is the most obvious and easy to capture, we use PeakUtils package in Python to capture the principal wave. Then, there is a period of PPG between the two principal waves. For each segment of PPG, assuming N + 1 principal waves are obtained, the index is represented as i 1 , i 2 , , i N + 1 . There are N periods between these N + 1 principal waves, which are denoted by S 1 , S 2 , , S N .
The Pearson correlation coefficient is the quotient of the covariance and standard deviation of two sets of data. Generally, the length of the two sets of data needs to be equal when calculating the Pearson correlation coefficient. Considering that the length of the PPG period in this paper is not fixed, we design a calculation method of correlation coefficient for PPG:
r i , j = max n = 0 , l j l i   C o v S i 1 : l i , S j 1 + n : l i + n σ S i 1 : l i · σ S j 1 + n : l i + n , 0.5 < l i / l j < 1 max n = 0 , l j l i   C o v S i 1 + n : l j + n , S j 1 : l j σ S i 1 + n : l j + n · σ S j 1 : l j , 1 l i / l j < 2 0 , e l s e
where C o v · denotes the covariance of two variables, and σ denotes the standard deviation of two variables.
Then, we can construct a correlation coefficient matrix for each PPG segment, which is defined as:
R = r 1 , 1 r 1 , 2 r 1 , N r 2 , 1 r 2 , 2 r 2 , N r N , 1 r N , 2 r N , N ,
where r i , j represents the correlation coefficient between S i and S j . Obviously, r i , i = 1 , r i , j = r j , i . Furthermore, we designed the quality index of pulse wave ( Q I P W ) to evaluate the state of artifacts in PPG segments, which is calculated as:
Q I P W = i = 1 N j = 1 N r i , j N 2 .
The value range of Q I P W is 1 , 1 . If the value of Q I P W is close to 1, there are less artifacts within the PPG segment. Figure 1 displays PPG signal segments in different Q I P W . The Q I P W in the left figure is 0.9963. It can be seen that there are no artifacts in this segment, and the signal quality is good. The Q I P W in the middle figure is 0.8502, and it can be clearly seen that there are artifacts in this segment. The Q I P W in the right figure is 0.669. This segment has relatively severe artifacts. As a result, Q I P W is very sensitive to artifacts and has strong robustness.

2.2. Formation of PPG-BP Samples

After calculating Q I P W for all segments, we can set a reasonable threshold. In this paper, we set the threshold value to 0.99; then, we discard PPG segments below the threshold and only select PPG segments above the threshold for further processing. About 59% of PPG segments are discarded. These PPG segments with high Q I P W , i.e., high-quality PPG segments, are used to form the PPG-BP samples.
Inspired by [37], we segment PPG and reference BP signals into non-overlapping windows with respect to the position of the cardiac periods. We adopt a variable PPG window, i.e., each window contains a fixed number of periods, rather than setting a fixed length of window. The collection frequency in MIMIC II is 125 Hz, while the heart rate of normal people is between 60 and 100 beats per second. Therefore, the length of each period is within 1 s, which is less than 125 data points. We set up a PPG window for every four principal waves. Each window contains three complete periods, i.e., approximately 200 to 400 data points. The physiological information contained in these three complete periods of PPG can effectively support BP measurements during this window. Considering that BP values fluctuate over time, dividing the PPG into windows can achieve more accurate BP measurements than directly using the PPG segment with a long-time scale.
The BP measurement method based on DL requires fixed-length input, so it is necessary to unify the length of PPG windows. We use Fast Fourier Transform (FFT) to uniformly resample the PPG window to 256 data points. Examples of resampled PPG windows are shown in Figure 2. It can be seen that we obtain high-quality PPG windows after data preprocessing.
The SBP and DBP associated with each PPG window are calculated as follows. For each PPG segment with 1000 data points, the corresponding ABP window is located with the same starting and ending time steps. The maximum value and minimum value of this ABP window are used as the reference SBP and DBP values.

3. Data Augmentation of PPG

Due to the amount of preprocessed data being relatively small, it is prone to over-fitting when training DL models for BP measurements. In this paper, we introduce different data augmentation methods to generate synthetic PPG data to improve the accuracy of BP measurements. The illustration of the PPG data augmentation pipeline is shown in Figure 3.

3.1. Cropping and Flipping

Cropping and flipping are both basic data augmentation methods in time domains [24]. In the cropping method, we crop each PPG window in a certain proportion to generate new PPG windows. The deep learning model needs a fixed length of the input, and it is necessary to use zero-padding to unify the newly formed PPG window length to 256 data points. The processing of cropping is denoted as follows:
p w c r o p i n = p w i n , n r o u n d ( k i · N ) 0 , n > r o u n d ( k i · N )
where N is the length of PPG windows. k i 0 , 1 is the random cropping proportion. r o u n d ( ) is the rounding operation. An example of synthetic PPG windows generated by cropping is shown in Figure 4b.
In the flipping method, we flip the PPG window left and right or up and down to form new PPG windows. Compared to the clipping method, flipping does not change the length of the PPG windows, so there is no need for further zero-padding. The processing of cropping is denoted as follows:
p w f l i p i n = p w i N + 1 n , i % 2 = 0 2 · m e a n P i p w i n , i % 2 = 1
where m e a n P i is the mean value of P i , which means we flip the PPG windows up and down on the mean value axis. An example of synthetic PPG windows generated by flipping is shown in Figure 4c.

3.2. DTW Barycentric Averaging

We introduce DTW barycentric averaging in [25] to achieve the data augmentation of PPG. Dynamic time warping (DTW) is a method of elastic measures, which is commonly used to measure the distance between two temporal sequences. Compared to the lock-step measures, DTW linearly scales one of the sequences (i.e., warping). Each point from this sequence can be matched with one or more points from the other sequence when calculating distances, and the mapping of points must be monotonically increasing. DTW can find the nearest distance as much as possible, thus better measuring the similarity between two temporal sequences.
The main idea of DBA is to calculate the weighted average time series of a set of time series based on DTW, which minimizes
a r g min P ¯ E i = 1 I w i · D T W 2 P ¯ , P i ,
where D T W means calculated distance based on DTW. w i is the weight, which means each time series contributes differently to the final average. P ¯ can be used as a new synthetic sample.
In this paper, we randomly select two samples each time to calculate a synthetic PPG window using DBA. An example of synthetic PPG windows generated by DBA is shown in Figure 4d. We can find that the generated PPG window has a similar trend to the original data. However, there are morphological differences between the synthetic data and the original data in peaks and valleys.

3.3. Generative Adversarial Network

GAN is one of the most representative data augmentation methods in the field of computer vision [38]. Considering that PPG can be seen as image data, we use GAN to generate synthetic PPG data to explore whether GAN can achieve valid PPG data augmentation.
The structure of GAN is shown in Figure 5. GAN consists of a generator and a discriminator. The generator G takes random noise as input to generate synthetic data. The discriminator D discriminates between the synthetic data and the real data. During the training of GAN, the generator hopes that synthetic data is as close to the real data as possible, which requires the accuracy of the discriminator to become worse, but the discriminator requires the accuracy to become better. Therefore, the generator and the discriminator form a two-player minimax game [39]. The well-trained generator in GAN that can generate data has exactly the same probability distribution as the real data, i.e., the generator generates synthetic data that are the same as the real data.
As shown in Table 1, we design the generator and discriminator in GAN based on the characteristics of PPG data. We set the input of the generator as a one-dimensional random noise with a length of 256, which follows a normal distribution. The input noise is encoded with a fully connected (FC1) layer containing 128 neurons. Through a fully connected (FC2) layer containing 128 neurons and a fully connected layer (FC3) containing 256 neurons, the encoded vector is decoded, and synthetic PPG data is achieved. We also use batch normalization layers between fully connected layers. We design the discriminator as a Multi-Layer Perception (MLP). In detail, the input passes through fully connected layers consisting of 512 neurons (FC1), 256 neurons (FC2), and 1 neuron (FC3) to output the classification results. We also used batch normalization layers in the discriminator.
As shown in Figure 4e, the synthetic PPG window generated by GAN has a similar morphology and trend to the original data. Although we have fine-tuned the structure and training epochs of GAN, there still exist burrs in generated PPG data.

3.4. Variational Auto-Encoder

We design and train a variational auto-encoder (VAE) network for data augmentation. VAE is considered one of the most important methods in the field of deep generative models. Unlike a traditional auto-encoder (AE), which describes latent spaces through numerical means, VAE describes observations of latent spaces as probability distribution.
As shown in Figure 6, VAE consists of an encoder and a decoder. During training, the input of VAE is real PPG data. The encoder maps the input data into a Gaussian probability density function z in latent space. New samples can be drawn from the Gaussian probability for generating synthetic data via the decoder. The goal of training is to minimize the reconstruction error between the encoded–decoded data and the initial data. The loss function of VAE is shown as follows:
l o s s = x x ^ 2 + K L N μ x , σ x , N 0 , 1 .
In Equation (7), the first component x x ^ 2 is the reconstruction loss, which ensures the output x ^ closely matches the original input x. The second component K L N μ x , σ x , N 0 , 1 is the regularization term, where K L means the Kullback–Leibler Divergence. The regularization term ensures that the distribution of latent space conforms to a standard Gaussian distribution, which can control latent variability and encourage probabilistic modeling. The loss function of VAE balances accurate reconstruction with regularization, making it more powerful for data representation and generation.
We design the structure of the VAE based on the characteristics of PPG data, which is shown in Table 2. The input of the encoder is set to 256. The input layer is followed by a hidden layer (FC1) with 128 neurons. The length of latent space is set to 64. In detail, two fully connected layers (FC1 and FC2) are used as the mean vector and standard deviation (SD) vector in latent space. Then, a sampling layer is designed to achieve sampling operation. The hidden layer (FC1) of the decoder has 128 neurons. Finally, a fully connected layer (FC2) with 256 neurons is used to output the synthetic PPG windows. The synthetic PPG windows generated by VAE is shown in Figure 4f. We can find that the generated data are very close to the original data in both morphology and trend.

4. Blood Pressure Measurement Based on PE–CNN–GRU Model

In this paper, each PPG window can be represented as P i = [ p w i 1 , p w i 2 , , p w i 256 ] . The SBP and DBP values related to PPG window P i can be represented by B i = [ S B P i , D B P i ] . The process of using DL models to measure BP based on PPG is to fit the approximate function f ^ , which maps P i to the approximate measured BP value B ^ i . The closer the approximate value B ^ i is to the real value B i , the better the performance of the model.

4.1. Position Encoding

In our previous works [16,17], we have proved that combining convolutional neural networks with recurrent neural networks (LSTM or GRU) can achieve good performance in BP measurement. However, the receptive fields of the first few layers in a CNN are relatively small, and they are not enough to effectively extract the features of PPG solely based on CNN. In this paper, we introduce the position encoding (PE) technology in the Transformer [40] to capture the sequence information in PPG.
The main idea of PE is to encode the sequence information through the position index, which is defined as follows:
P s p = p ,
where P s is the sequence information, and p is the position index. Then, the information is mapped into high-dimensional space using the position encoding basis p b , which is defined as follows:
p b j = 10 , 000 j / p d ,
where j is the dimension index. Based on p b , position encoding vectors P R d in high-dimensional spaces can be defined as follows:
P p , j = p p b j .
In order to enhance the ability of the proposed model for nonlinear problems, we need to introduce the nonlinear function F to further calculate the position encoding vector:
P p , j = F P p , j , j ,
where P p , j is the final position encoding vector, and F is defined as follows:
F , j = sin , j % 2 = 1 cos , j % 2 = 0

4.2. The Receptive Field of CNN

When designing a CNN, we need to consider the relationship of the length of input data and the receptive field of CNN. The receptive field is the region in the input space that a CNN feature is affected by. The size of the receptive field can represent the ability of the feature map in capturing information.
In general, the convolutional kernel is much smaller than the input size; thus, the kernel can only capture information of the input for a short period of time rather than capturing information in a broader time dimension. However, increasing the size of the convolutional kernel results in more parameters and a higher computational complexity of neural networks. In fact, the ability of a CNN to capture information on time sequence is not solely determined by the size of the convolutional kernel. Instead, the receptive field size of the final output feature map has a significant impact on the capture ability.
Given a CNN, the receptive field of the output feature map is calculated as follows:
r f = l = 1 L k l 1 i = 0 l 1 s i + 1 ,
where k l is the kernel size of the l-th layer, and s i is the stride of kernels in the i-th layer. Specially, s 0 is the stride of the input, so we set s 0 = 1 .

4.3. The Architecture of PE–CNN–GRU Model

The architecture of the proposed PE–CNN–GRU model is shown in Figure 7. Due to the fact that the dimensionality of the input and the dimensionality of the position encoding vector may be different, we need to use two functions ϕ and ψ to map input and position encoding vector to the same dimension [41]. ϕ and ψ are implemented via two convolutional layers. In each layer, the number of channels is 16, the kernel size is 1 and the stride is 1 (denoted by (16, 1, 1) in Figure 7). The input and position encoding vector are inputted into the convolutional layer separately. Then, they are fused using element wise add and further inputted into CNN.
In order to capture the global feature from the input PPG data, we hope that the receptive field of the final output feature map r f is greater than or equal to the length of the input. Therefore, we set up seven convolutional modules in the proposed model. Each module consists of a convolutional layer, an activation function layer (ReLU layer), and a batch normalization layer. Referring to classic CNN such as VGG16 [42] and ResNet [43], as the number of layers deepens, the size of the kernels shows a decreasing trend, and the number of channels shows an increasing trend. Taking the first convolutional module as an example, (16, 5, 2) indicates that the number of channels is 16, the kernel size is 5, and the stride is 2. According to Equation (13), the receptive field of the CNN in the PE–CNN–GRU model is 261, which can effectively capture the information of the input PPG data with a length of 256.
Feature maps extracted by a CNN are then inputted into the GRU module for further processing. As one of the variants of recurrent neural networks, a GRU can exploit the long-term dependence and sequence information of PPG data with the help of the reset gate and the update gate inside its units. The GRU module contains two GRU hidden layers, each containing 64 units. The GRU module outputs tensors to a fully connected (FC) layer containing two neurons. The fully connected layer finally outputs b ^ i , which contains the predicted SBP and DBP values.
In summary, the proposed model uses position encoding to fully capture the sequence information in PPG, which can avoid the neglect of sequential information in a CNN. The proposed model further combines the ability of a CNN in feature extraction and the advantages of a GRU in processing time series, making it more efficient and more accurate for BP measurement through better utilization of features in PPG.

5. Numerical Results and Performance Analysis

5.1. Dataset Description

After the pre-processing of the PPG data, a total of 18,023 pieces of data were formed for training and testing, and the distribution of BP is shown in Figure 8. The red line is the mean value, and the blue line is mean±std. The mean value of SBP is 140.52 mmHg, with a standard deviation of 23.92 mmHg. The mean value of DBP is 58.83 mmHg, with a standard deviation of 9.39 mmHg. The data used in this paper were collected from patients in an Intensive Care Unit (ICU), and BP values were measure via arterial puncture method in the brachial/radial artery. We can find that the average SBP is higher than SBP measured in daily life. Generally, SBP is higher in the brachial/radial artery than in the aorta, while DBP remains unchanged [44]. However, most of the DBP values are concentrated around 50 mmHg, with a low proportion exceeding 90 mmHg, which is caused by unstable vital signs of patients in ICU.
We control the number of windows for each piece of test data to avoid an uneven distribution of training data. In detail, for each piece of the measured data of each user, 80% of the windows are used for training, and the remaining 20% are used for testing. This results in a total of 14,211 pieces of training data and 3812 pieces of test data. All pieces of PPG data are non-overlapping.

5.2. Performance of Data Augmentation Methods

In this paper, we use data augmentation methods to double the size of the training set, without augmentation of the test set. For augmented PPG windows, we label the same SBP and DBP values as the original PPG windows. As a result, the augmented training set contains 28,422 pieces of data, which does not change the BP distribution of the original data.
The goal of data augmentation is to improve the accuracy of a BP measurement. Therefore, we train the PE–CNN–GRU model using the augmented training set of each method and then test the model performance based on the same test set to evaluate whether the method achieves valid data augmentation.
We choose mean absolute error (MAE), root mean square error (RMSE), mean error (ME) and standard deviation of error (SD) to evaluate the BP measurement performance of the PE–CNN–GRU model. The impact of data augmentation methods on the performance of SBP measurement and the impact of data augmentation methods on the performance of DBP measurement are shown in Table 3 and Table 4, respectively.
In the clipping method, we cut each window with a certain ratio. Although the generated data maintain the same distribution as the original data, cropping still causes the loss of information in the PPG windows. As a result, cropping can reduce all the metrics of DBP measurement and reduce the MAE of the SBP measurement, but it increases the RMSE and SD of the SBP measurement. Therefore, using clipping cannot effectively improve the accuracy of a BP measurement.
In the field of image data augmentation, flipping does not significantly change data distribution. However, PPG is a kind of one-dimensional temporal signal. Flipping the data left and right or up and down destroys the original data distribution; thus, using generated data for training has a negative impact on the PE–CNN–GRU model. As a result, the flipping method increases the measurement error of SBP and DBP.
The most significant advantage of DBA is using the warping operation to align PPG windows in morphology before calculating the weighted average series. As mentioned in Section 2, we use Q I P W to ensure that periods have strong correlation and different PPG windows have similar distributions. As a result, DBA improves the performance of SBP and DBP measurements and achieves valid data augmentation due to generated synthetic data with a distribution similar to the original data.
In GAN, the generator takes random noise as an input to generate synthetic PPG data. In other words, the synthetic data comes from noise, which causes burs in the synthetic data. The discriminator is also unable to effectively distinguish synthetic data containing burrs from real data. The synthetic data are equivalent to data with poor quality, which affects the training of the PE–CNN–GRU model. Therefore, this method has deteriorated in all metrics of SBP and DBP measurements compared to the method without augmentation.
VAE represents the latent space in a probabilistic manner, which is very suitable for representing PPG signals with certain regularity. When training VAE, the latent space becomes similar to the prior distribution of input PPG. The decoder draws random samples from the prior distribution and then converts them to the input space; thus, the generated PPG data have the same distribution as the real data. Therefore, we can find that VAE significantly improves the measurement accuracy of the PE–CNN–GRU model for SBP and DBP. In terms of SBP, VAE causes the most significant decrease in MAE, reaching 18.80%. Considering that RMSE, which is more sensitive to outliers, also decreases significantly, VAE achieves an overall improvement in SBP measurement accuracy. In terms of DBP, VAE also performs best, which can reduce MAE and RMSE by 19.84% and 10.39%. Therefore, VAE is the most suitable data augmentation method in this paper. In addition, most researchers use signal denoising methods to improve accuracy of BP measurements from PPG. Kachuee et al. [34] used denoising methods such as an averaging filter to form the high-quality dataset used in this paper, but signal denoising cannot solve the problem of a limited amount of PPG data. The superior performance of data augmentation by VAE shows that data augmentation can further improve the accuracy of BP measurements based on signal denoising.

5.3. Performance Comparison of PE–CNN–GRU

We select some representative deep learning BP measurement methods based on PPG data directly as baselines. Due to the lack of open-source code or a detailed description of the model structure, we directly use the performance of ANN, CycleGAN and Transformer in their papers. We reproduce ResNet+LSTM, RDAE and PPG2ABP based on our data. In addition, we redesign the CNN–GRU model proposed in our previous work [16] as a baseline to verify the effectiveness of the PE. The performance comparison between PE–CNN–GRU after data augmentation with baselines is shown in Table 5. N/A means the metrics are not available in related references.
When comparing with CNN–GRU, PE–CNN–GRU reduces the MAE of SBP and DBP measurements by 36.13% and 28.11%. The CNN neglects the sequence information of the original data when extracting features. PE effectively solves this problem by calculating the extra position encoding vector as part of the input. Therefore, the use of PE can significantly improve the accuracy of a BP measurement.
After the data augmentation of PPG, PE–CNN–GRU achieves the second best performance for DBP measurement, only worse than Transformer. For SBP measurement, only Transformer and Cycle GAN are more accurate than PE–CNN–GRU. Compared to PE–CNN–GRU, Transformer and Cycle GAN have more parameters and more complex structures. The performance of PE–CNN–GRU in RMSE and SD means there exit outliers, which is consistent with the Bland–Altman analysis in Figure 9. Compared with existing data-driven models, CNN has significant advantages for the feature extraction of PPG, which can help the model better fit the relationship between PPG and BP. The only problem of CNN is that extracting features can cause a loss of sequence information, but this can be compensated by PE. GRU further utilizes long-term dependence and sequence information through the reset gate and update gate with each GRU unit. The proposed PE–CNN–GRU can realize accurate BP measurement. However, we need to conduct further research on post-processing methods for measurement results to reduce the RMSE and SD of SBP measurements.

6. Conclusions

In this paper, we focus on using the data augmentation of PPG to improve the accuracy of BP measurements. After the detection and removal of artifacts in PPG, high-quality PPG windows are formed from the MIMIC II dataset. Considering that few-shot PPG data limit the performance of BP measurements, we use cropping, flipping, DBA, GAN and VAE for the data augmentation of PPG. Then, a PE–CNN–GRU model is proposed to achieve cuff-less BP measurements based on PPG directly. The generated data of VAE are closest to the original data in both morphology and trend thorough observation. Experiment results also show that the improvement in BP measurement accuracy by VAE is the most significant. In detail, VAE can reduce the MAE of SBP and DBP by 18.80% and 19.84%, respectively. In addition, we verify that PE can significantly improve the accuracy of BP measurements on the basis of CNN–GRU. After PPG data augmentation, the MAE of SBP and DBP measurements of PE–CNN–GRU achieve 3.80 mmHg and 2.02 mmHg; thus, PE–CNN–GRU performs well compared with existing cuff-less BP measurement works.

Author Contributions

Conceptualization, H.M and J.Y.; methodology, H.M. and C.L.; software, H.M. and C.L.; validation, H.M., C.L. and H.Z.; formal analysis, H.M. and J.Y.; investigation, H.M.; resources, H.M. and W.W.; data curation, H.M.; writing—original draft preparation, H.M.; writing—review and editing, W.W., D.Z. and J.T.; visualization, H.M.; supervision, W.W., D.Z. and J.T.; project administration, W.W., D.Z. and J.T.; funding acquisition, J.T. All authors have read and agreed to the published version of the manuscript.

Funding

This research was funded by Future Star Funding of Aerospace Information Research Institute, Chinese Academy of Sciences grant number E2Z107010F.

Data Availability Statement

The data presented in this study are openly available in Reference [34].

Acknowledgments

This work was supported by the Youth Innovation Promotion Association CAS (grant number 2023137).

Conflicts of Interest

The authors declare no conflicts of interest.

References

  1. Mancia, G.; Sega, R.; Milesi, C.; Cessna, G.; Zanchetti, A.A. Blood-pressure control in the hypertensive population. Lancet 1997, 349, 454–457. [Google Scholar] [CrossRef] [PubMed]
  2. SPRINT Research Group. A randomized trial of intensive versus standard blood-pressure control. New Engl. J. Med. 2015, 373, 2103–2116. [Google Scholar] [CrossRef] [PubMed]
  3. Sebald, D.J.; Bahr, D.E.; Kahn, A.R. Narrowband auscultatory blood pressure measurement. IEEE Trans. Biomed. Eng. 2002, 49, 1038–1044. [Google Scholar] [CrossRef] [PubMed]
  4. Sapinski, A. Standard algorithm of blood-pressure measurement by the oscillometric method. Med. Biol. Eng. Comput. 1992, 30, 671. [Google Scholar] [CrossRef] [PubMed]
  5. Avolio, A.; Butlin, M.; Walsh, A. Arterial blood pressure measurement and pulse wave analysis—Their role in enhancing cardiovascular assessment. Physiol. Meas. 2010, 31, R1–R47. [Google Scholar] [CrossRef] [PubMed]
  6. El-Hajj, C.; Kyriacou, P.A. Cuffless blood pressure estimation from PPG signals and its derivatives using deep learning models. Biomed. Signal Process. Control 2021, 70, 102984. [Google Scholar] [CrossRef]
  7. Elgendi, M.; Fletcher, R.; Liang, Y.; Howard, N.; Lovell, N.H.; Abbott, D.; Lim, K.; Ward, R. The use of photoplethysmography for assessing hypertension. NPJ Digit. Med. 2019, 2, 60. [Google Scholar] [CrossRef] [PubMed]
  8. Zhang, Y.; Wang, Z. A hybrid model for blood pressure prediction from a PPG signal based on MIV and GA-BP neural network. In Proceedings of the 13th International Conference on Natural Computation, Fuzzy Systems and Knowledge Discovery (ICNC-FSKD), Guilin, China, 29–31 July 2017. [Google Scholar]
  9. El-Hajj, C.; Kyriacou, P.A. Cuffless and continuous blood pressure estimation from PPG signals using recurrent neural networks. In Proceedings of the 42nd Annual International Conference of the IEEE Engineering in Medicine & Biology Society (EMBC), Montreal, QC, Canada, 20–24 July 2020. [Google Scholar]
  10. Samimi, H.; Dajani, H.R. A PPG-based calibration-free cuffless blood pressure estimation method using cardiovascular dynamics. Sensors 2023, 23, 4145. [Google Scholar] [CrossRef] [PubMed]
  11. Paviglianiti, A.; Randazzo, V.; Villata, S.; Cirrincione, G.; Pasero, E. A comparison of deep learning techniques for arterial blood pressure prediction. Cogn. Comput. 2022, 14, 1689–1710. [Google Scholar] [CrossRef]
  12. Qin, K.; Huang, W.; Zhang, T. Deep generative model with domain adversarial training for predicting arterial blood pressure waveform from photoplethysmogram signal. Biomed. Signal Process. Control 2021, 70, 102972. [Google Scholar] [CrossRef]
  13. Ibtehaz, N.; Mahmud, S.; Chowdhury, M.E.H.; Khandakar, A.; Salman Khan, M.; Ayari, M.A.; Tahir, A.M.; Rahman, M.S. PPG2ABP: Translating photoplethysmogram (PPG) signals to arterial blood pressure (ABP) waveforms. Bioengineering 2022, 9, 692. [Google Scholar] [CrossRef]
  14. Mehrabadi, M.; Aqajari, S.; Zargari, A.; Dutt, N.; Rahmani, A. Novel blood pressure waveform reconstruction from photoplethysmography using cycle generative adversarial networks. In Proceedings of the 44th Annual International Conference of the IEEE Engineering in Medicine & Biology Society (EMBC), Glasgow, Scotland, 11–15 July 2022. [Google Scholar]
  15. Chu, Y.; Tang, K.; Hsu, Y.; Huang, T.; Wang, D.; Li, W.; Savitz, S.; Jiang, X.; Shams, S. Non-invasive arterial blood pressure measurement and SpO2 estimation using PPG signal: A deep learning framework. BMC Med. Inform. Decis. Mak. 2023, 3, 131. [Google Scholar] [CrossRef] [PubMed]
  16. Mou, H.; Yu, J. Transfer learning with DWT based clustering for blood pressure estimation of multiple patients. J. Comput. Sci. 2022, 64, 101865. [Google Scholar] [CrossRef]
  17. Mou, H.; Yu, J. CNN-LSTM Prediction Method for Blood Pressure Based on Pulse Wave. Electronics 2021, 10, 1664. [Google Scholar] [CrossRef]
  18. Moody, G.; Mark, R. A database to support development and evaluation of intelligent intensive care monitoring. In Computers in Cardiology; IEEE: Indianapolis, IN, USA, 1996. [Google Scholar]
  19. Saeed, M.; Villarroel, M.; Reisner, A.; Clifford, G.; Lehman, L.W.; Moody, G.; Mark, R.G. Multiparameter intelligent monitoring in intensive care II (MIMIC-II): A public-access intensive care unit database. Crit. Care Med. 2011, 39, 952. [Google Scholar] [CrossRef] [PubMed]
  20. Johnson, A.; Pollard, T.; Mark, R. MIMIC-III Clinical Database (Version 1.4). Available online: https://physionet.org/content/mimiciii/1.4/ (accessed on 28 November 2023).
  21. Moody, B.; Hao, S.; Gow, B.; Pollard, T.; Zong, W.; Mark, R. MIMIC-IV Waveform Database (Version 0.1.0). Available online: https://physionet.org/content/mimic4wdb/0.1.0/ (accessed on 28 November 2023).
  22. Shorten, C.; Khoshgoftaar, T. A survey on image data augmentation for deep learning. J. Big Data 2019, 6, 60. [Google Scholar] [CrossRef]
  23. Cui, X.; Goel, V.; Kingsbury, B. Data augmentation for deep neural network acoustic modeling. IEEE/ACM Trans. Audio Speech, Lang. Process. 2015, 23, 1469–1477. [Google Scholar]
  24. Wen, Q.; Sun, L.; Yang, F.; Song, X.; Gao, J.; Wang, X.; Xu, H. Time series data augmentation for deep learning: A survey. arXiv 2022, arXiv:2002.12478. [Google Scholar]
  25. Iwana, B.; Uchida, S. An empirical survey of data augmentation for time series classification with neural networks. PLoS ONE 2021, 16, e0254841. [Google Scholar] [CrossRef]
  26. Gao, J.; Song, X.; Wen, Q.; Wang, P.; Sun, L.; Xu, H. Robusttad: Robust time series anomaly detection via decomposition and convolutional neural networks. arXiv 2021, arXiv:2002.09545. [Google Scholar]
  27. Kiyasseh, D.; Tadesse, G.; Thwaites, L.; Zhu, T.; Clifton, D. PlethAugment: GAN-based PPG augmentation for medical diagnosis in low-resource settings. IEEE J. Biomed. Health Inform. 2020, 24, 3226–3235. [Google Scholar] [CrossRef] [PubMed]
  28. Ding, C.; Xiao, R.; Do, D.; Lee, D.; Lee, R.; Kalantarian, S.; Hu, X. Log-spectral matching gan: Ppg-based atrial fibrillation detection can be enhanced by gan-based data augmentation with integration of spectral loss. IEEE J. Biomed. Health Inform. 2023, 27, 1331–1341. [Google Scholar] [CrossRef]
  29. Mazumder, O.; Banerjee, R.; Roy, D.; Bhattacharya, S.; Ghose, A.; Sinha, A. Synthetic PPG signal generation to improve coronary artery disease classification: Study with physical model of cardiovascular system. IEEE J. Biomed. Health Inform. 2022, 26, 2136–2146. [Google Scholar] [CrossRef] [PubMed]
  30. Bandara, K.; Hewamalage, H.; Liu, Y.; Kang, Y.; Bergmeir, C. Improving the accuracy of global forecasting models using time series data augmentation. Pattern Recognit. 2021, 120, 108148. [Google Scholar] [CrossRef]
  31. Hu, H.; Tang, M.; Bai, C. Datsing: Data augmented time series forecasting with adversarial domain adaptation. In Proceedings of the 29th ACM International Conference on Information & Knowledge Management, Virtual Event, Ireland, 19–23 October 2020. [Google Scholar]
  32. Song, K.; Park, T.; Chang, J. Novel data augmentation employing multivariate gaussian distribution for neural network-based blood pressure estimation. Appl. Sci. 2021, 11, 3923. [Google Scholar] [CrossRef]
  33. Wu, B.; Chiu, L.; Wu, Y.; Lai, C.; Chu, P. Contactless blood pressure measurement via remote photoplethysmography with synthetic data generation using generative adversarial network. In Proceedings of the IEEE/CVF Conference on Computer Vision and Pattern Recognition, New Orleans, LA, USA, 19–20 June 2022. [Google Scholar]
  34. Kachuee, M.; Kiani, M.; Mohammadzade, H.; Shabany, M. Cuff-Less Blood Pressure Estimation Data Set. Available online: https://archive.ics.uci.edu/dataset/340/cuff+less+blood+pressure+estimation (accessed on 4 December 2023).
  35. Majeed, I.A.; Jos, S.; Arora, R.; Choi, K.; Bae, S. Motion Artifact Removal of Photoplethysmogram (PPG) Signal. In Proceedings of the 41st Annual International Conference of the IEEE Engineering in Medicine and Biology Society (EMBC), Berlin, Germany, 23–27 July 2019. [Google Scholar]
  36. He, W.; Ye, Y.; Lu, L.; Cheng, Y.; Li, Y.; Wang, Z. Robust heart rate monitoring for quasi-periodic motions by wrist-type PPG signals. IEEE J. Biomed. Health Inform. 2020, 24, 636–648. [Google Scholar] [CrossRef] [PubMed]
  37. Wang, W.; Mohseni, P.; Kilgore, K.; Najafizadeh, L. Cuff-less blood pressure estimation from photoplethysmography via visibility graph and transfer learning. IEEE J. Biomed. Health Inform. 2021, 26, 2075–2085. [Google Scholar] [CrossRef] [PubMed]
  38. Mariani, G.; Scheidegger, F.; Istrate, R.; Bekas, C.; Malossi, C. Bagan: Data augmentation with balancing gan. arXiv 2018, arXiv:1803.09655. [Google Scholar]
  39. Goodfellow, I.; Pouget-Abadie, J.; Mirza, M.; Xu, B.; Warde-Farley, D.; Ozair, S.; Courville, A.; Bengio, Y. Generative adversarial networks. arXiv 2014, arXiv:1406.2661. [Google Scholar] [CrossRef]
  40. Vaswani, A.; Shazeer, N.; Parmar, N.; Uszkoreit, J.; Jones, L.; Gomez, A.N.; Kaiser, L.; Polosukhin, I. Attention is all you need. In Proceedings of the 31st International Conference on Neural Information Processing Systems, Long Beach, CA, USA, 4–9 December 2017. [Google Scholar]
  41. Jin, R.; Wu, M.; Wu, K.; Gao, K.; Chen, Z.; Li, X. Position Encoding Based Convolutional Neural Networks for Machine Remaining Useful Life Prediction. IEEE/CAA J. Autom. Sin. 2022, 9, 1427–1439. [Google Scholar] [CrossRef]
  42. Simonyan, K.; Zisserman, A. Very deep convolutional networks for large-scale image recognition. arXiv 2014, arXiv:1409.1556. [Google Scholar]
  43. He, K.; Zhang, X.; Ren, S.; Sun, J. Deep residual learning for image recognition. In Proceedings of the IEEE Conference on Computer Vision and Pattern Recognition, Las Vegas, NV, USA, 27–30 June 2016. [Google Scholar]
  44. Chemla, D.; Millasseau, S. A systematic review of invasive, high-fidelity pressure studies documenting the amplification of blood pressure from the aorta to the brachial and radial arteries. J. Clin. Monit. Comput. 2021, 35, 1245–1252. [Google Scholar] [CrossRef] [PubMed]
Figure 1. PPG signal segments in different Q I P W .
Electronics 13 01599 g001
Figure 2. Examples of resampled PPG windows.
Electronics 13 01599 g002
Figure 3. Illustration of PPG data augmentation pipeline.
Electronics 13 01599 g003
Figure 4. Examples of synthetic PPG windows generated by different methods.
Electronics 13 01599 g004
Figure 5. Schematic diagram of GAN.
Electronics 13 01599 g005
Figure 6. Schematic diagram of VAE.
Electronics 13 01599 g006
Figure 7. The architecture of PE–CNN–GRU model.
Electronics 13 01599 g007
Figure 8. Histogram of BP distribution.
Electronics 13 01599 g008
Figure 9. Bland−Altman Plots of SBP and DBP.
Electronics 13 01599 g009
Table 1. Network architecture of GAN based on PPG data.
NetworkLayerDimensionActivation
GeneratorInput256-
FC1128LeakyReLU
BN1--
FC2128LeakyReLU
BN2--
FC3256-
DiscriminatorInput256-
FC1512LeakyReLU
BN1--
FC2256LeakyReLU
BN2--
FC31Sigmoid
Table 2. Network architecture of VAE based on PPG data.
NetworkLayerDimensionActivation
EncoderInput256-
FC1128ReLU
Latent SpaceFC164-
FC264-
Sampling64-
DecoderInput64-
FC1128ReLU
FC2256Sigmoid
Table 3. Impact of data augmentation methods on the performance of SBP measurement.
MethodMAERMSEME ± SD
Origin4.688.860.60 ± 8.84
Cropping4.299.000.51 ± 8.99
Flipping4.919.120.40 ± 9.11
DBA4.218.670.84 ± 8.63
GAN5.2110.121.41 ± 10.02
VAE3.808.360.48 ± 8.35
Table 4. Impact of data augmentation methods on the performance of DBP measurement.
MethodMAERMSEME ± SD
Origin2.524.330.12 ± 4.32
Cropping2.314.020.00 ± 4.02
Flipping2.684.340.48 ± 4.31
DBA2.284.130.15 ± 4.13
GAN2.734.650.10 ± 4.65
VAE2.023.880.15 ± 3.88
Table 5. Comparison between PE–CNN–GRU and existing works.
MethodSBPDBP
MAERMSEME ± SDMAERMSEME ± SD
ANN [10]7.41N/A−4.02 ± 10.403.32N/A−0.31 ± 4.89
ResNet + LSTM [11]4.8710.020.06 ± 10.022.484.70−0.08 ± 4.70
RDAE [12]8.8413.004.20 ± 12.314.766.58−0.14 ± 6.58
PPG2ABP [13]11.5715.508.77 ± 12.785.627.57−2.88 ± 7.00
Cycle GAN [14]2.895.180.67 ± 4.523.224.821.78 ± 4.67
Transformer [15]2.412.72−0.037 ± 2.721.311.770.029 ± 1.77
CNN-GRU [16]5.9511.19−0.05 ± 11.192.814.900.24 ± 4.90
PE–CNN–GRU3.808.360.48 ± 8.352.023.880.15 ± 3.88
Disclaimer/Publisher’s Note: The statements, opinions and data contained in all publications are solely those of the individual author(s) and contributor(s) and not of MDPI and/or the editor(s). MDPI and/or the editor(s) disclaim responsibility for any injury to people or property resulting from any ideas, methods, instructions or products referred to in the content.

