
Three-Dimensional Transient Electric Field Characteristics of High Pressure Electrode Boilers

1
College of School of Energy and Power Engineering, North China University of Water Resources and Electric Power, Zhengzhou 450018, China
2
College of Electrical Engineering, North China University of Water Resources and Electric Power, Zhengzhou 450018, China
*
Author to whom correspondence should be addressed.
Electronics 2024, 13(9), 1615; https://doi.org/10.3390/electronics13091615
Submission received: 27 February 2024
/
Revised: 16 April 2024
/
Accepted: 22 April 2024
/
Published: 23 April 2024
Abstract
:An uneven electric field during the operation of an electrode boiler will lead to the emergence of a high field strength area and low field strength area in the furnace, which will endanger the safe and reliable operation and heating efficiency of the electrode boiler. A numerical study of three-dimensional transient electric field distribution characteristics in a 10 kV high-voltage electrode boiler was carried out. The distribution characteristics of the global electric field of the electrode boiler under the nominal voltage of 10 kV were studied, and the distribution law of the electric field of the electrode boiler under poor power quality, such as different bus voltage and three-phase voltage imbalance, was explored. The results show that the electric field distribution characteristics of the three-phase transient are more obvious in the section closer to the electrode disc, and the electric field distribution is the most uniform in the section that is 1.4 m away from the furnace water. In the case of poor power quality, such as different bus voltage and three-phase voltage imbalance, the points of the maximum electric field intensity of the four surfaces change periodically with time, and the greater the bus voltage fluctuation, the more severe the impact on the transient electric field. The three-phase voltage imbalance will shift the peak value of the electric field intensity. The decrease or offset of electric field intensity in the electrode boiler caused by poor power quality will directly affect its heating efficiency. The electric field simulation results have a specific reference value for improving the internal electric field distribution and on-site operation and maintenance of the electrode boiler.
1. Introduction
China’s carbon peak and neutrality goals have been gradually implemented, and the development of clean energy equipment has been highly valued. As a type of large capacity electrothermal energy conversion equipment, the high-voltage electrode boiler has many advantages, such as small volume, short start-up time, high thermal efficiency, no noise, no pollution, good operation performance under low load, etc., which has attracted wide attention in recent years [1]. The electrode boiler is mainly used for urban heating and heating in civil fields. In the industrial field, the electrode boiler is widely used in the start-up boiler of thermal or nuclear power enterprises and the peak-shaving boiler of wind power and solar energy enterprises [2].
In response to the rapid development of electrode boiler research, many scholars at home and abroad have discussed the application of electrode boilers in flexibility transformation, application scenarios, and new energy consumption of thermal power units. Manni M et al. [3] conducted a theoretical evaluation of the performance index of electrothermal coupling of an electrode boiler, and the results showed that the structure of the electrode boiler was the most effective, with an efficiency of 97%. Tao et al. [4] proposed a control method based on a fuzzy control strategy for electrode boiler systems to participate in fast grid frequency response. This method improves the traditional electrode boiler control strategy and enhances the grid frequency regulation ability and system stability. Gicevskis K et al. [5] studied and evaluated the feasibility of electrode boilers in grid auxiliary services and regional heating through factors such as energy demand, technical feasibility, economy, and regulatory market. Nielsen R et al. [6] studied the component model of industrial electrode boilers and their dynamic characteristics in district heating and grid auxiliary services. Carneiro J et al. [7] studied the submerged electrode boiler of an alumina plant. The study found that electrode boilers can reduce greenhouse gas emissions and improve operational reliability. RamonasČ et al. [8] studied a space heating system consisting of a small wind turbine and a boiler and verified that the system is feasible. Yang et al. [9] established a multi-objective optimization model of wind farm capacity based on wind power generation and heat supply by electron beam transmission system. They proposed maximizing wind power generation capacity, minimizing system adjustment times, and minimizing operating costs combined with electrode boilers’ heat storage and energy storage to reduce operating costs. Jin et al. [10] studied the improvement of operation flexibility of heating units by electrode boilers. Hutabarat R et al. [11] described the mechanism of ion friction in water and the conversion of electric energy into internal energy under the action of a microscopic AC electric field in an electrode boiler. They conducted several experiments to prove this. Domestic scholars such as Zhang P et al. [12] jointly use flexible energy facilities such as high-voltage electrode boilers with coal power units to improve the flexibility of coal power platforms and meet the high requirements for system frequency modulation service in the power grid. An optimal economic dispatch method is provided. Wu B, Yuan X, et al. [13,14,15,16] studied the electrode boiler’s basic working principle and control method and carried out mathematical modeling. Kang et al. [17] conducted an in-depth study on the value, role, and challenges of a high-performance distributed electric heating energy system with a high-voltage electrode-type electric boiler as the core in developing a future with a high proportion of renewable energy power systems. Zheng et al. [18] studied the selection of electrode materials for high-pressure electrode boilers and the electrode corrosion characteristics under different influencing factors. Sano et al. [19] used thermochromic tissue mimics to quickly evaluate the thermal effect of pulsed electric field therapy. They found that active cooling of applicators can significantly reduce the quantity of tissue exposed to deleterious temperatures. Buttgenbach S et al. [20] discuss the development and application of acceleration sensors for surface micromachining. Lim et al. [21] discussed the influence of microchannel diameter on the hysteresis phenomenon of electroosmotic flow by studying the current monitoring experiment and finite element numerical simulation.
The above research was studied mainly from the electrode boiler application scenarios, material properties, and control methods. According to the basic principle of the electrode boiler, there is a potential difference between the electrodes in the electric field of the furnace water, which promotes the flow of electrons between the electrodes and forms a current. When the current passes through water, the movement and friction of water molecules will generate heat to raise the temperature of the water. The electric field distribution in the furnace water affects the current in the furnace water, affecting the electrode boiler’s heat production power. Only Jiang S [22] studied the electric field distribution of the electrode boiler electrode when it was versus was not corroded by the furnace water. As clean energy equipment for distributed power substitution, the electrode boiler has a complex and changeable power quality environment. Therefore, studying the influence law of three-dimensional transient electric field distribution of electrode boilers under poor power quality is very important. Based on establishing a three-position transient simulation model of an electrode boiler, this paper analyzes the influence of different bus voltages and three-phase voltage imbalance on the electric field distribution of an electrode boiler under 10 kV standard pressure. It provides a theoretical basis for improving and maintaining more efficient electrode boilers.
2. Calculation Method and Model
2.1. Three-Dimensional Electric Field Calculation Method
In the electrode boiler’s three-dimensional electric field solution method, the scalar potential is used as the quantity to be solved, and the correct boundary conditions are used as the definite solution conditions. The equation satisfied by the three-dimensional electric field is (1)
where is the three-dimensional scalar potential, is the relative dielectric constant on the three-direction vectors, is the vacuum dielectric constant, and is the bulk charge density.
In the three-dimensional electric field module of the finite element, the three-dimensional scalar potential is solved. When the scalar potential value is solved, the electric field intensity and the electric displacement vector can be directly obtained from the Maxwell differential equations. These two fundamental field quantities can be calculated by Formula (2).
Since the model uses adaptive tetrahedral mesh generation, volume coordinates are introduced, as shown in Figure 1.
Figure 2 shows the electric field simulation solution process when the finite element method is used to solve the electric field distribution of the electrode boiler.
2.2. Physical Models and Assumptions
The three-dimensional modelling software SpaceClaim2020 is used to model the four parts: the high-voltage electrode, electrode plate, electrode rod, and furnace water, as shown in Figure 3. The parameters of the electrode boiler are mainly obtained from Reference [22], and the geometric parameters of the electrode boiler are shown in Table 1.
In electrode boiler design, the finite element method is used for modeling and simulation, and the electric field distribution of the boiler can be calculated quickly, which provides essential data support for boiler design. However, the internal structure of the electrode boiler is complex, involving the interaction of various components and media, such as water, steam, and electrodes, resulting in complex heating and heat dissipation processes. Some detailed structures in the electrode system components have little effect on the electric field distribution. Although the detailed structure has little impact on the overall electric field distribution of the boiler, it will significantly increase the number of grids in the simulation calculation, thus affecting the efficiency of the simulation. Therefore, to carry out efficient numerical simulation, ensuring that the simplification process will not substantially impact the boiler’s electric field characteristics, the model is simplified as necessary to reduce the demand for computing resources and improve the efficiency of simulation.
- (1)
- Ignoring the small gap, unevenness, and other small structures inside the electrode boiler, the surface of each component is regarded as smooth, which is convenient for calculation and processing;
- (2)
- Ignoring the influence of temperature rise on the material properties during the operation of the electrode boiler and assuming that the material properties do not change with the direction, that is, isotropic;
- (3)
- Ignoring the difference in fluid flow caused by gravity at different heights of the boiler, especially in the high temperature and high-pressure environment, the influence of gravity can be ignored;
- (4)
- It is assumed that the boiler’s inner coating is uniform, the heat conduction conditions of the wall are consistent, and good insulation performance is maintained;
- (5)
- The simplified model only models the high-voltage electrode, electrode plate, electrode rod, and furnace water in the electrode system.
2.3. Mesh Model and Independence Verification
The adaptive mesh model of the electrode boiler is divided based on the finite element simulation software. In the meshing process, the essential parts—the contact part between the high-voltage electrode and the electrode plate and the contact part between the electrode rod and the furnace water—are encrypted by local mesh, and the approximate surface mesh is set to 7 levels. The whole model is divided by a free intelligent mesh tetrahedron to ensure the accuracy of the calculation results. The grid subdivision diagram is shown in Figure 4. Because the simulation results are affected by the quantity and quality of the model grid, the grid independence verification based on the average electric field strength and the maximum electric field strength in the electrode boiler furnace is carried out before the numerical calculation, as shown in Figure 5. Finally, the number of 1.2 million grids was selected for calculation.
2.4. Boundary Conditions and Excitation Settings
The corresponding boundary conditions are applied according to different working conditions. In the axisymmetric model, considering the dielectric constant and resistivity of the insulating material, the three-dimensional transient electric field model can be expressed as Formula (3) [23]:
In Formula (3): is the dielectric constant of the material; is the conductivity of the material; is potential; is the radius; is the angle. In the calculation field Ω, the first boundary condition (Dirichlet) is expressed by ; The second boundary condition (Neumann) is expressed by , and the initial calculation time is expressed by , while the second boundary condition in finite element numerical analysis can be automatically satisfied.
As shown in Figure 6, the frequency of the three-phase alternating current in the excitation setting is 50 Hz, and the period is 0.02 s. The A-phase voltage is set to 10,000/sqrt(3) × sqrt(2) × cos(2 × pi × 50 × time), the B-phase is ahead of the A-phase by 120°, the voltage is 10,000/sqrt(3) × sqrt(2) × cos(2 × pi × 50 × time + (2/3) × pi), the C-phase lags the A-phase by 120°, and the voltage is 10,000/sqrt(3) × sqrt(2) × cos(2 × pi × 50 × time + (4/3) × pi). In order to complete the establishment of the three-dimensional electric field simulation model, the material parameters of the electrode boiler are set in Table 2 [22].
The simulation termination time is set to 0.02 s. The initial time is 0.001 s, the maximum calculation interval is 0.001 s, and the initial voltage value is 0 V.
3. Results and Analysis
3.1. Analysis of Electric Field Distribution Characteristics under Nominal Voltage
Figure 7 shows the furnace’s electric field distribution of four different sections at 0.02 s. The depth from the upper surface of the furnace water is 0.2 m, 0.8 m, 1.4 m, and 2.0 m, respectively, and the spacing is 0.6 m. Under the action of 50 Hz three-phase AC voltage, the instantaneous voltage of phase A of the high-voltage electrode is 8.1650 kV at 0.02 s, and the instantaneous voltage of phases B and C is −4.0825 kV. Figure 4 shows that the three-phase transient electric field distribution characteristics are more evident in the section closer to the electrode plate, and the electric field distribution is the most uniform in the section of 1.4 m.
The average electric field strength can be obtained by using the powerful post-processing calculator. The expression of the average electric field strength is as follows (4):
where is the charge density on the plane and the dielectric constant of furnace water.
Figure 8 shows the variation pattern of the maximum electric field intensity and the average electric field intensity of the four sections at the distance from the upper surface. It showed a trend of first slowly rising, then rapidly declining, and then slowly declining.
The average electric field intensity value of the 0.2 m deep horizontal section is 4491.007 V/m, the average electric field intensity of the 0.8 m deep horizontal section is 4834.695 V/m, the average electric field intensity of the 1.4 m deep horizontal section is 1762.704 V/m, and the average electric field intensity of the 2.0 m deep horizontal section is 965.1823 V/m.
The maximum electric field strength of the 0.2 m deep horizontal section is 13,325.5427 V/m, the maximum electric field strength of the 0.8 m deep horizontal section is 14,761.4257 V/m, the maximum electric field strength of the 1.4 m deep horizontal section is 3178.7491 V/m. The maximum electric field strength of the 2.0 m deep horizontal section is 1595.505 V/m.
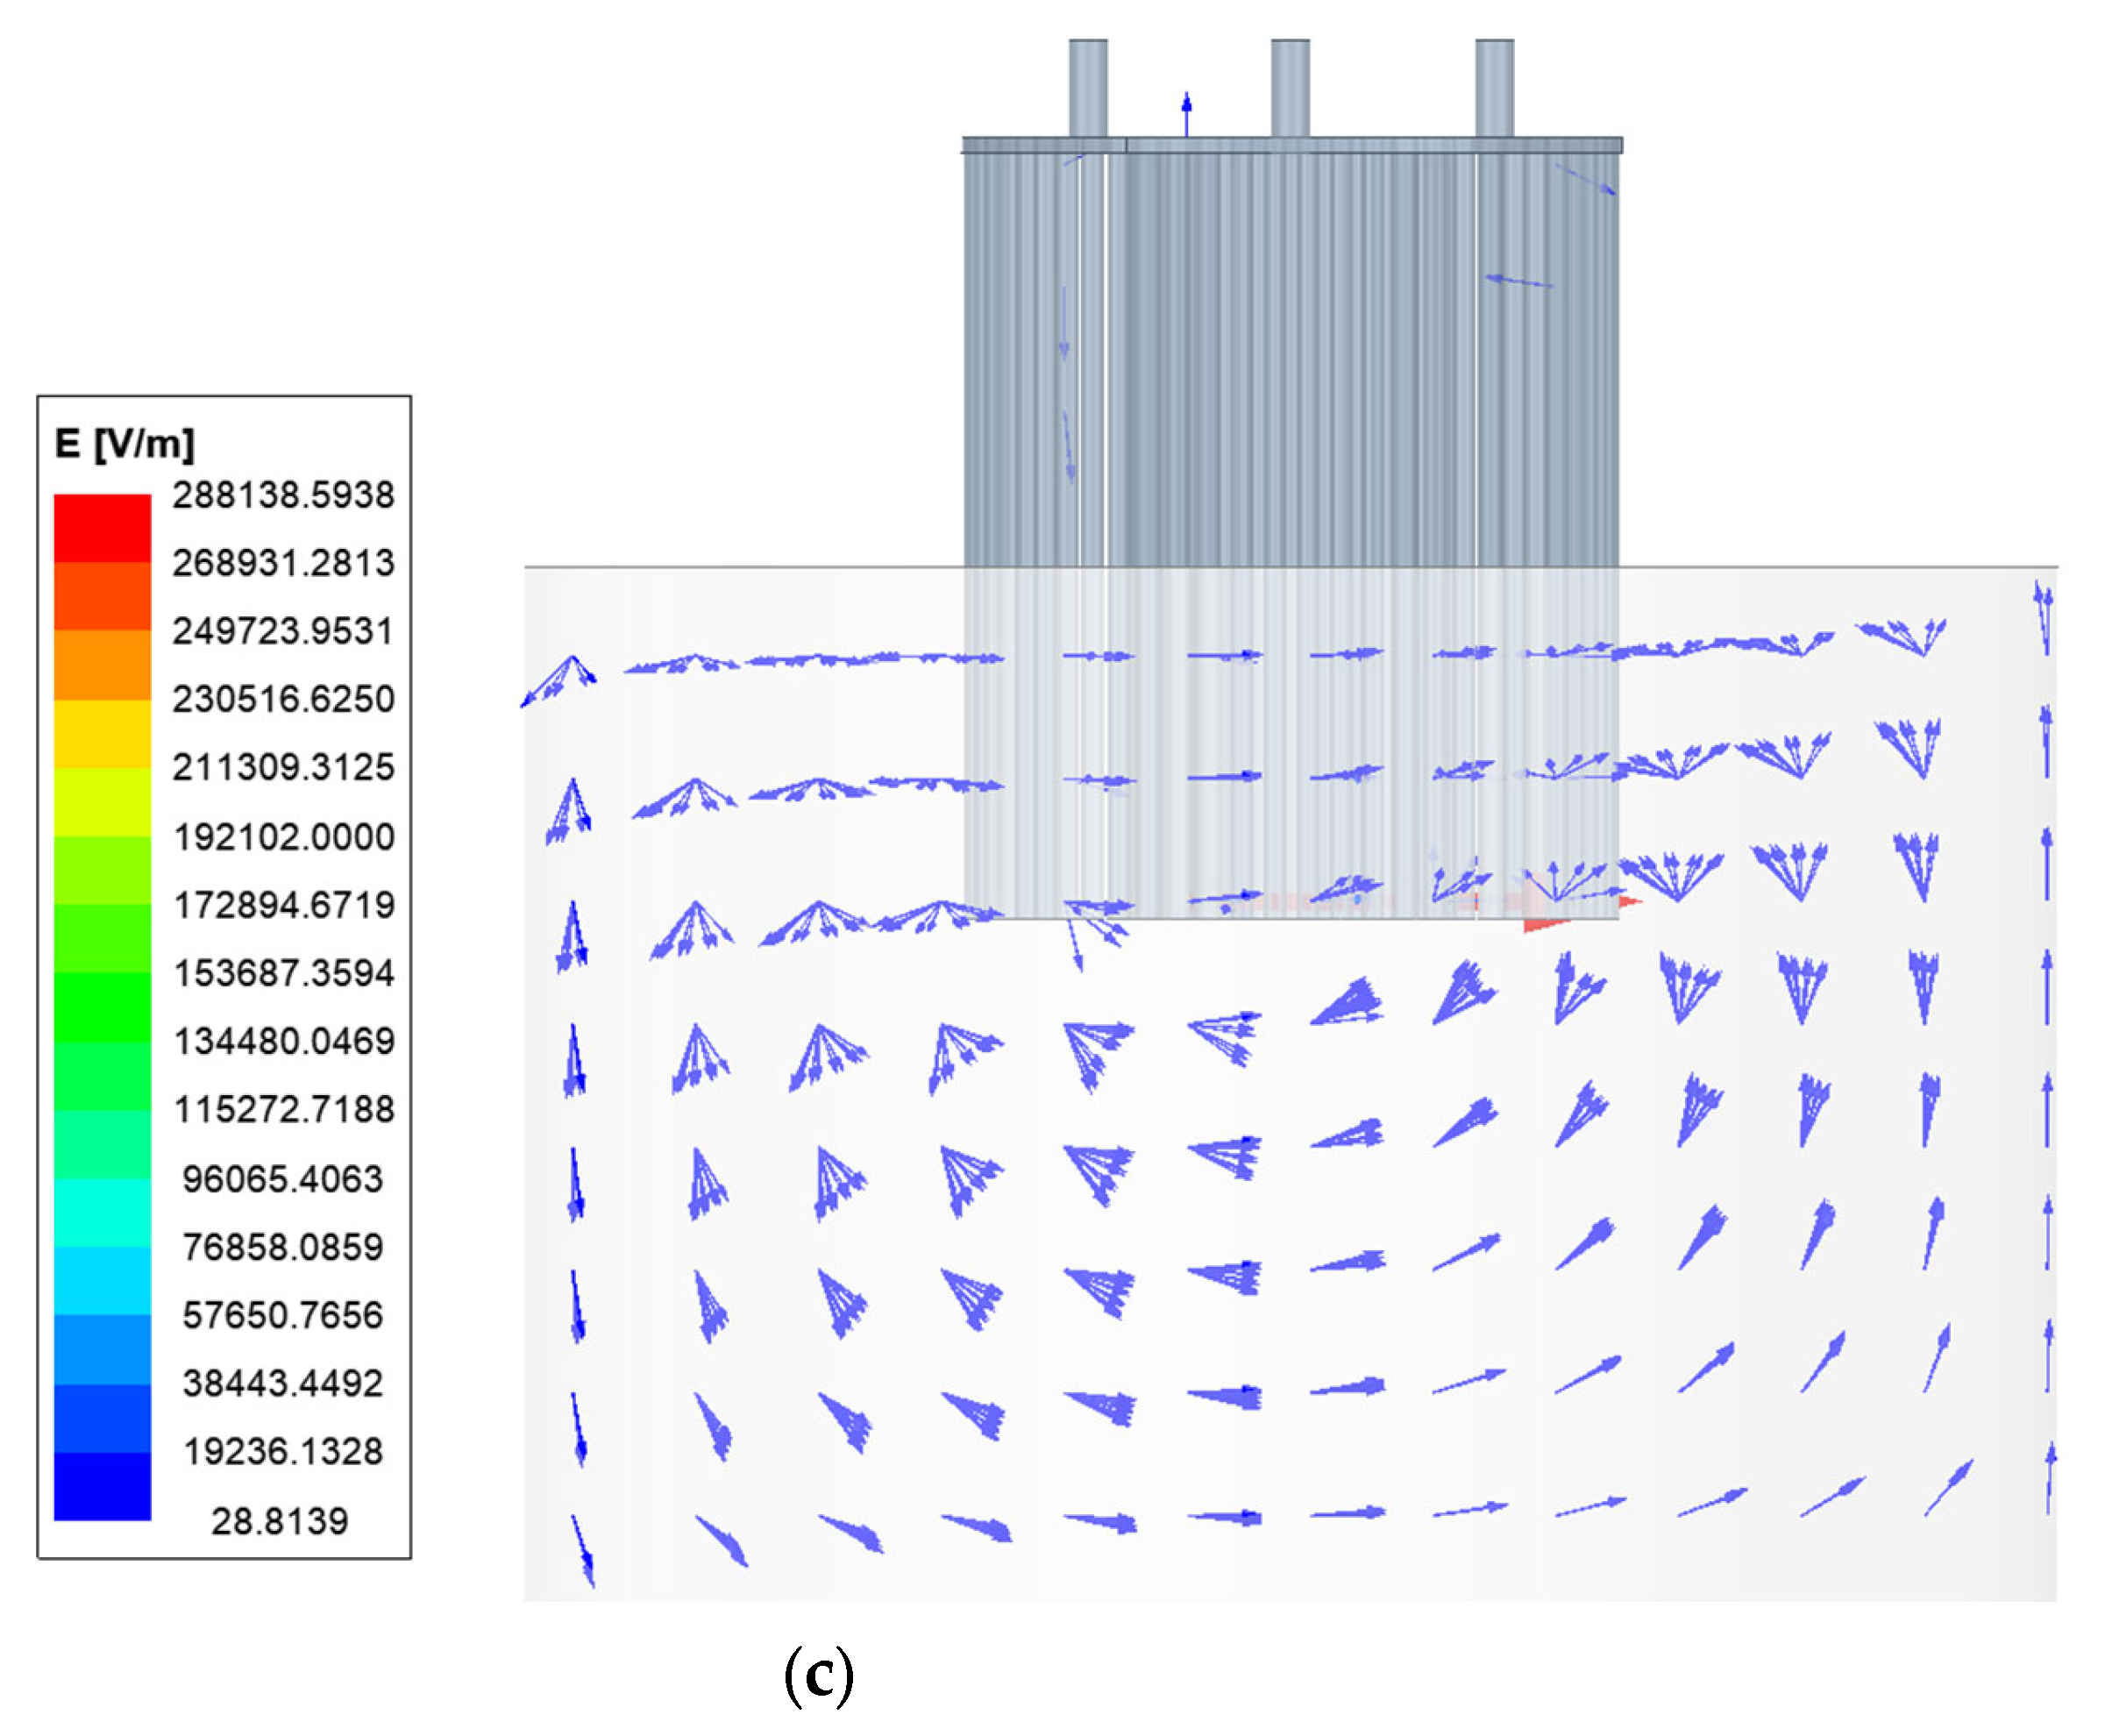
Figure 9 shows the vector diagram of the electric field distribution inside the furnace. Under the action of a three-phase alternating current electric field, charged particles in the solution of trisodium phosphate in the furnace water will rotate horizontally, as shown in Figure 9b, and vertically, as shown in Figure 9c. Figure 9a shows that charged particles will spiral up and down when the furnace water is heated.
3.2. The Influence of Three-Phase Voltage Imbalance on Transient Electric Field
Due to the uneven distribution of electric fields during the operation of high-voltage electrode boilers, major safety accidents can occur, endangering the safe operation of electrical equipment. In order to avoid voltage breakdown due to uneven local electric field, hydrogen is generated by water electrolysis. Therefore, the influence of different bus voltage and three-phase voltage imbalance on the electric field distribution of electrode boilers with poor power quality is analyzed.
3.2.1. The Influence of Different Voltages on the Transient Electric Field
Figure 10 shows the depth of the upper surface of the furnace water at 0.2 m, 0.8 m, 1.4 m, and 2.0 m. Under the three-phase electrode input voltage of 80%, 90%, 100%, 110%, and 120% of the system’s nominal voltage, the maximum electric field intensity changes with time [23].
It can be seen from Figure 10 that the points of the maximum electric field intensity of the four surfaces (a), (b), (c), and (d) change periodically with time. The maximum electric field intensity increases with the increase of voltage, and the waveform size of the maximum electric field intensity also shows an increasing trend. The maximum electric field strength in the cross-section positively correlates with the voltage increase. The larger the voltage, the greater the maximum electric field strength. The maximum waveform is 120% nominal voltage, and the minimum is 80% nominal. As the depth of the cross-section increases, the variation between the peak and the trough of the maximum electric field intensity decreases from large to small. The change in the depth of 0.2 m is the largest, and the change in the depth of 2.0 m is the smallest due to decreased field strength under the instantaneous three-phase voltage with the depth increase.
For further research, the electric field intensity distribution in the four sections varies with the voltage size and depth. Figure 11 shows the average electric field intensity change under different cross-section distances and amplitude deviations. It can be seen from the diagram that the average electric field intensity of different cross-section distance depths increases with the increase of voltage. The average electric field intensity is linearly related to the voltage, and the overall trend is upward. The average electric field strength of the cross-section with a depth of 0.8 m is the largest, which is due to the ‘special point’ of the cross-section position close to the working range of the electrode, that is, the position where the interaction between the electrode and the furnace water is the strongest. Its depth is located near the center of the electrode, and the current density is the largest, so the electric field Intensity Is also the largest.
3.2.2. The Impact of Different Voltage Phase Deviations on Transient Electric Fields
The phase angle deviation considers changing the phase angle of the A-phase voltage. When the voltage is balanced, the A-phase is 0°, and the B-phase and C-phase are +120° and −120°. When the phase deviation occurs, the phase angle of the A-phase is set to be 0°, −2°, 0°, 2°, and 4° ahead of the A-phase voltage for transient electric field simulation. Figure 12 shows the variation curve of the maximum field strength value of the four sections with depths of 0.2 m, 0.8 m, 1.4 m, and 2.0 m from the upper surface of the furnace water under different phase deviations with time.
It can be seen from Figure 12 that the points of the maximum electric field strength of the four surfaces (a), (b), (c), and (d) change periodically with time, and the curve of the maximum electric field strength value in the period shifts with the increase of the initial phase of the A-phase voltage. The shift moves backward with time as the phase angle increases. Specifically, the maximum electric field intensity in (a) increases with the increase of phase angle deviation, and the amplitude waveform of the maximum electric field intensity decreases. The maximum waveform is at the phase angle deviation of −4°, and its peak value is 13,593.3251 V/m. The minimum wave type has a peak value of 12,963.8585 V/m at a phase angle deviation of +4°. Similarly, the maximum electric field intensity in (b), (c), and (d) also decreases with the increase of phase angle deviation. The peak value of phase angle deviation at −4° is 14,977.2325 V/m, 3249.73622 V/m, 1630.2623 V/m, respectively. The +4° phase angle deviation peak is 14,513.267 V/m, 3105.67848 V/m, 1546.89683 V/m, respectively.
It can be seen from Figure 13 that with the increase of the phase angle deviation, the field strength value of the average electric field strength changes little within a particular phase deviation range. However, on the whole, the larger the phase angle deviation is, the smaller the average electric field strength is. It is found that the positive and negative deviation angle do not affect the average electric field strength. The optimal average electric field intensity value is obtained under the nominal voltage and the phase angle deviation 0°.
3.2.3. The Influence of Different Voltage Amplitude Deviation on Transient Electric Field
In the process of transient electric field simulation, the nominal voltage of the system applied to the phase B and C bus remains unchanged, and the amplitude of phase A voltage increases by 1%, 3%, 5%, and 7% based on the nominal voltage. Figure 14 shows the variation curves of the maximum electric field intensity of the four horizontal sections with time.
It can be seen from Figure 14 that the points of the maximum electric field intensity of the four surfaces (a), (b), (c), and (d) change periodically with time. The maximum electric field intensity increases with the increase of the amplitude deviation, and the amplitude waveform of the maximum electric field intensity also shows an increasing trend. The maximum electric field intensity in the cross-section positively correlates with the amplitude deviation. The larger the deviation is, the greater the maximum electric field intensity is. The maximum waveform has an amplitude deviation of 7%, and the minimum waveform has an amplitude deviation of 0%.
Figure 15 shows the average electric field intensity change under different cross-section distances and amplitude deviations. It can be seen from the figure that the average electric field strength at different cross-section distances increases with the increase of the A-phase voltage amplitude. The average electric field strength is linearly related to the magnitude of the voltage amplitude deviation, and the overall trend is upward. The average electric field intensity of the section with a depth of 0.8 m is the largest.
4. Conclusions
- (1)
- The closer the cross-section is to the electrode disk, the more pronounced the uneven distribution of the three-phase transient electric field. The electric field distribution is most uniform at a cross-section of 1.4 m.
- (2)
- The charged particles in the TNP solution in the furnace water of an electrode boiler rotate horizontally and vertically under the action of a three-phase AC electric field. When the furnace water is heated, the charged particles spiral up and down.
- (3)
- When different voltages are applied to the electrode system of an electrode boiler, the points of maximum electric field strength on the four surfaces change periodically over time. The magnitude of the maximum electric field strength in the cross-section is positively correlated with the increase in voltage. The larger the voltage, the higher the maximum electric field strength. The maximum waveform is at 120% of the nominal voltage, and the minimum waveform is at 80% of the nominal voltage.
- (4)
- The maximum electric field intensity value of the cross-section shifts with the increase of the initial phase of phase A voltage during the cycle, and the shift becomes more severe with the increase of phase angle. The optimal average electric field strength value is obtained at nominal voltage and phase angle deviation of 0°.
- (5)
- The maximum electric field intensity in the cross-section positively correlates with the amplitude deviation. The maximum waveform has an amplitude deviation of 7%, and the minimum waveform has an amplitude deviation of 0%. The average electric field strength is linearly positively correlated with the deviation of voltage amplitude.
Considering the actual operation of the electrode boiler, the bus voltage may have power quality problems such as voltage deviation, overvoltage, and three-phase imbalance. The operation and maintenance personnel should pay attention to the above electric field distribution and maintain it regularly to ensure safe operation of the electrode boiler. It is recommended that a power quality online monitoring system be installed and applied. The operation status of the electrode boiler must be mastered, and the hidden dangers of the equipment must be discovered promptly to take preventive measures.
Author Contributions
Conceptualization, Resources, Supervision, Writing–original draft X.H.; Data curation, Investigation, Visualization, Writing—original draft, Software, Y.R.; Project administration, Writing—review & Editing, W.W. All authors have read and agreed to the published version of the manuscript.
Funding
This paper is supported by the Project of Central Plains Science and Technology Innovation Leading Talents of Henan Province (No. 224200510022).
Data Availability Statement
Data are contained within the article’s charts and tables.
Conflicts of Interest
The authors have no relevant financial or non-financial interests to disclose. The authors have no competing interests to declare that are relevant to the content of this article. All authors certify that they have no affiliations with or involvement in any organization or entity with any financial interest or non-financial interest in the subject matter or materials discussed in this manuscript. The authors have no financial or proprietary interests in any material discussed in this article.
References
- Xu, F.; Min, Y.; Chen, L.; Chen, Q.; Hu, W.; Zhang, W.L.; Wang, X.H.; Hou, Y.H. Combined electricity-heat operation system containing large capacity thermal energy storage. Proc. CSEE 2014, 34, 5063–5072. [Google Scholar]
- Wang, H.; Dong, H.; Du, Q.; Wei, G. Current situation and prospect of electrode boiler in China. Therm. Energy Power Eng. 2023, 38, 1–12. [Google Scholar]
- Manni, M.; Nicolini, A.; Cotana, F. Performance assessment of an electrode boiler for power-to-heat conversion in sustainable energy districts. Energy Build. 2022, 277, 112569. [Google Scholar] [CrossRef]
- Shi, T.; Chen, Z.; Guo, S.; Li, D. Fast-Frequency-Response Control Method for Electrode Boilers Supporting New Energy Accommodation. Processes 2023, 11, 3098. [Google Scholar] [CrossRef]
- Gicevskis, K.; Linkevics, O. The Role of Decentralized Electrode Boiler in Ancillary Services and District Heating: A Feasibility Assessment. Latv. J. Phys. Tech. Sci. 2023, 60, 32–42. [Google Scholar] [CrossRef]
- Nielsen, R.J.; Pedersen, T.E. Electrode boiler model for ancillary service simulation. In Proceedings of the 15th International Modelica Conference 2023, Aachen, Germany, 9–11 October 2023; pp. 589–598. [Google Scholar]
- Carneiro, J. Reduction of GHG Emissions and Increase Operational Reliability Using Immersed Electrode Boiler in an Alumina Refinery. Light Met. 2023, 2023, 191. [Google Scholar]
- Ramonas, Č.; Kepalas, V.; Adomavičius, V. Research of the grid-tied power system consisting of wind turbine and boiler GALAN. Elektron. Ir Elektrotechnika 2010, 10, 27–32. [Google Scholar]
- Yang, X.; Ye, T.; Zhang, Y. A novel optimization model for combined wind power accommodation and electric boiler with thermal storage. Int. J. Energy Res. 2019, 43, 6494–6509. [Google Scholar] [CrossRef]
- Yuan, X.; Ma, J.; Zhang, Q.; Mo, R. Study on improving operation flexibility of heating unit by using electrode boiler. Electr. Power Sci. Eng. 2018, 34, 42. [Google Scholar]
- Hutabarat, R.; Nugroho, G. High voltage electrode boiler implementation using hydropower in a process steam production scenario. AIP Conf. Proc. 2019, 2088, 030008. [Google Scholar]
- Zhang, P.; Wang, S.; He, Z.; Zhang, R.; Zhou, T.; Ye, H.; Zhang, N. Optimal economic dispatch method of High pressure electrode boiler combined with coal power Unit participating in frequency modulation Service. Sci. Technol. Eng. 2012, 22, 10109–10115. [Google Scholar]
- Wu, B.; Wu, H. Reverse power control method of steam water parameters for nuclear power electrode Immersion Boiler. Electr. Power China 2017, 50, 107–112+123. [Google Scholar]
- Yuan, X. Research on Mechanism Modeling and Dynamic Characteristics of Electrode Immersion Boiler System. Master’s Thesis, North China Electric Power University, Beijing, China, 2019. [Google Scholar]
- Yuan, X.; Ma, J.; Qiang, S. Research on decoupling of Power and Steam Temperature Control System of Electrode Boiler. Comput. Simul. 2019, 36, 136–141. [Google Scholar]
- Ma, J.; Qiang, S.; Yuan, X. Research on Mathematical Modeling of Electrode Boiler Based on Dynamic Neural Network. Comput. Simul. 2019, 36, 126–130. [Google Scholar]
- Kang, C.; Chen, H.; Zhao, Y.; Han, B.; Feng, G.; Yang, J.; Huibert, T.V.; Jiang, J.N. High performance distributed electric heating energy system based on High voltage electrode electric boiler. China South. Power Grid Technol. 2017, 11, 35–44. [Google Scholar]
- Zheng, Z. Study on Corrosion Characteristics of Boiler High Pressure Electrode. Master’s Thesis, Xinjiang University, Urumqi, China, 2021. [Google Scholar]
- Sano, M.B.; DeWitt, M.R. Thermochromic tissue phantoms for evaluating temperature distribution in simulated clinical applications of pulsed electric field therapies. Bioelectricity 2020, 2, 362–371. [Google Scholar] [CrossRef] [PubMed]
- Büttgenbach, S.; Constantinou, I.; Dietzel, A.; Leester-Schädel, M.; Büttgenbach, S.; Constantinou, I.; Dietzel, A.; Leester-Schädel, M. Surface Micromachined Acceleration Sensors. In Case Studies in Micromechatronics: From Systems to Processes; Springer: Berlin/Heidelberg, Germany, 2020; pp. 87–144. [Google Scholar]
- Lim, A.E.; Goh, S. Effect of microchannel diameter on electroosmotic flow hysteresis. Energies 2023, 16, 2154. [Google Scholar] [CrossRef]
- Jiang, S.; Zhou, Y. Research on electric field Distribution Characteristics of Immersed electrode Boiler. Comput. Simul. 2022, 39, 248–252. [Google Scholar]
- Lin, X.; Nie, Y.; Zhu, T.; Li, Z.; Fang, W. Research on 3D Transient Electric Field Calculation of High Voltage Switchgear. High Volt. Appar. 2020, 56, 56–62. [Google Scholar]
Figure 1.
Tetrahedral element in three-dimensional coordinate system.

Figure 2.
Electric field simulation solution flow chart.

Figure 3.
Simplified physical model of the electrode boiler.

Figure 4.
Grid subdivision of the electrode boiler. (a) The main view; (b) Top view.

Figure 5.
Grid independence verification.

Figure 6.
Three-phase voltage waveform.

Figure 7.
Electric field distribution of horizontal cross-section in the furnace at t = 0.02 s. (a) Depth of 0.2 m; (b) Depth of 0.8 m; (c) Depth of 1.4 m; (d) Depth of 2.0 m.
Figure 7.
Electric field distribution of horizontal cross-section in the furnace at t = 0.02 s. (a) Depth of 0.2 m; (b) Depth of 0.8 m; (c) Depth of 1.4 m; (d) Depth of 2.0 m.


Figure 8.
Variation of average electric field intensity and maximum electric field intensity under different cross-section distances.
Figure 8.
Variation of average electric field intensity and maximum electric field intensity under different cross-section distances.

Figure 9.
Vector diagram of electric field distribution in the furnace. (a) Overall; (b) Level; (c) Vertical.
Figure 9.
Vector diagram of electric field distribution in the furnace. (a) Overall; (b) Level; (c) Vertical.


Figure 10.
Field strength versus time curves at different voltages. (a) Depth of 0.2 m; (b) Depth of 0.8 m; (c) Depth of 1.4 m; (d) Depth of 2.0 m.
Figure 10.
Field strength versus time curves at different voltages. (a) Depth of 0.2 m; (b) Depth of 0.8 m; (c) Depth of 1.4 m; (d) Depth of 2.0 m.


Figure 11.
Variation of average electric field intensity under different cross-section distances and voltage sizes.
Figure 11.
Variation of average electric field intensity under different cross-section distances and voltage sizes.

Figure 12.
Field strength versus time curves for different phase angle deviations. (a) Depth of 0.2 m; (b) Depth of 0.8 m; (c) Depth of 1.4 m; (d) Depth of 2.0 m.
Figure 12.
Field strength versus time curves for different phase angle deviations. (a) Depth of 0.2 m; (b) Depth of 0.8 m; (c) Depth of 1.4 m; (d) Depth of 2.0 m.

Figure 13.
Variation law of average electric field intensity under different cross-section distance and phase angle deviation.
Figure 13.
Variation law of average electric field intensity under different cross-section distance and phase angle deviation.

Figure 14.
Field strength versus time curves for different amplitude deviations. (a) Depth of 0.2 m; (b) Depth of 0.8 m; (c) Depth of 1.4 m; (d) Depth of 2.0 m.
Figure 14.
Field strength versus time curves for different amplitude deviations. (a) Depth of 0.2 m; (b) Depth of 0.8 m; (c) Depth of 1.4 m; (d) Depth of 2.0 m.

Figure 15.
Variation law of average electric field intensity under different cross-section distance and amplitude deviation.
Figure 15.
Variation law of average electric field intensity under different cross-section distance and amplitude deviation.


Table 1.
Geometric parameters of the electrode boiler.
| Geometric Parameter | Numerical Value | Geometric Parameter | Numerical Value |
|---|---|---|---|
| High voltage electrode radius/m | 0.04 | High voltage electrode length/m | 0.69 |
| Electrode rod radius/m | 0.025 | Electrode rod length/m | 1.6 |
| Furnace water radius/m | 1.6 | Furnace water height/m | 2.2 |
| Inner radius of the electrode disk/m | 0.29 | The outer radius of the electrode disk/m | 0.69 |
| Electrode disc thickness/m | 0.035 |
Table 2.
Material parameters of electrode boiler.
| Geometrical Parameter | Relative Dielectric Constant | Electrical Conductivity (s/m) | Materials |
|---|---|---|---|
| High voltage electrode | 1 | 5.8 × 10⁷ | Copper |
| Electrode bar | 2.3 | 4.032 × 10⁶ | Stainless steel |
| Electrode disk | 2.3 | 4.032 × 10⁶ | Stainless steel |
| Furnace water | 2.9 | 8 × 10⁻² | Trisodium phosphate solution |
Disclaimer/Publisher’s Note: The statements, opinions and data contained in all publications are solely those of the individual author(s) and contributor(s) and not of MDPI and/or the editor(s). MDPI and/or the editor(s) disclaim responsibility for any injury to people or property resulting from any ideas, methods, instructions or products referred to in the content. |
© 2024 by the authors. Licensee MDPI, Basel, Switzerland. This article is an open access article distributed under the terms and conditions of the Creative Commons Attribution (CC BY) license (https://creativecommons.org/licenses/by/4.0/).
Share and Cite
MDPI and ACS Style
He, X.; Ruan, Y.; Wang, W. Three-Dimensional Transient Electric Field Characteristics of High Pressure Electrode Boilers. Electronics 2024, 13, 1615. https://doi.org/10.3390/electronics13091615
AMA Style
He X, Ruan Y, Wang W. Three-Dimensional Transient Electric Field Characteristics of High Pressure Electrode Boilers. Electronics. 2024; 13(9):1615. https://doi.org/10.3390/electronics13091615
Chicago/Turabian StyleHe, Xiaoke, Yushuai Ruan, and Weishu Wang. 2024. "Three-Dimensional Transient Electric Field Characteristics of High Pressure Electrode Boilers" Electronics 13, no. 9: 1615. https://doi.org/10.3390/electronics13091615
Note that from the first issue of 2016, this journal uses article numbers instead of page numbers. See further details here.