1. Introduction
The tremendous development in communication technologies has resulted in enormous growth of applications ranging from data communication to social media. Recently, well developed technologies such as broadband and wireless communication have accelerated the implementation of more sophisticated and powerful technologies such as mobile cloud computing, big data, etc. [
1]. Given all of these unprecedented developments, the cloud service marketplace is also growing at a tremendous pace. In this scenario, there is a prominent need of structuring and implementing appropriate pricing mechanisms charged by the service providers to the consumers, which results in an economically sustainable cloud service market. These pricing strategies need to achieve optimal resource management, which would potentially eliminate the risk of violation of Service Level Agreement (SLA). Moreover, in order to support and sustain this unprecedented growth of the market as a whole, the pricing policies have to protect the interests of various players (stakeholders) operating in the market, such as Infrastructure-as-a-Service (IaaS) providers, Platform-as-a-Service (PaaS) and Software-as-a-Service (SaaS) providers, and the consumers (customers) in the market [
2].
In this paper, we propose developing a novel theoretical framework for implementing sustainable pricing policies and the corresponding optimal resource provisioning policies in the cloud service market, which would benefit all the stakeholders in the long run in this market, including IaaS and SaaS service providers, and price sensitive rational consumers. Here, the sustainability accounts for both economic sustainability of all the stakeholders in the market and environmental sustainability of cloud computing. The high level objective of the work is to merge these two types of sustainability through appropriate mechanisms, implemented through appropriate models considering the major characteristics and the structure of the market.
The references in [
3,
4] presents very rich discussions on the business aspects of cloud computing and cloud service market. A recent analysis from a renowned market research firm reported that the cloud market is expected to grow to $121 billion dollars by 2015 with a 26% compound annual growth rate from the $37 billion value in 2010 [
5]. A substantial proportion of the growth is being driven by rapid adoption of Software-as-a-Service platforms, which are saving businesses on the cost of licensing, management, and deployment of software and hardware for collaborative knowledge sharing and productivity enhancement. In the context of Singapore, there are many small to medium-sized enterprises and startups, which are participating as SaaS providers in the cloud service market. An example of an SaaS provider operating in Singapore is Greenmatics [
6]. This is the same for other parts of the globe as well [
7]. The SaaS providers typically provide a wide spectrum of services to the corporate clients, ranging from e-commerce, consumer data analytics, image and video content mining, etc. The SaaS providers do not typically own the cloud computing resources and data center, since that involves an enormous capital investment, which is not affordable for a small- to medium-size organization whose major expertise lies in software and application development and maintenance. These SaaS providers lease the computing resources form other big organizations such as Google, Amazon, Microsoft, etc. In
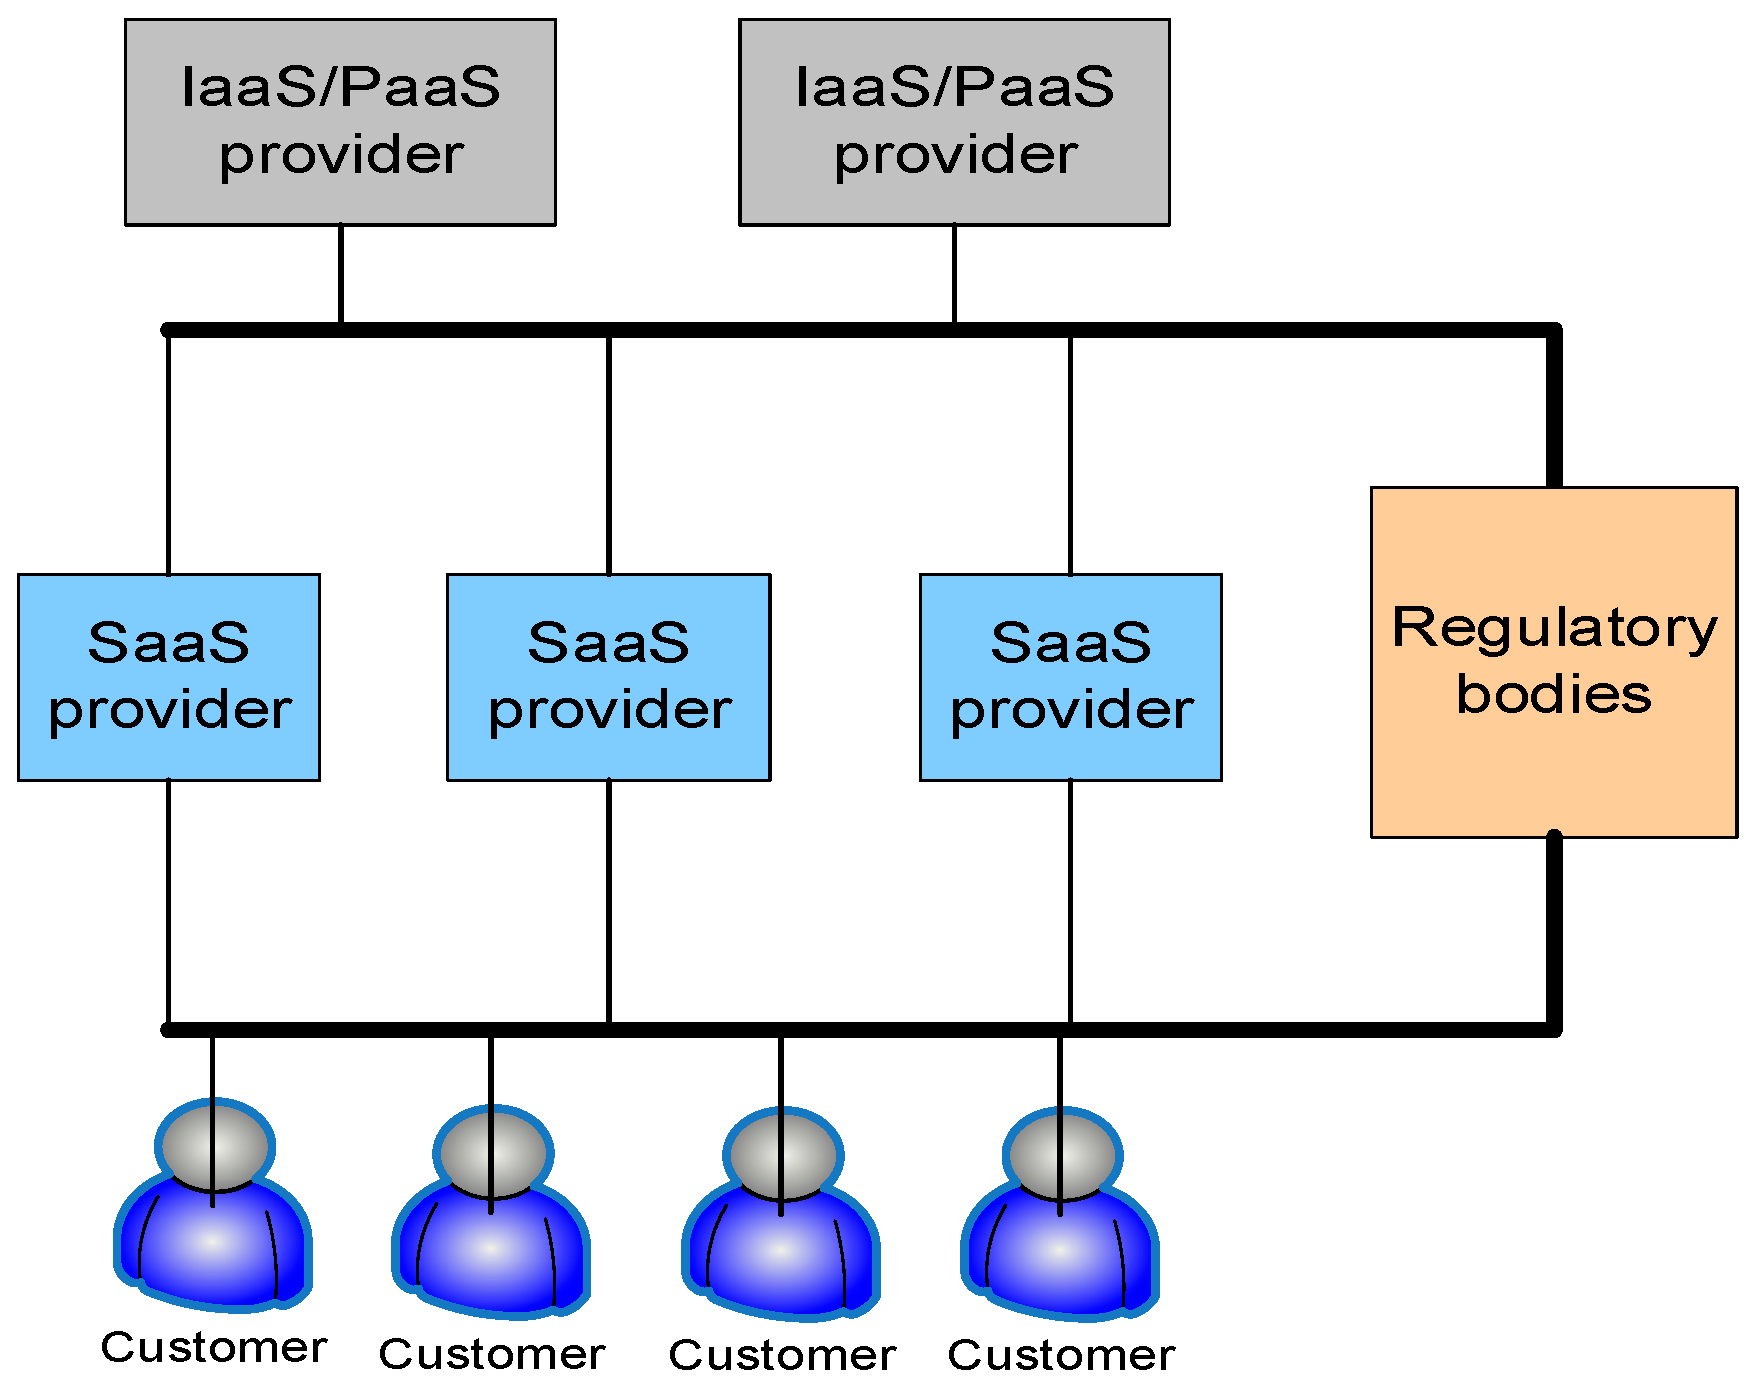
Figure 1, we give a schematic diagram of a typical three-tiered cloud service market. Typically, there are many SaaS providers and a few IaaS/PaaS providers in the market. As discussed in [
7], we treat the IaaS/PaaS providers identically, since their contribution in the entire cloud service ecology and their respective business models are very similar.
As per the present practices related to pricing of cloud services, the strategies may not be optimal in terms of many crucial parameters. For example, after the deregulation of the electricity markets in the US and some other countries, the wholesale electricity pricing is based on operational considerations that have been developed through sophisticated economic theories [
8]. Although some cloud service providers (CSPs) have implemented some structured pricing models, these are far from being mature and unified. As an instance, Amazon Web Services (AWS) charges a real time pricing called as
Spot Pricing instances for allocating various resources to its clients. The details can be found in [
9]. AWS, being a large IaaS provider, provides preconfigured virtual computing resources to the SaaS providers. SaaS providers can buy those resources to implement, run and manage the applications they provide to their end consumers. These types of customized products offered by Amazon, are called as EC2 [
10]. The description of various types of products and the respective prices can be found in [
9]. These prices vary dynamically over time and regions. Through these kinds of deals, the SaaS providers can implement and deploy their customized products and service and offer them to their end customers (consumers). The fundamental idea behind this pricing scheme is to offer the unused resources to these consumers while properly addressing the resource congestion issue. However, by performing extensive analysis on the historical price traces, the work in [
11] has empirically shown that this pricing strategy fails to reflect the actual marginal cost incurred by the CSP to address resource congestion issues.
Due to this dramatic growth of the cloud service market, the electricity consumed by the computing resources (such as data centers) is also growing at a tremendous rate. Over the globe, the data centers consume more than 2% of the total electricity [
12]. Increasing concerns associated with this dramatically increasing power consumption by cloud computing infrastructures have pushed the CSPs to adopt practices, which lead to high energy efficiency. The prominent approaches adopted by large CSPs mainly fall into two categories: (i) reducing actual power consumption and (ii) integrating renewable energy to power various subsystems of cloud infrastructure. In this work, we focus on the second aspect. A recent report [
12] discussed the various practices by large CSPs such as Amazon, Google and Facebook, who spend hundreds of millions of dollars to power their cloud service infrastructures. Another important business objective of large CSPs is power cost reduction, which is very crucial to the business objective of the CSPs since the energy cost drives a significant fraction of the overall operational cost. We capture the electricity cost incurred by the IaaS/PaaS through the model proposed in the following section.
Over the last few decades, there have been many improvements in the energy efficiency of cloud computing systems, starting from the server level to the level of a system of interconnected data centers [
13,
14,
15]. Some of the commonly adopted strategies for achieving energy efficiency at individual server levels are, Dynamic Voltage Scaling (DVS), Dynamic Voltage Frequency Scaling (DVFS), etc. [
16,
17]. The central idea behind all these strategies is to scale the performance of the server as per the service requirement. The same idea has been extended and applied in the case of an entire data center, where the numbers of servers employed are dynamically controlled over time; this is referred to as dynamic right sizing [
18] in the literature. There are well implemented algorithms for achieving power efficiency based on a discrete time model, some of which are implemented in large scale cloud computing systems. The next level of importance is to consider the deferrable jobs and to leverage their deferability to achieve energy efficiency. These jobs with deferability are commonly referred to as jobs with
slacks in the literature [
19]. This approach is particularly effective in integrating renewable energy in the system and would be crucial in achieving energy efficiency. Some earlier works proposing methods to take advantage of the inherent deferability to achieve energy efficiency are [
19,
20]. An energy saving model for data centers is proposed in [
21] by scheduling and routing deadline constrained flows, which are tasks with predefined slacks. The work in [
22] explores the opportunities for improving the profitability of the data center operators by combining some special characteristics of data centers with conventional traffic engineering. The work in [
23] presents a traffic aware resource allocation scheme for distributed cloud computing systems.
The other class of strategies to achieve power efficiency in the case of multiple interconnected data centers is popularly known as Geographical Load Balancing (GLB) [
24]. This approach is particularly effective in renewable energy incorporation since it leverages the inherent spatial diversity, if any, of renewable energy generation. This is also effective in reducing electricity cost incurred by the operator of a data center. Typically, the price of electricity varies across geographical locations, and this strategy can make use of this spatial variation in electricity price to reduce the cost [
25]. The inherent idea behind these strategies is to direct the traffic (workload) to the places where more renewable energy is available and thereby decrease the brown energy consumption, which results in reduction in the emission of greenhouse gases. The same is true for electricity price as well. In fact, some of the algorithms for geographical load balancing proposed in the literature are actually being implemented by some CSPs, which confirm the practical realizability and effectiveness of the existing algorithms. It may be noted that GLB is applicable to CSPs with multiple data centers across different geographical locations with access to renewable energy sources. Given these research endeavors in academia and many successful implementation adopted by the industries, we are quite convinced that energy efficiency practices in cloud computing system have become quite mature over the past few decades. There have also been efforts to design algorithms for GLB considering the deferrable jobs so as to reap even more benefits [
25,
26]. A strategy for implementing energy aware scheduling of batched jobs under GLB based framework may be found in [
27].
In this paper, we propose a relatively unexplored line of action to achieve energy efficiency, which is through appropriate pricing and incentivization. We believe that there is an enormous need to strongly connect pricing with resource allocation in order to implement an efficient cloud computing system. We first review the existing literature on this, which is closely related with the objective of the present paper. The literature on general service pricing for various products and topics is very vast and well beyond the scope of this paper. However, there are a few specific attributes of cloud service pricing which may be closely related with the contributions made by this paper. The topic in computer science literature which serves as a very crucial tool in developing strategies for cloud service pricing is economics of queues. This is a topic related to provisioning of incentives in controlling the length of the queue and providing differentiated Quality of Service (QoS) to different users, by implementing the notion of pricing. The early work in [
28] nicely merges concepts in economics with computer science to realize this. An auction based online mechanism design for dynamically pricing and allocating the Virtual Machine (VM) and other resources can be found in [
29]. The literature in the intersection of queueing theory and economics is quite rich and beyond the scope of the present paper. However, a few relevant references are [
30,
31]. The work very close to the theme of this paper is [
31]. It investigates the characteristics of optimal pricing strategy and the QoS experienced by delay sensitive customers. As described earlier in this section, the cloud computing market is growing at a very rapid rate. On top of that, the cloud service market is also becoming hierarchical in nature where various entities are participating in the market at different levels. It may be noted that the literature on cloud service pricing considers a wide range of perspectives such as economics, queueing theory, game theory, theory of incentives and theory of contracting. Some significant research contributions towards pricing in cloud service market are available in [
11,
32,
33,
34]. A generic discussion on the influence of competition in the market where different firms compete among themselves to service customer demands can be found in [
35]. However, the above-mentioned works address various economic perspectives of cloud service pricing considering the competition among the CSPs operating in the market. In this competitive market, the CSPs need to optimally offer their services to the customers and charge optimally to earn revenue and grow financially. In our previous work, we had addressed the energy efficiency issue through appropriate pricing [
36]. It may be noted that all the works mentioned above considered a flat cloud service market with one layer of service providers and one layer of consumers (customers). In fact, the literature on cloud service pricing considering the hierarchical nature of the cloud service market is relatively sparse. The work which addresses this hierarchical cloud service market is [
7], where the authors studied the subtle interaction between price competition and provided some insightful conclusions which would serve as important guidelines for the different entities in the cloud service market. However, the work in [
5] did not consider the issue of energy efficiency, which we do in this work. In this paper, we consider the hierarchical cloud service market as depicted in
Figure 1 and propose pricing strategies which would promote energy efficiency in the cloud service market. The other area is energy efficiency through pricing and incentivization, which is a growing topic in smart grid literature. Various techniques to achieve energy efficiency by pricing and incentivization can be found in [
37] and the references therein. Energy efficiency by pricing and incentivization specifically in the context of multiple data centers can be found in [
36,
38] and the references therein.
The contribution of this paper lies in the intersection of cloud service pricing and the energy efficiency of the cloud computing system. As discussed above, the strategies for energy efficiency at the level of a single server, a single data center, and multiple interconnected data centers are quite well developed by now. Our conviction is that in order to take the energy efficiency issue to the next level of maturity, and it has to be coupled with the economic aspects of cloud service pricing. The contributions of this paper are threefold. Firstly, we consider the realistic three-tiered cloud service market, where different entities occupy different places in the holistic cloud service industry ecosystem. Secondly, in this cloud service market, we propose an energy efficient pricing scheme, considering together the economic sustainability and the environmental sustainability of the cloud service market. Thirdly, we design a strategy for earning more revenue by providing a better Quality of Service (QoS) to the higher priority jobs. We carry out rigorous evaluations of the proposed methodologies with real data traces on electricity price, renewable energy generation, data center internal cooling dynamics, data center workload, etc. The rest of this paper is organized as follows.
Section 2 introduces the framework to model the three-tiered cloud service market.
Section 3 describes the settings under which the performance of the proposed strategies is evaluated.
Section 4 presents and discusses the results.
Section 5 concludes the paper.
2. Model for a Three-Tiered Cloud Service Market
This section presents the framework to model the dynamics of a three-tier cloud service market. Let there be
N IaaS providers,
S SaaS providers, and
K workload classes. Let
i,
s and
k be the indices to indicate these entities, respectively. The notations used in this model are presented in
Table 1 given below.
In this work, we assume the popular model where the revenue of SaaS is a linear function of the workload. To capture the value of different workload types, the coefficient may be chosen differently for different workload classes. However, since these are determined by the market (i.e., the end customers), they would be constant for all the SaaSs. Hence, the revenue earned by SaaS provider
s, by serving a workload of amount
of workload type
k, is given by:
It may be noted that the service requests are actually generated by the end customers. We assume that the end customers choose the SaaS providers from which they wish to receive the service. This may be based on long-term business relationships or goodwill related factors. After receiving the job requests from the end customers, the SaaS providers generate the job requests that are to be serviced by the IaaS providers. The service request generated by the end customers may be of different forms. These are processed initially by the SaaS providers and mapped to executable workload. That workload is finally submitted to the IaaS providers. The total revenue earned by SaaS provider
s is the sum of the revenues across all the workload types. This is obtained by:
The profit earned by the SaaS provider
s is given by the difference between the cost incurred by the SaaS to service the workload and the revenue earned from the end customers. This depends on how the IaaS providers charge the SaaS providers. In this paper, we have assumed a simple and realistic model that connects the end customers, the SaaS providers and the IaaS providers as depicted in
Figure 1. For this, the profit earned by the SaaS provider
s is given by:
The second term in Equation (3) is the expectation of the cost incurred by SaaS provider s, to service the workload
with a given QoS level
. Here,
is not known to the IaaS service provider, and, therefore, it is treated as a random variable and is based on the estimation from the existing data sets. The actual profit is computed as per the actual realization of this price, which is available post priori. The cumulative profit earned by SaaS provider
s, over timeslot 1 to
T, is obtained by:
The QoS for cloud services is usually the average response time, which includes both the waiting time prior to service and the service time. A significant development in queueing theory allows for characterizing the average characteristics of these parameters, which may be calculated using well established robust methodologies. In fact, based on well-known results in queueing theory, large systems are operated with robust guarantee on QoS [
39]. In this model, the QoS is captured in the contract between the IaaS providers and the SaaS providers, using a standard result from queueing theory as given below:
We now present the strategy for computing the cost incurred by IaaS provider
i, to service the workload generated in the market by the SaaS providers, which are actually the service requests generated by the end customers. This is the aspect of our model, which considers the operational details of the data centers, operated by the IaaS/PaaS providers. The model we adopt here is the same as the one in [
36]. This is based on a discrete time based control where the servers are dynamically controlled as per the service requirement. Here, the optimization procedure is carried out in every timeslot to compute the number of servers to be activated for the current timeslot. The objective function of the optimization procedure is a linear combination of the electricity cost to operate the servers and the adverse effects of turning servers on to off and vice versa. The total energy consumed by the data center operated by IaaS provider
i at timeslot
t is assumed to be:
Equation (6) shown above captures the time varying dynamics of physical energy efficiency status of the data center operated by IaaS provider
i for the timeslot
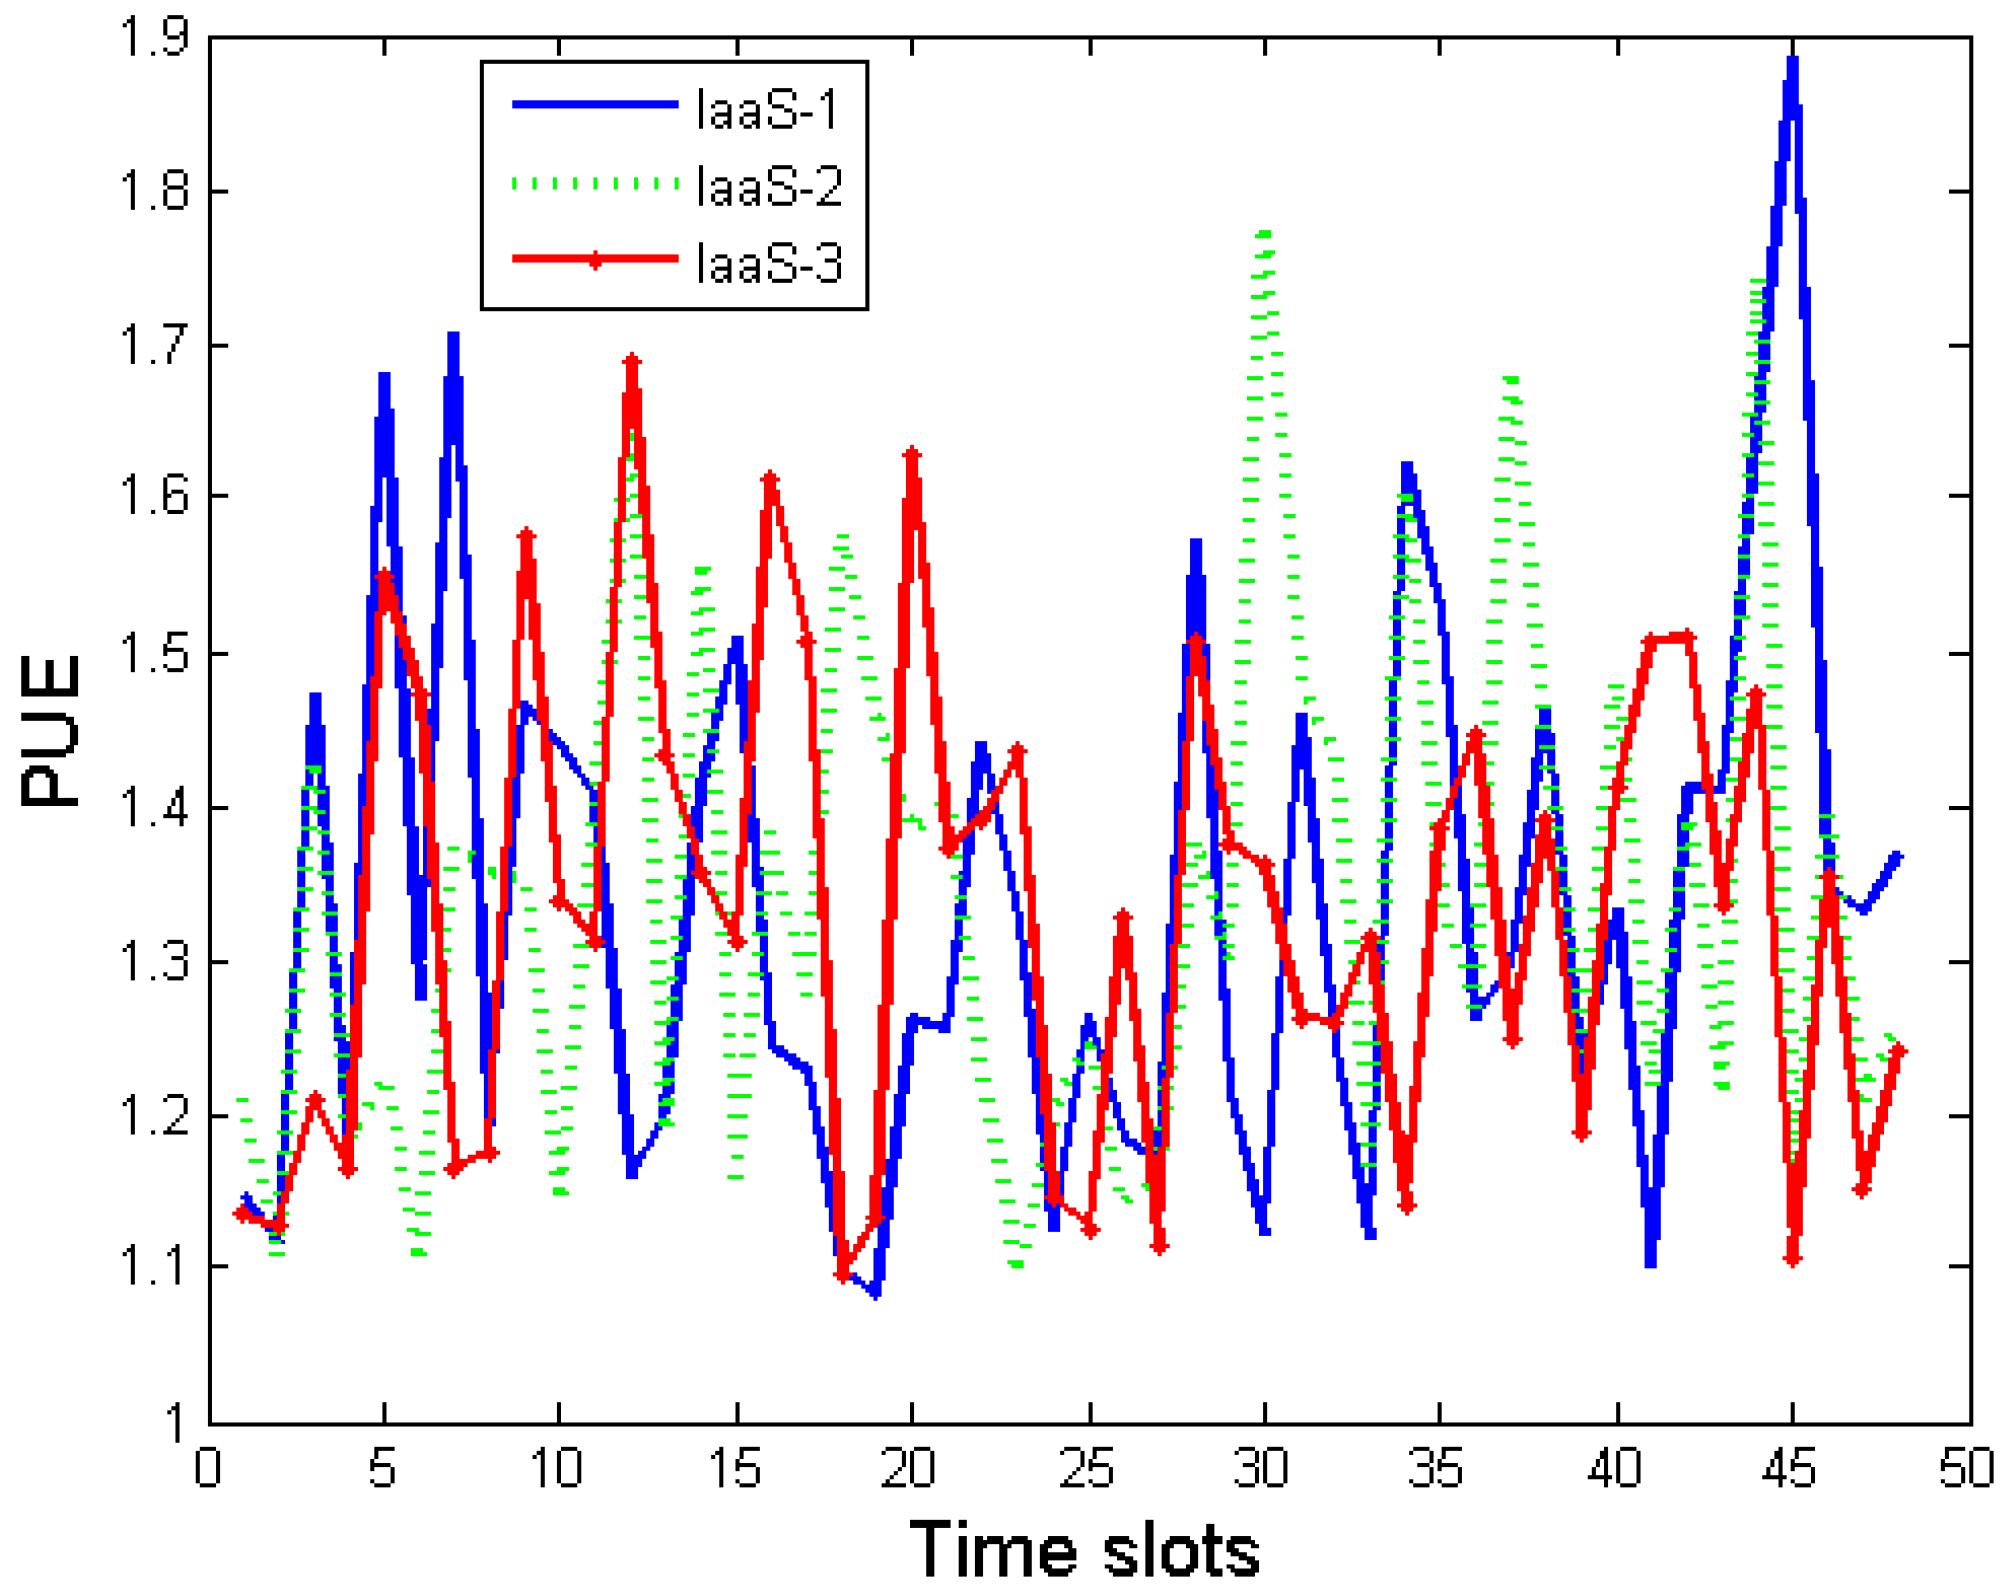
t. Power Usage Effectiveness (PUE) is a crucial parameter summarizing the operational status in terms of energy efficiency [
19].
PUE is defined as the ratio between the total power consumed by a data center and the total power consumed by the servers. For a detailed discussion on PUE and associated topic, one may refer to [
13]. Since the numerator is always greater than the denominator, PUE is always greater than 1. Though the PUE may even be as low as 1.1 for an efficiently managed data center, it is generally greater than 1.5 in practice [
12]. It is reported that even for a single data center, the value of
PUE varies quite dramatically during the day depending on outside temperature, cooling system efficiency, etc. [
19]. We assume that the data center is being operated in the real time electricity market, which is quite common in practice, and that the data centers are quite big consumers of electricity [
19,
25,
36]. Hence, the energy cost incurred by IaaS provide
i in the timeslot
t is given by:
We assume that IaaS provider
i has access to the onsite renewable energy source owned by it. In the case where an IaaS provider does not own any renewable energy generating resources, it may have some form of long-term contract with some utility providers. It may be noted that, these days, with the aggressive drives for improving the energy consumption portfolio and reducing emission, plenty of medium- to large-sized cloud service providers (mainly the IaaS/PaaS providers) are heavily investing on renewable energy. Some of the big cloud service providers such as Facebook and Google own renewable energy generating infrastructure to generate on site renewable energy to power their data centers. The small- to medium-size companies, who are unable to make that huge investment upfront, typically choose to go for a long-term contract with the utility provider to supply renewable energy to power the data centers owned by them [
12].
A major downside of controlling the number of servers dynamically over time according to the service requirement is that, in reality, there are some adverse effects associated with transitioning a server from OFF to ON and vice versa. These adverse effects arise from three sources, namely, (i) the servers consume almost peak energy during the transition without performing any work; (ii) there may be some adverse effects of frequent transitions from OFF to ON and vice versa on the server lifetime; and (iii) there are job migration overheads that need to be taken care of by virtualization tools. However, it may be noted that the server virtualization techniques are currently quite mature and implemented in a fairly robust way in large scale data centers [
40]. Another work proposing a joint optimization procedure to perform energy efficient virtual machine assignment and traffic engineering by considering specific characteristics of the applications and the topology of the network may be found in [
41]. In literature, the adverse effects of server switching has been modeled as both linear [
18] and non-linear functions [
19]. For the purposes of the present paper, we assume a linear cost as our focus is energy aware pricing, and we are not interested in analyzing the structure of the switching cost function itself and its effects as described in [
19,
25]:
Here,
denotes the function to capture the adverse effects of toggling servers which is assumed to be:
We now present the pricing model of the IaaS providers. The most common charging is a revenue based model, which we adopt here. The profit margin is to be strategically determined by the IaaS providers. The optimization procedure for the load distribution takes care of the aggregated cost incurred by the SaaS providers, which accounts for the fact that the IaaS providers charging high prices will experience a reduced demand. The profit earned by the IaaS provider
i, during timeslot
t, is given by:
The cumulative profit earned by IaaS provider
i, from
t = 1 to
T is obtained by:
Typically, there are many SaaS providers but only a few IaaS providers [
7]. As a result, one IaaS provider will service more than one (in fact many) SaaS providers. It would therefore be quite natural that the SaaS providers are charged as per the fraction of the workload serviced by the IaaS provider
i. This is true for all the IaaS providers. The realization of the price incurred by SaaS provider
s, for workload type
k is obtained by:
The total cost incurred by SaaS provider s, aggregated across all the workload types is obtained by:
We now present the optimization procedure to determine the load distribution which would minimize the total cost incurred by the SaaS providers. As done previously in our earlier work [
36], we assume that there is a centralized coordinator who mediates the load balancing process between the IaaS providers. However, [
27] did not differentiate between SaaS providers and IaaS providers, which is considered in the present paper. Here, the IaaS providers and SaaS providers are modeled as per their typical characteristics, which is the major contribution of this paper. We specifically focus on the load distribution between the IaaS providers. This would, in turn, minimize the cost paid by the end customers. This also takes care of the fact that the IaaS providers charging more (and thereby earning more revenue) will experience a reduction in demand. This can also be mediated by the regulator to ensure fairness and service compliance in the cloud service market. The objective function of the optimization procedure is presented in (14). The constraints are presented in (15) to (18):
The constraint in Equation (15) ensures that the aggregate workload generated by all the SaaS providers is equal to the aggregate workload served by the IaaS providers, for all workload types k. The total workload serviced by IaaS provide i, is the total amount of workload received by it, summed across all the workload types. This condition is enforced through Equation (16). The total number of servers provided by IaaS provider i is the sum across the number of servers to be provided for different workload types, as per the QoS for the type of the workload. This is enforced through Equation (17). It may be noted that we assume that for each workload type k, the amount of server requirement is known to the IaaS providers, which is reflected in the price charged by the SaaS providers to the end customers. On top of this, the optimization procedure (and the algorithm to implement this) must take care of the fact that the workload assigned to an IaaS provider is non negative for all workload types and IaaS providers. This is ensured through Equation (18). In the following subsection, we present the methodology for earning higher profit by proving better QoS for the services.
Methodology for Provisioning Servers for Higher Profit:
The improvement of business revenue, by charging a higher cost for a better quality of service is a fairly rich topic [
35]. The quality of service provided becomes very crucial when there is competition as in the cloud service market. However, we feel that more rigorous investigations on modeling the value of improved quality are required to handle this properly. We now present a strategy to improve the performance in terms of QoS for the higher priority jobs based on the
square root staffing law, in queueing theory literature [
42]. This states that, for an M/M/k queue with arrival rate λ, server speed µ, and
R = λ/µ, if
denotes the least number of servers to ensure that the probability that a job has to queue is upper bounded by α, then
where
c solves the following:
where
and
denote the CDF and pdf of a standard normal distribution, respectively [
42]. However, we note that the formula given above is based on the assumption that a Poisson distribution of mean λ can be approximated (with reasonable precision) by a normal distribution with the same mean and variance λ, as long as λ is large [
42]. This assumption would hold for large scale server farms and is the reason why we chose to apply this in server provisioning.
In this work, we make a simple yet reasonable assumption that the increase in profit is a linear function of decrease in average response time, with a constant η
k (depends on the workload type) that controls the sensitivity of the profit with respect to the QoS (in this case, average response time). The physical interpretation of η
k is that it represents the customers’ willingness to pay more for better QoS associated with job type
k:
This policy is separate from the optimization procedure described in Equation (14) through Equation (18) and provides another “knob” for strategically controlling the price-quality tradeoff. We employ this strategy of providing better QoS on top of the baseline strategy presented above. This strategy is called as Square Root Algorithm (SqRA) since this is computed on the basis of the square root staffing rule in queueing theory [
42].
The following section presents the novel experimental setup under which we carry out the simulations to emulate the dynamics of a typical three-tiered cloud service market, although there have been some research efforts to understand the price and the negative effect associated with congestion in the Internet [
2]. We hope that this simple approach will enable more sophisticated developments in the areas of rewards for better quality service in the cloud service market.
3. Performance Evaluation
This section discusses the settings under which we perform simulation experiments to evaluate the efficiency and effectiveness of the pricing strategy proposed in this paper. We used real data traces to carry out the experiments. We consider a market with three IaaS providers and six SaaS providers serving a pool of end customers, as shown in
Figure 1. In the simulation, we assume that each IaaS provider is operating a data center where we assume that the IaaS providers 1, 2 and 3 are operating their data centers in California, New York and Pennsylvania, respectively. However, the model proposed in the paper can handle an arbitrary number of data centers operated by an IaaS. In that case, the respective IaaS needs to perform some GLB strategy as presented in [
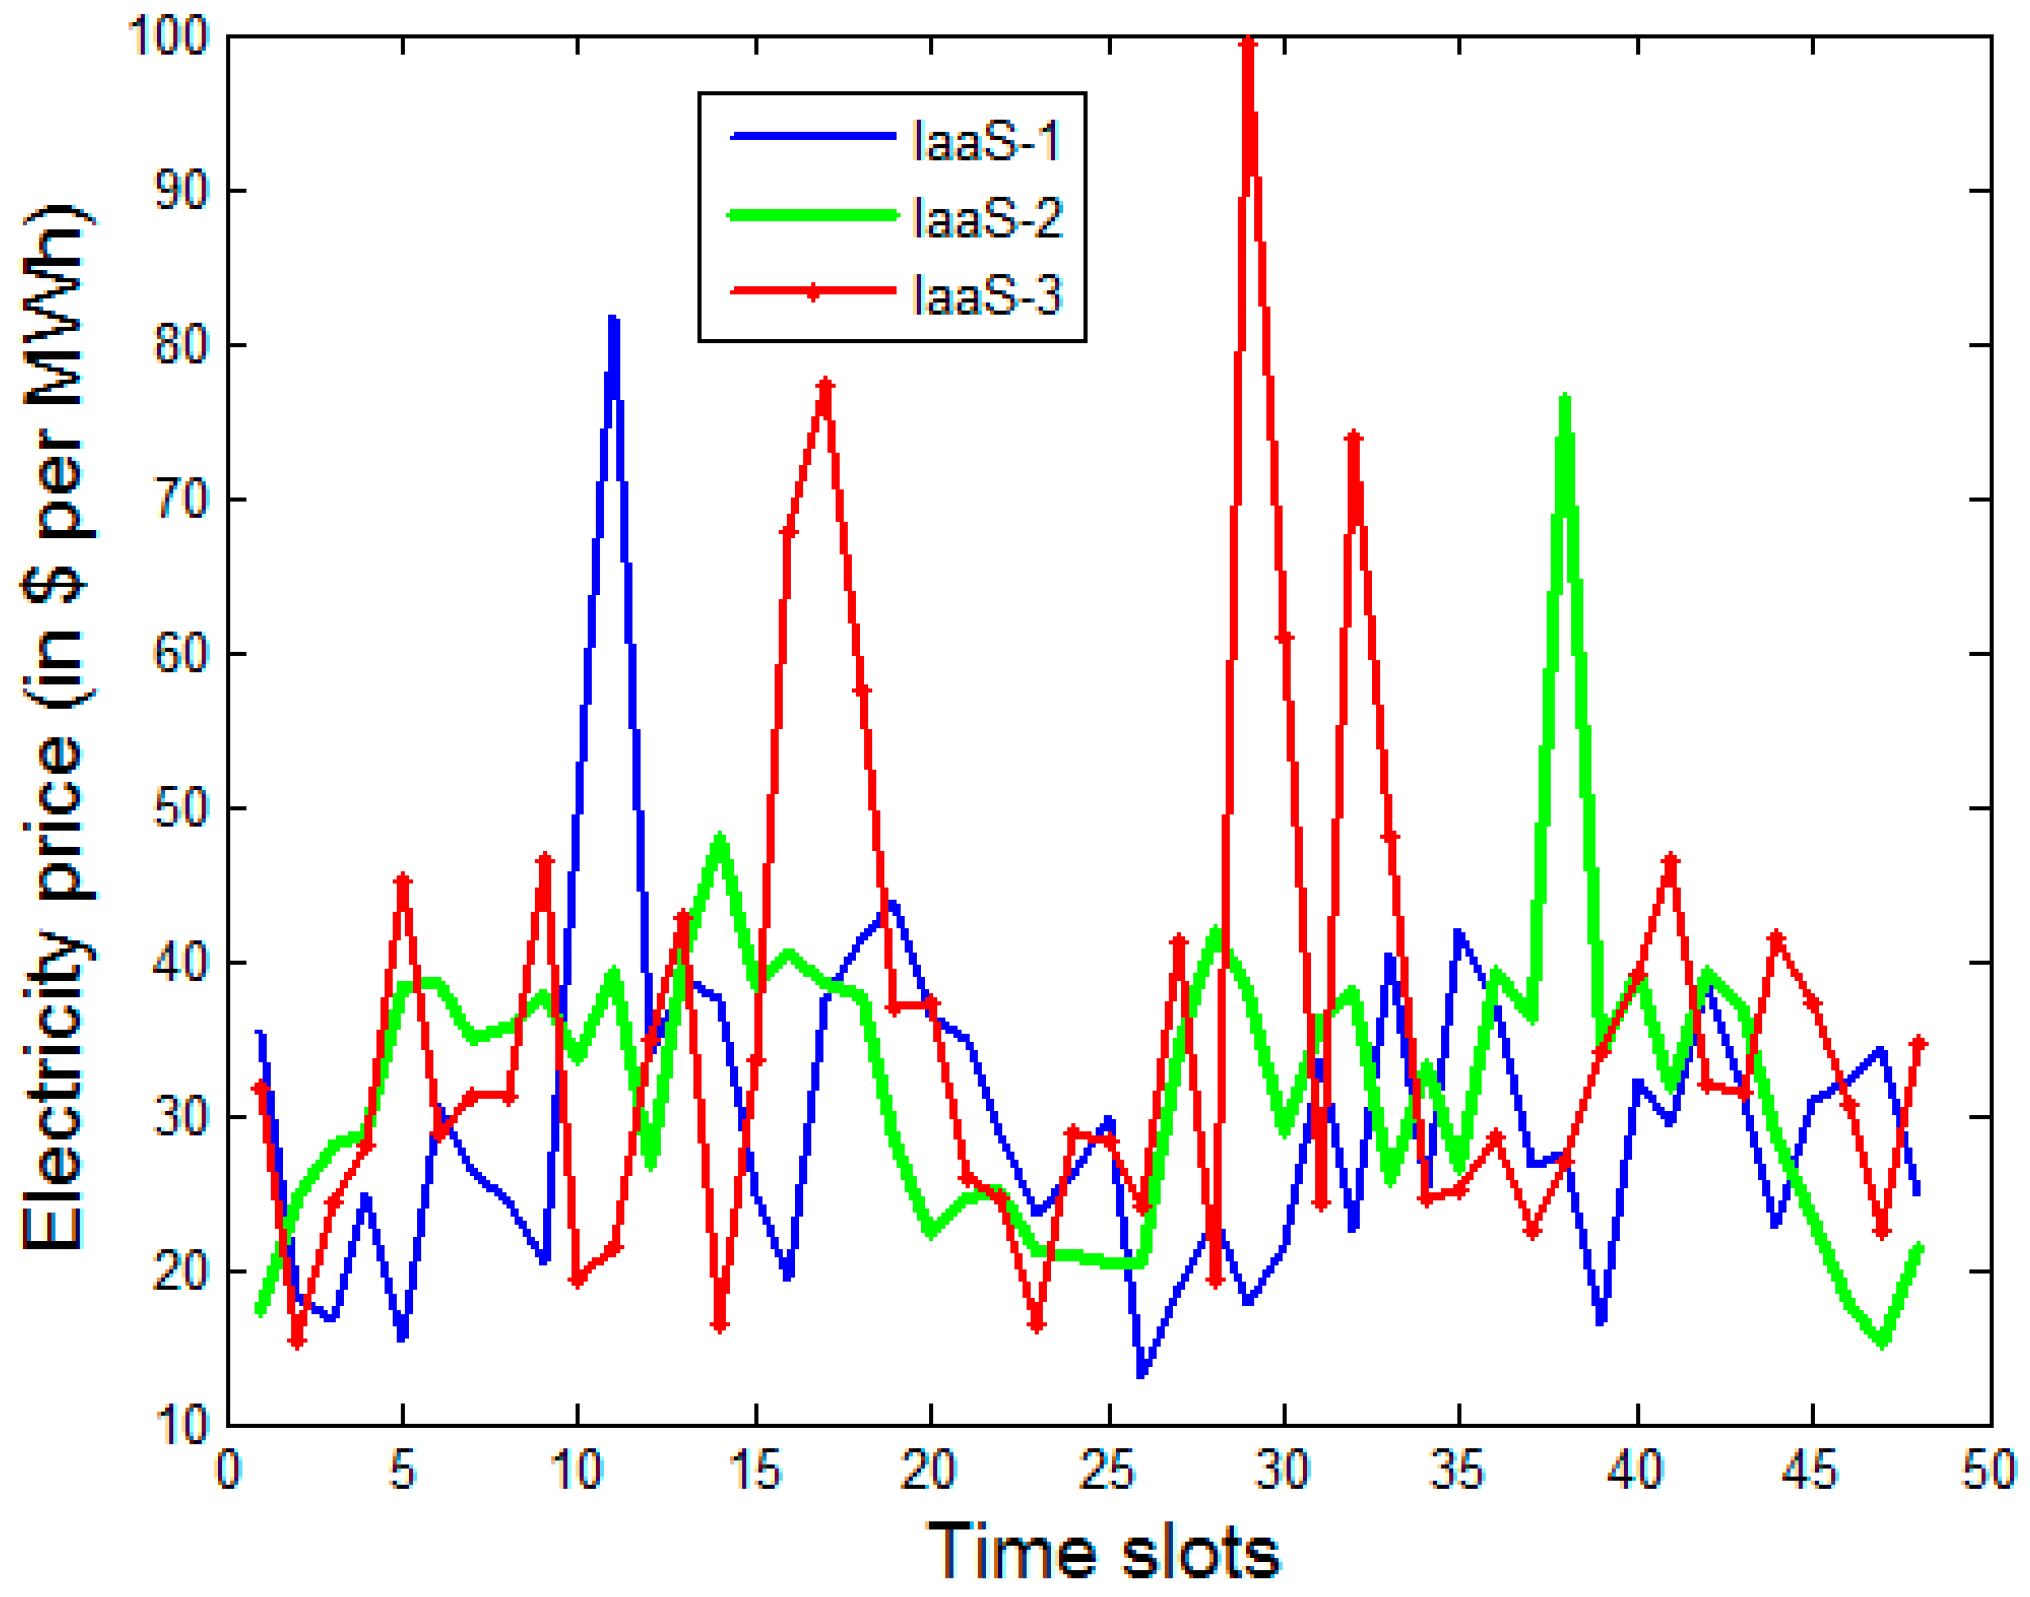
25]. The electricity price data is obtained from [
43]. The timeslot length is set to be 1 h. The simulation is carried out for a time scale of two days and the results are reported in the following section. The workload trace is taken from a commercial server farm owned by Facebook, obtained from [
44] which have also been used earlier in [
36]. The renewable energy trace and PUE are obtained from [
44] and are also the ones used in [
36]. For the workload types, it is assumed that there are four different workload types. It may be noted that the workload characteristics can capture the inherent nature of the workload such as type, resource requirement, processing cost, revenue to the SaaS providers, etc. The type of workload may be scientific simulation, medical image processing, workload generated by the customers of an online retail business, workload generated by a corporate business analytics system, etc. In fact, this can include any service provided in the cloud system. The workload characteristics are defined by end customers and they are identical across all the SaaS providers and IaaS providers in the market. The most crucial attribute of a workload type is its resource requirement. We have assumed different server requirement for each workload type. Obviously, the revenue to the SaaS providers for servicing these workloads is also different and is defined by the end customers. The resource requirement is assumed to be a linear function of the amount of workload and varies across different workload types in the form:
where
k denotes the workload type. The resource requirement characteristics of different workload types and the corresponding revenue generating constant for an SaaS provider is presented in
Table 2, given below:
In this model, the SaaS providers charge the end customers in a pay as you go manner, which is the pricing scheme prevalent in the market [
45]. The model presented in
Section 2 assumes that the IaaS providers follow a revenue based model for profit, i.e., the profit earned by the IaaS providers operating in the market is a linear function of the cost incurred to service the given workload. In other words, the IaaS provider adds some margin over the operational cost incurred to service the given workload. The profit margin a particular IaaS provider chooses to earn depends on the margin and market share trade-off. During the load distribution, the load is distributed so as to minimize the total cost. This is controlled by a centralized entity, which may be the regulatory body, as described in
Figure 1. We focus on considering the competition between the IaaS providers and this load distribution optimization procedure is designed to distribute the load among the IaaS providers. This implies that if a provider chooses to earn more revenue by higher pricing, then it would eventually lose demand and consequently lose its market share. If this continues for long, then the service provider trying to charge more will get extinct from the market. The optimization procedure presented in
Section 2 takes care of this and computes an optimal load balancing in this cloud service market. This is a popular model in economics and deployed in pricing of a wide range of products and services [
46]. Moreover, since the cloud service is an emerging market, there will be some regulators in the market responsible for ensuring that there is no monopoly in the market and the customers are priced fairly [
36]. If there is monopoly in the market, then the profit driven companies may even increase the price unreasonably since the customers will not have any alternative service provider to go to. In the simulation experiments, we assume that the operating IaaS providers 1, 2 and 3 are earning profits that are 5%, 10% and 8% of their operational costs, respectively. The following section presents and discusses the results. While implementing the SqRA strategy for providing better QoS to earn higher profit, we choose the parameter
c in Equation (17) to be equal to 1 in the numerical experiments. It may be noted that
c can be chosen arbitrarily as per the QoS preference of the end customers, which would depend on the job type as well.
4. Results
Figure 2 given below plots the electricity cost experienced by the IaaS providers.
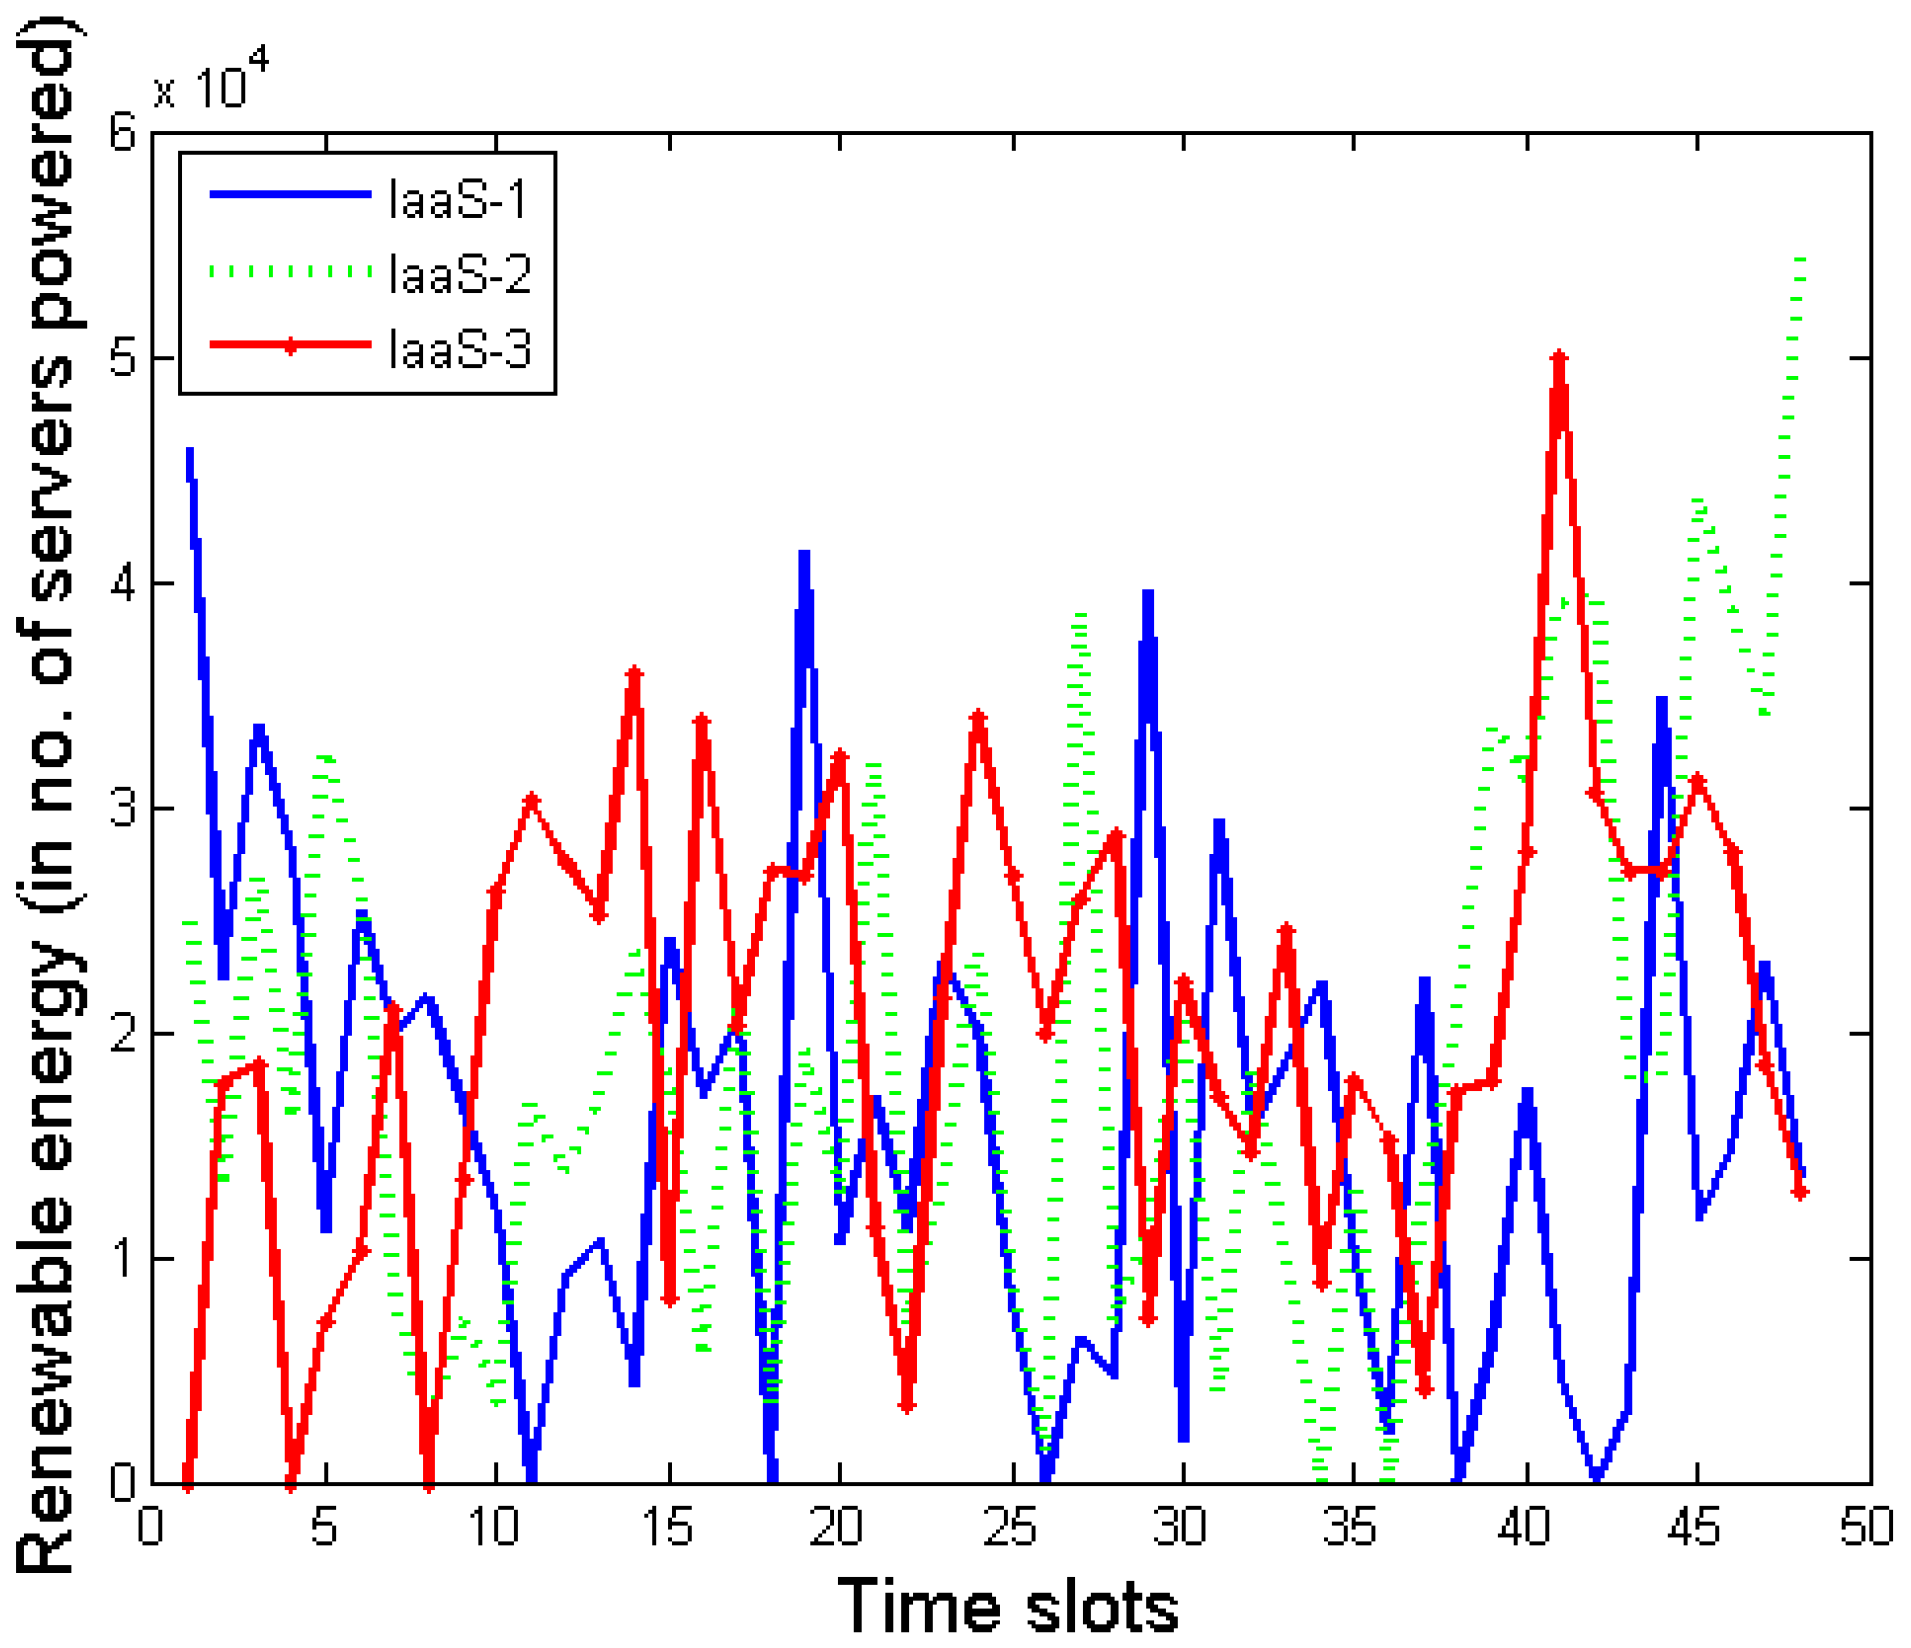
Figure 3 and
Figure 4 plot the time series data of PUE and renewable energy availability, respectively. The renewable energy availability is normalized with respect to the amount of energy required to power a single server for one timeslot. Here are some details about the workload trace used in this evaluation. We took the workload trace publicly released by Facebook, in the form of time-series variation in the number of job requests at one of their server cluster [
36]. It is well-known that, in general, the Internet traffic follows a diurnal pattern [
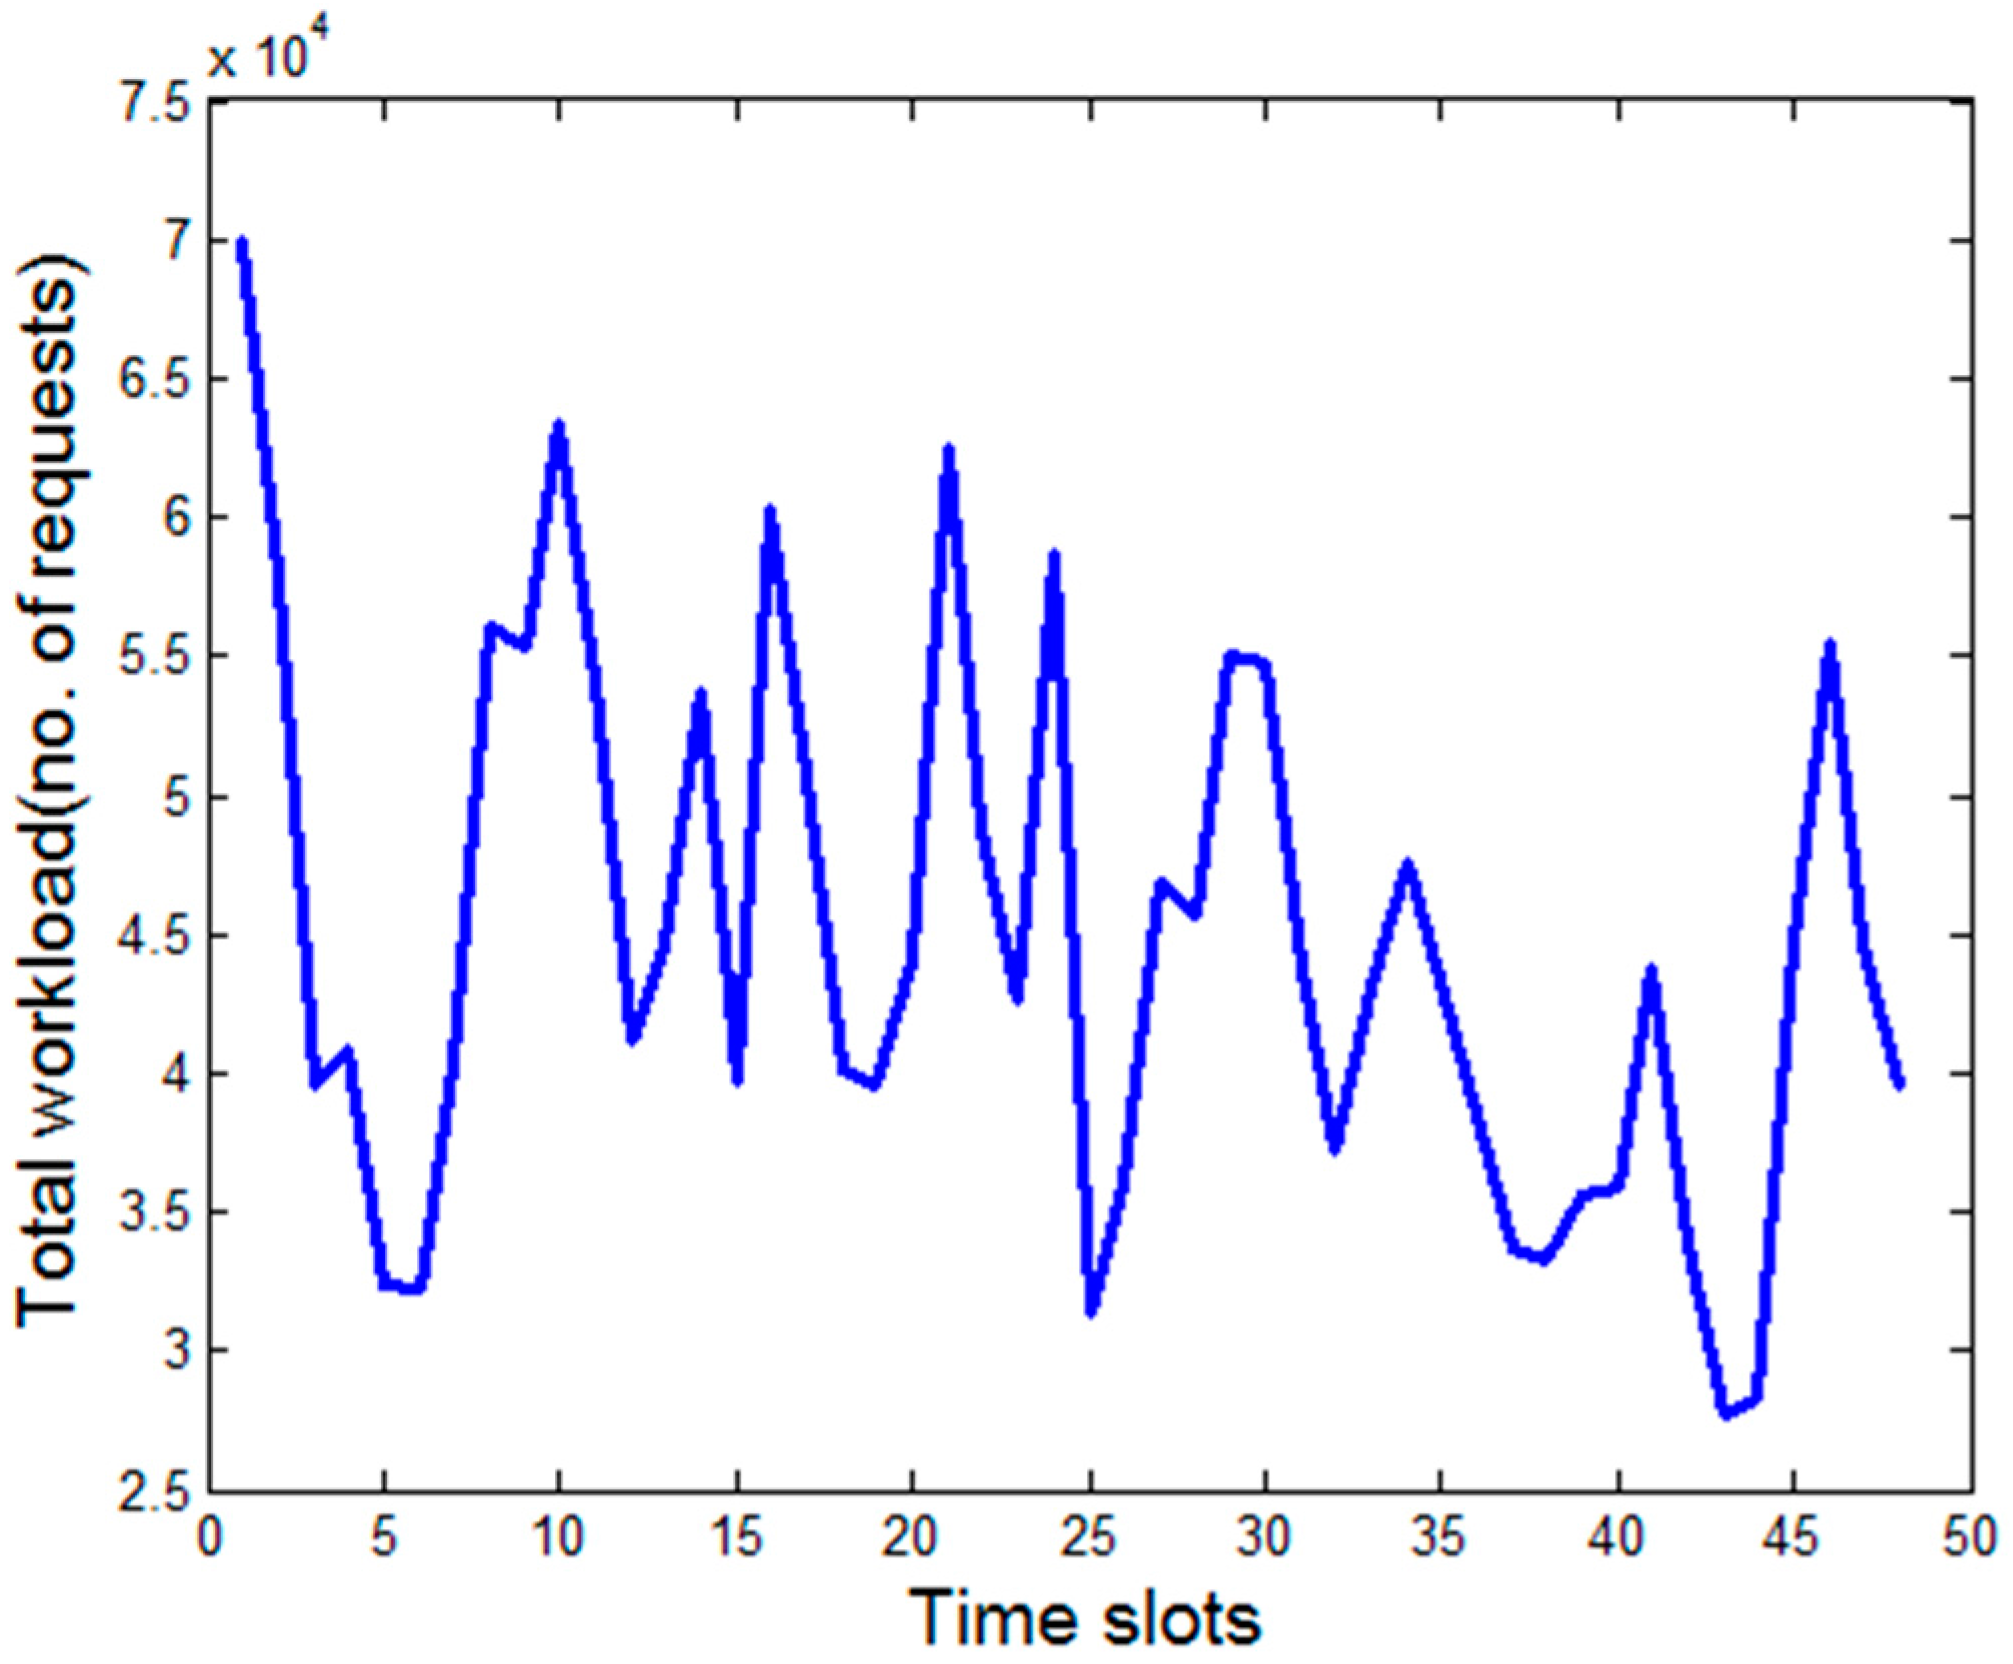
24]. Preserving the temporal variation of the total workload, we generate the workload produced by the individual SaaS providers. The amount (size) of workload incurred by a job request is assumed to follow Poisson distribution with a mean that can be serviced by one server with unit service rate in one timeslot. In this paper, we do not discriminate between workload and job request and use these two terms interchangeably. The requests are generated by the end customers and are submitted to the SaaS providers. Once these requests reach the SaaS providers, they map it to some executable workloads that are to be submitted to the IaaS providers. We develop an optimization procedure for the load distribution among the IaaS providers.
Figure 5 plots the temporal variation of the total workload (in no. of requests) generated by the SaaS providers, which are actually mapped from the requests generated from the end customers.
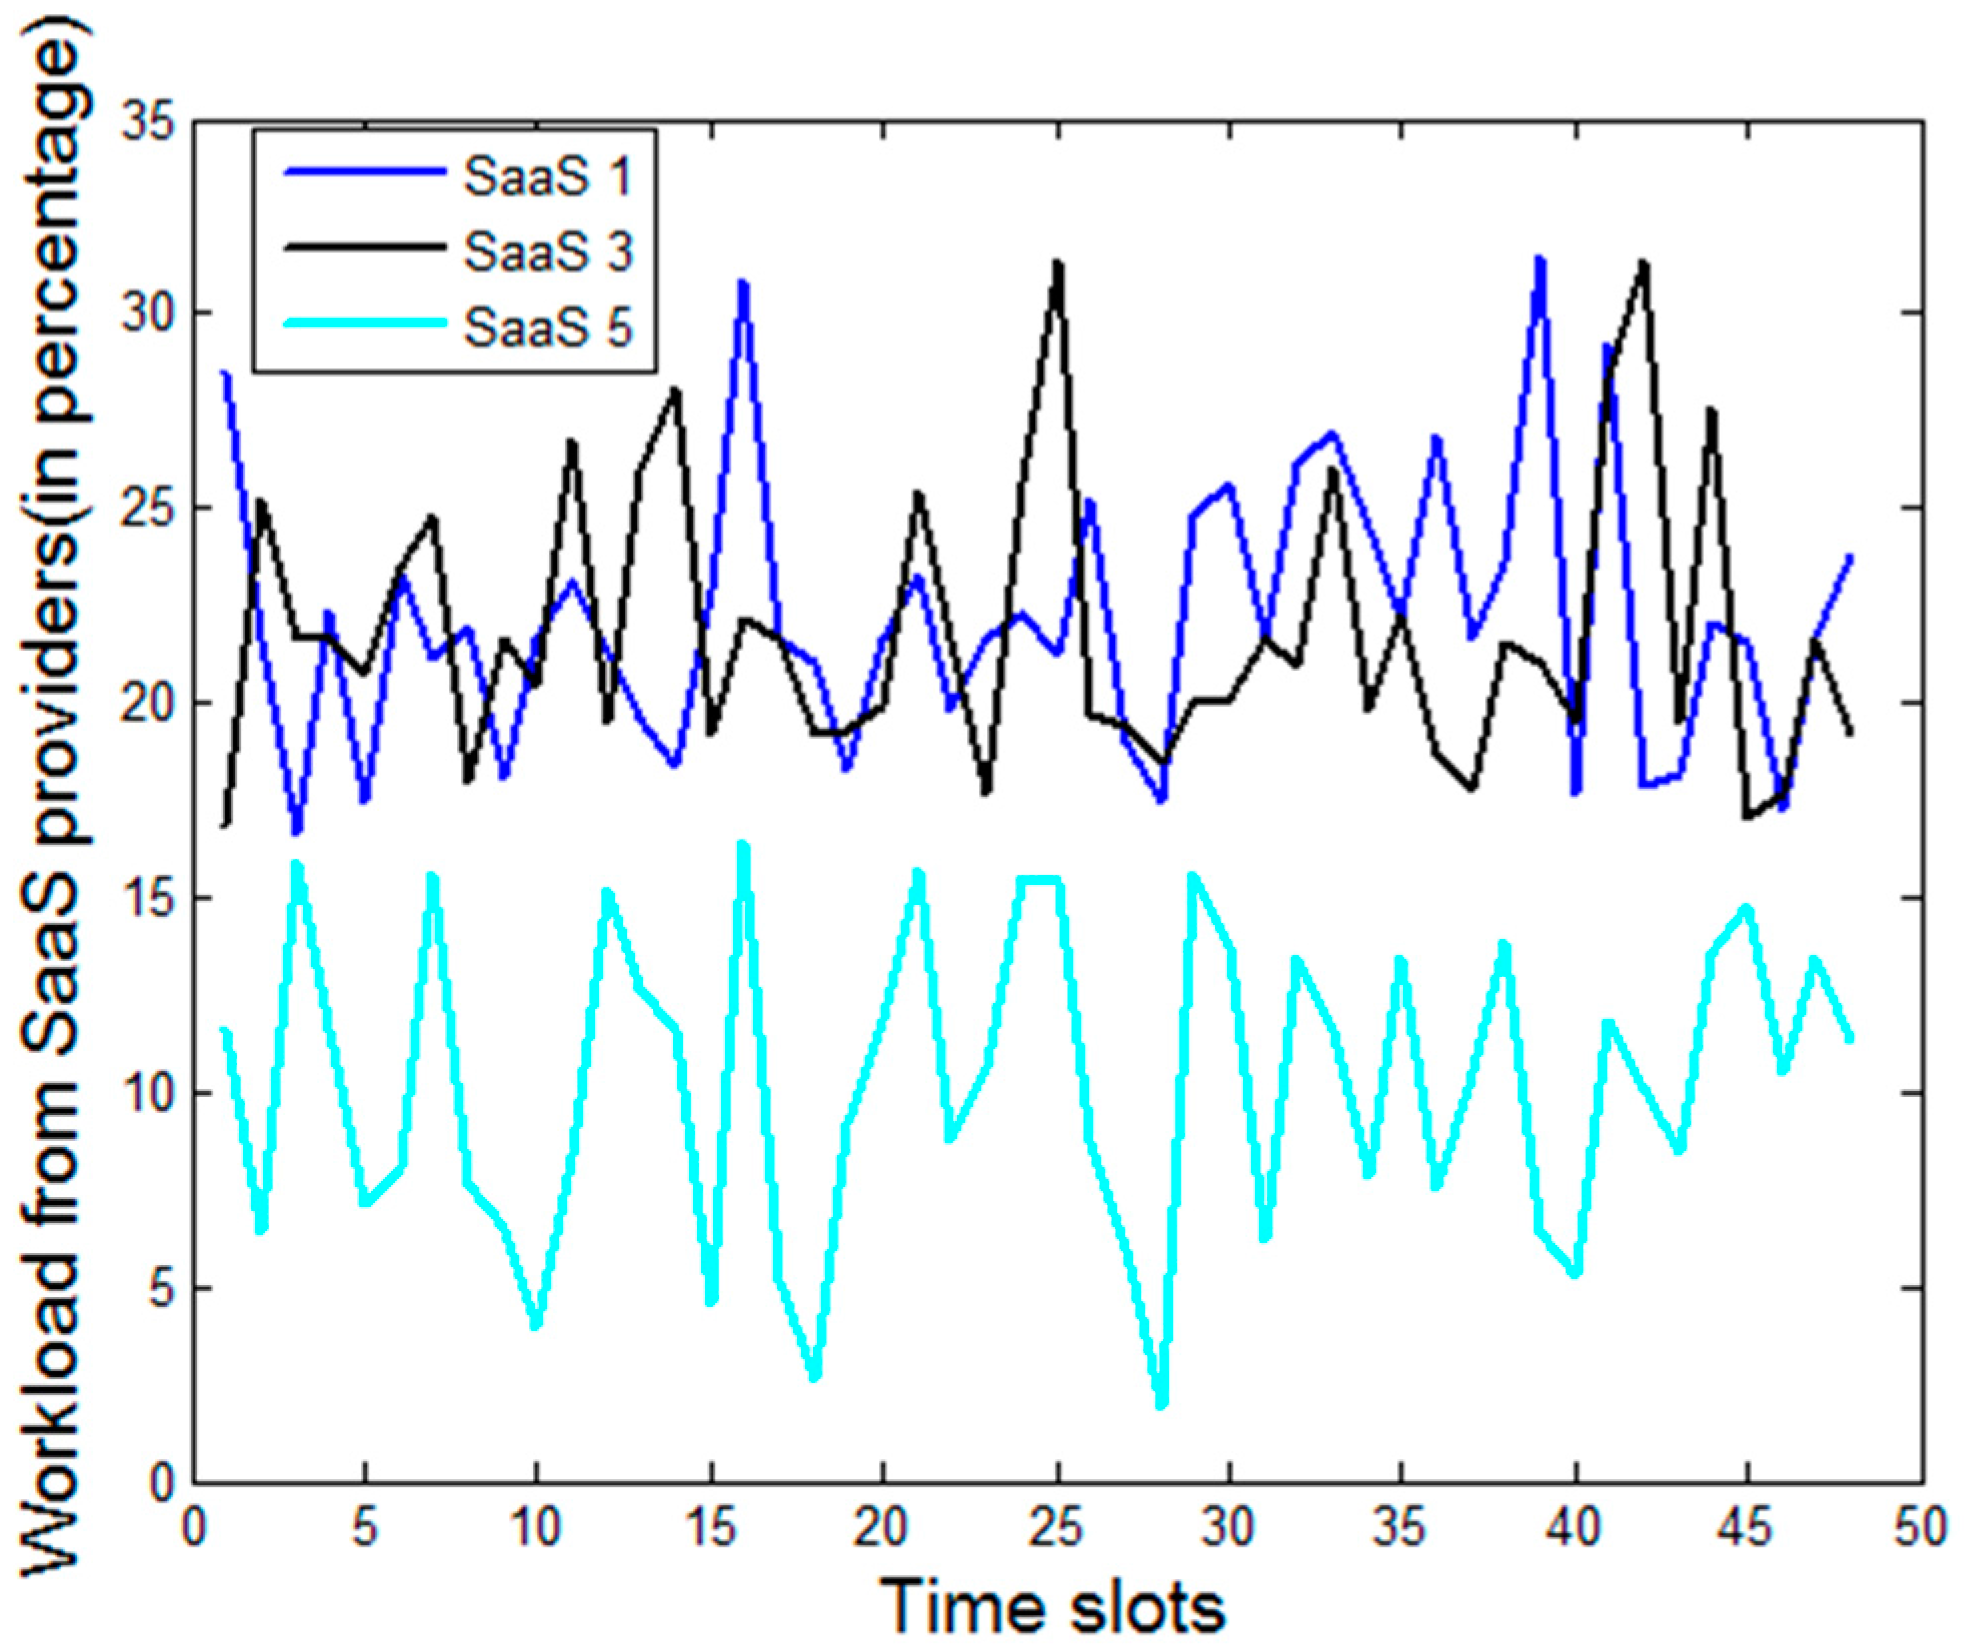
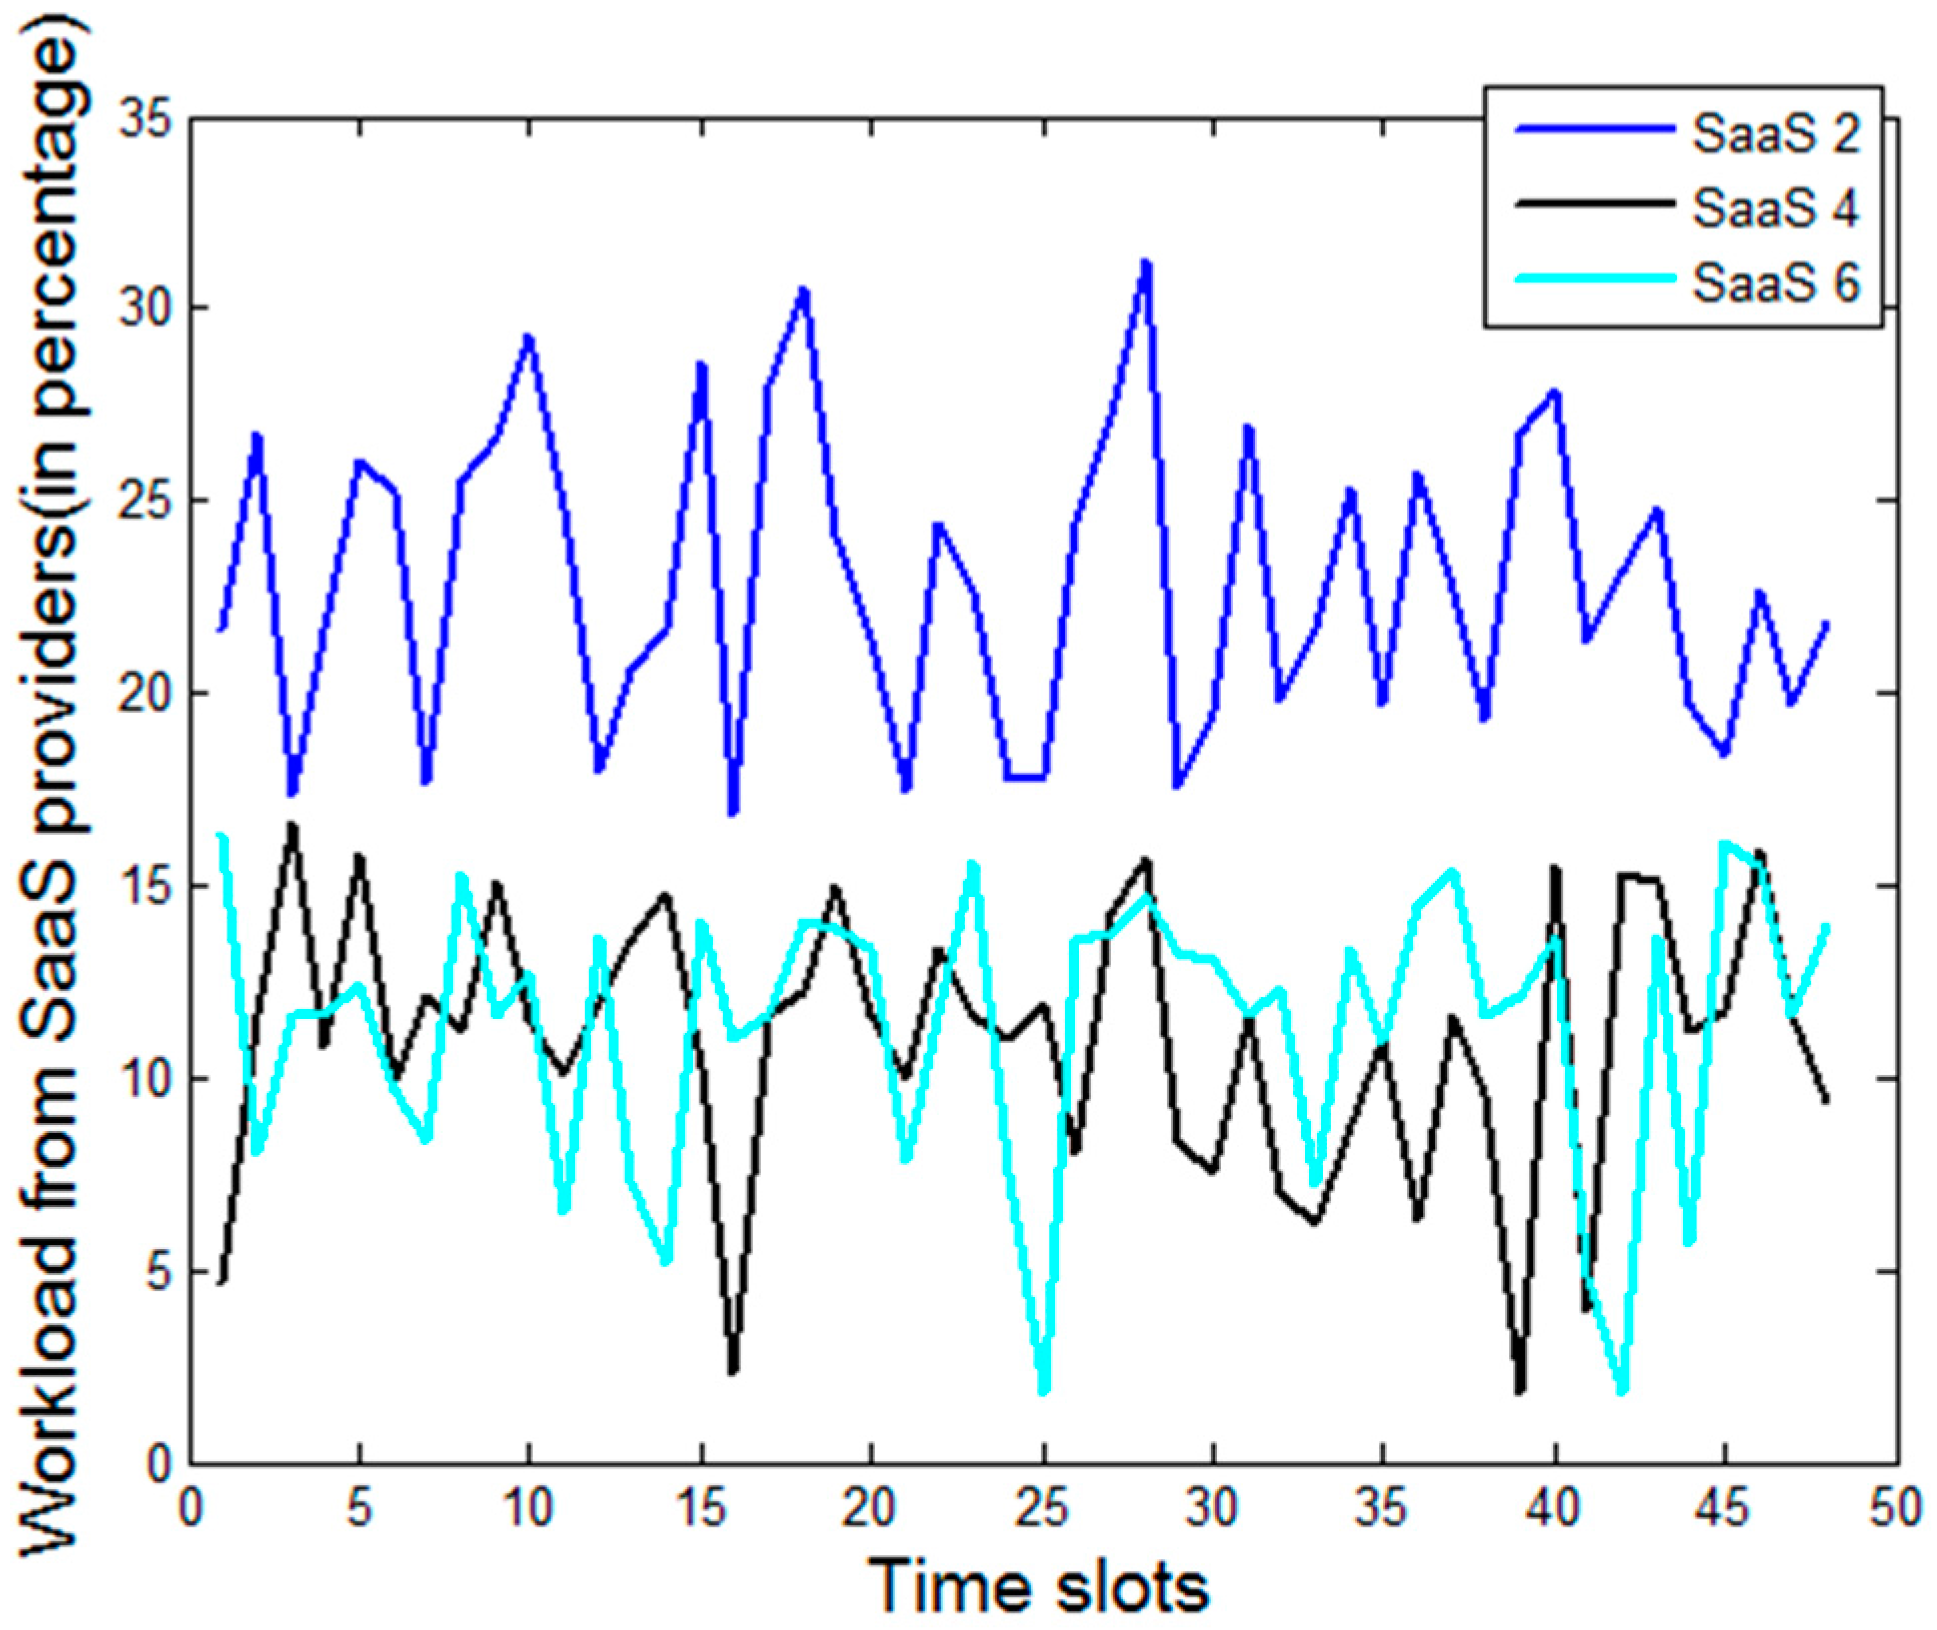
Figure 6 plots the time series data of the workload generated by the individual SaaS providers. We assume that the end customer chooses the SaaS provider individually, which is exogenous to the model. There are typically many factors that determine the overall business revenue of an SaaS provider like the size, the reputation, customer base, maturity in terms of technology deployments, etc. We observe from
Figure 6 that some SaaS providers constantly experience more demand than others, which can indeed happen in practice. The size and scale of the SaaS providers can also be different [
3]. However, the framework presented in
Section 2 captures the details of a cloud service system at a very detailed granularity. It is challenging to obtain the detailed distribution of the different job types serviced by SaaS (and IaaS subsequently). For the four individual workload types, we assume that each of them contributes to one quarter of the total workload. However, the resource requirement for each workload is different, which is presented in
Table 2 of the previous section. The revenue associated with different workload types are also different and are in line with resource requirements.
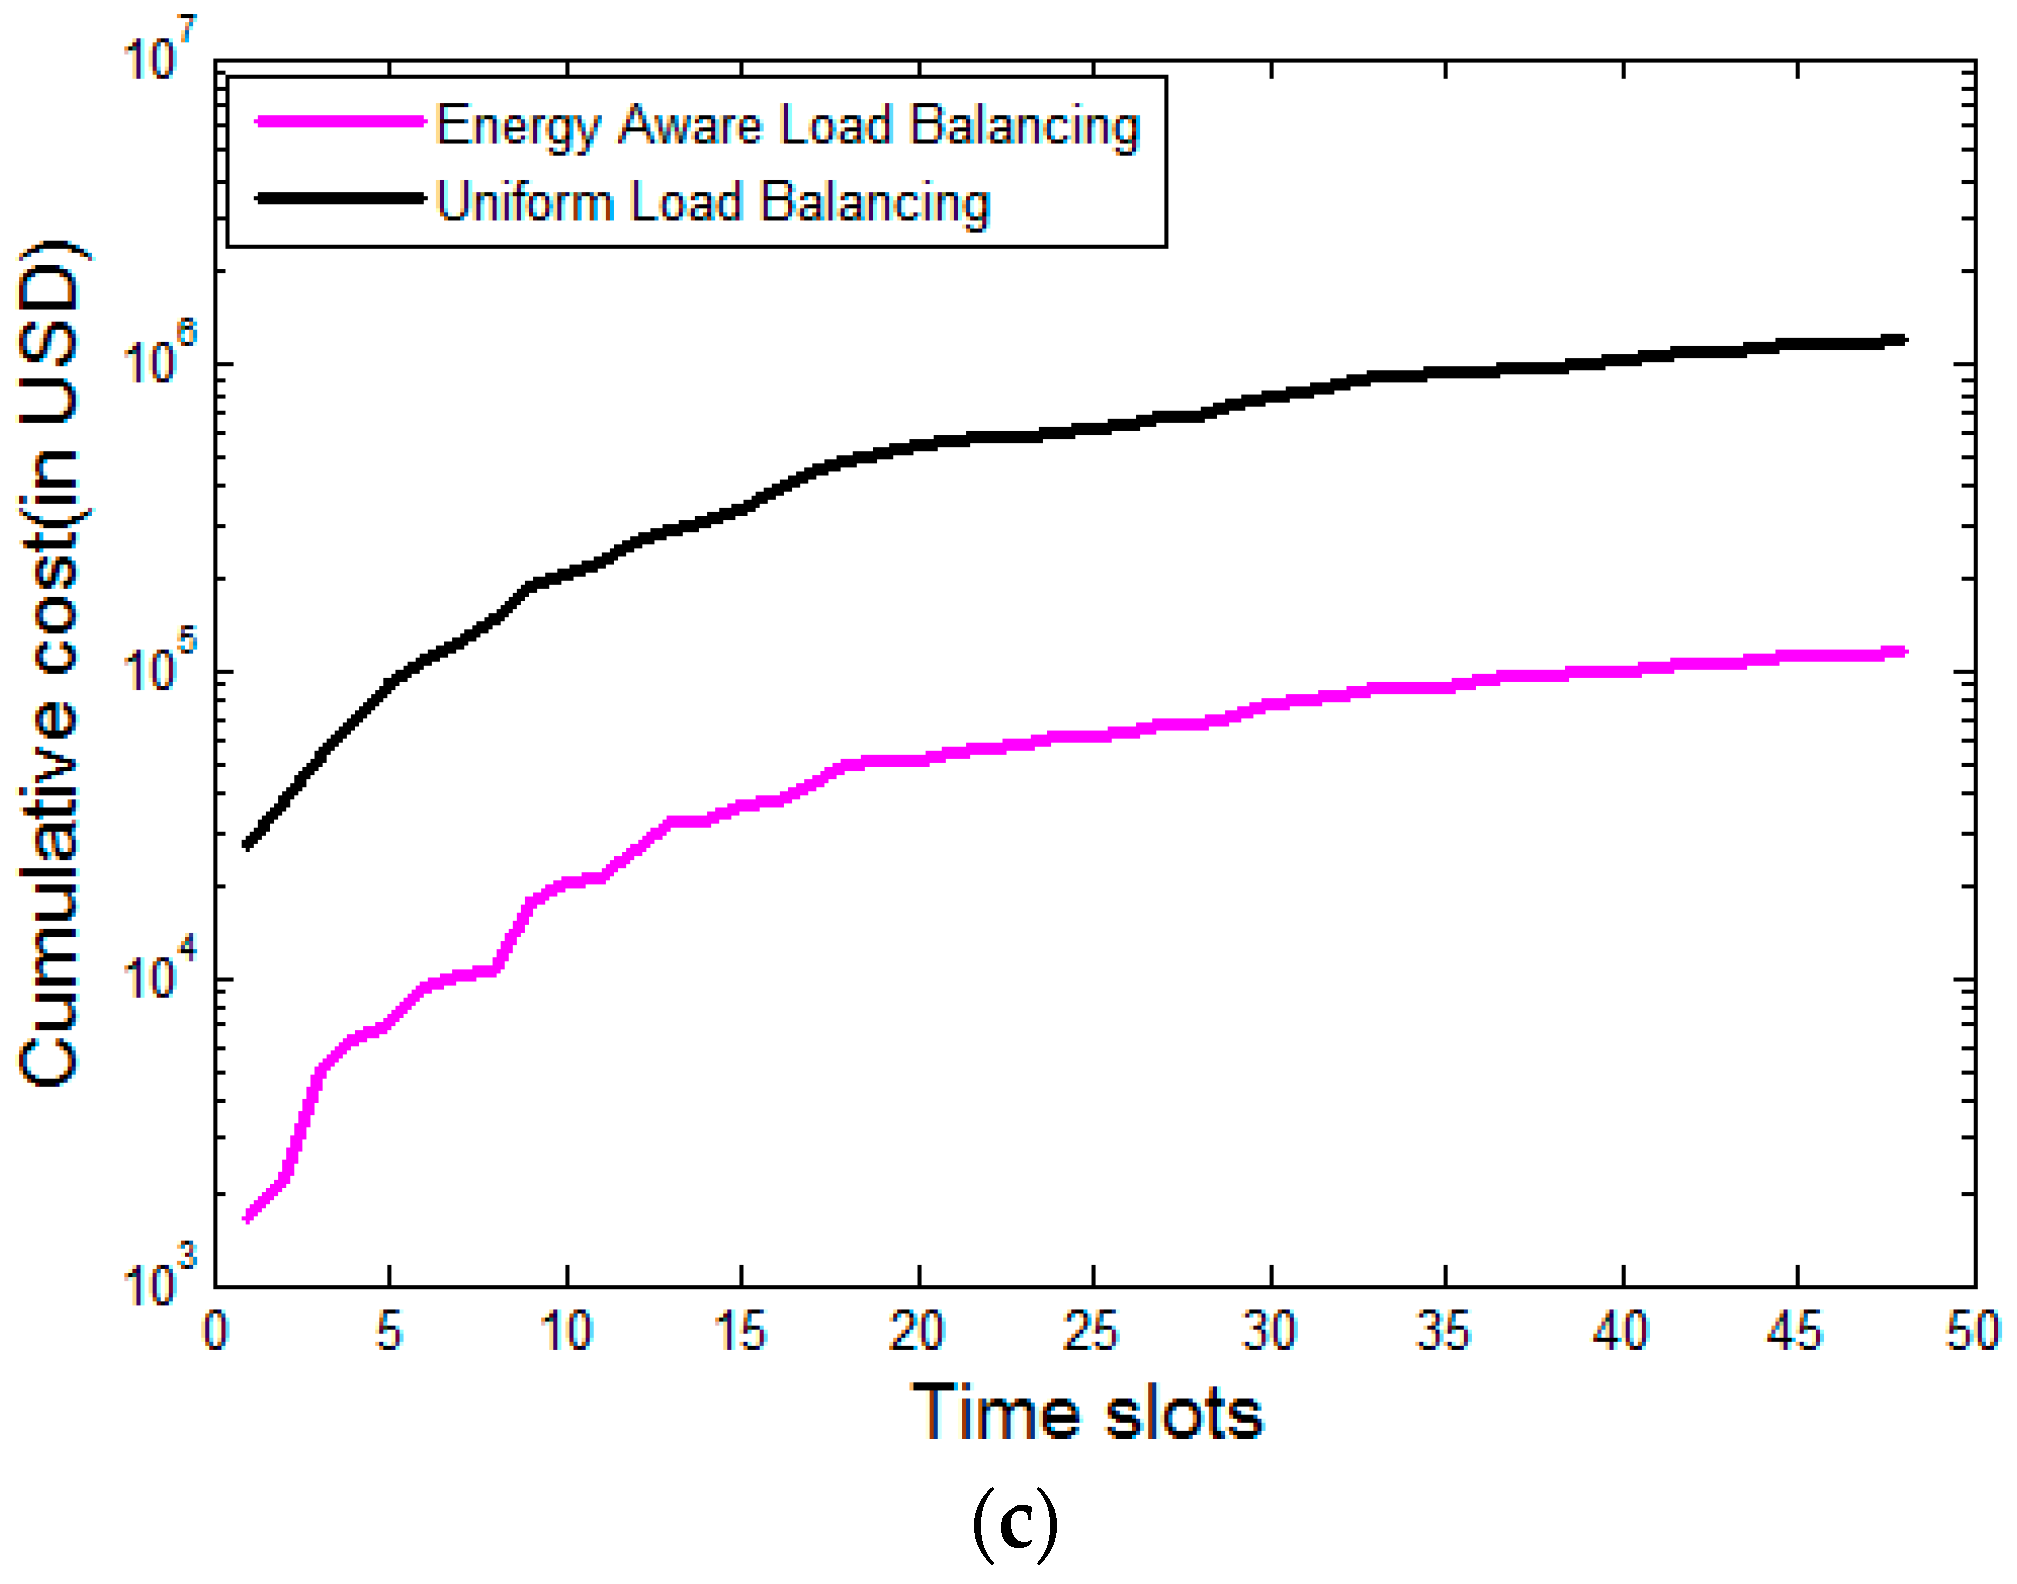
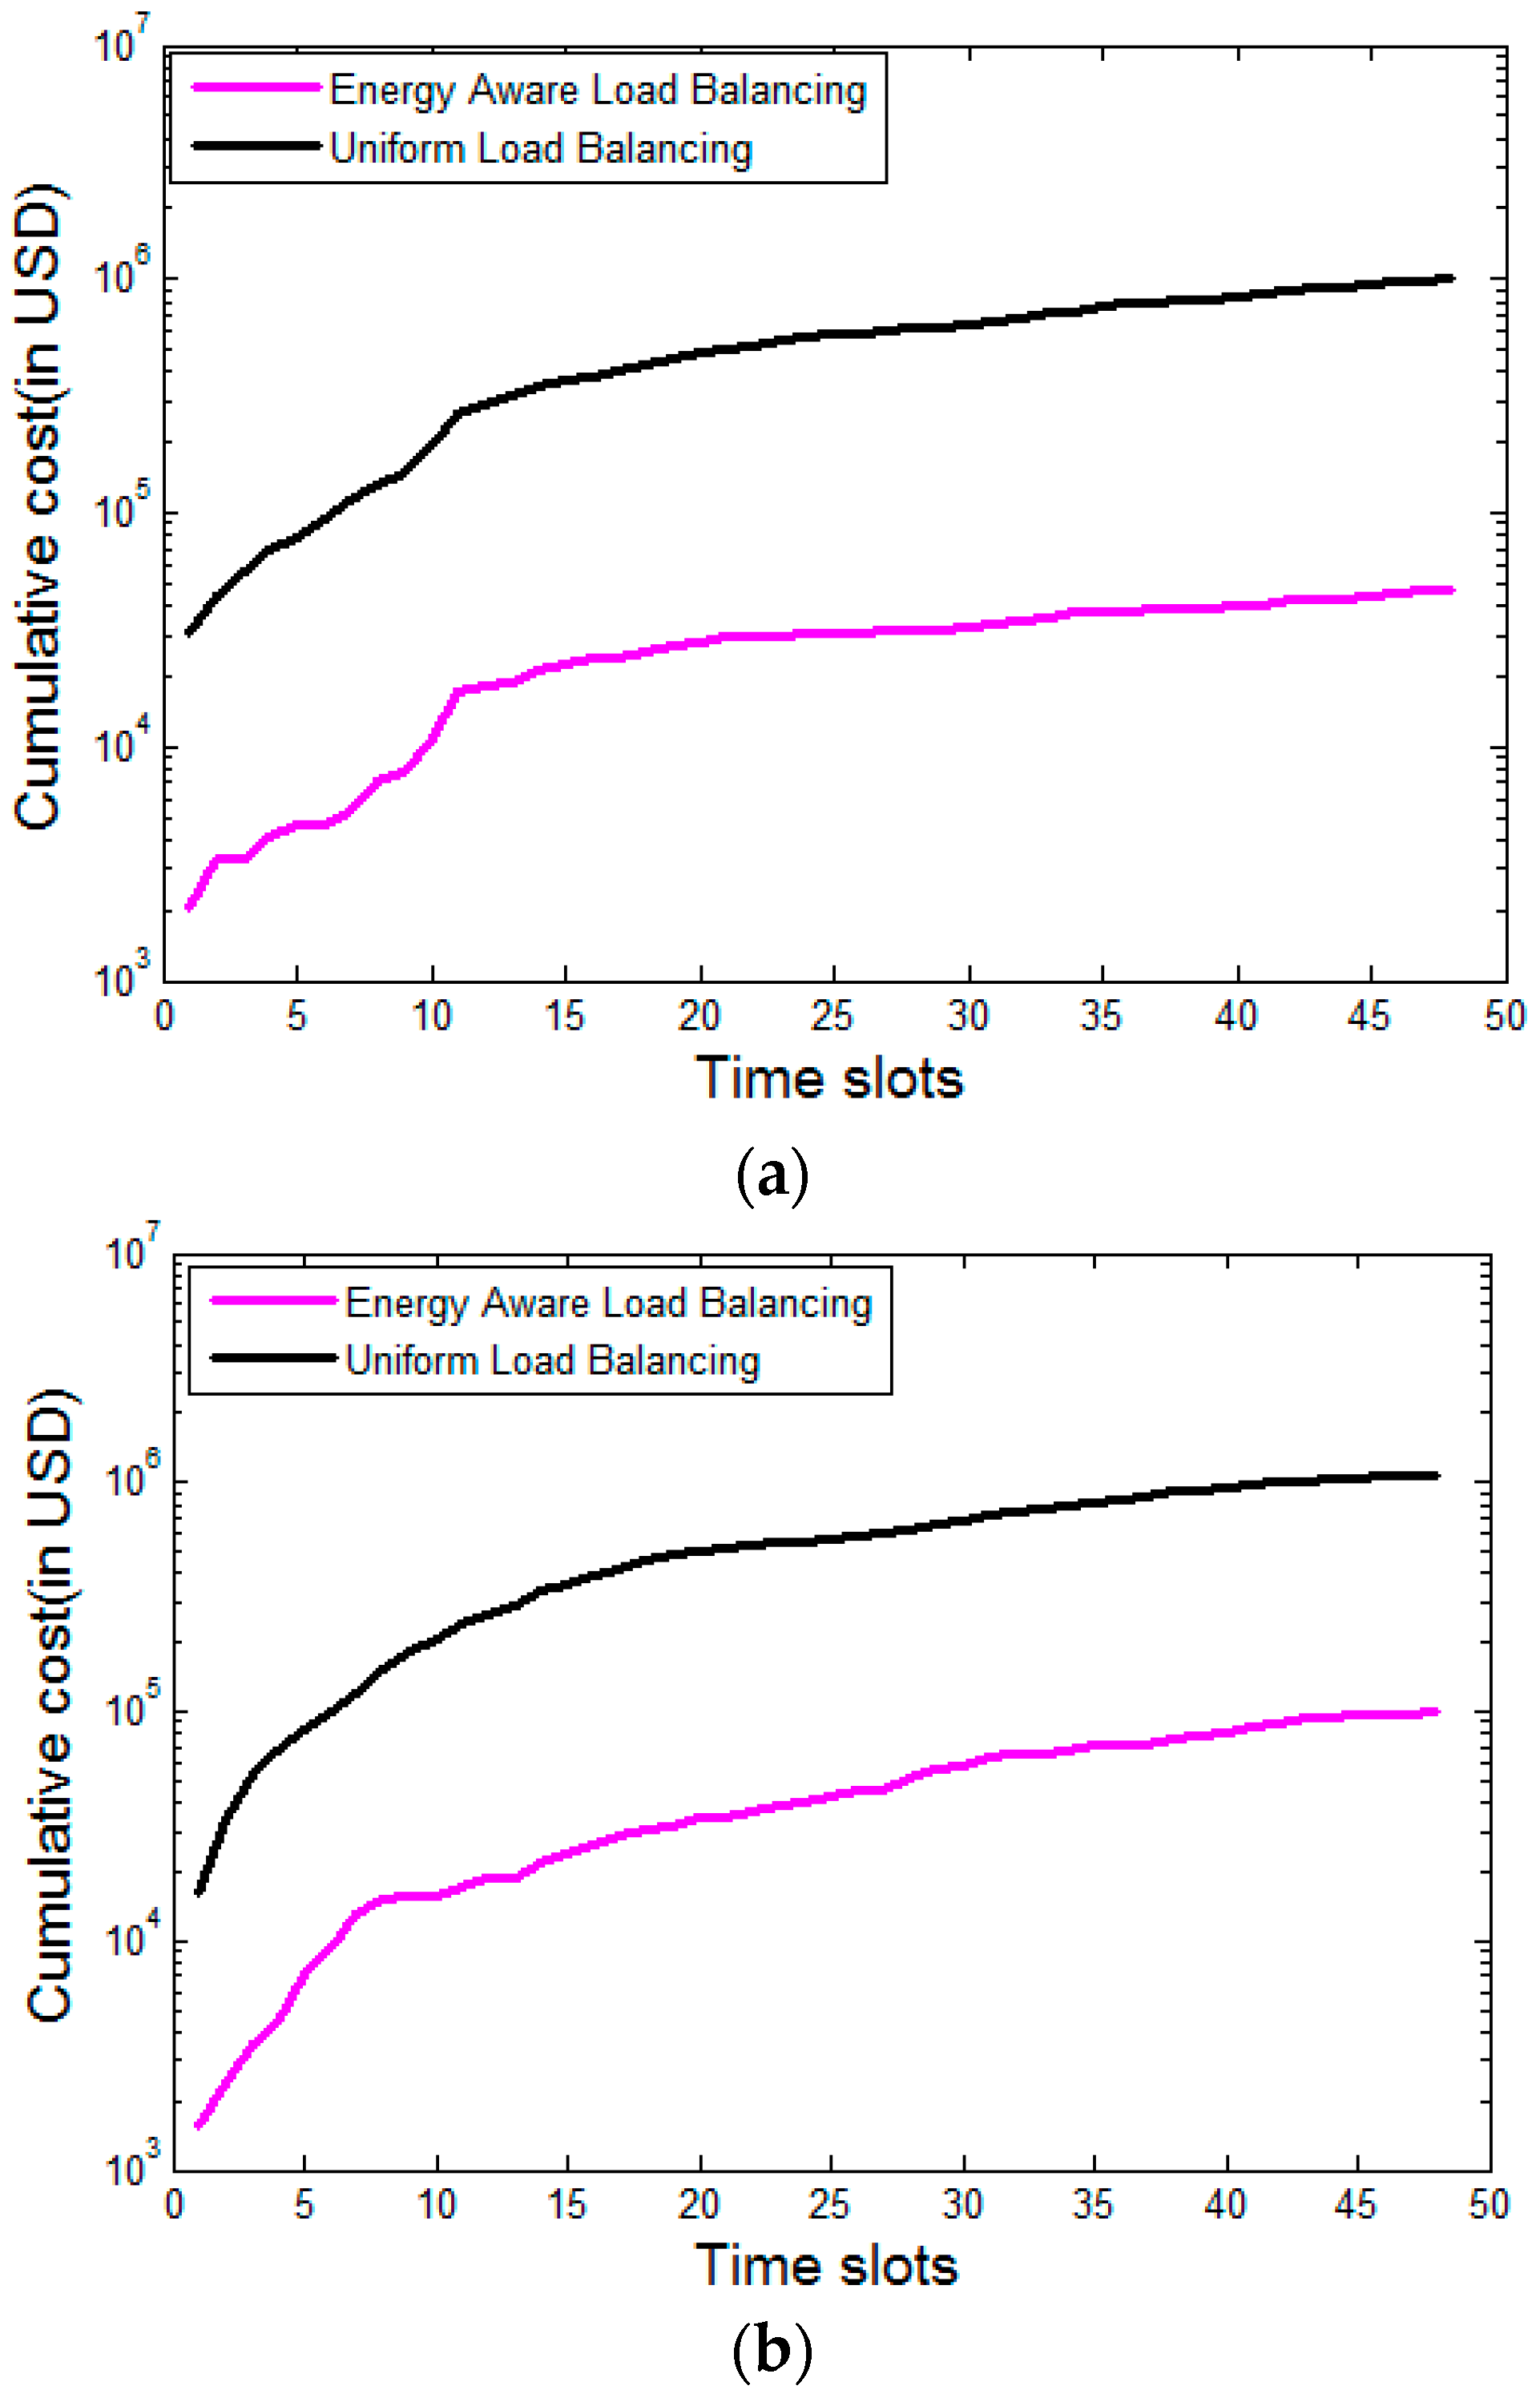
To compare the effectiveness of the optimization procedure proposed in
Section 2, we compare it with uniform load balancing among the IaaS providers.
Figure 7 given below shows that the proposed energy and renewable aware load distribution strategy significantly outperforms the uniform load balancing strategy, which still exists in practice [
47]. This uniform load balancing strategy serves as a reasonable baseline policy with respect to which comparisons are carried out [
25]. For better visibility, the
y-axis is in logarithmic scale.
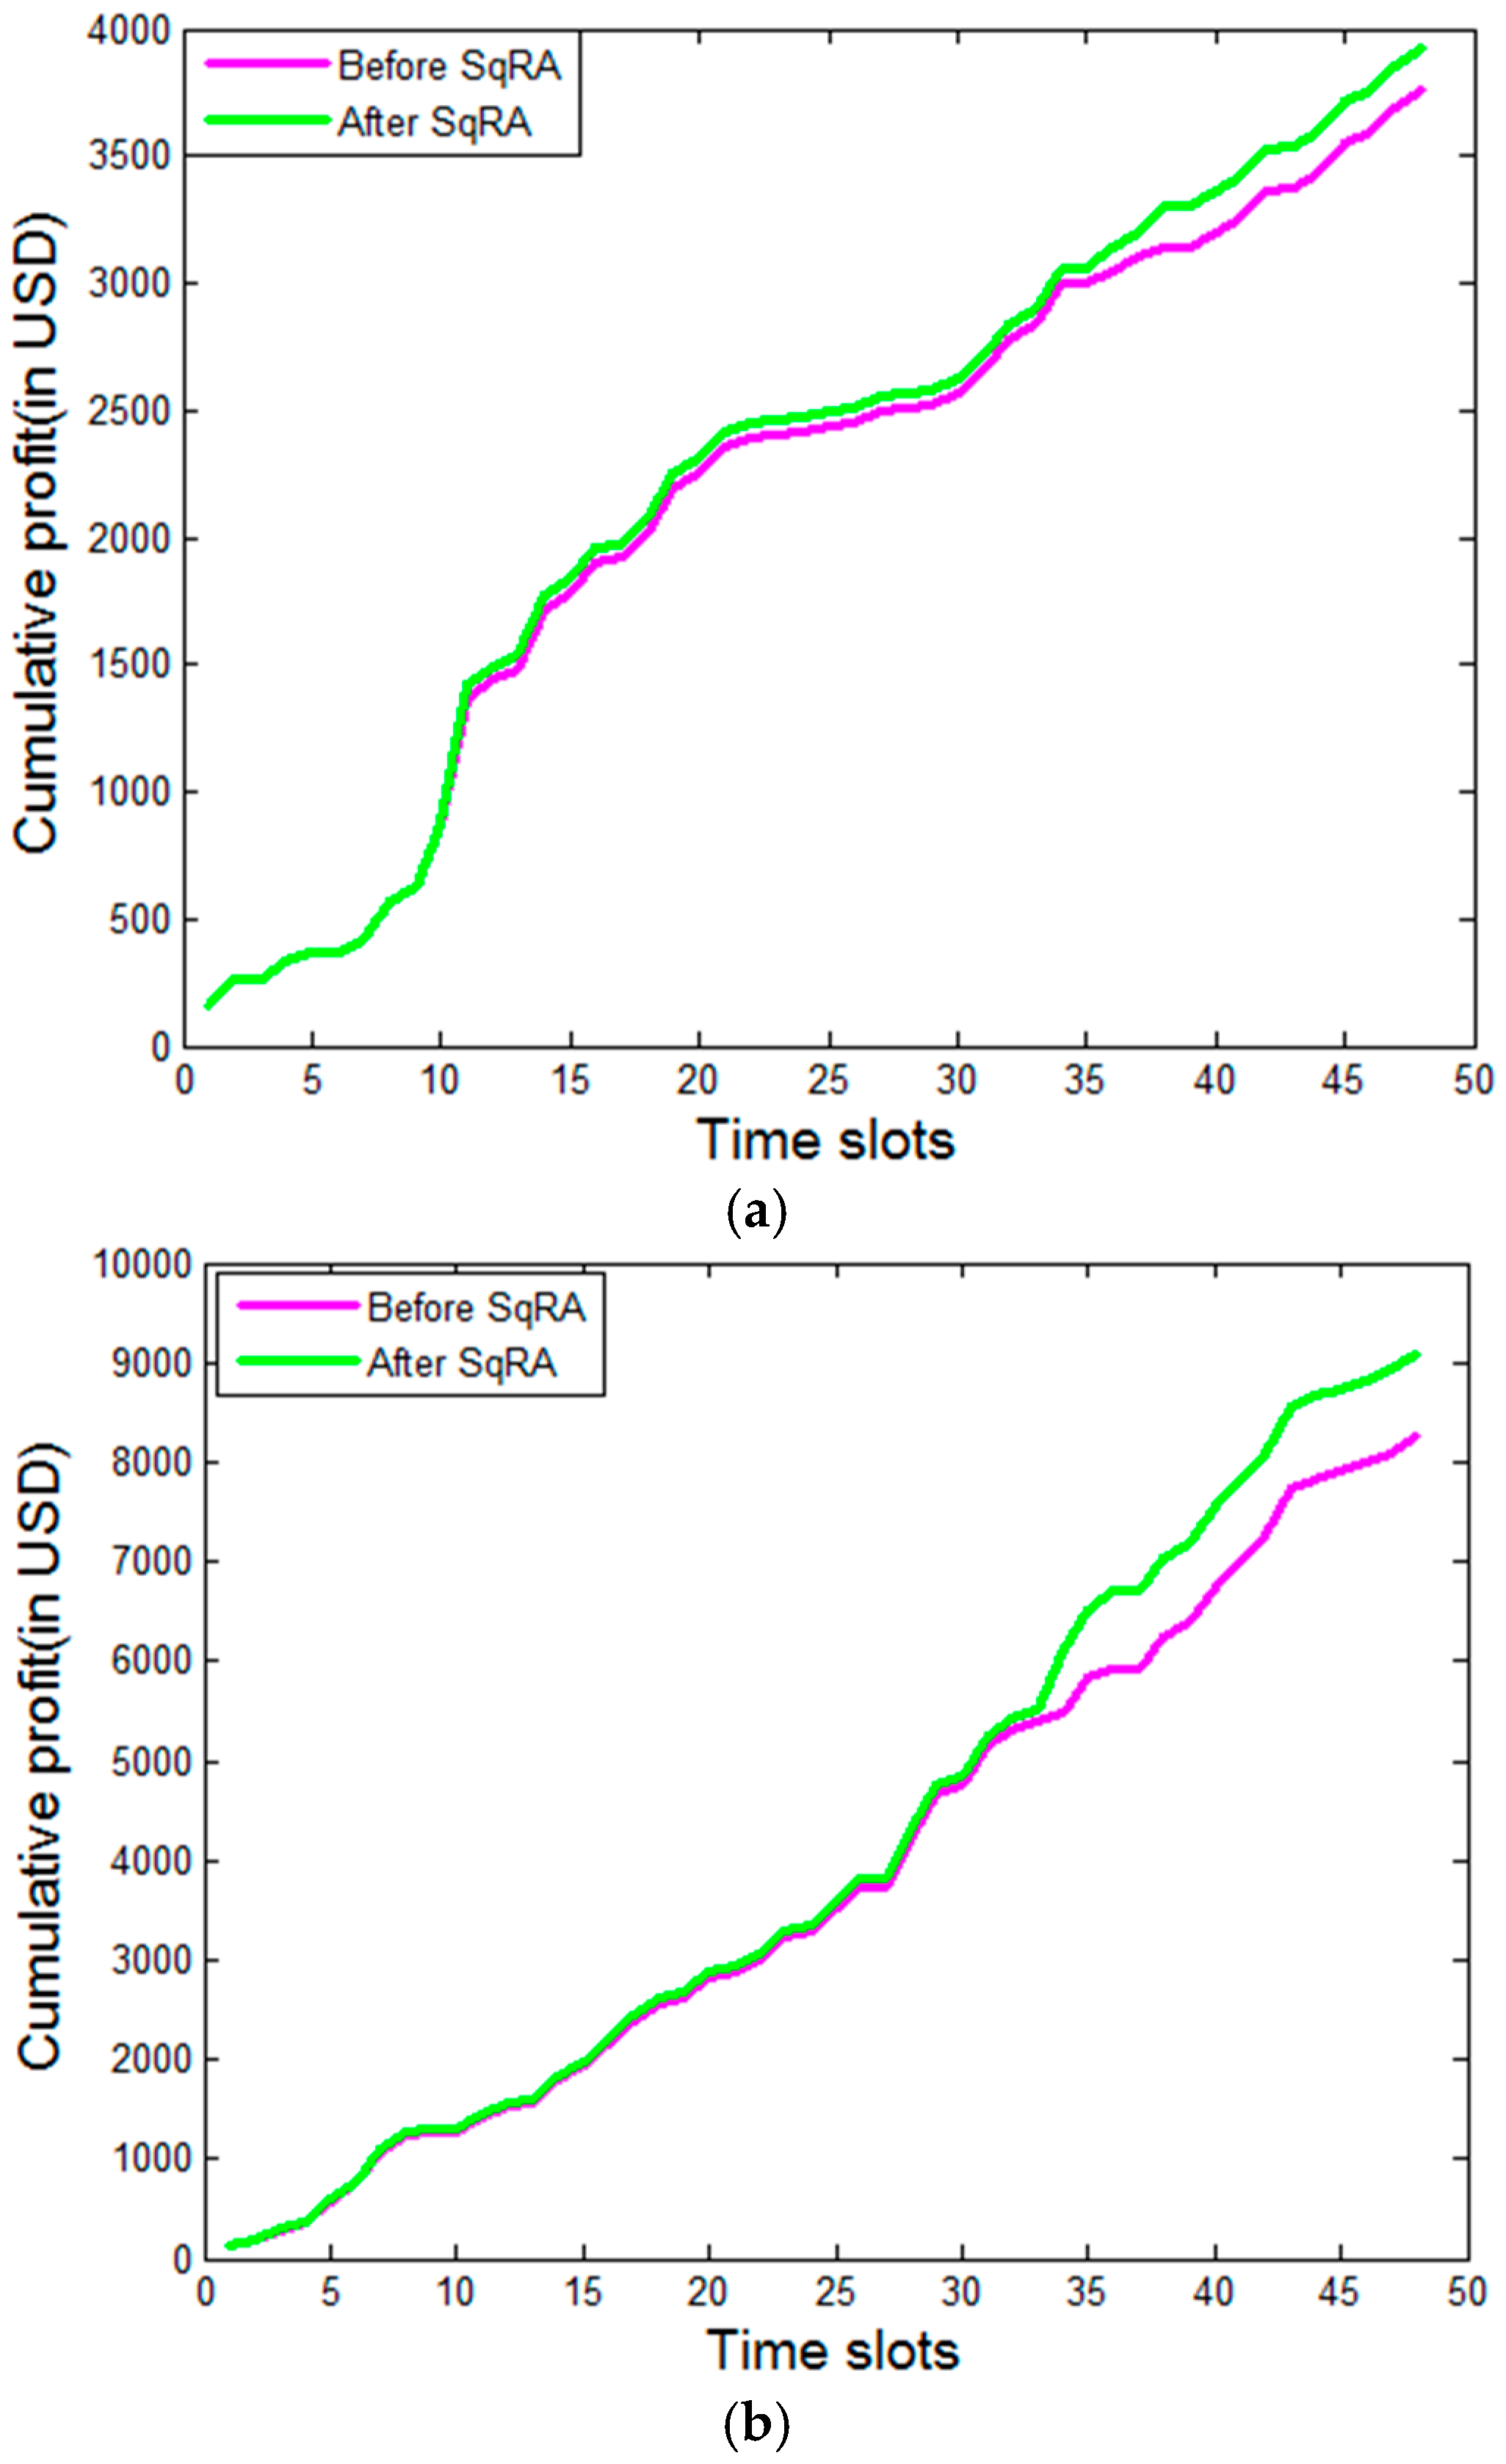
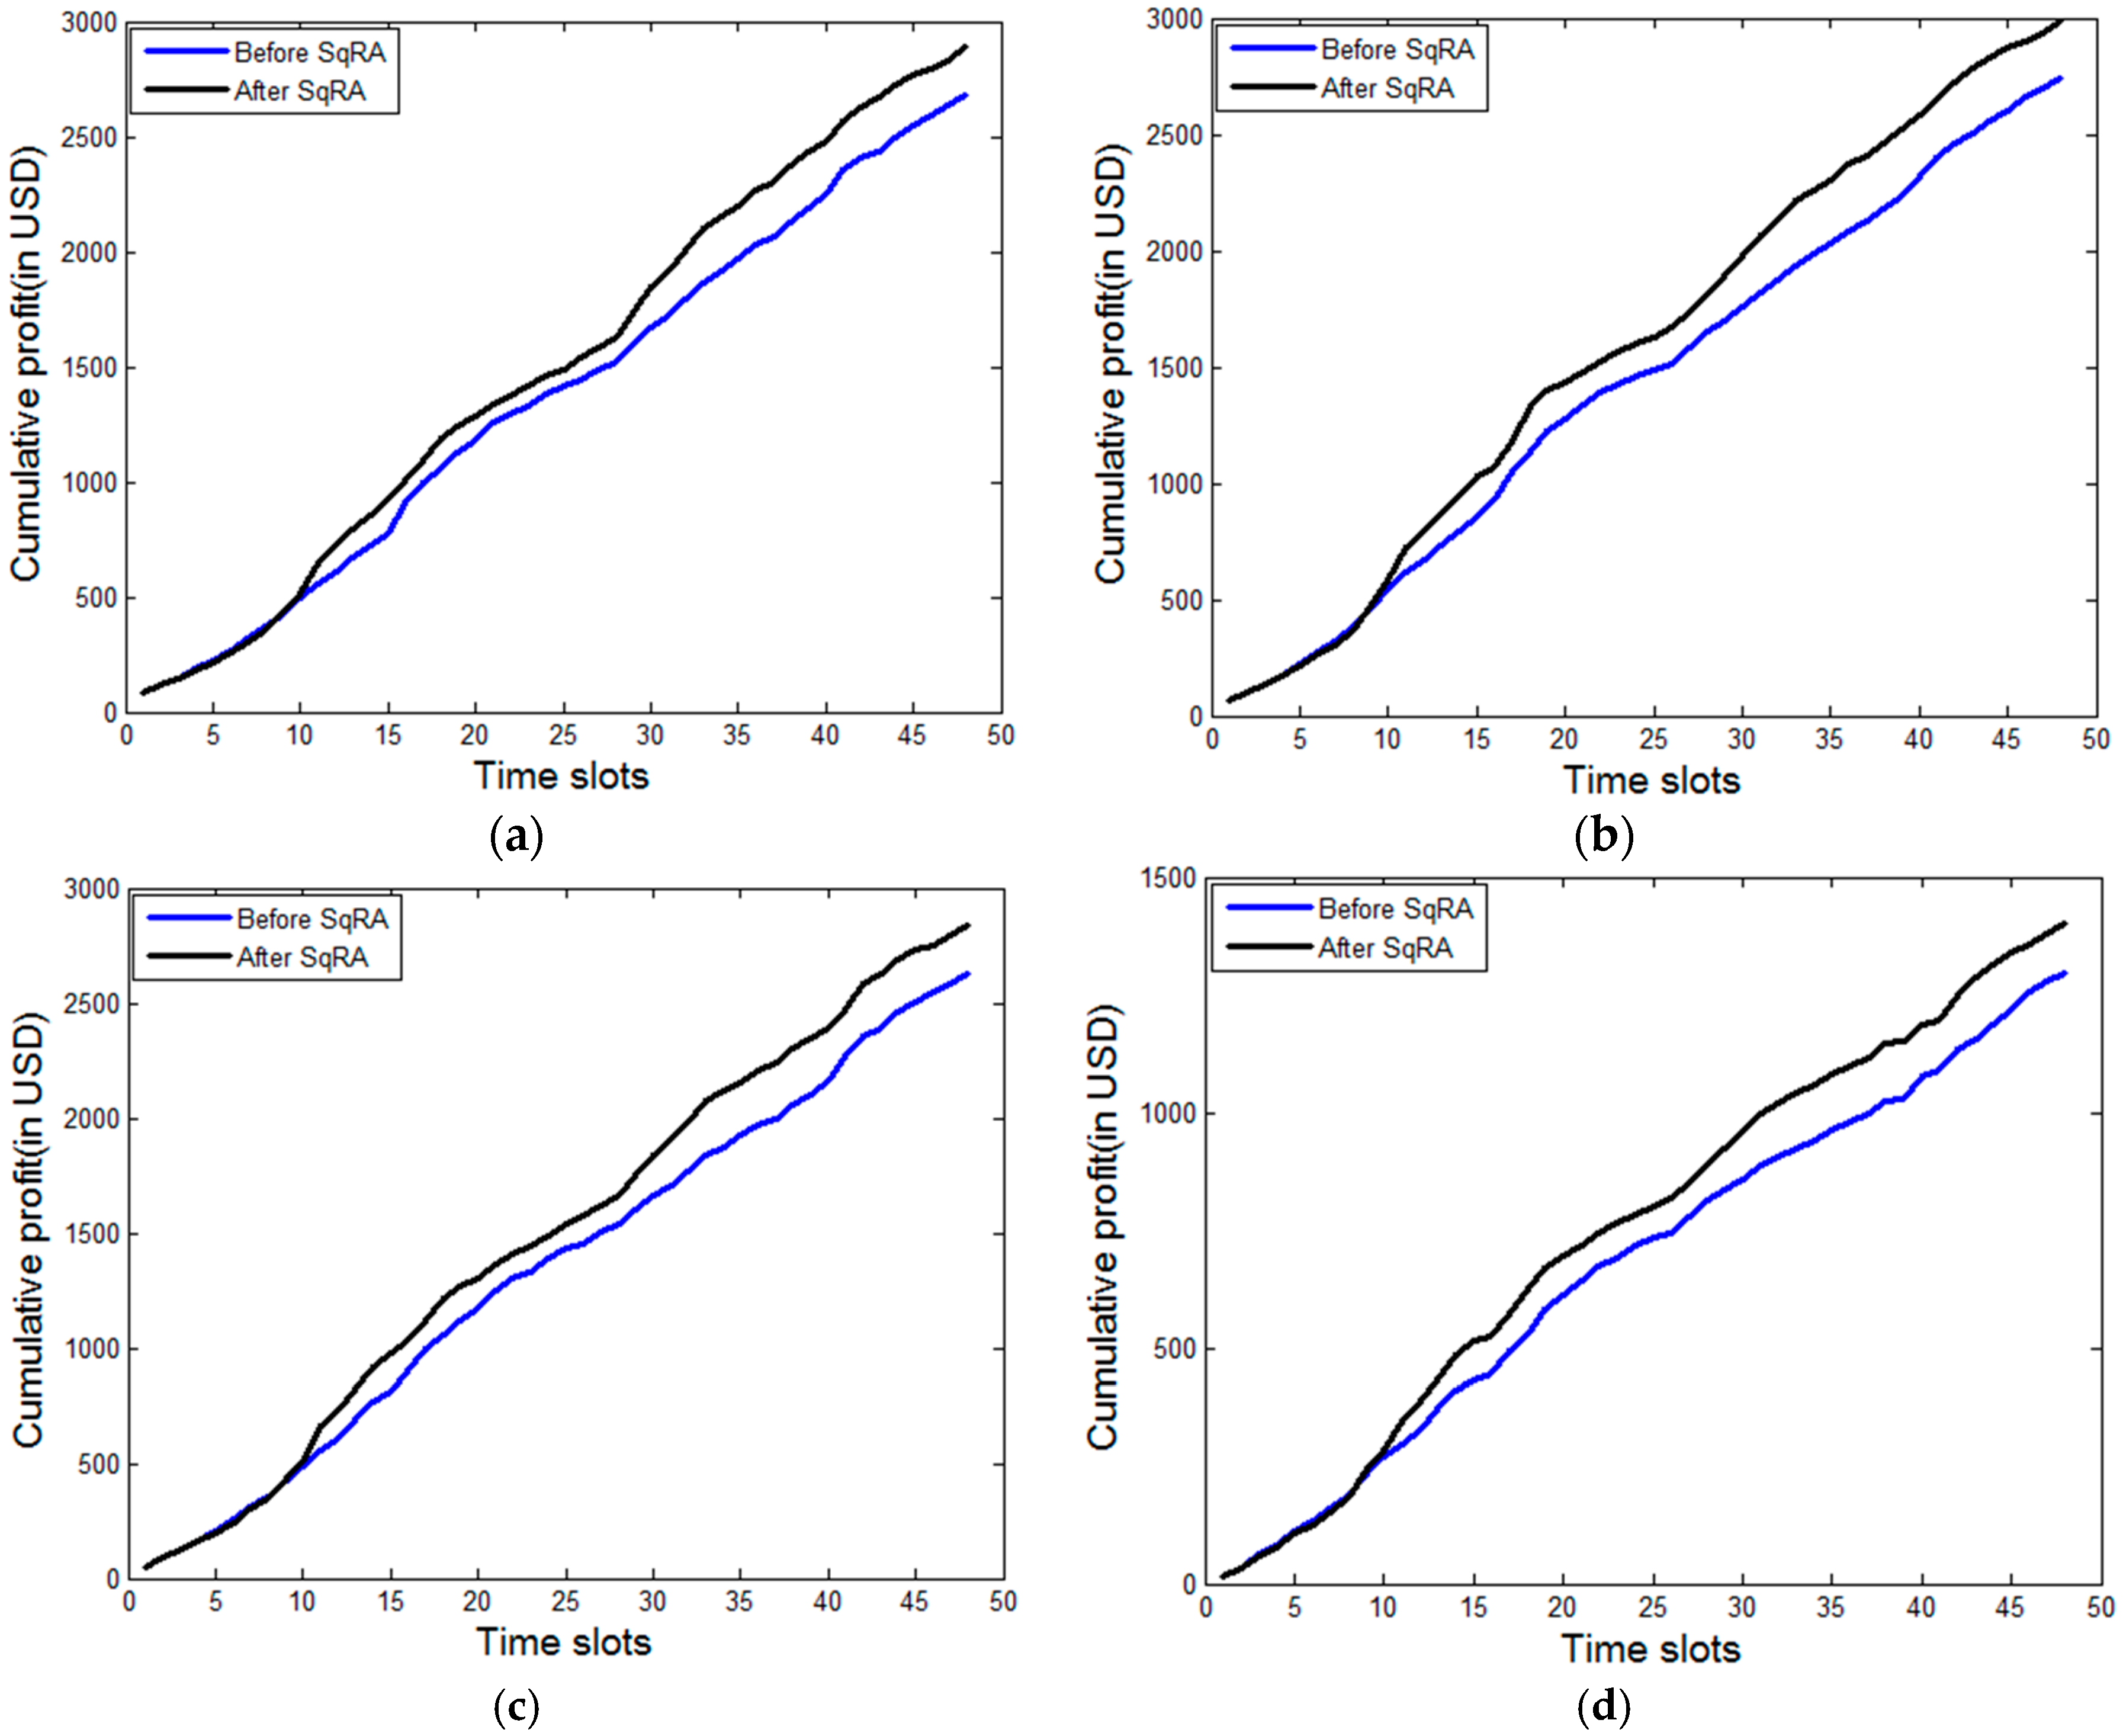
We now present and discuss next the results in terms of the increase in profit experienced by the IaaS providers and the SaaS providers after providing servers as per the strategy presented in
Section 2.
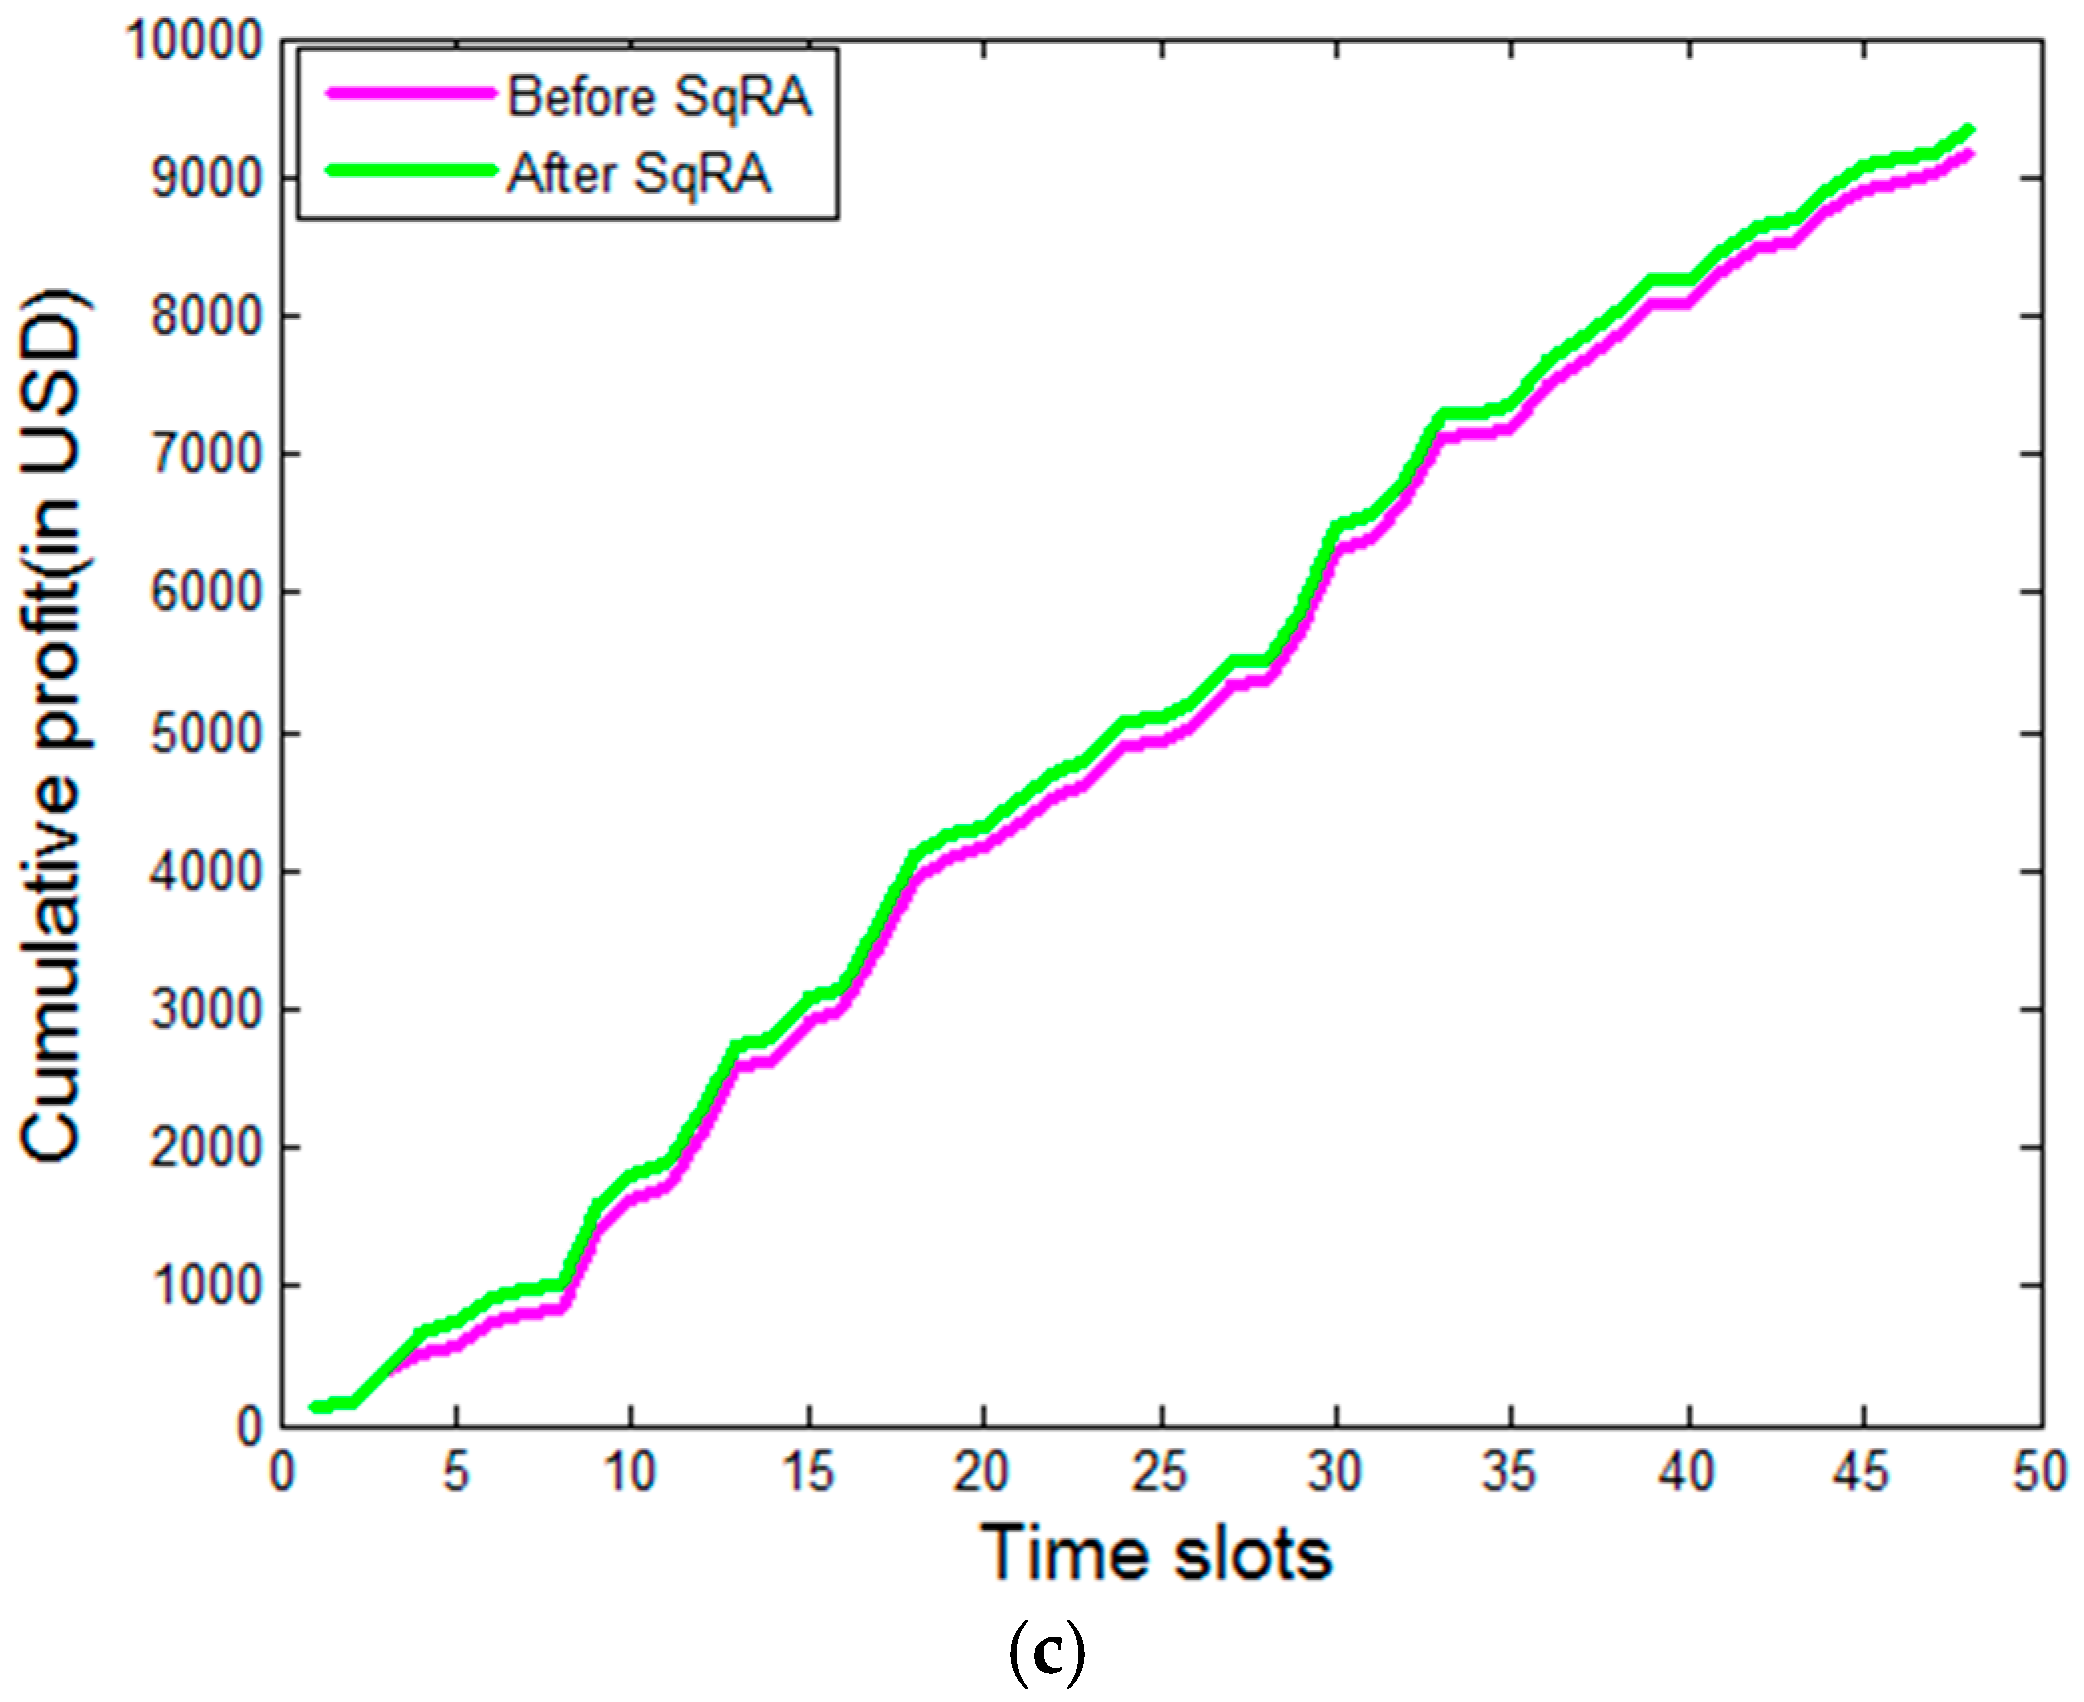
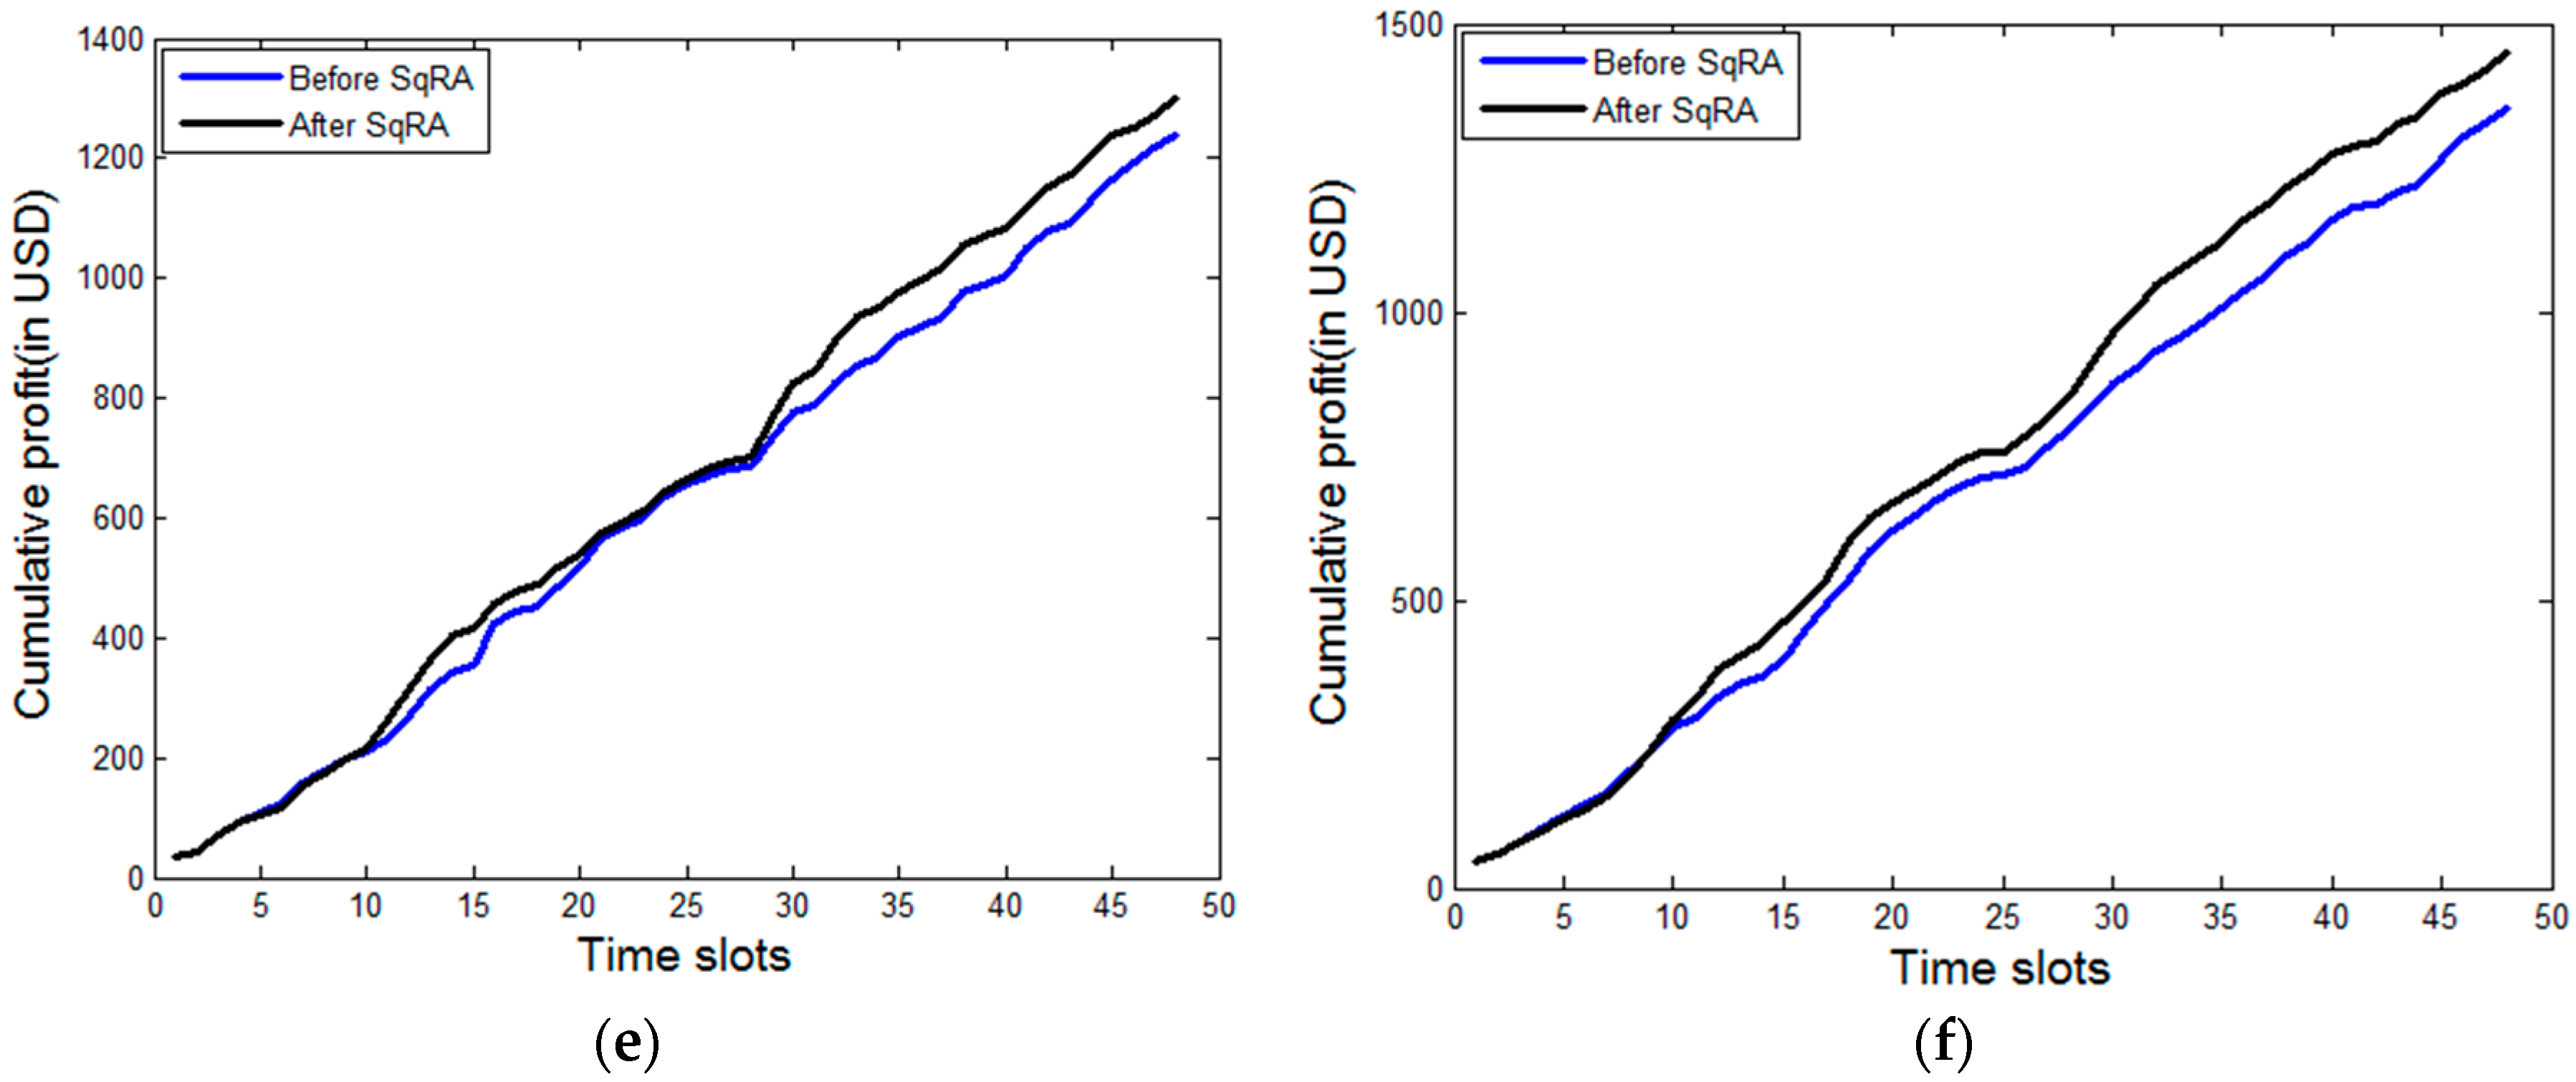
Figure 8 presents the profit earned by the three IaaS providers in the market, before and after the implementation of the proposed SqRA. Similarly,
Figure 9 given below presents the profit earned by the SaaS providers (six of them), before and after implementation of SqRA.
Table 3 and
Table 4 given above present the percentage increase in the profit earned after implementation of SqRA for all the IaaS providers and SaaS providers, respectively. It is observed that after the application of the SqRA strategy, the profit for all the entities has increased. It may be noted that this reflects the price paid by the customers in exchange for superior QoS. The extra cost for SqRA is incurred by the IaaS providers and recovered from the SaaS providers. This is subsequently recovered from the end customers. Although the improvements are not very huge, we believe that our work will open up new directions of future research endeavors, which should drive significant innovations in the development of energy efficient pricing strategies for the cloud service market.


