Abstract
Microgrids of varying size and applications are regarded as a key feature of modernizing the power system. The protection of those systems, however, has become a major challenge and a popular research topic because it involves greater complexity than traditional distribution systems. This paper addresses this issue through a novel approach which utilizes detailed analysis of current and voltage waveforms through windowed fast Fourier and wavelet transforms. The fault detection scheme involves bagged decision trees which use input features extracted from the signal processing stage which are selected by correlation analysis. The technique was tested on a microgrid model developed using PSCAD/EMTDS, which is inspired from an operational microgrid in Goldwind Science Technology Co. Ltd., in Beijing, China. The results showed a great level of effectiveness to accurately identify faults from other non-fault disturbances, precisely locating the fault and trigger opening of the right circuit breaker/s under different operation modes, fault resistances, and other system disturbances.
1. Introduction
Though there is little variation in the way microgrids are defined in the literature, microgrids can arguably be defined as groups of interconnected distributed energy resources (DERs) and loads at distribution level with a specified electrical boundary and functionality to operate both in parallel with the utility grid and in island. The deployment of microgrids is gaining momentum over recent years. There are a range of factors contributing for growing acceptance of microgrids in different parts of the world. In areas without access to electricity from the grid, microgrid appears to be the only feasible option. However, the need for microgrids is not just limited to geographically isolated areas. The increased demand for power supply reliability and the susceptibility of large grids to blackouts and short term interruptions related to natural disasters or other lower magnitude technical and natural events has contributed to the microgrid becoming a popular choice in already electrified areas. There is a way of thinking gaining more ground in recently that complex and bulky power grids will be modified into an aggregation of smaller microgrids. Microgrids ensure higher reliability for customers providing supply availability during grid outages as well as higher flexibility in ways to produce and utilize electricity.
As universal as the acceptance and interest in microgrids, there are a few critical technical challenges to practicing the technology. One of those critical challenges is the protection of the microgrid. Bidirectional current flow, varying fault current levels, continuous variations in system arrangement and mode of operation, and the largely fluctuating nature of renewable DERs contribute to the complexity of microgrid protection and the need for advanced techniques. This paper addresses this issue by recommending and testing an effective technique of detecting faults in a microgrid that can satisfy the required selectivity and reliability of a protection system.
The major challenges regarding the protection of microgrids arise from the construction features of a microgrid, which involve large scale presence of converter type DERs and the possibility of two way power flow. That is to be added to the low inertia of the systems especially in the island mode of operation. This makes microgrids easily susceptible to instability due to changes in load and generation. The issue of less stable generation is a more common phenomenon as it is customary for microgrids to be dominated by renewable sources which have an intermittent nature. Such conditions make the protection of microgrids a challenging task by causing:
- -
- A varying magnitude of fault current based on the mode of operation and changes in configuration
- -
- Low fault current in island mode
- -
- Multiple fault sources and bidirectional current flow
Overcurrent protection through the utilization of simple overcurrent relays and/or fuses was a common practice in traditional low voltage distribution systems. However, such traditional current magnitude based protection has been proved to lack the effectiveness demanded in today’s distribution systems involving distributed generation and microgrids [1,2].
The challenges in the protection of microgrids, due to their special nature, have attracted researchers and scientists to work on and suggest different strategies. Some of the recommended techniques include park transformation [3,4], adding fault current source [3], artificial neural networks [4] and voltage restrained overcurrent relaying [3], magnitude and angle of the superimposed negative and positive sequence current [5] or impedance [1], harmonic distortion based methods [3], and techniques involving wavelet transform [4]. A detailed review on the different fault diagnosis tools in the literature is available in [6].
One of the techniques used to achieve the required level of reliability in the protection of microgrids requires using different type of signal analysis tools to transform the voltage or current signals to features which can be used to identify faults. Some of such transforms applied in microgrid protection studies are park (abc to dq0) transformation, Fourier transform (DFT and FFT), wavelet transform (WT) and Hilbert–Huang transform (HHT).
Another study [4], the authors employed an approach incorporating abc–dq0 transformation of three-phase current, filtering the dq0 components through the wavelet transformation to detect faults using the finite difference between samples of the filtered signal. It was reported that the procedure was effective to detect high impedance faults. In another study [7], the authors proposed a two stage protection scheme where the type of the fault is identified by monitoring the drop in amplitude of the fundamental component of the voltage signal and the fault is later located, by calculating the total harmonic distortion (THD). The paper recommended the applicability of the protection scheme as a backup, or that it be complementary to the main protection devices, referring to the potential malfunctioning in case of a network comprising of several dynamic loads. The authors of [8] used a wavelet transformation with dq0 decomposition to extract the high frequency details for fault location and isolation. The use of a park transform is claimed to be an effort to reduce the computation time. The fault detection and location are both done by comparing the calculated parameters with a pre-set threshold which would influence the performance of the scheme under variations in configuration. While another study on time-frequency-based differential scheme through S-transform by [9] reported that the method can reliably protect the microgrid against different faults, [10] argues that the HHT based technique demonstrated an even better performance compared to that of the S-transform.
Most of the studies applying signal processing tools examined the effectiveness of using the transforms individually or in comparison with each other. The option of utilizing the transforms in parallel where effective is not covered in much depth. The other gap in the literature is the trend to keep using a predefined threshold to judge the occurrence of faults. Though the use of the transforms is an advancement to the traditional magnitude-only based approaches, the use of pre-decided threshold values is not convenient for microgrids where the fault current, and hence, the transformed parameters would significantly vary based on configuration and weather conditions in the case of renewables. Using adaptive setting values is recommended in some cases, while the need for sophisticated communication and the delay in online calculation of setting values are the bottlenecks for such an approach.
One option, which compromises between the use of a fixed, pre-defined threshold, and communication based adaptive settings, involves soft computing approaches where the judgment on fault occurrence is decided from past experience through a somewhat ‘black box’ model. Some of the soft computing approaches investigated in microgrid protection studies are deep neural networks [11], Support vector Machines (SVM) [12], Adaptive Neuro-Fuzzy inference systems (ANFIS) [11,12], and decision trees [13,14,15,16].
Decision tree based data-mining models are employed in [15,16]. The authors of [16] used discrete Fourier transform to preprocess the faulted current and voltage signals, while the authors of [15] used Wavelet transform for the same purpose. Both papers reported achieving effective protection of the microgrid against faulty situations through their respective schemes. The authors of [13] used a protection scheme involving the Hilbert Space-Based Power (HSBP) algorithm as a primary protection and THD as backup protection, and used a ANFIS based decision maker to decide circuit breaker action. There are some recent studies on applying soft computing techniques with wavelet and Fourier transform in the protection of microgrids. The option of combining wavelet transform and decision tree methods was tested in [15]. The authors reported satisfying results in detecting and locating faults under variations in operating conditions by making use of the decision tree trained using wavelet transform based features of the current signals. The authors of [11] recently attempted to make use of the Discrete Wavelet transform (DWT) and deep learning algorithm in the form of gated recurrent units (GRUs) to address the protection of microgrids. The paper utilized the time frequency domain features of the branch currents extracted through DWT given as inputs for three deep neural networks. They stated that they validated the fault detection mechanism’s performance in providing accurate and timely fault type, phase, and location information.
Most of the studies on microgrid protection revolve around DC microgrids, though there are a small number of studies on AC microgrids as well. There are gaps in the available studies targeting AC microgrids in terms of the signal processing as well as incorporating the bagged decision tree algorithm. Although the use of soft computing techniques, together with signal analysis tools, have been seen to greatly improve the accuracy in detection and identification of faults in some of the studies, they either lack the comprehensiveness in incorporating both voltage and current measurements or the signal processing tools such as WT and FFT. The methods that solely depend on current measurements suffer from possible current transformer saturation. Those involving only one of the WT and FFT signal processing tools would miss the feature of frequency or time resolution from using either method, both of which are of great importance in fault detection. The single decision tree based fault detection techniques are limited in capacity in order to entertain a large number of input features. Most of the studies are also seen to recommend extremely theoretical schemes, which are too far from the state-of-art industrial protection schemes. In this study, improving the well-known differential, directional, and overcurrent protection schemes through the use of signal processing tools and bagged decision trees is investigated.
Operation under different conditions was investigated by applying small and large changes in generation and loads, all kinds of faults were detected at each branch of the microgrid in both grid-connected and island modes of operation. The effectiveness of the suggested scheme for solid and high impedance faults is also examined by applying faults of different fault resistances. The devised approach was tested on a test microgrid consisting of multiple converter-type DERs, which were modeled using PSCAD4.6. The model microgrid is inspired by an operational microgrid in Goldwind Science & Technology Co. Ltd. in Beijing, China. Current and voltage waveforms were recorded and transferred to a MATLAB R2017b environment for further analysis to make judgments about the occurrence and location of faults. The protection scheme involves extracting the features for fault detection from the current and voltage records through windowed fast Fourier transform (WFFT) and windowed wavelet transform (WWT). The extracted features from WWT are the change in magnitude of the approximation (ΔEa) and detail components (ΔEdn) and the change in number of peak values of wavelet coefficients (ΔNp). Changes in the magnitude of individual harmonic components (ΔHn) and phase angles of the fundamental frequency components (Ang) were calculated from the WFFT analysis. After the most important features were selected from a candidate list of features through correlation analysis, bagged decision trees were trained and tested for detecting faults at the different zones (components) of the test microgrid.
The devised protection scheme was tested and achieved the intended target of sensitive and selective operation without compromising the reliability of the system. It was able to accurately identify the different faults from each other and other abnormal operating conditions that should not necessitate the tripping of a circuit breaker. It was superior to the conventional overcurrent, directional, and differential protections due to its higher sensitivity and accuracy in detecting and locating the faults. It also has the edge over adaptive relaying as it makes use of local measurements and avoids the need for communication and delayed calculation to frequently modify the relay settings.
2. Materials and Methods
The methodology applied in this paper is summarized in Figure 1. The first task is modeling the microgrid to be studied using a PSCAD/EMTDS environment. The microgrid system was inspired from an actual microgrid in Goldwind Science Technology Co. Ltd. in Beijing, China. The architecture and system components are described in more detail in the next sections. Different sets of faults and other disturbances were applied to the system for training and testing. The branch currents and bus voltages were recorded in PSCAD and the data was transferred to MATLAB for the next step of the study where the fault detection analysis is performed. This required transferring the file from the COMTRADE format, which was saved using PSCAD, to a MATLAB matrix file. The recorded voltage and current signals were first preprocessed using the two signal analysis tools, WT and FFT, over a moving window of length matching the period of the fundamental (0.02 s or 20 time steps based of 1000 μs sampling step). Afterwards, the candidate features (ΔEa, ΔEdn, ΔNp, ΔHn, and Ang) were calculated. The need for signal processing tools was further verified, and where to use which features was decided through a correlation analysis stage. In this stage, correlation of all candidate features with the target parameters (state of breaker) was computed. The most important features were then selected and used as input to train the bagged decision trees for the detection of faults in the different zones (components) of the test microgrid.
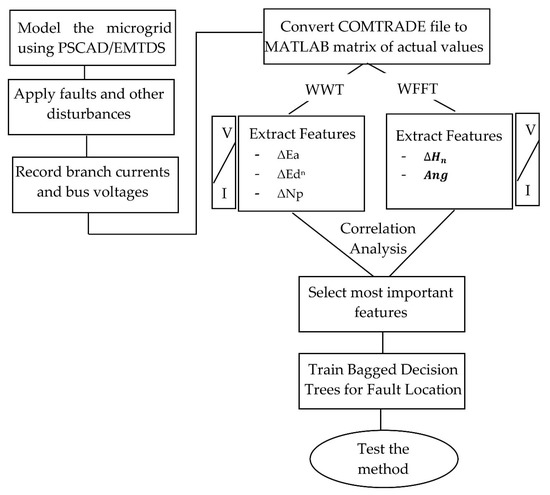
Figure 1.
Summary of methodology of the study.
2.1. Simulation Model of Test Microgrid
A non-isolated microgrid model consisting of two converter based DERs and two loads connected in an arrangement, as shown in the single line diagram in Figure 2, was developed using PSCAD/EMTDS software. The two DERs comprise solid-state converters, and the architecture of the converter topology employed in both sources is shown in Figure 3. The presence of solid-state converters is a critical issue in the analysis of protection of microgrids, for the reason that the current that can be supplied through such converter based DERs is mostly limited to a maximum of twice the rated current. This limits the fault current amount which intern causes sensitivity issues in the protection of microgrids.
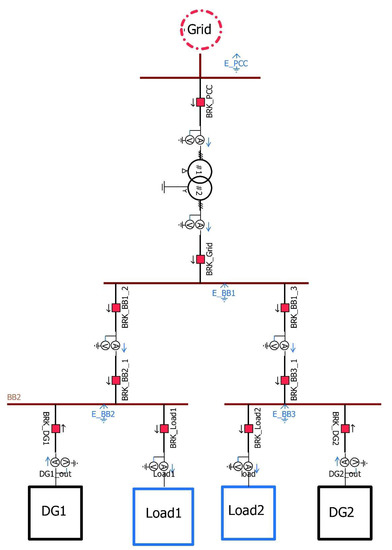
Figure 2.
Microgrid test model in PSCAD/EMTDS.
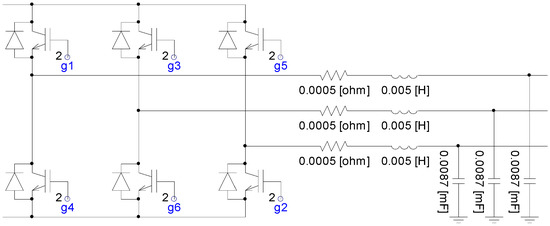
Figure 3.
Converter topology of the distributed energy resources (DERs) in the test microgrid.
Each one of the system components are connected to their respective busbars through a circuit breaker and a current transformer represented as multi-meter. The system architecture and some of the components are made to resemble the Goldwind microgrid in Beijing, China. The microgrid consists of four busbars and is connected to the grid, and thus has the capability to operate in both grid connected and island modes; both modes of operation are evaluated in the study.
The two DERs operating in PQ mode generate the amount of power specified in Table 1, under the normal reference operating case. The output active and reactive power from the DERs and the amount of power supplied to the load are varied in order to observe and record the respective changes in the current and voltage waveforms. The change in generation is implemented by varying the reference active and reactive powers in the converter control of the DERs. The PQ control circuit of the DERs’ converters consists of two cascaded loops, namely an internal current loop and an external voltage loop. The control circuit is shown in Figure 4. The hysteresis band based technique is employed to generate the gate signals of the converter.

Table 1.
System components of the test microgrid under normal reference operation.
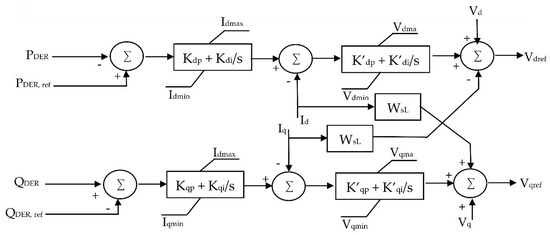
Figure 4.
Control circuit block diagram of converters of the PQ controlled DERs.
While the microgrid operates in island mode, one of the DERs (DER2) will start operating in U/f mode, thus serving as a voltage and frequency reference for the microgrid system taking the place of the grid in grid-connected mode. In this case, the possible variation in generation is simulated by changes in the other DERs (DER1). The control circuit used to control the voltage and frequency of the U/f mode DER is shown in Figure 5.
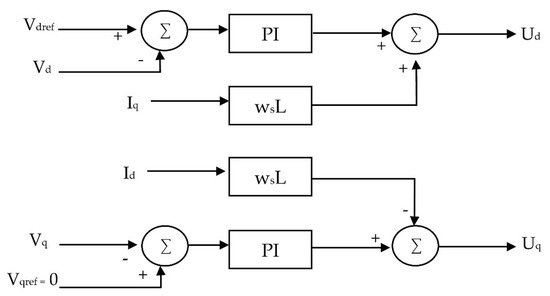
Figure 5.
Control circuit block diagram of converters of the U/f controlled DER in island mode.
The following types of faults are applied and investigated in the protection zones shown in Figure 6.
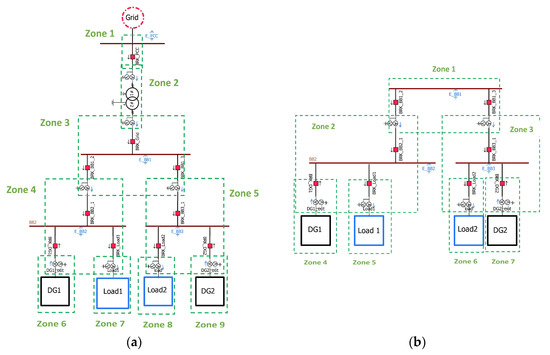
Figure 6.
Protection zones for fault analysis in case of (a) grid-connected and (b) island modes of operation.
- -
- Single Line to Ground faults (LG)
- -
- Line to Line faults (LL)
- -
- Double Line to Ground faults (LLG)
- -
- Three Phase to Ground faults (LLLG)
Both solid and high impedance faults (HIF) are studied.
This study investigates the applicability of the suggested protection scheme to effectively identify faults from non-fault abnormal conditions. This involves training and testing a model based on the recorded and transformed waveforms of the circuit reacting to the following sets of sudden changes in the system. The fault and disturbance cases shown in Table 2 are applied to the test microgrid model for training the bagged decision tree based fault detecting model. All the tests are conducted in both grid-connected and island modes of operation.
Table 2.
Faults and disturbances for training.
Table 3 shows the different fault and disturbance cases applied to the test microgrid model to test and evaluate the performance of the devised protection scheme.
Table 3.
Faults and disturbances for testing.
2.2. Signal Analysis and Features
2.2.1. Windowed Fast Fourier Transform and Derived Features
Fourier transform is a very popular technique in the analysis of signals, especially those which are periodic. Essentially, Fourier transform breaks down a signal into a combination of sine waves of different amplitudes and frequencies as mathematically expressed in Equation (1).
This, and similar studies in fault analysis, involve discrete waveforms which are recorded voltage and/or current signals of a specified sampling interval. In our case, the type of Fourier transform to be applied will be the discrete Fourier transform (DFT). DFT of a signal such as a current waveform in our case is defined by Equation (2). Fast Fourier transform (FFT) is an optimized implementation of a DFT
with less computation, but essentially the same principle as DFT. The central point behind the computation time requirements in DFT and FFT lies in the fact that DFT involves N2 arithmetic operations, while FFT needs only N log(N). This is achieved by converting the discrete Fourier transform of a sequence of N points into two discrete Fourier transforms of length N/2 each. Equation (3) expresses how this is done in FFT.
However, Fourier transform has a major drawback in its failure to provide information about the timing of change in frequencies or magnitude. The time aspect of a signal is as important, or even more important, than the feature in fault analysis studies. Hence, we have the option of using a windowed form of the Fourier transform to cover up for this gap in Fourier transform. Windowed Fourier Transform is a form of Fourier transform in which the sinusoidal wave of the Fourier transform is replaced by the product of a sinusoid and a window which is localized in time. This enables us to capture not only the frequency information, but the time information of the signal as well as shown in Figure 7. Windowed FFT is thus nothing but equivalent to a sequence of FFTs. It can be mathematically expressed as:
where g is the windowing function and the computation is performed with N FFTs.
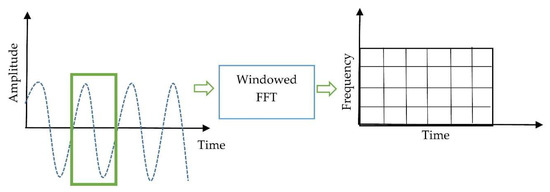
Figure 7.
Windowed Fourier transform.
Features of the voltage and current signals derived from the windowed Fourier transform are used in this study to evaluate the occurrence of a fault. These features represent the change in magnitudes of individual harmonic components of voltage and current waveforms and phase angles of the first harmonics (the fundamental component). The magnitude of nth harmonic and angle of the first harmonics in the ith window were extracted from the FFT analysis as shown in Equations (6) and (7).
The change in magnitude of nth harmonic in the ith window was calculated by subtracting the average of the magnitudes of the harmonics in the previous cycle to the magnitude of the harmonic in the ith window.
where N is the number of samples in a cycle, which in our case is 20, based on a recording time step of 1 ms.
The nth level harmonic component of the voltage signal samples in the ith window of transformation (Vn(i)) can thus be expressed as:
2.2.2. Windowed Wavelet Transform and Derived Features
Wavelet transform is a comparatively recent tool of signal analysis targeted at addressing limitations in Fourier transform by filling in the limited time resolution capability of Fourier transform. This enables the transform to keep information of both time and frequency in the signal. It is an ideal tool, particularly for the analysis of non-stationary signals such as fault current/voltage signals, where sudden changes in signal patterns are studied to detect and locate faults. Wavelet transform decomposes a signal into a combination of multiples of scaled and shifted mother wavelets resulting in the so-called “Approximation” and “Detail” components. The approximation component is a high scale, low frequency component, while the detail components represent those with low scale and high frequency. The two will appear as a pair in every stage of decomposition as shown in Figure 8.
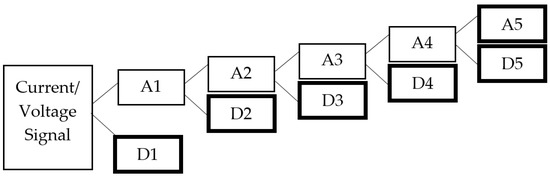
Figure 8.
Wavelet decomposition of current/ voltage signals.
The single level wavelet decomposition of a voltage signal V[i], which is the sampled data of the continuous voltage signal V(t), can be mathematically expressed as:
where g represents the impulse response of the low pass filter.
Outputs of the low and high pass filters, which are usually called approximation and detail components, are also expressed by Equations (11) and (12).
where h is the high pass filet transfer function.
The integral part of wavelet analysis is the mother wavelet. The mother wavelet is an equivalent of the sinusoid in Fourier analysis. Nevertheless, it significantly differs from the sinusoid in having a definite end and varying shape. The choice of mother wavelet was made from the available families, such as the Mexican Hat, Haar, Daubechies, Coiflets, Morlet, etc.; this is one of the decisions to make in wavelet analysis. After a thorough trial-and-error review of related literatures, the ‘haar’ wavelet was selected for this study. The selection was made based on how the features resulting from the wavelet transform helped to identify faults from non-fault conditions.
The change in wavelet energy of the approximation (ΔEa) and detail components (ΔEdn) and change in number of peak values of wavelet coefficients (ΔNp) are the two features used in this study that were based on the wavelet transform of the voltage and current signals (Figure 9). Wavelet energy is the percentage of energy corresponding to the approximation.
where Aij is the jth element in the approximation coefficient matrix of the ith window, and Dnij is the jth element in the nth level detail coefficient matrix of the ith window.
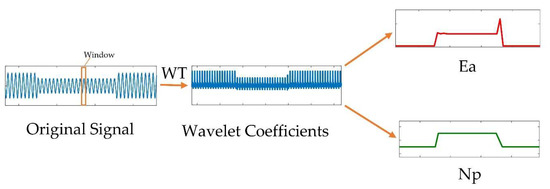
Figure 9.
Wavelet transform over a moving window and features.
The changes in the approximate and detail wavelet energies were then calculated in Equations (15) and (16).
The other feature extracted from the windowed WT is the change in the number of peak values of wavelet coefficients (ΔNp). The use of number of peak values of Wavelet coefficients is adopted from [17], though the parameter is applied specifically for power quality assessment, rather than protection study in this paper. If Np(i) is the number of peak values in the ith window, the change in the number of peaks ΔNp(i) can be calculated as the difference between Np(i) and the average of the last cycle.
2.2.3. Correlation Analysis for Feature Selection
The inputs for the fault detection module based on bagged decision trees were decided through a set of correlation analysis at each zone of protection or protected component. The correlation analysis evaluates the relative importance of the candidate features to the decision of the existence of a fault by measuring the strength and direction of the linear relationship between two variables: the selected features and intended state of the concerned circuit breaker;
where = mean(X), and = mean(Y).
Those candidate features that had a higher than 0.1 absolute correlation coefficient (|Corr|) were used as inputs for the fault detection model.
2.3. Bagged Decision Trees
Decision trees are one of the data mining techniques that have been used for the classification of applications for a number of years [18]. The method has seen recent revival due to higher accuracy being achieved through the discovery of methods of ensembling of more than one trees [19,20].
A decision tree is a technique where complex problems are broken down into a hierarchy of simpler ones. A hierarchical structure of connected nodes forms a decision tree, as seen in Figure 10. While training a decision tree, all training data is sent into the tree in order to optimize the parameters of the internal nodes. The testing of a decision tree involves repeated binary testing of input data at the internal nodes and the result being sent to the appropriate (the right or left) child until it reaches a terminal node (leaf). The leaf nodes usually contain a predictor (a classifier in this case) that will associate an output (a class label of 1 or 0 to represent existence or non-existence of a fault) to the input features.
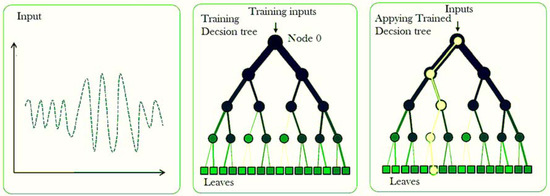
Figure 10.
Training and applying decision trees.
Making a decision regarding training the optimal number of decision trees has been a long standing problem and it has recently emerged that using an ensemble of learners can yield greater accuracy and generalization. One of the attempts is an iterative reweighting of training data to build more accurate classifiers using a boosting algorithm described by [21].
Bootstrap-aggregated (bagged) decision trees that combine the results of many decision trees address the issue of individual decision trees tendency to overfit. This approach reduces the effects of overfitting and improves generalization, and is the method adopted in this study. Bagged decision trees use an ensemble of decision trees using a bootstrap samples of the data. The technique resembles a random forest algorithm as it selects a random subset of predictors to use at each decision split. In the case of oversampling class decisions with a large misclassification, the bagged costs tree generates in-bag samples while generating undersampling classes for small misclassification costs.
Bagged decision trees have been used in this paper due to their effectiveness in mapping more than one input parameter to a target classification variable, which in our case is the state of the circuit breaker. An individual set of bagged decision trees with parameters shown in Table 4 is trained and applied for each zone of protection and each phase with a different set of inputs based on the result of the correlation analysis. As seen in Figure 11, the selected input features at each node are compared with threshold values that were updated by the training stage and decisions are made whether to pass to the right or left node in the next hierarchy; this ends with the last node (leaf) where the binary decision on the state of the circuit breaker was made.
Table 4.
Description of the bagged decision tree employed in this study.
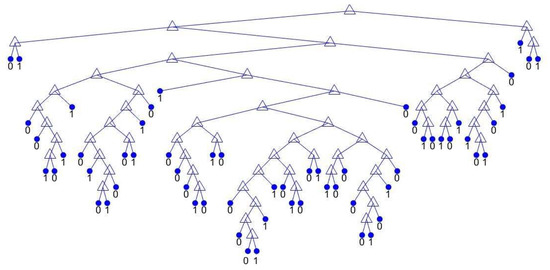
Figure 11.
Graphical view of bagged decision trees.
3. Results and Discussions
3.1. Grid-Connected Mode
In this section, the results from the correlation analysis of the candidate features and testing of the recommended method on a microgrid model operating under grid-connected mode are presented and discussed. The following sets of tests are done in the grid-connected mode:
- Faults in Zone 1 (Pont of Common Coupling (PCC) bus Protection)
- Faults in Zone 4 (Busbar protection)
- Faults in Zone 6 (DER protection)
- Faults in Zone 8 (Load protection)
3.1.1. Faults in Zone 1 (PCC bus Protection)
36 candidate features were tested for detecting faults in the PCC area. The correlation analysis results (shown in Table 5) are referred to select the most important features to use as input for the bagged decision trees. Out of the candidate features, 13 of those whose correlation was above 0.1 were selected.
Table 5.
Selection of most important features for Zone 1 (PCC) protection.
Figure 12 shows four of the selected features versus the faulty zone and the respective breaker action. Not all inputs are displayed in the graph so as to avoid overcrowding in the display. As it can be seen from the figure, the selected features changed noticeably to effectively identify the fault conditions from normal operation and non-fault disturbances. Though faults were also applied to the other regions of the microgrid during the same period, the method was able to accurately identify the location of the fault and hence trigger breaker action only during the fault in the concerned region. The summary of the method in the test case is further explained in Table 6.
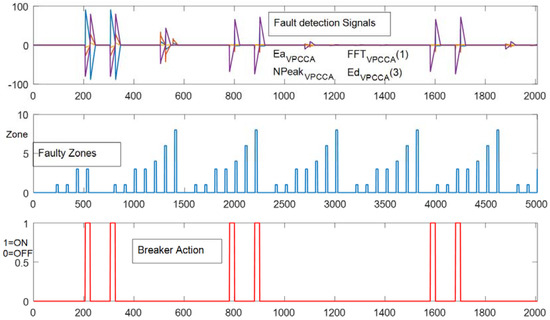
Figure 12.
Fault detection signals and breaker action for a sequence of faults in Zone 1.
Table 6.
Performance and confusion of the fault detection method for faults in Zone 1.
The method was effective to locate the fault with an accuracy of 92.1% with 1001 points out of the total 11,368 faulty points correctly identified. The method did exceptionally well in terms of avoiding false detection of non-fault conditions with a bare 0.02% error in that regard.
Though performance of the method is very good in terms of fault detection, the method showed little limitation in terms of the considerable number of fault conditions passing unnoticed. This is, in one way, related to the high impedance faults under which the model performance is comparatively lower that the solid faults. The comparison of performance of the method under different types of faults, including solid faults and high impedance faults, is shown in Figure 13. The other factor is the magnitude of the fault current under the grid-connected case being extremely high, making the task of selecting a perfect threshold to discriminate faults of different zones difficult. The fact that a fault is not detected as belonging to this specific zone does not mean the method fails to detect such a fault. Applying the same method to detect the occurrence of a fault in any of the zones in the microgrid showed an extremely high level of accuracy, 99.98%. Therefore, the limitation was locating the faults.
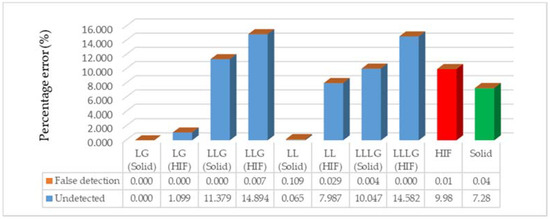
Figure 13.
Comparison of performance of the method for different types of faults in Zone 1.
3.1.2. Fault in Zone 4 (Busbar Protection)
The method was then tested for a sequence of faults of different types and resistance in Zone 4, which is one of the busbars in the microgrid. The method is compared to the conventional differential protection which is the most common method of protection for busbars. An additional input parameter, the root mean square (RMS) value of the differential current, is considered in this case. It is the most correlated feature as it might easily be expected while the other important features are those shown in Table 7. The fault detection signals for a sequence of faults tested in Zone 4 are displayed in Figure 14.
Table 7.
Selection of the most important features for Zone 4 (Busbar 2) protection.

Figure 14.
Fault detection signals and breaker action for a sequence of faults in Zone 4.
The performance of the method recommended in this study was compared with a conventional differential protection with a 10% differential relay setting, i.e., the restraint current was fixed to be 10% above the maximum operating current. The results are presented in Table 8 while the comparison with conventional differential protection is shown in Table 9 and Figure 15
Table 8.
Performance of the devised method for different types of faults in Zone 4 (Busbar 2).
Table 9.
Performance of the devised fault detection method and conventional differential protection for protection of Zone 4 (Busbar 2).
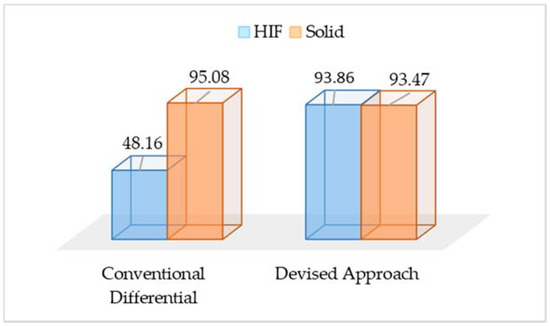
Figure 15.
Comparison of devised approach against conventional differential protection for solid and high impedance faults.
The devised approach showed a greater level of selectivity compared to the most common protection for busbars, differential protection. The improvement is quite visible in the case of HIFs with a performance as high as 93.86% compared to 45.08% of the conventional differential protection. However, the devised method’s performance is seen to be slightly inferior in case of solid faults.
3.1.3. Fault in Zone 6 (DER Protection)
Distributed energy resources are the power suppliers in the microgrid. With the exception of energy storage systems, the current flow is expected to be in a specified direction. Hence, in case of protecting a DER, change in the direction of flow of current (and therefore the phase angle) would be a customary fault detection signal. That is why the addition of phase angle as an input feature is important. The correlation analysis results proved the same fact. As seen in Table 10, the change in phase angle is one of the most important features together with other features extracted from the windowed FFT and WT analysis, shown in Table 10. The way the selected features varied during faults in the concerned zone is shown in Figure 16 and Table 11 presents the performance of the devised approach in detecting faults in this zone.
Table 10.
Selection of most important features for Zone 6 (DER) protection.
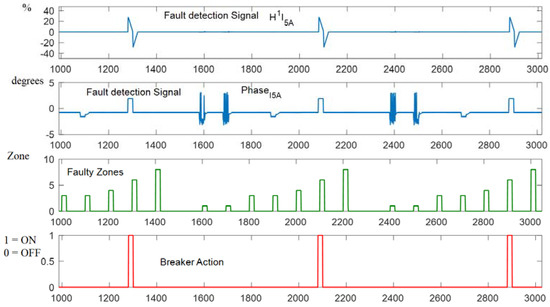
Figure 16.
Fault detection signals and breaker action for a sequence of faults in Zone 6.
Table 11.
Performance of the devised method for different types of faults in Zone 6 (DER 1).
The fault detection algorithm recommended in this study performed exceptionally well with faults in the distributed energy resources. Almost no (only 6 points) false detection was exhibited from a possible 201,028 points; the performance in accurately detecting test faults was also very high (97.15%). The method is further compared with the option of using phase angle as the only fault detection signal to represent a simpler directional relay; the comparison is shown in Figure 17.
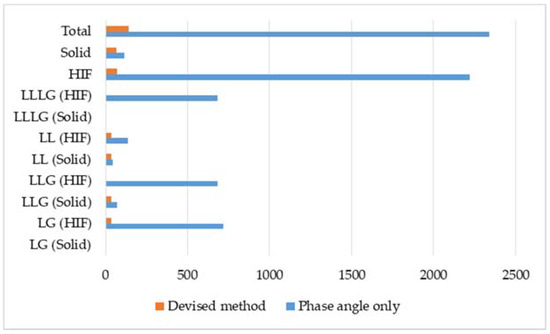
Figure 17.
Comparing the option of using phase angle only with the devised approach.
3.1.4. Fault in Zone 8 (Load Protection)
The proposed method is also tested for its performance during faults occurring at one of the loads. The selected features in this case are those shown in Table 12. The fault detection signals and the excepted breaker action for faults occurring to the load in Zone 8 are presented in Figure 18. The effectiveness of the method under different types of faults applied to the load in the test model is shown in Table 13. The method absolutely avoided erroneous detection and the undetected faults settled to a mere 0.75%. That is an exceptional achievement, considering the fact that the test scenario includes faults of varying resistance. The only case where fewer undetected faults were witnessed is in the high impedance single line to ground fault. Comparison with a traditional overcurrent protection of 125% relay setting reflects the exhibited improvement in fault detection accuracy by the method. The simple overcurrent protection setting value is assumed to take a value of 125% of the maximum load current under the non-fault test conditions.
Table 12.
Selection of most important features for Zone 8 (Load) protection.
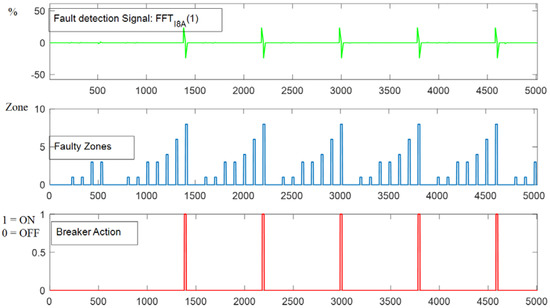
Figure 18.
Fault detection signals and breaker action for a sequence of faults in Zone 8.
Table 13.
Performance of the devised method for different types of faults in Zone 8 (Load 2).
As can deduced from Table 14, traditional overcurrent protection, an exact opposite to the devised approach, showed poor performance. The special observation from this comparison is that high impedance faults were being completely unnoticed by the traditional overcurrent protection. That is due to the changes in load and generation during normal operation that were considerably high and were confused with high impedance faults.
Table 14.
Performance of simple overcurrent protection for faults in Zone 8 (Load protection).
3.2. Island Mode
One of the challenges in microgrid protection is the lower effectiveness of the conventional approaches due to low fault current while the microgrid turns to the island mode of operation. The following sets of tests are undertaken on the test microgrid model operating under island mode to evaluate whether the devised method can address this issue.
- Fault in Zone 1 (Busbar Protection)
- Fault in Zone 2 (Busbar protection)
- Fault in Zone 4 (DER protection)
- Fault in Zone 6 (Load protection)
3.2.1. Fault in Zone 1 (Busbar Protection)
The protection of Busbar (BB1) is simplified due to the withdrawal of the main feeder, making the choice of the fault detection signal, which is the differential current, quite straight forward. However, the importance of the feature is quantified and additional features were selected using the correlation analysis procedure in the same way as the protection of other zones. The correlation analysis results, as shown in Table 15, show that change in the differential current is an immediate sign of a fault occurring in the zone. Other features, such as change in phase angle, magnitude of the first harmonic, and the sum of the detail wavelet energies of the bus voltage, also showed significant correlation with the state of the concerned circuit breaker.
Table 15.
Selection of most important features for Zone 1 (Busbar) protection—island mode.
The correlation between these selected fault detection signals and the state of the circuit breaker can also be affirmed from the graphical representation in Figure 19.
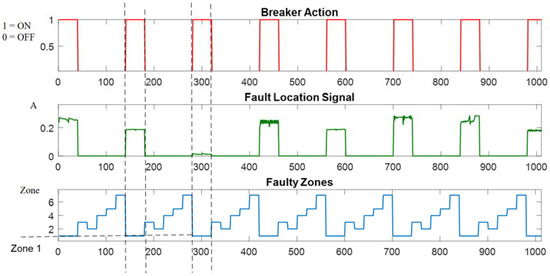
Figure 19.
Fault detection signals and breaker action for a sequence of faults in Zone 8.
The approach devised in this study was able to accurately identify all kinds of faults in Zone 1 with 100% accuracy. The results achieved though this technique was then compared to the use of conventional differential protection. As presented in Table 16, the devised approach is more effective than conventional differential protection, with conventional protection failing to notice more than 8.89% of the faults, especially the HIFs.
Table 16.
Comparing the devised approach with conventional differential protection for protection of Zone 1 in island mode.
3.2.2. Fault in Zone 2 (Busbar Protection)
The reason for performing additional testing for bus protection is because the first zone was made of just two branches and thus very simple. Zone 2 is a Busbar with more than two branches connected to it and can more accurately represent the case of Busbar protection. The selected features for fault detection are not different from that of Zone 1, though their correlation is a little different this time (Table 17).
Table 17.
Selection of the most important features for Zone 2 (Busbar) protection—island mode.
Our method again proved its effectiveness for the protection of a busbar in a microgrid under island mode with 100% accuracy. Our method was also compared with, and outperformed, the conventional approach of differential protection, as shown in Table 18. Looking at the very high correlation between the differential current and the state of the circuit breaker, one may suggest the solitary use of this parameter should be enough. However, such a trial has consolidated the significance of the additional parameters, as can be seen from Table 18.
Table 18.
Comparing the devised approach with conventional differential protection and the option of using a differential current as the only input for protection of Zone 2 in island mode.
3.2.3. Fault in Zone 4 (DER Protection)
For a microgrid operating in island mode, when a fault happed in DER1, the phase angle of the branch current, and the bus voltage were the most important parameters, in addition to the other features listed in Table 19, for the wavelet and fast Fourier transforms. Figure 20 shows how the selected features changed during faults in the protection zone.
Table 19.
Selection of most important features for Zone 4 (DER) protection—island mode.
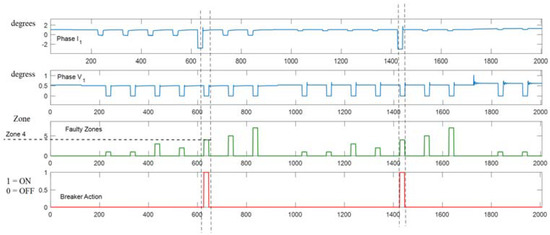
Figure 20.
Changes in phase angle are important fault detection signals for faults in Zone 4.
The bagged decision tree based protection scheme with correlated input features extracted by windowed FFT and WT resulted in a fault detection accuracy of 97.92% with no single point mistakenly labeled as a fault. The choice of the input sets was a critical factor for this very high accuracy as the use of phase angle of the branch current would only give an accuracy level of 47.05%.
3.2.4. Fault in Zone 6 (Load Protection)
For a fault happening in Zone 6 and Zone 7, where the U/f mode DER is either short circuited or faulted, the system will become completely unstable due to loss of voltage and frequency reference. Hence, the correlation analysis result is extremely biased and less informative. The following features are selected as inputs based on the experience in the other zones and a common understanding, as shown in Table 20.
Table 20.
Selected input features for Zone 6 (Load) protection—island mode.
The use of bagged decision trees trained with those inputs resulted in an efficient detection of different types of faults in Zone 6, as shown in Table 21.
Table 21.
Performance of devised approach for faults in Zone 6 (load connected to same Busbar as U/f mode DER).
4. Conclusions
With a greater level of microgrid deployment in today’s grid, their protection has become one of the mainstream research topics in the field. This study contributes to this field of research by recommending and verifying a novel bagged decision tree based protection scheme which makes systematic use of two of the most famous signal processing tools, fast Fourier and wavelet transform. The protection scheme devised in this study uses only local measurements, voltage of the busbar in the protection zone, and current measurements from meters connected to the branches descended from the bus. Hence, the need for complex and time taking communication is avoided. This paper incorporates the analysis of both current and voltage waveforms, hence, avoiding the issues related with current transformer saturation in current-only based methods.
After a list of candidate features extracted from windowed FFT and WT of the local voltage and current records is derived, the most important features were selected in a procedural manner through correlation analysis. The architecture of the bagged decision trees and their respective inputs were selected individually for the different protection zones. Rather than using an absolutely theoretical proposition, which is far from industrial practice, upgrading the current practical techniques with incorporation of the newly devised scheme is adopted in the study. Hence, the recommended approach was verified using a microgrid model initially modeled in PSCAD/EMTDS, which is based on an operational microgrid, and the results were compared to the conventional approaches such as differential, directional, and overcurrent protections. In all the test cases, regardless of whether the microgrid is operating in either grid-connected or island modes or the faults being solid or high impedance faults, the devised approach showed a great level of accuracy in detecting faults selectively, both in terms of comparative and standard performance.
Signal features, such as changes in magnitude of individual harmonics, phase angles, wavelet energy, and number of peak values in the wavelet coefficients, were very effective in signaling the presence of a fault in the different protection zones. Incorporation of the correlation analysis stage created a logical and objective way to input a parameter selection whose effectiveness was well reflected with a high level of accuracy achieved by the protection scheme as a whole. The fact that only the local measurements and most important features extracted from those measurements were considered enabled the proposed method to have the edge over the communication intensive and online computation-based adaptive approaches in terms of fault detection speed. The use of bagged decision trees proved to be a coherent decision as substantial gains in fault detection accuracy were achieved. That is due to the decorrelation between individual trees using different sets of inputs, which allowed for an improved generalization and high level of robustness by the technique, with respect to noisy data.
Author Contributions
S.N. contributed to the research model, data analysis techniques, implementation, and writing of the paper. J.Z. and D.Z. performed the supervision, professional advice, and continuous follow-up of the study; all authors have read and approved the final manuscript.
Conflicts of Interest
The authors declare no conflicts of interest.
References
- Hooshyar, A.; Iravani, R. A New Directional Element for Microgrid Protection. IEEE Trans. Smart Grid 2017, 1. [Google Scholar] [CrossRef]
- Hooshyar, A.; Iravani, R. Microgrid Protection. Proc. IEEE 2017, 105, 1332–1353. [Google Scholar] [CrossRef]
- Ndjaba, S.; Machnida, G.T.; Nthontho, M.; Chowdhury, S.; Chowdhury, S.P.; Mbuli, N. Modeling and simulation of fault detection methods for power electronic interfaced microgrids. In Proceedings of the 47th International Universities Power Engineering Conference (UPEC), London, UK, 4–7 September 2012; pp. 1–6. [Google Scholar] [CrossRef]
- Escudero, R.; Noel, J.; Elizondo, J.; Kirtley, J. Microgrid fault detection based on wavelet transformation and Park’s vector approach. Electr. Power Syst. Res. 2017, 152, 401–410. [Google Scholar] [CrossRef]
- Muda, H.; Jena, P. Superimposed Adaptive Sequence Current Based Microgrid Protection: A New Technique. IEEE Trans. Power Deliv. 2017, 32, 757–767. [Google Scholar] [CrossRef]
- Hare, J.; Shi, X.; Gupta, S.; Bazzi, A. Fault diagnostics in smart micro-grids: A survey. Renew. Sustain. Energy Rev. 2016, 60, 1114–1124. [Google Scholar] [CrossRef]
- Al-Nasseri, H.; Redfern, M.A. Harmonics content based protection scheme for Micro-grids dominated by solid state converters. In Proceedings of the 12th International Middle-East Power System Conference, Aswan, Egypt, 12–15 March 2008; pp. 50–56. [Google Scholar] [CrossRef]
- Lai, K.; Illindala, M.S.; Haj-ahmed, M.A. Comprehensive Protection Strategy for an Islanded Microgrid Using Intelligent Relays. IEEE Trans. Ind. Appl. 2017, 53, 47–55. [Google Scholar] [CrossRef]
- Kar, S.; Samantaray, S.R. Time-frequency transform-based differential scheme for microgrid protection. IET Gener. Transm. Distrib. 2014, 8, 310–320. [Google Scholar] [CrossRef]
- Gururani, A.; Mohanty, S.R.; Mohanta, J.C. Microgrid protection using Hilbert–Huang transform based-differential scheme. IET Gener. Transm. Distrib. 2016, 10, 3707–3716. [Google Scholar] [CrossRef]
- Yu, J.J.Q.; Hou, Y.; Lam, A.Y.S.; Li, V.O.K. Intelligent Fault Detection Scheme for Microgrids with Wavelet-based Deep Neural Networks. IEEE Trans. Smart Grid 2017, 1. [Google Scholar] [CrossRef]
- Parikh, U.B.; Das, B.; Maheshwari, R. Fault classification technique for series compensated transmission line using support vector machine. Int. J. Electr. Power Energy Syst. 2010, 32, 629–636. [Google Scholar] [CrossRef]
- Hadi Abdulwahid, A.; Wang, S. A Novel Approach for Microgrid Protection Based upon Combined ANFIS and Hilbert Space-Based Power Setting. Energies 2016, 9, 1042. [Google Scholar] [CrossRef]
- Hong, Y.-Y.; Wei, Y.-H.; Chang, Y.-R.; Lee, Y.-D.; Liu, P.-W. Fault Detection and Location by Static Switches in Microgrids Using Wavelet Transform and Adaptive Network-Based Fuzzy Inference System. Energies 2014, 7, 2658–2675. [Google Scholar] [CrossRef]
- Mishra, D.P.; Samantaray, S.R.; Joos, G. A Combined Wavelet and Data-Mining Based Intelligent Protection Scheme for Microgrid. IEEE Trans. Smart Grid 2016, 7, 2295–2304. [Google Scholar] [CrossRef]
- Kar, S.; Samantaray, S.R.; Zadeh, M.D. Data-Mining Model Based Intelligent Differential Microgrid Protection Scheme. IEEE Syst. J. 2017, 11, 1161–1169. [Google Scholar] [CrossRef]
- Kezunovic, M. Advanced assessment of the power quality events. In Proceedings of the Ninth International Conference on Harmonics and Quality of Power, (Cat. No.00EX441), Orlando, FL, USA, 1–4 October 2000; Volume 3, pp. 834–839. [Google Scholar] [CrossRef]
- Breiman, L.; Friedman, J.; Stone, C.J.; Olshen, R.A. Classiffcation and Regression Trees; Chapman and Hall/CRC: Boca Raton, FL, USA, 1984. [Google Scholar]
- Breiman, L. Random Forests. Mach. Learn. 2001, 45, 5–32. [Google Scholar] [CrossRef]
- Criminisi, A.; Shotton, J.; Konukoglu, E. Decision Forests: A Unified Framework for Classification, Regression, Density Estimation, Manifold Learning and Semi-Supervised Learning. Found. Trends Comput. Graph. Vis. 2012, 7, 81–227. [Google Scholar] [CrossRef]
- Schapire, R.E. The strength of weak learnability. Mach. Learn. 1990, 5, 197–227. [Google Scholar] [CrossRef]
© 2018 by the authors. Licensee MDPI, Basel, Switzerland. This article is an open access article distributed under the terms and conditions of the Creative Commons Attribution (CC BY) license (http://creativecommons.org/licenses/by/4.0/).