Adhesion Control Strategy Based on the Wheel-Rail Adhesion State Observation for High-Speed Trains


School of Electrical Engineering, Beijing Jiaotong University, Beijing 100044, China
*
Author to whom correspondence should be addressed.
Electronics 2018, 7(5), 70; https://doi.org/10.3390/electronics7050070
Submission received: 1 April 2018
/
Revised: 27 April 2018
/
Accepted: 10 May 2018
/
Published: 14 May 2018
Abstract
:In this paper, an adhesion control strategy based on the wheel-rail adhesion state observation is proposed for high-speed trains. First, the high-speed train single axle dynamics model is established. Then, a modified adhesion control method is proposed. The scheme observes the tangential force coefficient between wheel and rail through full dimension observer and forecasts the slope of the adhesion-slip curve by the recursive least squares method with forgetting factor. Meanwhile, a feasibility analysis of the method and the control parameters tuning is conducted. Afterwards, the experimental study of the proposed adhesion control is carried out based on a 5.5 kW induction motor drag platform using dSPACE simulation technology. The experimental results confirm the feasibility of the adhesion control method proposed in this paper. Using the proposed adhesion control method can achieve high wheel-rail adhesion performance under variable complex road conditions.
1. Introduction
Wheel-rail adhesion is one of the important factors affecting the normal traction-braking performance of high-speed trains. Wheel-rail adhesion force is restricted by road adhesion capacity. When traction-braking torque on the wheel over the maximum adhesion that wheel-rail can provide, idling-sliding phenomenon happens. This kind of phenomenon can lead to bad effects, such as a decline in passenger comfort, wheel-rail abrasion, train traction-braking performance degradation and so on [1]. Therefore, high speed trains are equipped with adhesion control devices to suppress the occurrence of idling-sliding, in order to ensure the normal operation of the train.
In the field of high-speed train adhesion control, a main way is adopting the logic threshold control such as speed difference, creepage rate, acceleration/deceleration threshold, etc. But the method is a kind of control that acts after the occurrence of idling-sliding. So it cannot obtain the best use of adhesion, and it is affected by road surface conditions. Based on a zero order observer; literature [2,3] put forward a new torque adjustment control algorithm triggered by idling-sliding detection. Where, the control effect is better, but the utilization rate of adhesion remains need to be improved. Literature [4,5,6] present a fuzzy adhesion control method based on a zero order observer and achieves good results, but due to the complex fuzzy logic and programming difficulty, there are certain limitations in practical application. Literature [7] analyzes the performance influence of full dimension observer to re-adhesion optimization control system emphatically. Literature [8] proposes a torque feedback adhesion control method based on a zero order observer. The control in adhesion-slip stable region is effective, but in unstable region this control will fail. Literature [9] proposes a reduced-order observer, and adds an extra open-loop torque command C(t) to the output of torque regulator in literature [8]. Then literature [9] solves the failure problem in adhesion-slip unstable region of literature [8], but literature [9] does not give a reasonable method for judging whether the operation state is in the unstable region or not. The extra open loop torque command C(t) is obtained by experience instead of calculation.
To suppress the occurrence of idling-sliding and get better use of adhesion, this paper proposes a modified algorithm of optimized adhesion control, on the basis of literature [8,9]. By building the full dimension observation of wheel-rail tangential force coefficient μ and Recursive Least Squares (RLS) estimation of adhesion-slip slope dμ/dvs with forgetting factor, the method uses torque feedback control to quickly implement train running near the adhesion peak point in complex road conditions and maintains high adhesion performance between wheel and rail. To confirm the feasibility of the proposed adhesion control method, based on adhesion control experimental research in literature [10,11,12], the experimental study is carried out based on a 5.5 kW induction motor drag platform using dSPACE simulation technology. The experimental results have confirm the feasibility of the proposed adhesion control method.
2. Model Analysis
2.1. Adhesion-Slip Characteristic
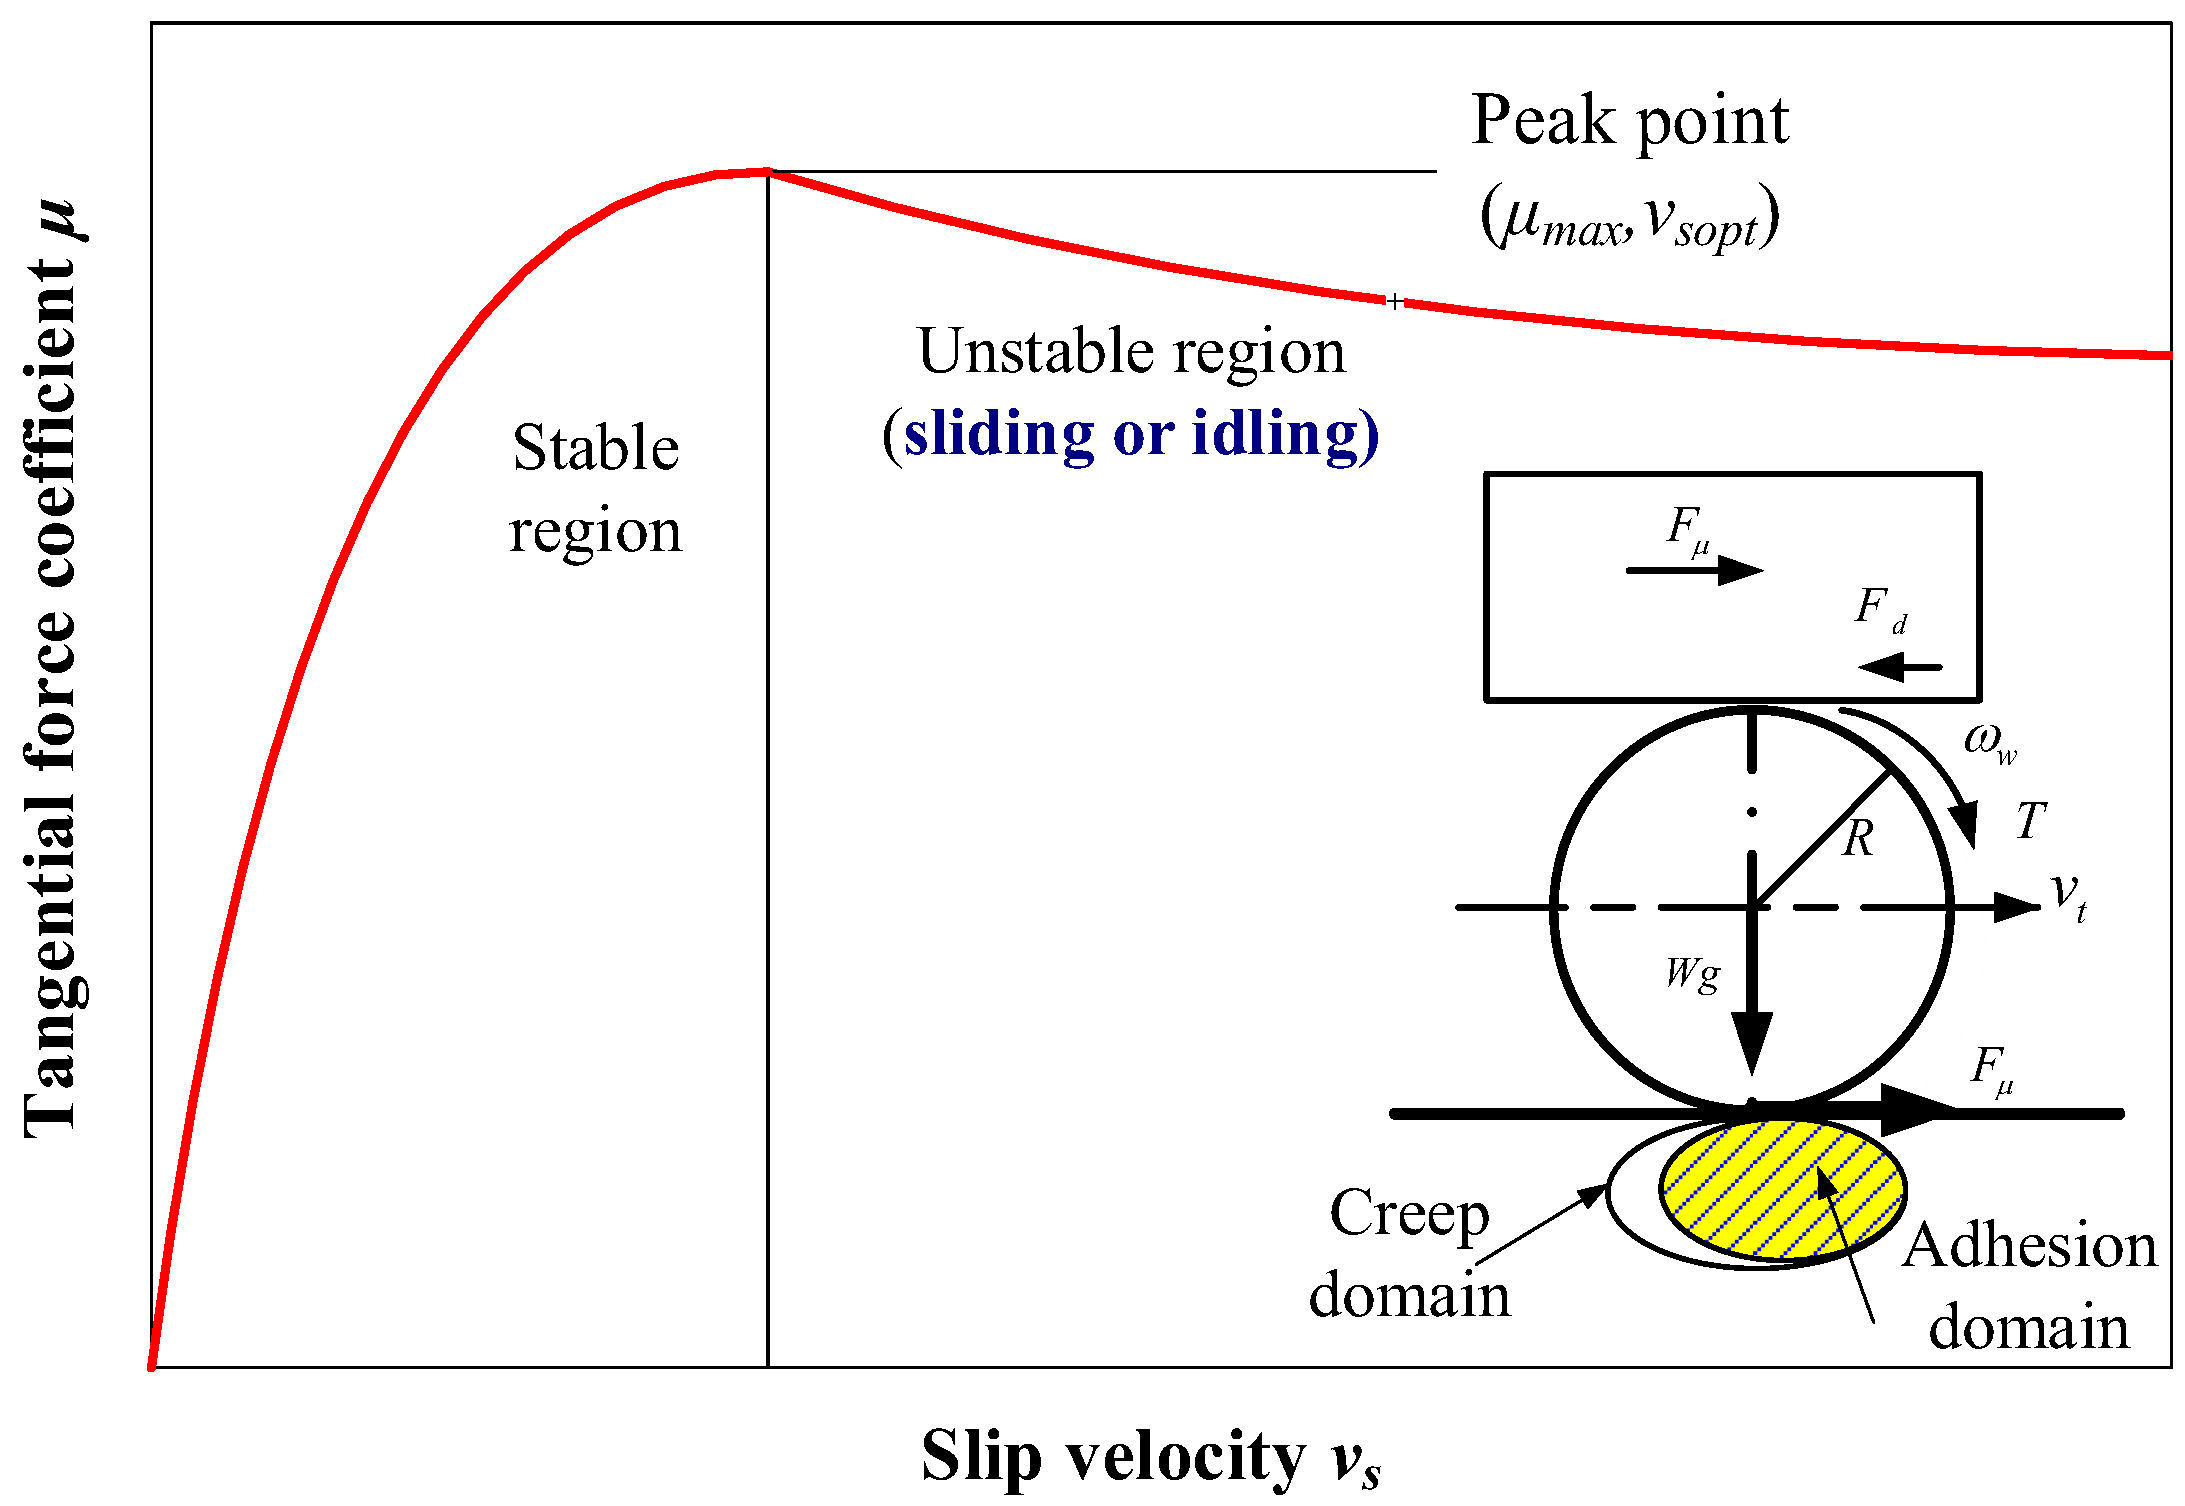
The wheel-rail adhesion-slip phenomenon of high-speed trains is essentially a kind of elastic contact interaction. Under the effect of axle load Wg, elastic deformation occurs in the contact area between the wheel-rail and leads to the formation of elliptical contact zone. When the wheel rolls forward by the drive torque T, tangential force can be produced between wheel-rail due to the relative motion or motion trend. The tangential force causes the movement of the wheel-rail contact surface; as a result, the train forward velocity will be smaller than the wheel line velocity and this phenomenon is slip. Figure 1 briefly shows the slip phenomenon.
In order to evaluate the degree of slip and the value of adhesion force, the slip velocity vs and tangential force coefficient μ are defined as follows:
where, R is the radius of the wheel; ωw expresses the wheel angular velocity; vt is the velocity of the train; W is the axls weight; g is the gravity acceleration; and Fμ is the tangential force.
Numerous theoretical analyses and experimental tests have confirmed that the adhesion-slip character between wheel and rail can be expressed by the relationship between tangential force coefficient μ and the slip velocity vs. The relationship is called the adhesion-slip characteristic, and Figure 1 shows the typical adhesion-slip curve. The adhesion-slip curve has a peak point (μmax, vsopt). The tangential force coefficient μmax at this point is called the adhesion coefficient. The corresponding slip velocity vsopt at this point is called the optimal slip velocity. The curve is divided into two areas by the vsopt. One is the stable area and the other is unstable area. The curve shows a positive slope of the adhesion-slip curve (dμ/dvs ≥ 0) in the stable area while a negative slope (dμ/dvs < 0) in the unstable area.
When wheel-rail operates in the unstable region, the idling-sliding phenomenon happens easily. In order to avoid idling-sliding and use the maximum adhesion between the wheel-rail, optimized adhesion controls must be able to achieve wheel-rail running in the adhesion stable region and near the peak point (μmax, vsopt) under the variable condition of complex roads.
2.2. Train Single Axle Dynamics Model
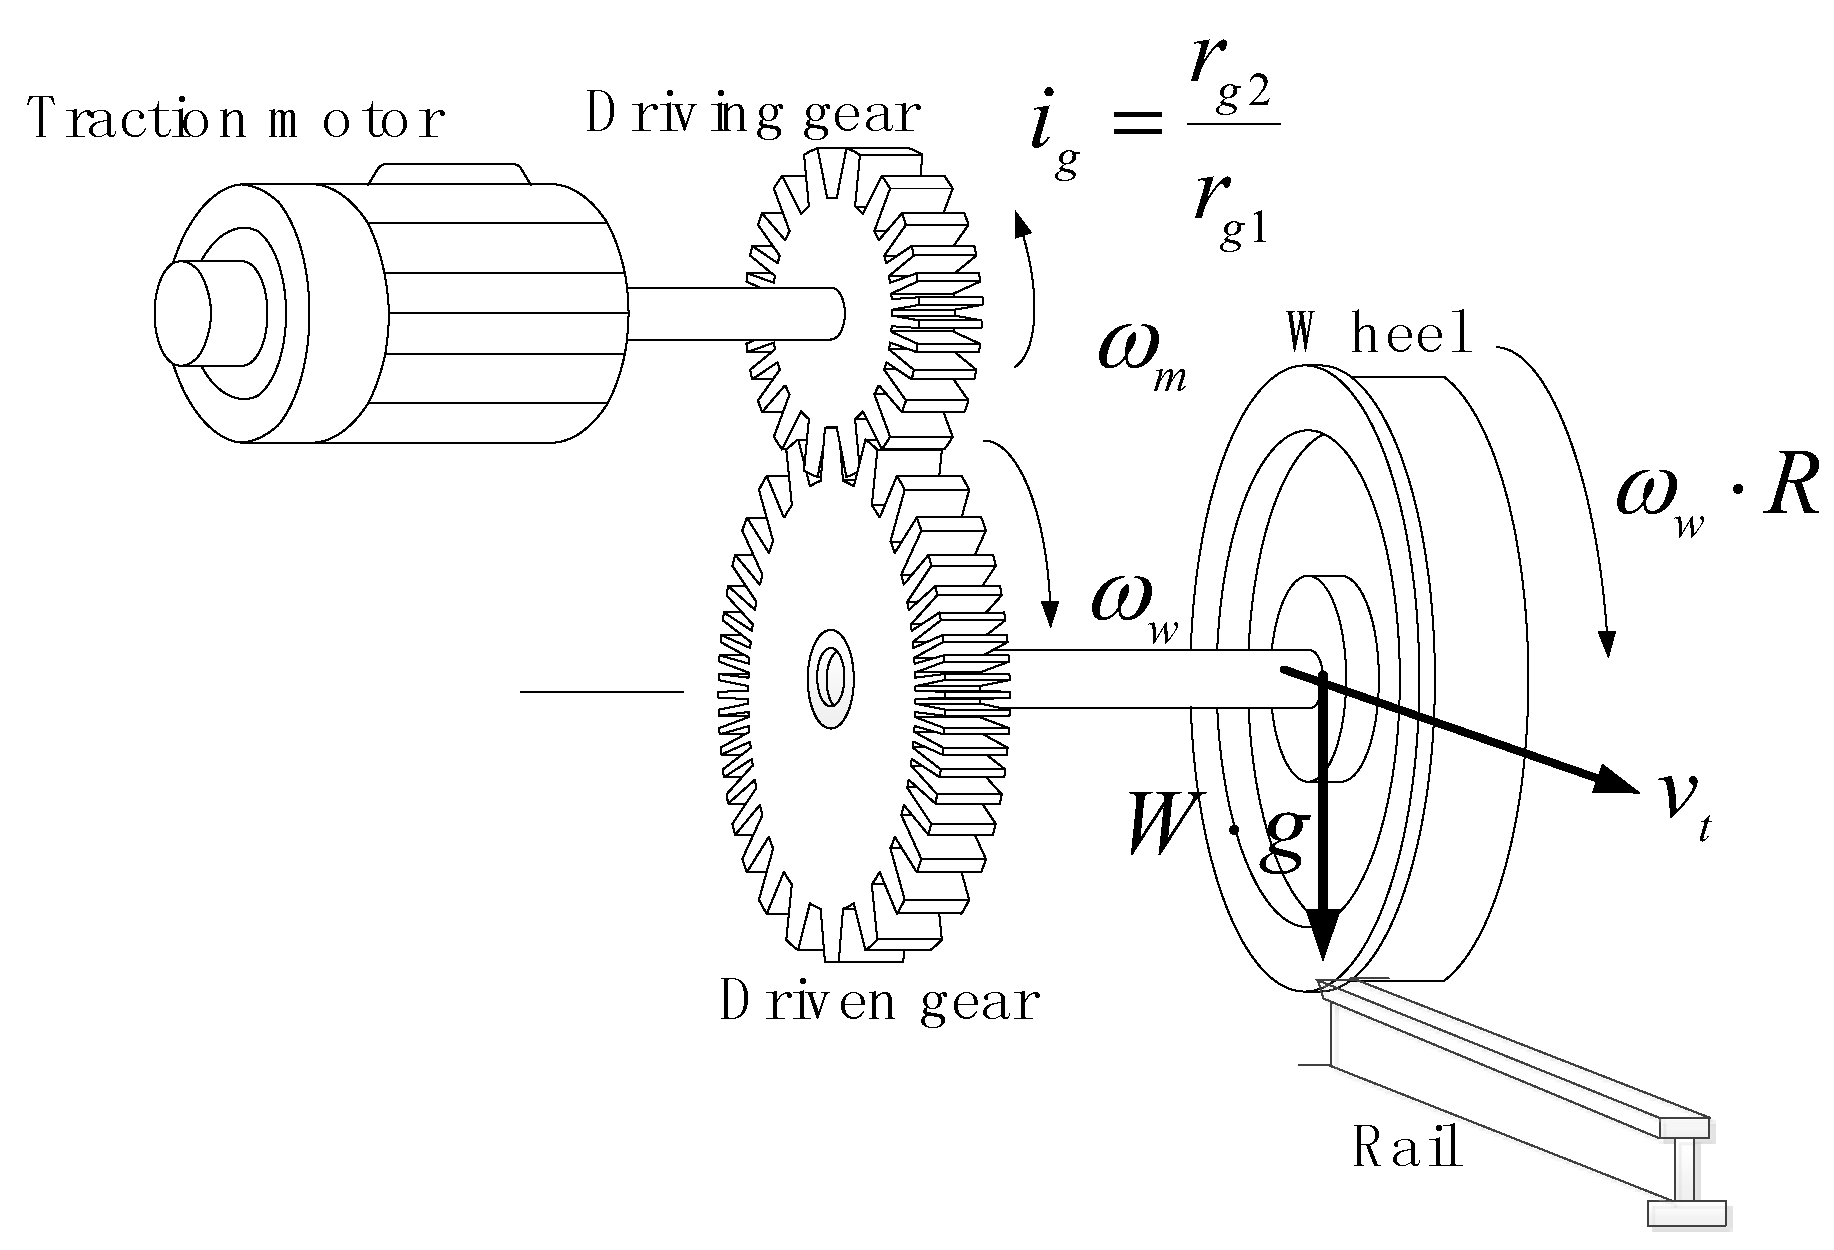
Due to the complex dynamic characteristics of high-speed train running, it is difficult to build complex dynamic models considering various factors. In this paper, the adhesion control study mainly aimed at the single axle dynamic model as shown in Figure 2.
According to the wheel-rail adhesion characteristic, driving system characteristic and the mechanical model of the train, the mathematical Equation (3) is gained as follows:
where, M is train mass (including equipment and passenger quality, which is the load of motor coaches); NM is the number of motor axle; Jm is the traction motor rotor moment of inertia; Twm is the torque exerted to motor axle through the gear box by driven axle; Tmw is the torque exerted to driven axle through the gear box by motor axle; Jw is the driven axle moment of inertia; ig is the gear transmission ratio; rg1 and rg2 are the radius of driving gear and driven gear respectively; ηgear is the gear transmission efficiency; R is the radius of the wheel; Bm, Bw are motor and driven axle rotational viscosity coefficient; Tm is the traction motor torque; ωm is motor angular speed; Fd is basic resistance of train, a, b and c are coefficients of resistance equation.
Traction motor output side equivalent equation can be obtained by (3):
3. The Modified Adhesion Control Method
3.1. Method Implementation Principle
Literature [8,9] carry out torque feedback adhesion control based on the tangential force coefficient μ and dμ/dt. The key regulator function is:
where, TA is the torque command output by adhesion control, K1 and K2 are the control parameters. The essence of this regulator is a PI controller with dμ/dt as input. dμ/dt = 0 is the control objective with a suppose that dμ/dt = 0 is equivalent to dμ/dvs = 0. And dμ/dt is use to judge the operation area is stable or unstable in literature [9]. However, as shown in Figure 1, the operation area of the adhesion-slip characteristic is determined by dμ/dvs, not dμ/dt. dμ/dt isn’t equivalent to dμ/dvs as the criterion of operation area. This may cause inaccurate judgment of unstable areas, so that the torque command will get smaller and smaller as it moves along the stable parts of the adhesion-slip characteristic curve in Figure 1, and the train cannot run.
As shown in Figure 1, f(μ, dμ/dvs) can truly reflect the status of wheel-rail adhesion. So in this paper, based on the literature [8,9], replacing dμ/dt by dμ/dvs, torque feedback adhesion optimized control is proposed based on the tangential force coefficient μ and adhesion-slip slope dμ/dvs. The modified torque regulator function is shown in (9).
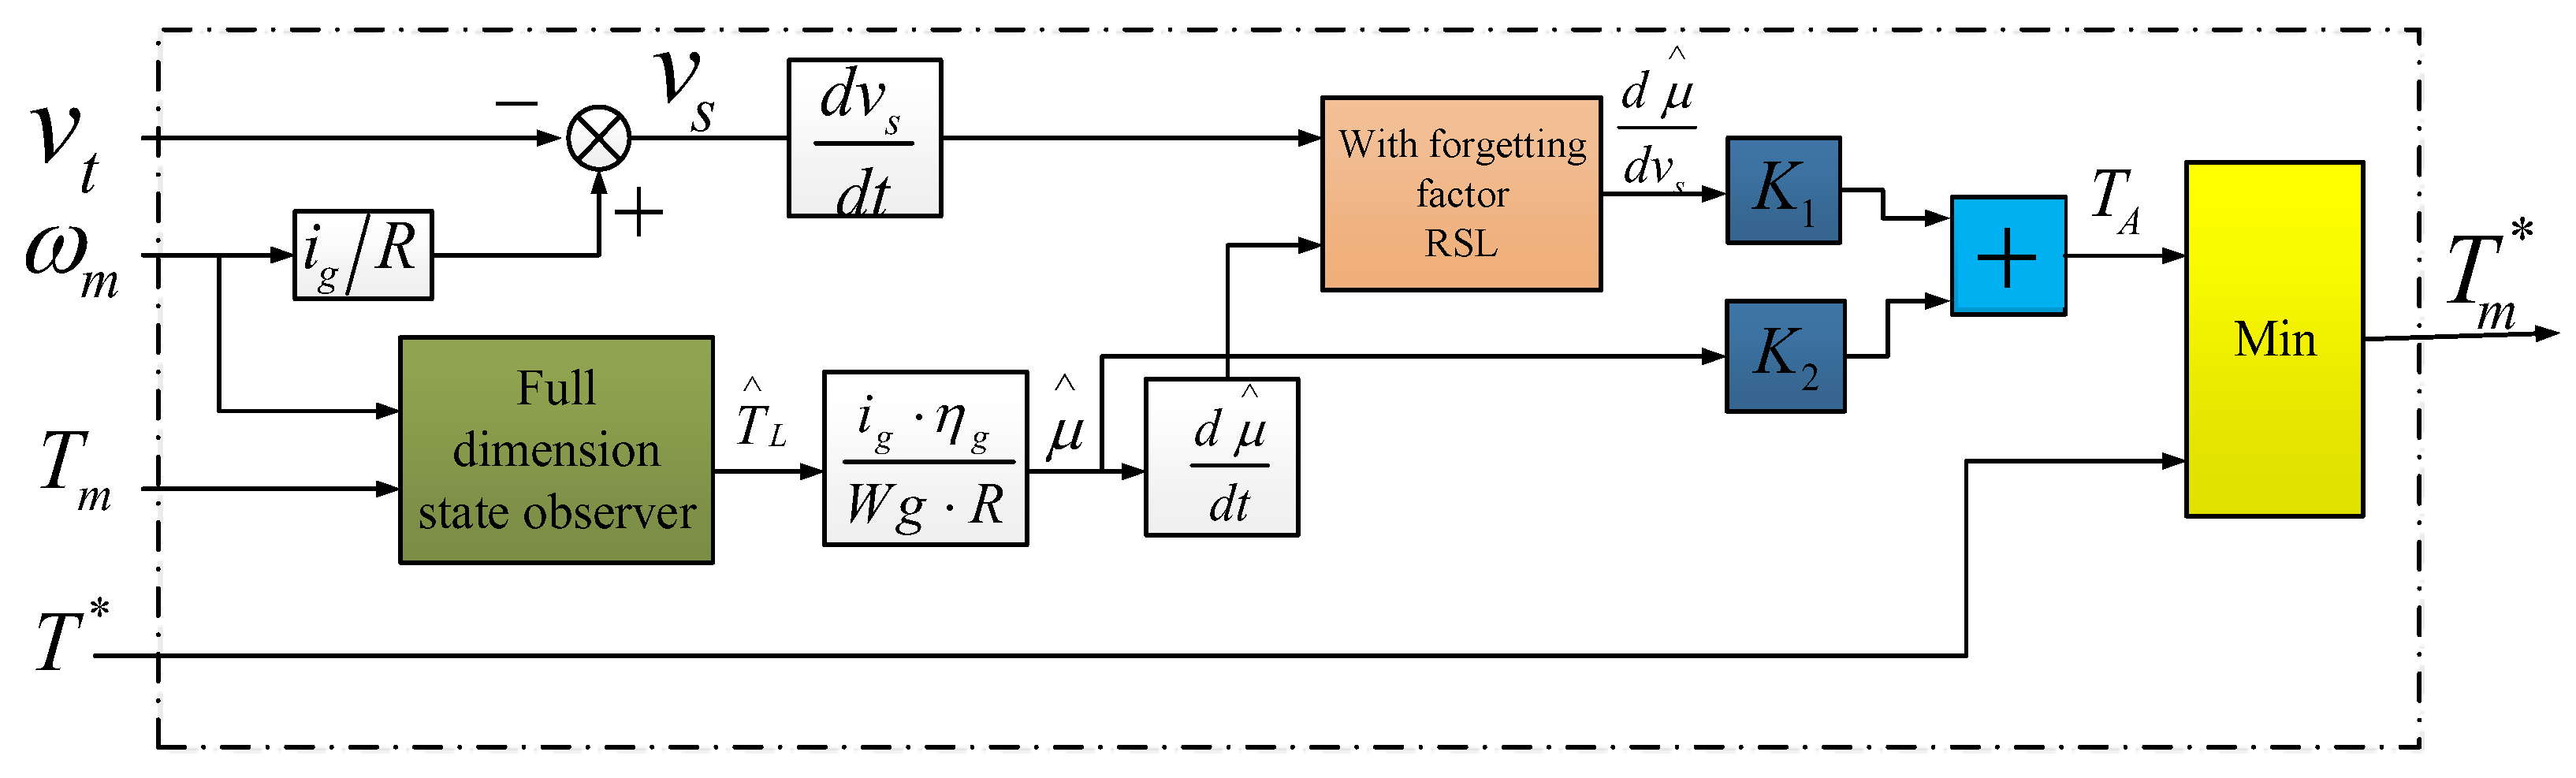
Figure 3 shows the diagram of the modified adhesion control algorithm. The inputs in Figure 3 are drivers handle instruction T*, vehicle velocity vt, motor speed ωm and motor torque Tm. The output is the motor torque instruction Motor load torque TL is got through the state observer. Then combined with (2), (3), the wheel-rail tangential force coefficient μ and its differential value dμ/dt is calculated. Slip velocity vs is known by Formula (1), then the differential value dvs/dt can be calculated. Inputting dvs/dt and dμ/dt into the RLS module with forgetting factor, the estimated value of dμ/dvs can be got.
According to torque regulator function (9), the adhesion control torque command TA is output. Comparing TA with T* and choosing the smaller one as the motor vector control torque instruction value . Formula (10) is the full dimension asymptotic state observer of TL [13,14]. Formula (11) is the principle of RLS estimation with forgetting factor [15].
where, p1 and p2 are the poles of full dimension observer.
where, γ is the exponential weighting factor, P is the error covariance matrix.
Making
The adhesion-slip slope
can be estimated accurately.
3.2. Theoretical Analysis and Parameter Setting of the Control Method
Combined with the Formula (3), and ignoring Bm and Bw, adhesion state equation can be written as follows:
Because of the great inertia of the actual train, the variation of vehicle speed vt is very small in a adhesion controller response action interval. So the in Formula (14) can be regarded as a constant disturbance C. Discretization of Formula (14) is:
By adhesion control algorithm block diagram shown in Figure 3, under good road conditions, the controller normally outputs driver instruction value T* (TA > T*). Under poor road conditions, the controller outputs adhesion control torque values TA (TA < T*). So in such condition, discretizing TA and putting the result into the Formula (15):
Within a control interval Ts, μ[k − 1] ≈ μ[k]. C is decided by vt and its value is still very small (C = ±0.198) when vtmax = 380 km/h. The proportion of C is very small during the process of adhesion control, so that it can be ignored. Therefore, further approximate processing of Formula (16) is:
Based on Formula (17), we perform the feasibility analysis of the adhesion control method proposed in this paper and parameter setting of K1 and K2.
To realize running on the adhesion peak point (dvs/dt ≈ 0), the first requirement is A = 0, as a result B = 0, then we get the ideal K2:
At this time, K2 decided by system structure parameters is called its critical value K2TH.
Determining the ideal K2 = K2TH, then B = 0, and A (decided by K1) plays the role of dynamic torque adjustment. The specific effect of K1 is to dynamically correct motor torque with small amplitude when road conditions change suddenly, and then to make the slip speed increase or decrease for rapid convergence to the peak point. Finally, to improve the utilization rate of adhesion.
In actual control, in order to ensure the stability of adhesion control near the adhesion peak requires further analysis to the K2. When K2 < K2TH and close to the K2TH, because of B < 0 and A + B = 0, so A ≈ 0 and A > 0. At this time, the operation point is in the left stable area and near the adhesion peak. When K2 > K2TH and close to the K2TH, because of B > 0 and A + B = 0, so A ≈ 0 and A < 0. At this time, the operation point is in the right unstable area and near the adhesion peak. Thus, K2 bounded by K2TH determines the final effect of adhesion control that wheel-rail operates in the stable area or in the unstable area near adhesion-slip peak point.
In terms of adhesion control objectives, K2 actual value shall be the K2 = K2TH − KΔ < K2TH (KΔ is stability margin) to ensure that wheel-rail runs in stable area on the left side of the adhesion peak point. The value of KΔ must take into account both the adhesion control system stability and adhesion utilization. The value of K1 should be appropriately large (excessive K1 will lead to severe fluctuation of torque) to ensure the response speed and adhesion utilization.
4. Experimental Verification
4.1. The Load Simulation Test Platform Introduction
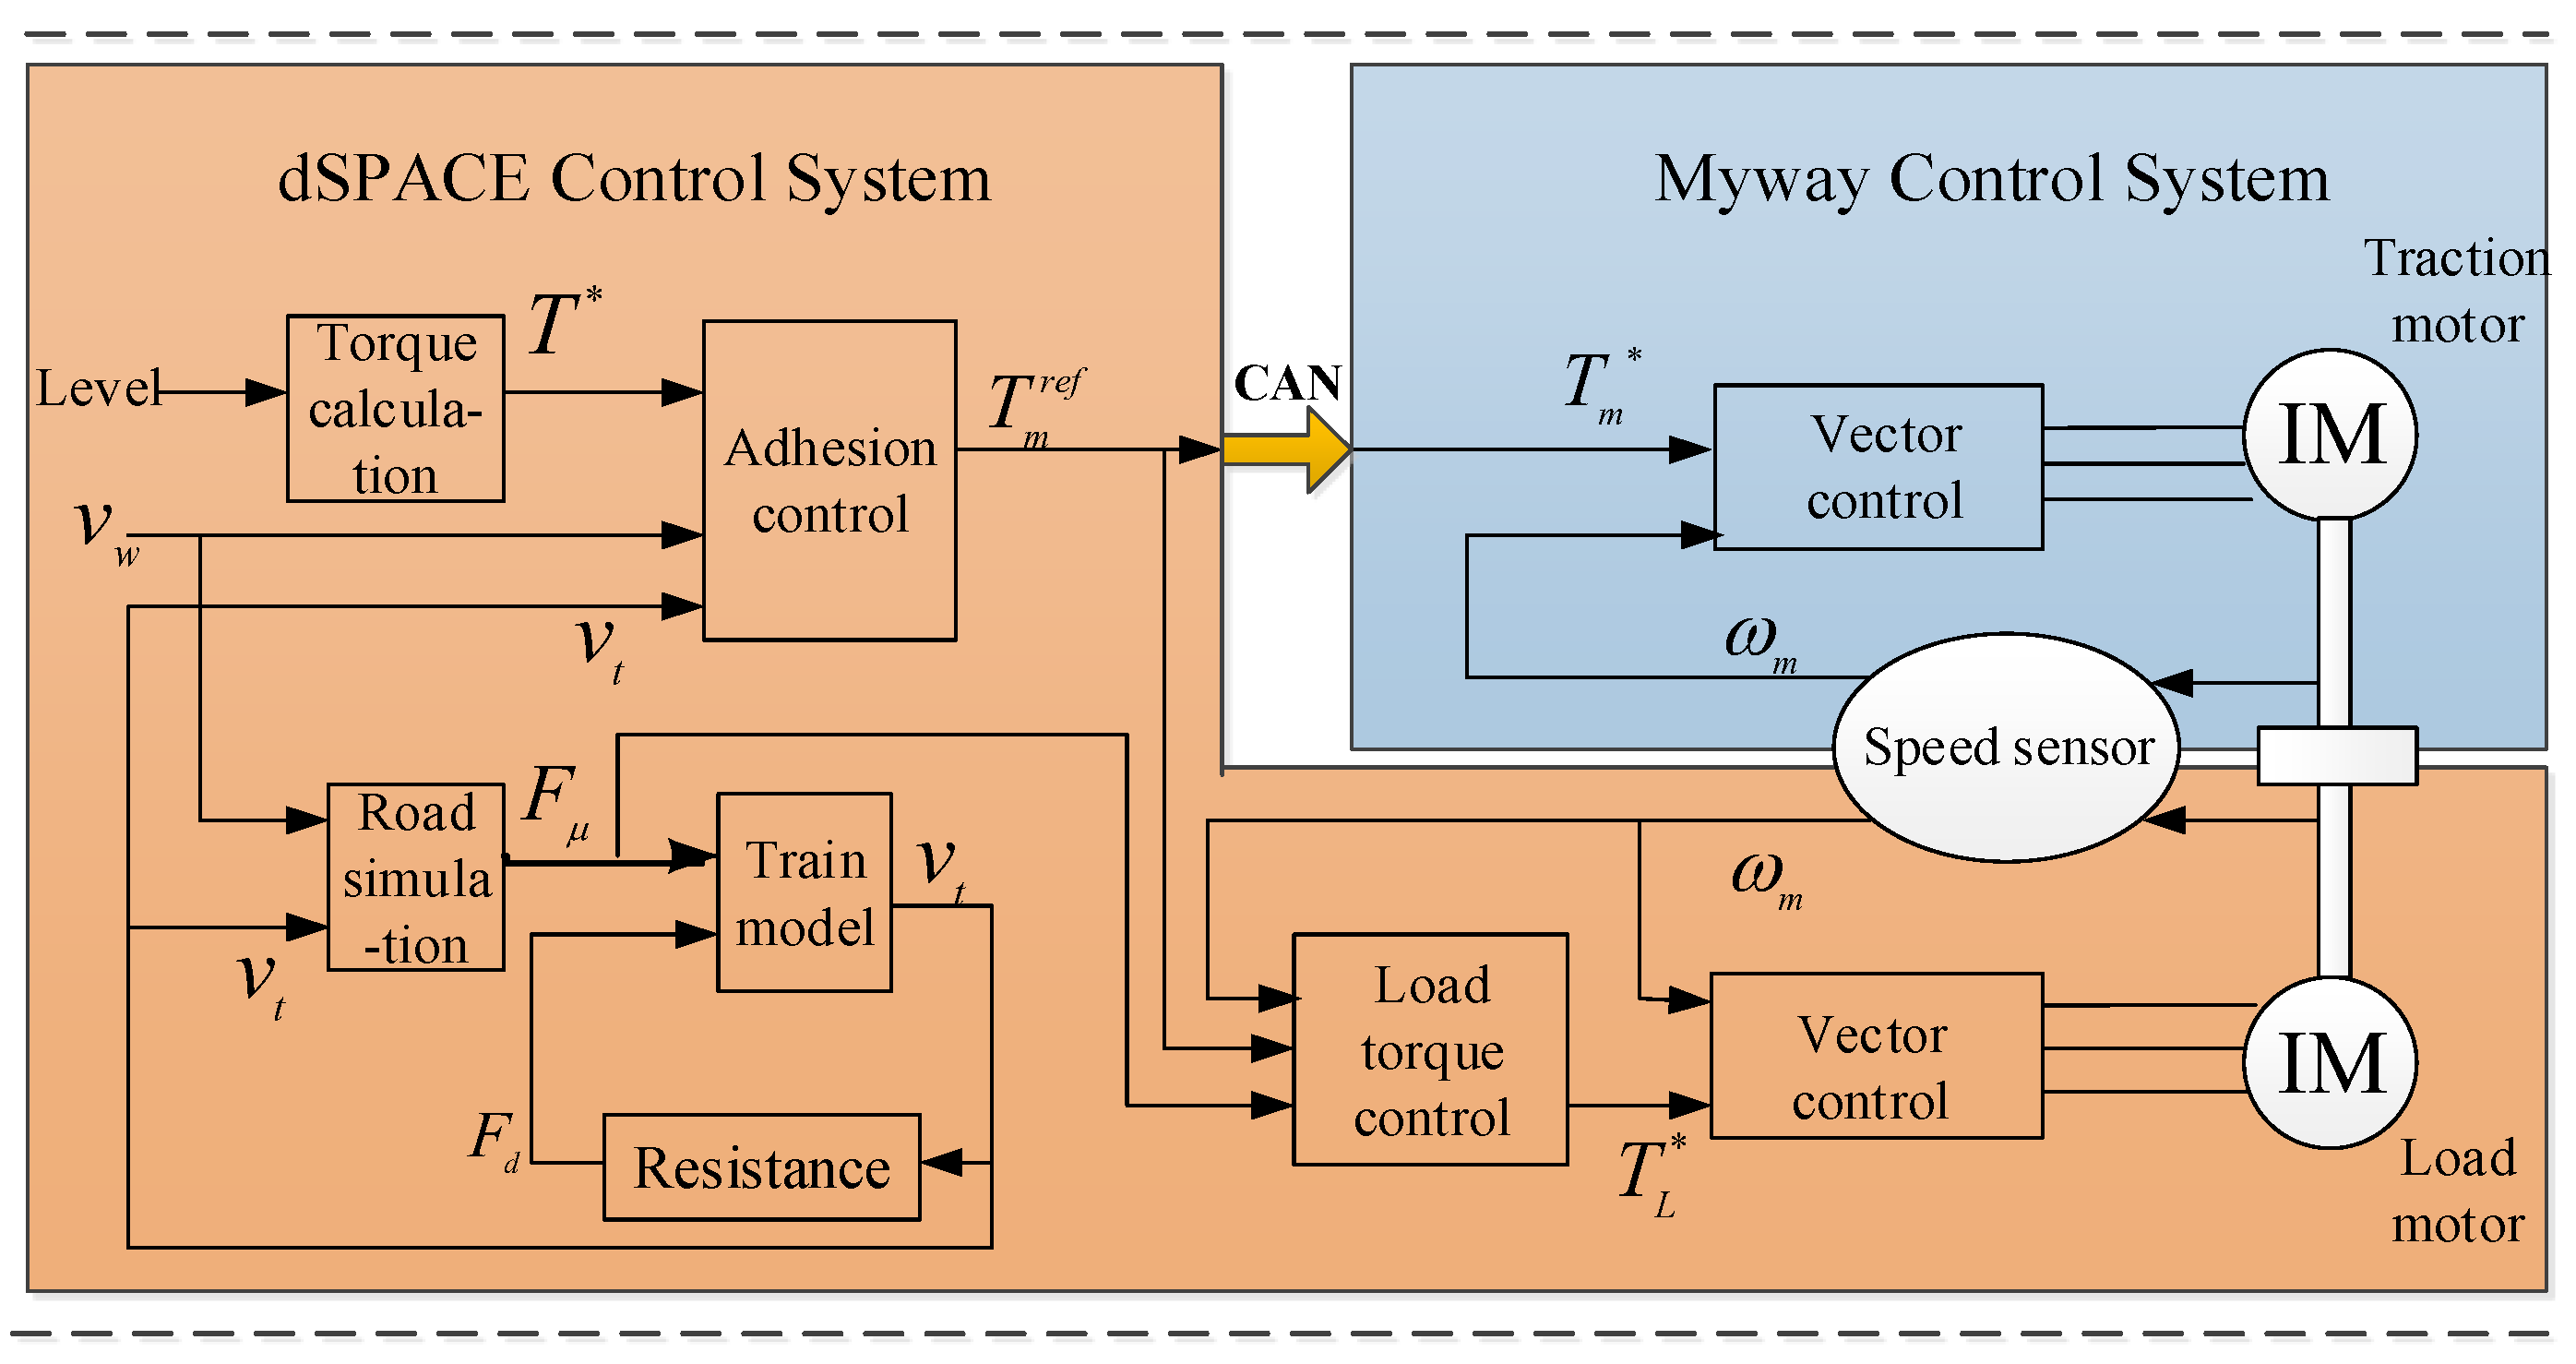
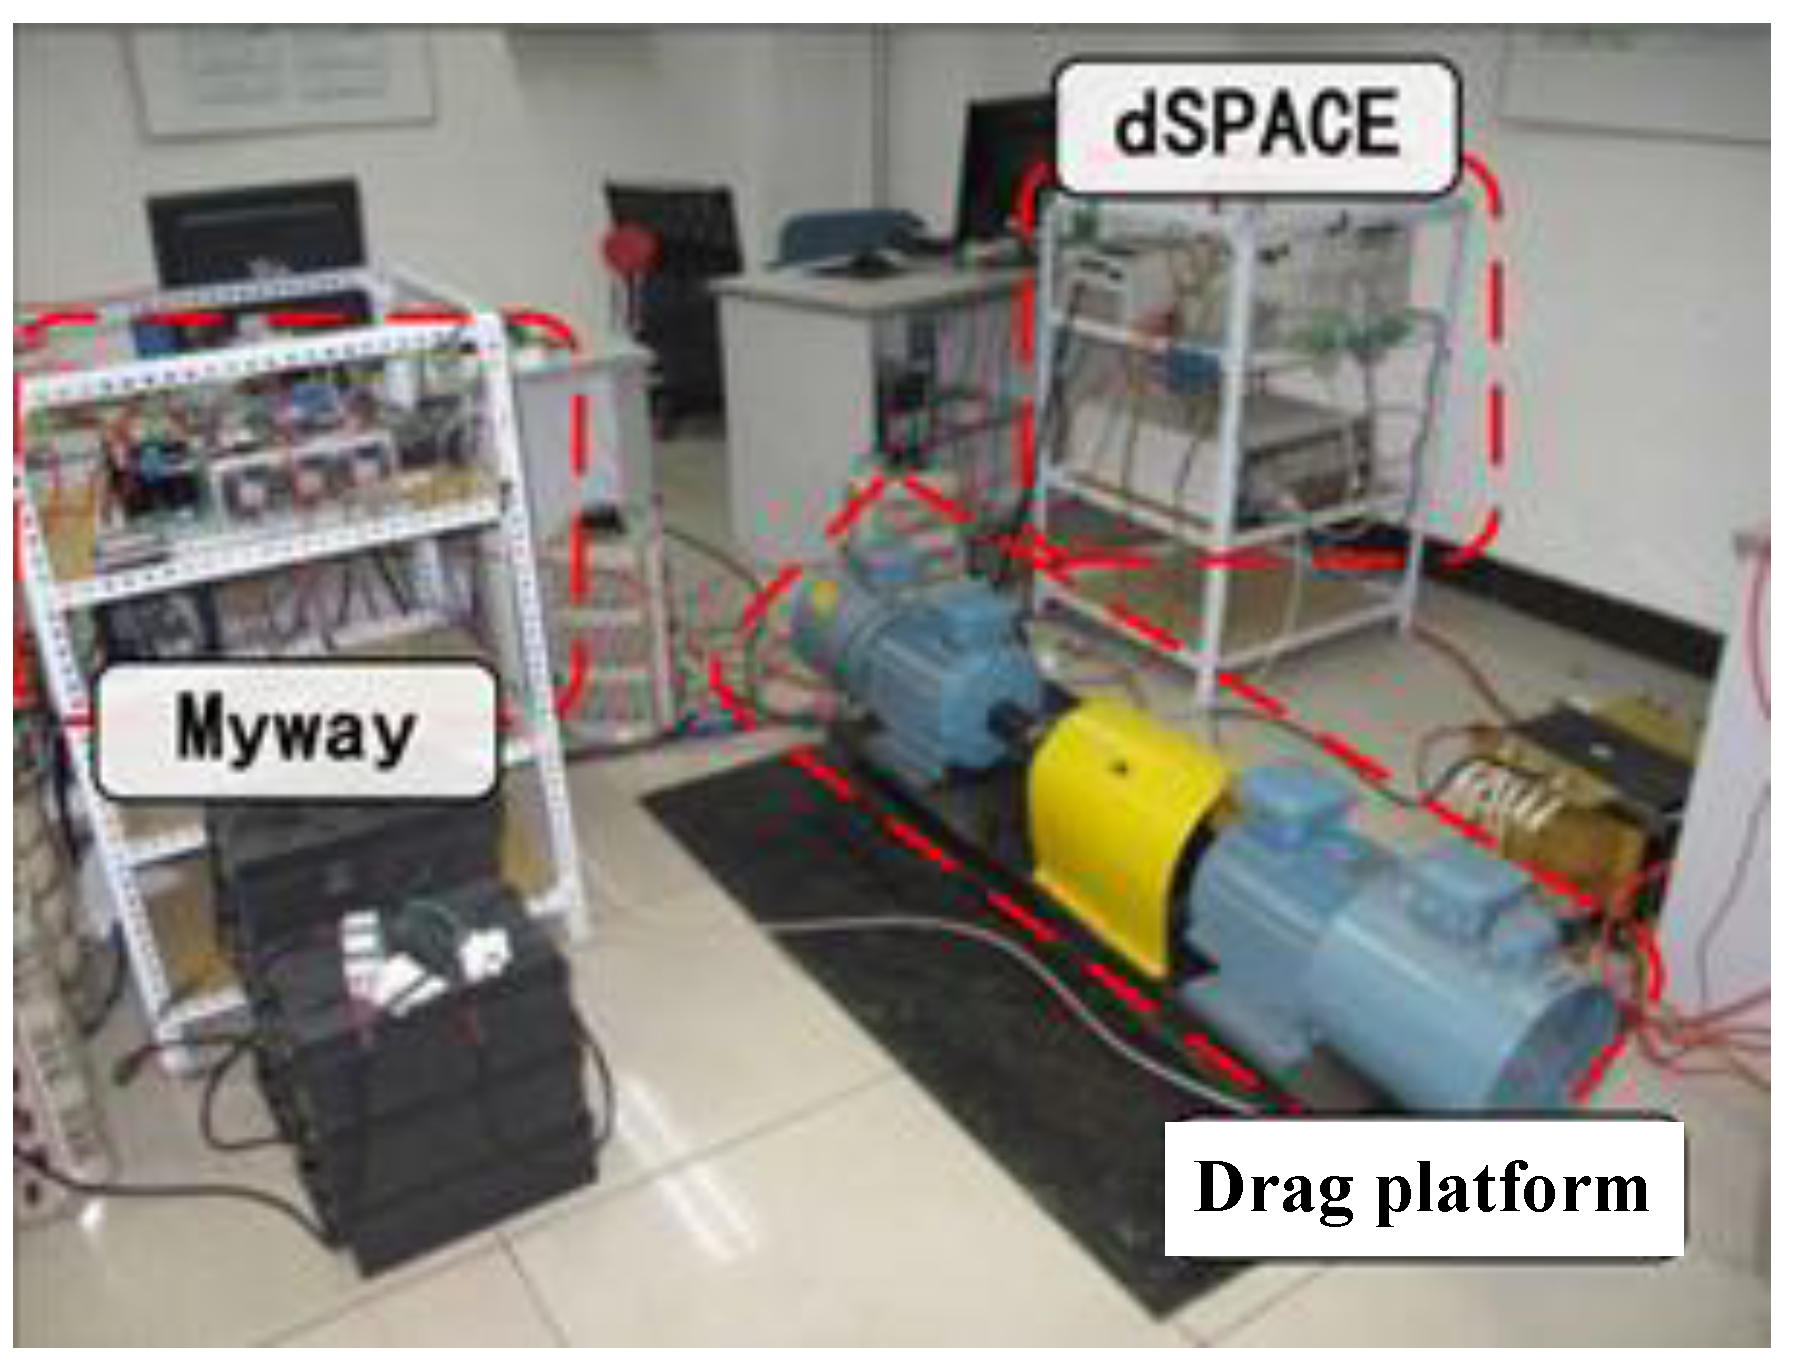
According to the traction motor equivalent mechanical Equation (7), and using the scaling principle [16], the adhesion load simulation platform can be built with a motor drag platform [17]. The traction motor is simulated by a motor and the operation load is simulated by another motor. The two coaxial motors are dragged by each other. Therefore, this paper set up a 5.5 kW adhesion load simulation platform shown in Figure 4 and Figure 5. Where, the dSPACE system controls the load motor and the Myway system controls the traction motor. The traction motor and the load motor both employ vector control. The train dynamics parameters refer to the CRH2A parameters [18].
As shown in Figure 4, the dSPACE control system mainly completes the train single axle dynamics and the wheel-rail adhesion road conditions simulation, adhesion control, load torque control and traction instruction calculation. Specifically, by calculation of the load torque, the dSPACE control system gets the load motor torque instruction value and controls the load motor to simulate the traction motor equivalent load during train operation. In addition, traction torque instruction calculated by dSPACE is sent to Myway platform through the CAN communication. Myway control system mainly realizes receiving and completing traction motor vector control. The 5.5kW platform physical structure is shown in Figure 5.
4.2. Experimental Results and Analysis
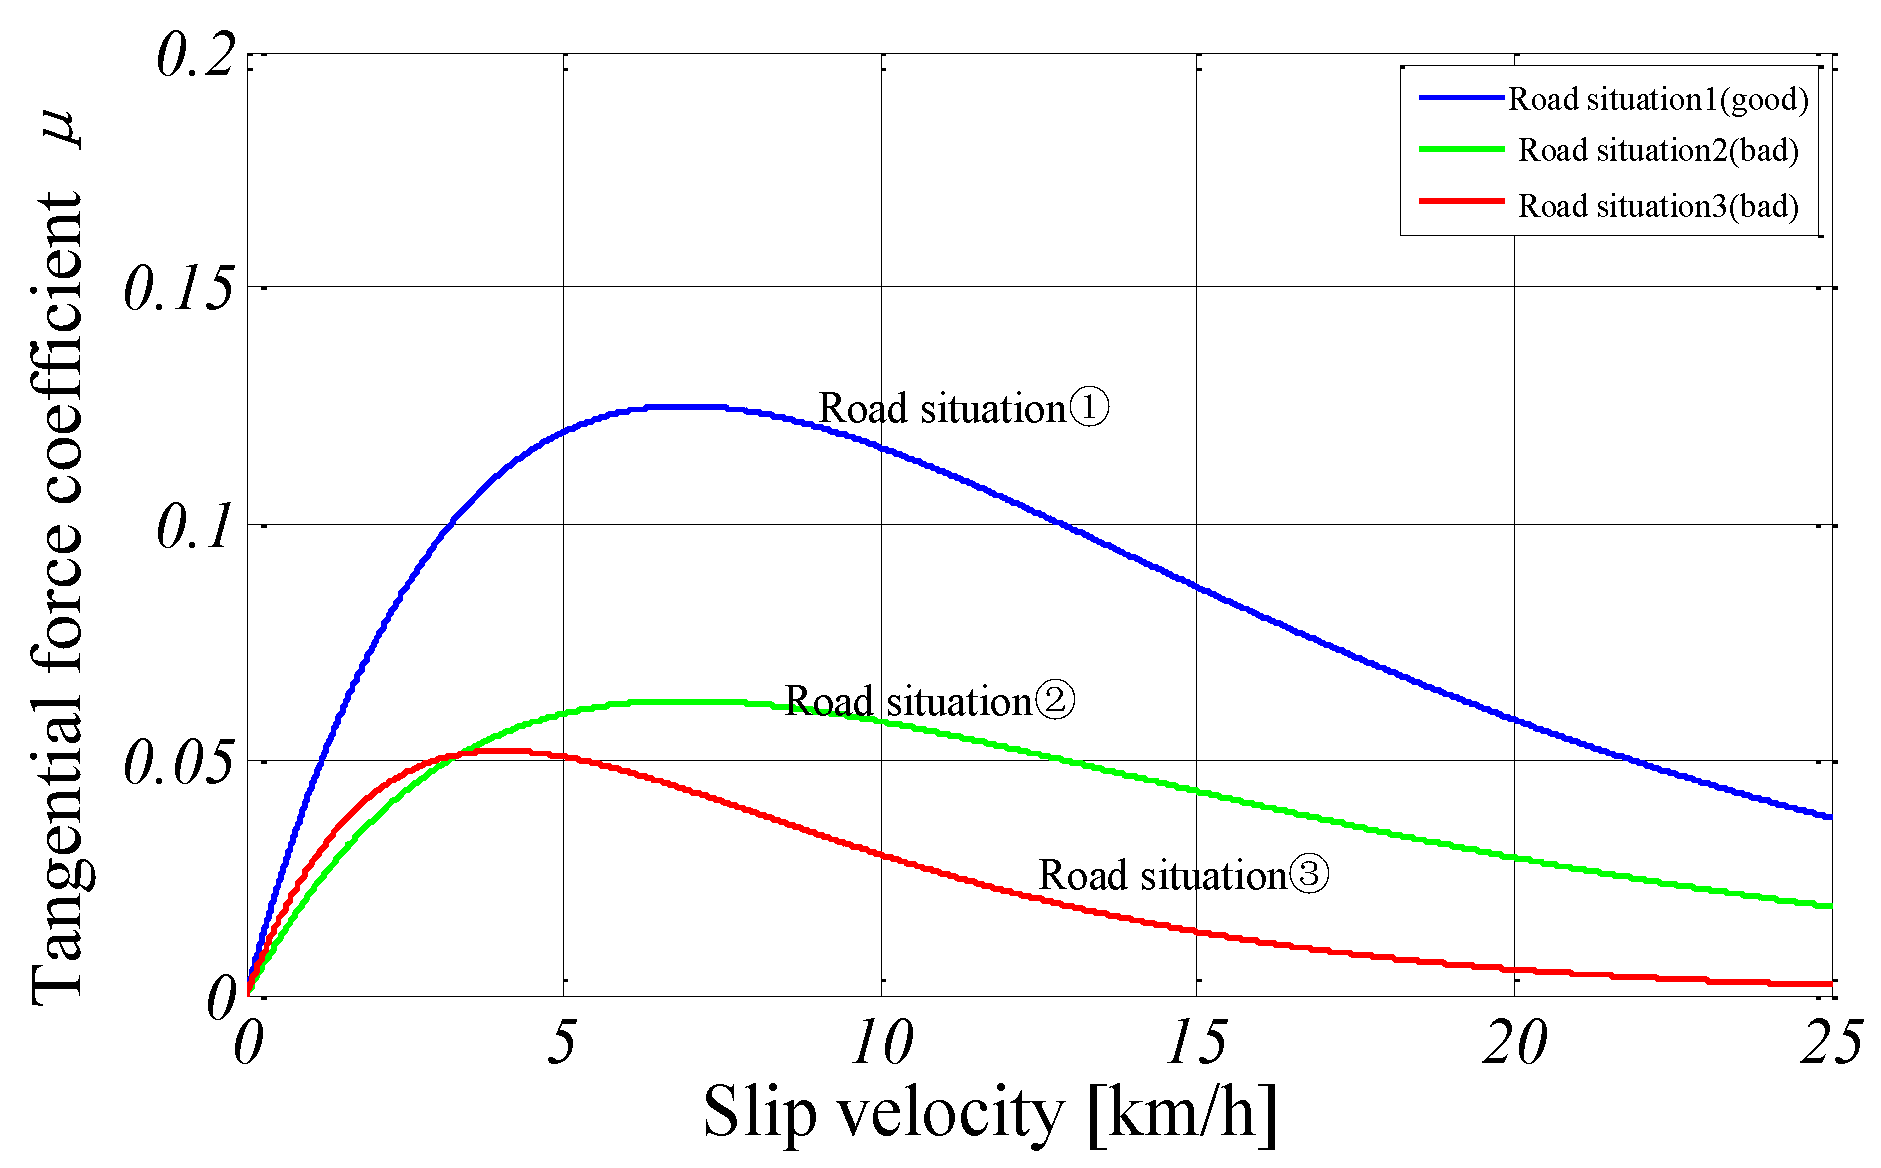
To verify the effectiveness of the proposed adhesion control method, we designed adhesion-slip characteristics of three different road conditions as shown in Figure 6 [19,20].
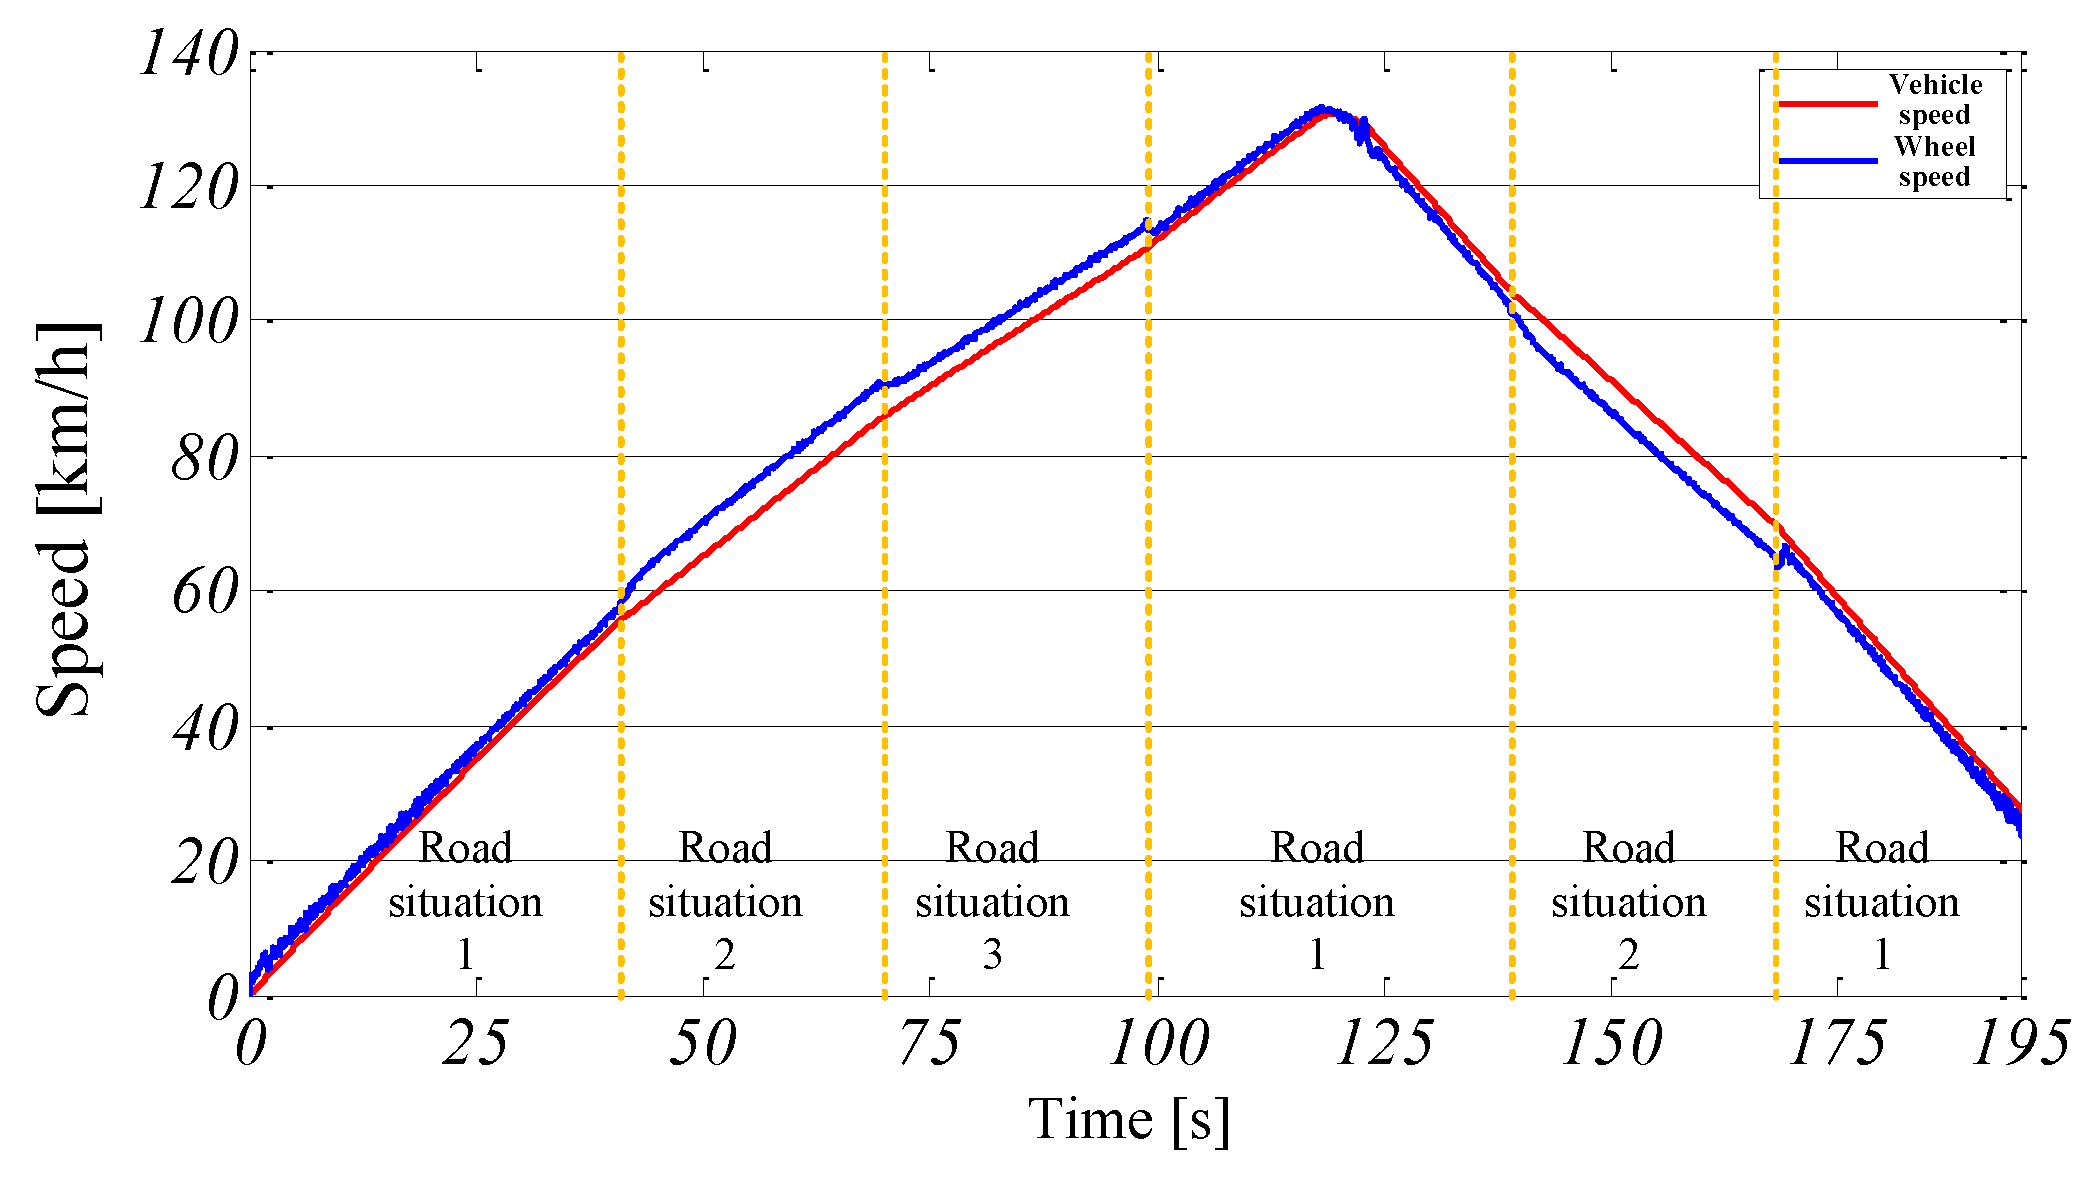
The experimental platform simulates the whole process that a train speeds up from 0 to 130 km/h (10 level of traction), then uses regenerative braking to 25 km/h. In the traction condition, in the 55~85 km/h section, road conditions rapidly change from 1 (good road condition) to poor road condition 2; in the 85~110 km/h section, road conditions deteriorate to poor road condition 3. In the braking condition, in the 105~70 km/h section, road conditions rapidly change from 1 (good road condition) to poor road condition 2.
Figure 7 is the change process of the wheel speed and vehicle speed during the above operation under the effect of adhesion control (setting control parameters K1 = 19000, K2 = 7000).
According to Figure 7, when the road condition became worse, either traction or braking, wheel speed did not sharply increase or decrease .Idling/sliding is avoided effectively due to rapid action of adhesion controller. For further analysis, the changes of variables reflecting train running state, such as motor torque and adhesion state, are shown in Figure 8, Figure 9, Figure 10, Figure 11 and Figure 12.
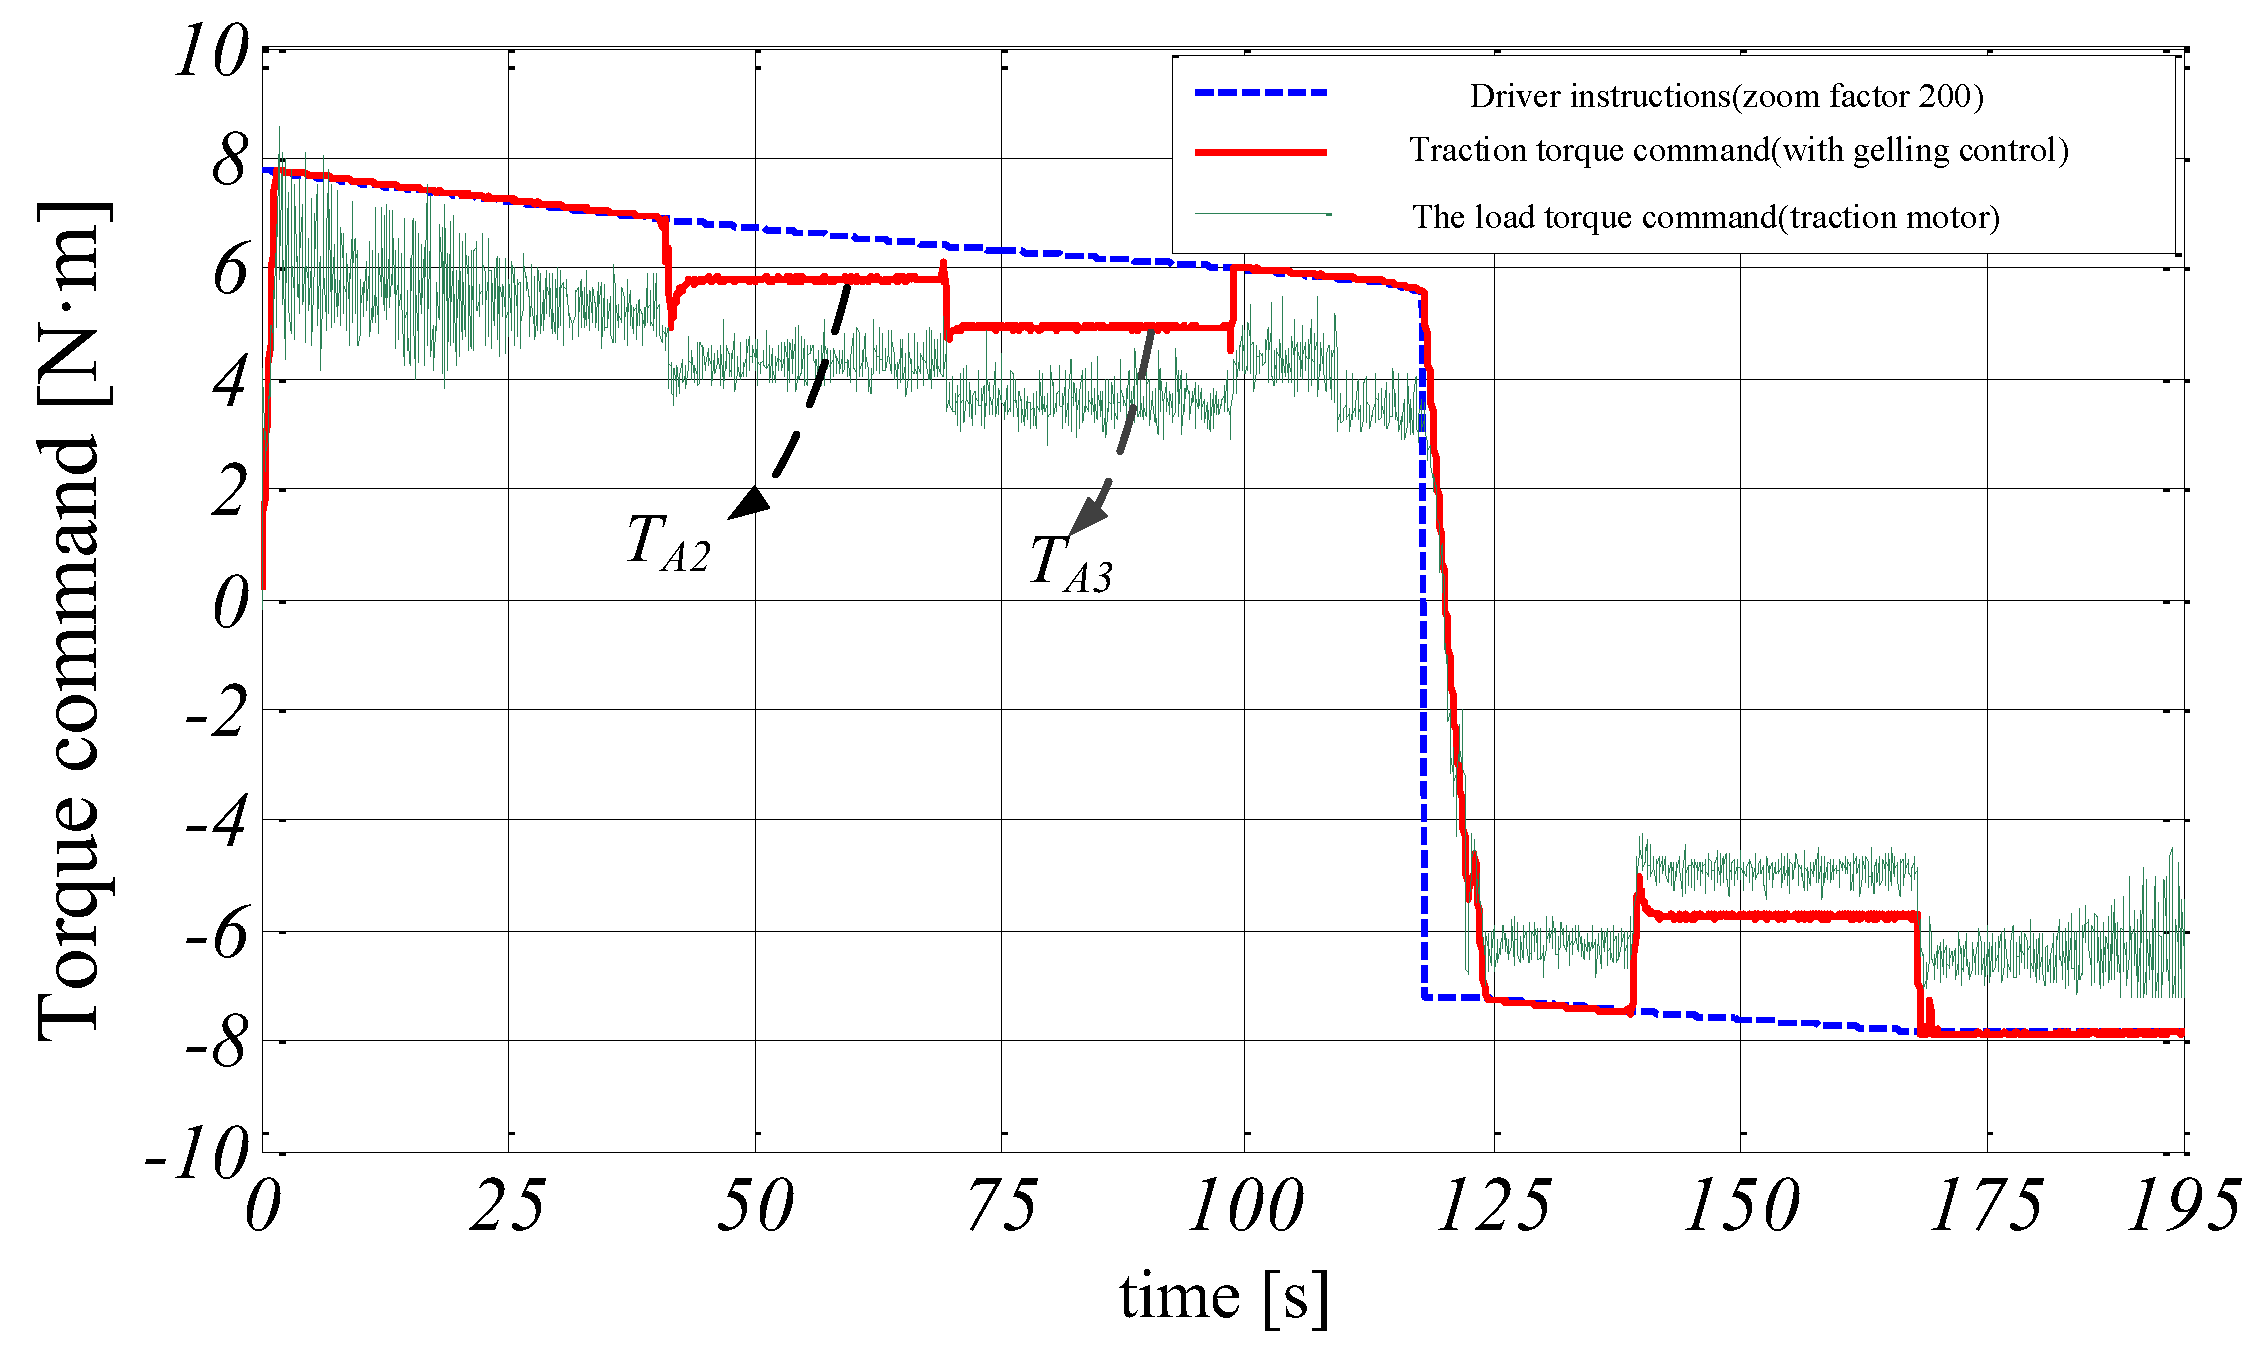
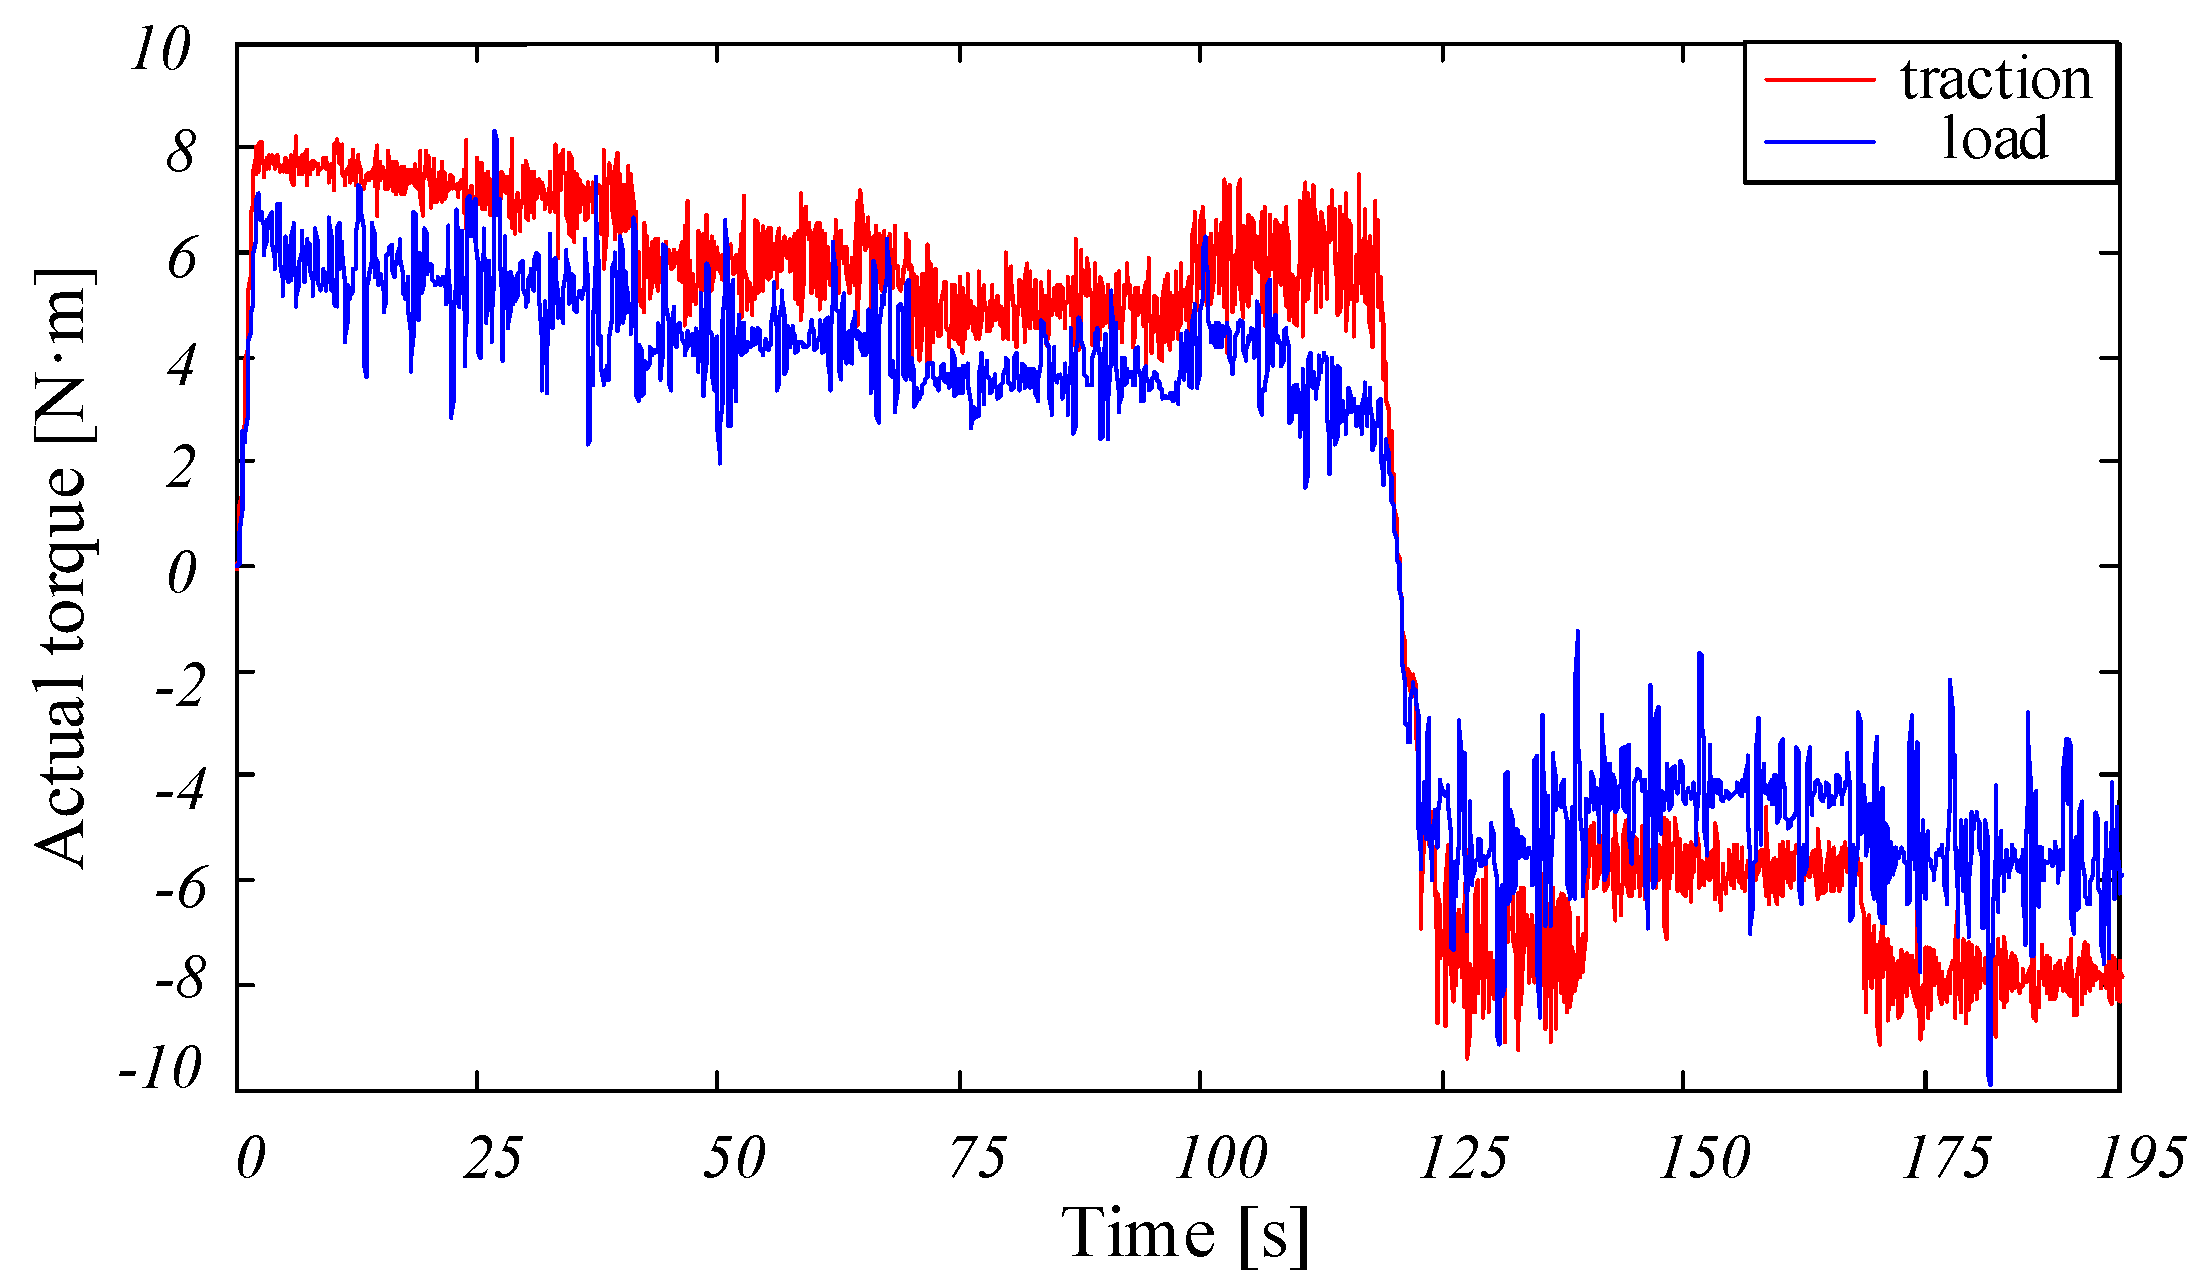
Figure 8 shows the torque instructions, and Figure 9 shows the actual value of torque. According to the figures, when the road conditions become worse, due to a low road adhesion coefficient, the wheel-rail is unable to perform given adhesion ability. Then, the adhesion controller acts rapidly. The traction motor torque instruction is adjusted to = TA for adapting to the current road adhesion state and avoiding idling-sliding. In addition, in response to different poor road conditions change (road conditions 2, 3), the adhesion controller can also achieve rapid adjustment of traction motor torque instruction (as shown in Figure 8, TA2 = 5.8 N·m and TA3 = 4.9 N·m). The controller has good dynamic performance.
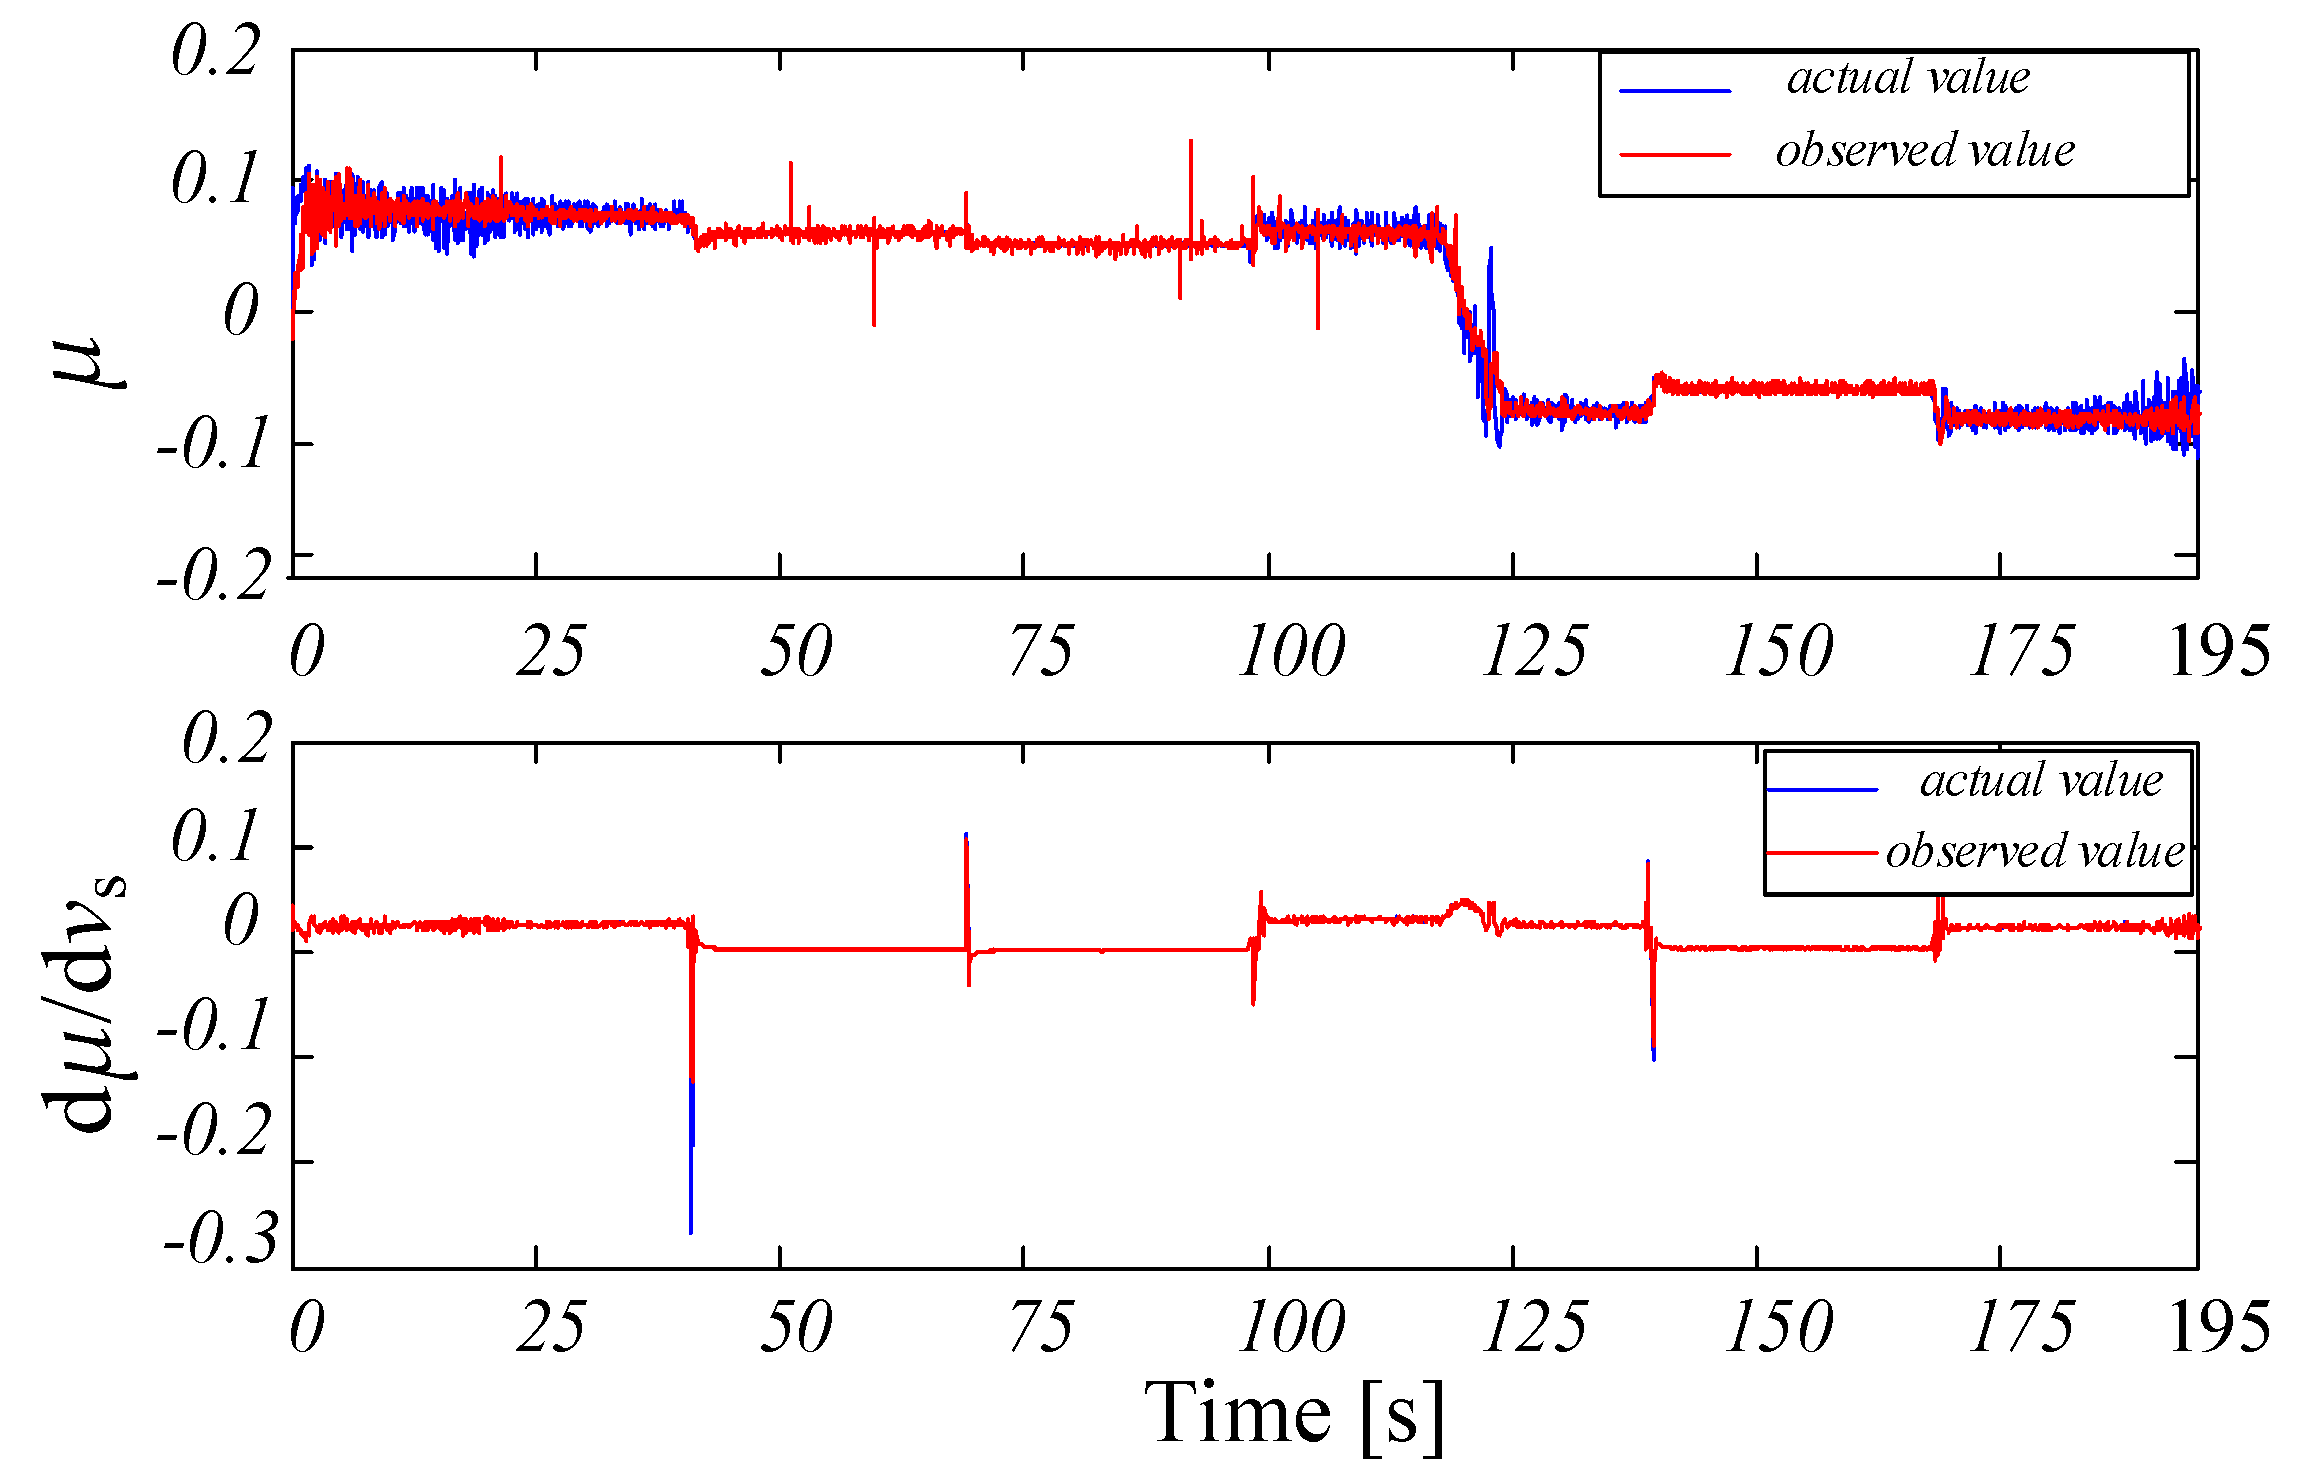
Figure 10 shows the results of the tangential force coefficient μ full dimensional observation and the adhesion-slip slope dμ/dvs RLS estimation. The observed values are in good agreement with the actual values. The observation method proposed in this paper has a good performance.
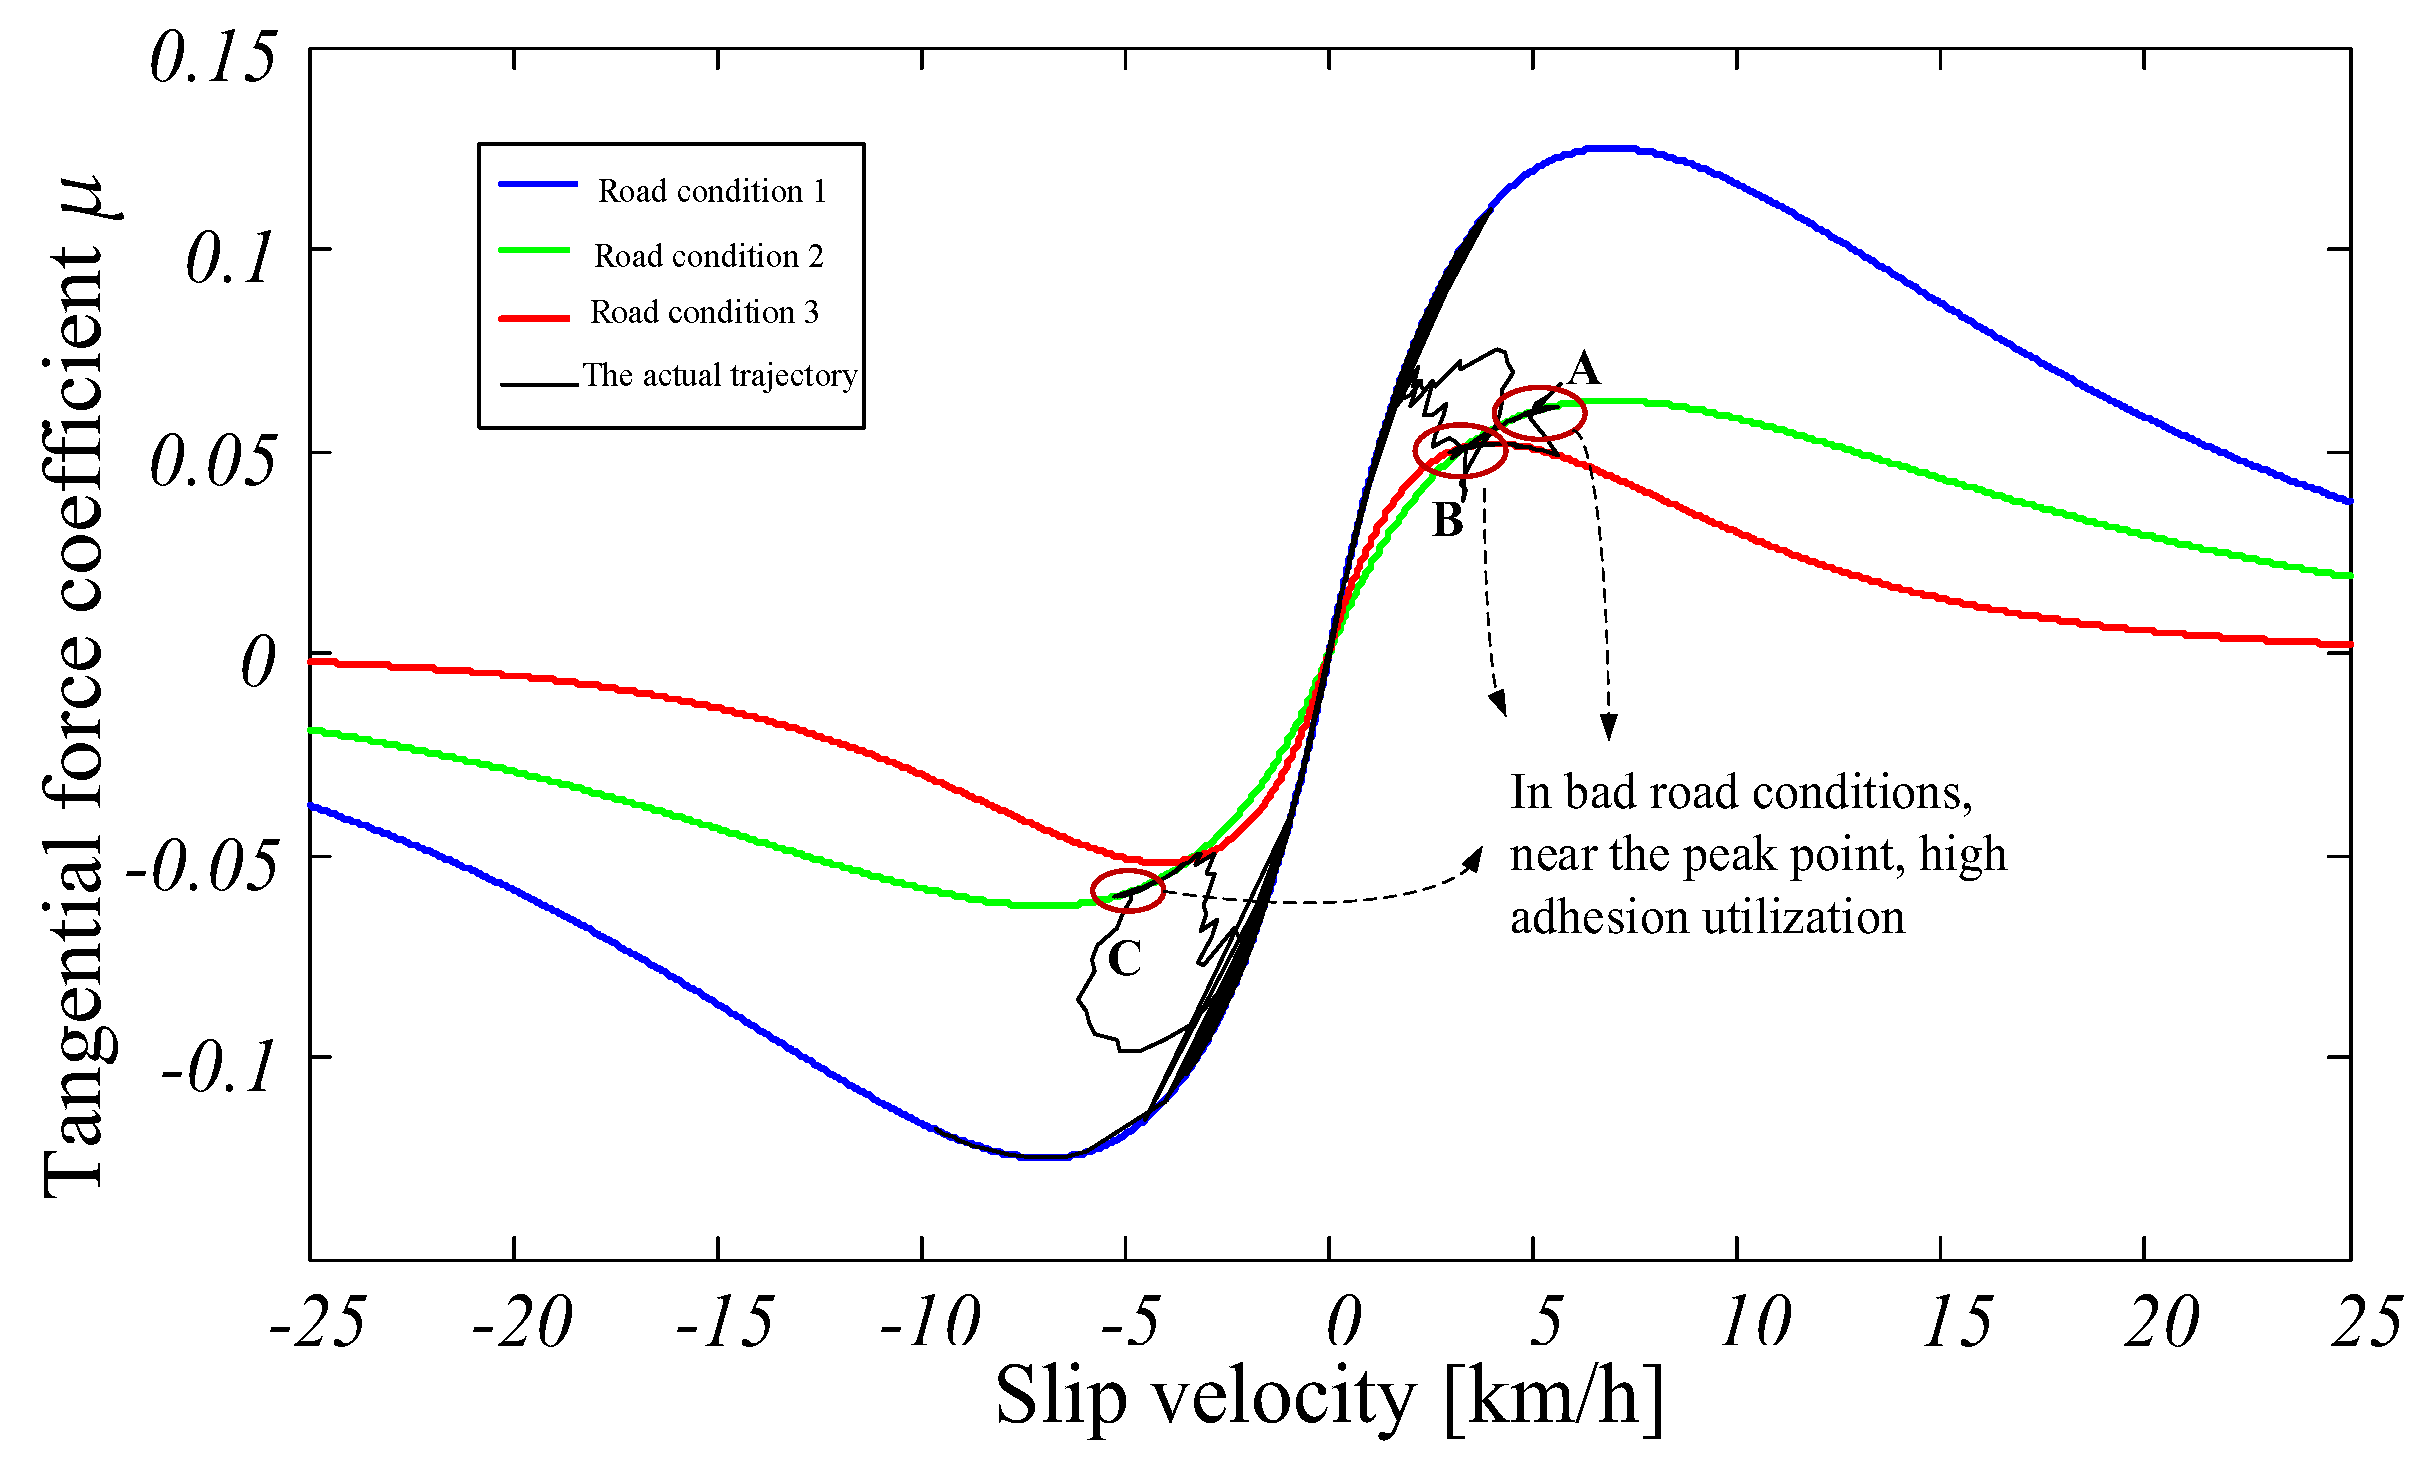
Unlike Figure 8 and Figure 9 which verify adhesion control performance by output torque, Figure 11 and Figure 12 evaluate the performance mainly from the wheel-rail adhesion-slip state in actual operation. Figure 11 describes the actual running state trajectory of μ and vs. It can be found from the figure that despite in the bad conditions 2 or 3, the wheel-rail operation area can achieve running near the peak point in the respective adhesion-slip conditions (A, B, C).
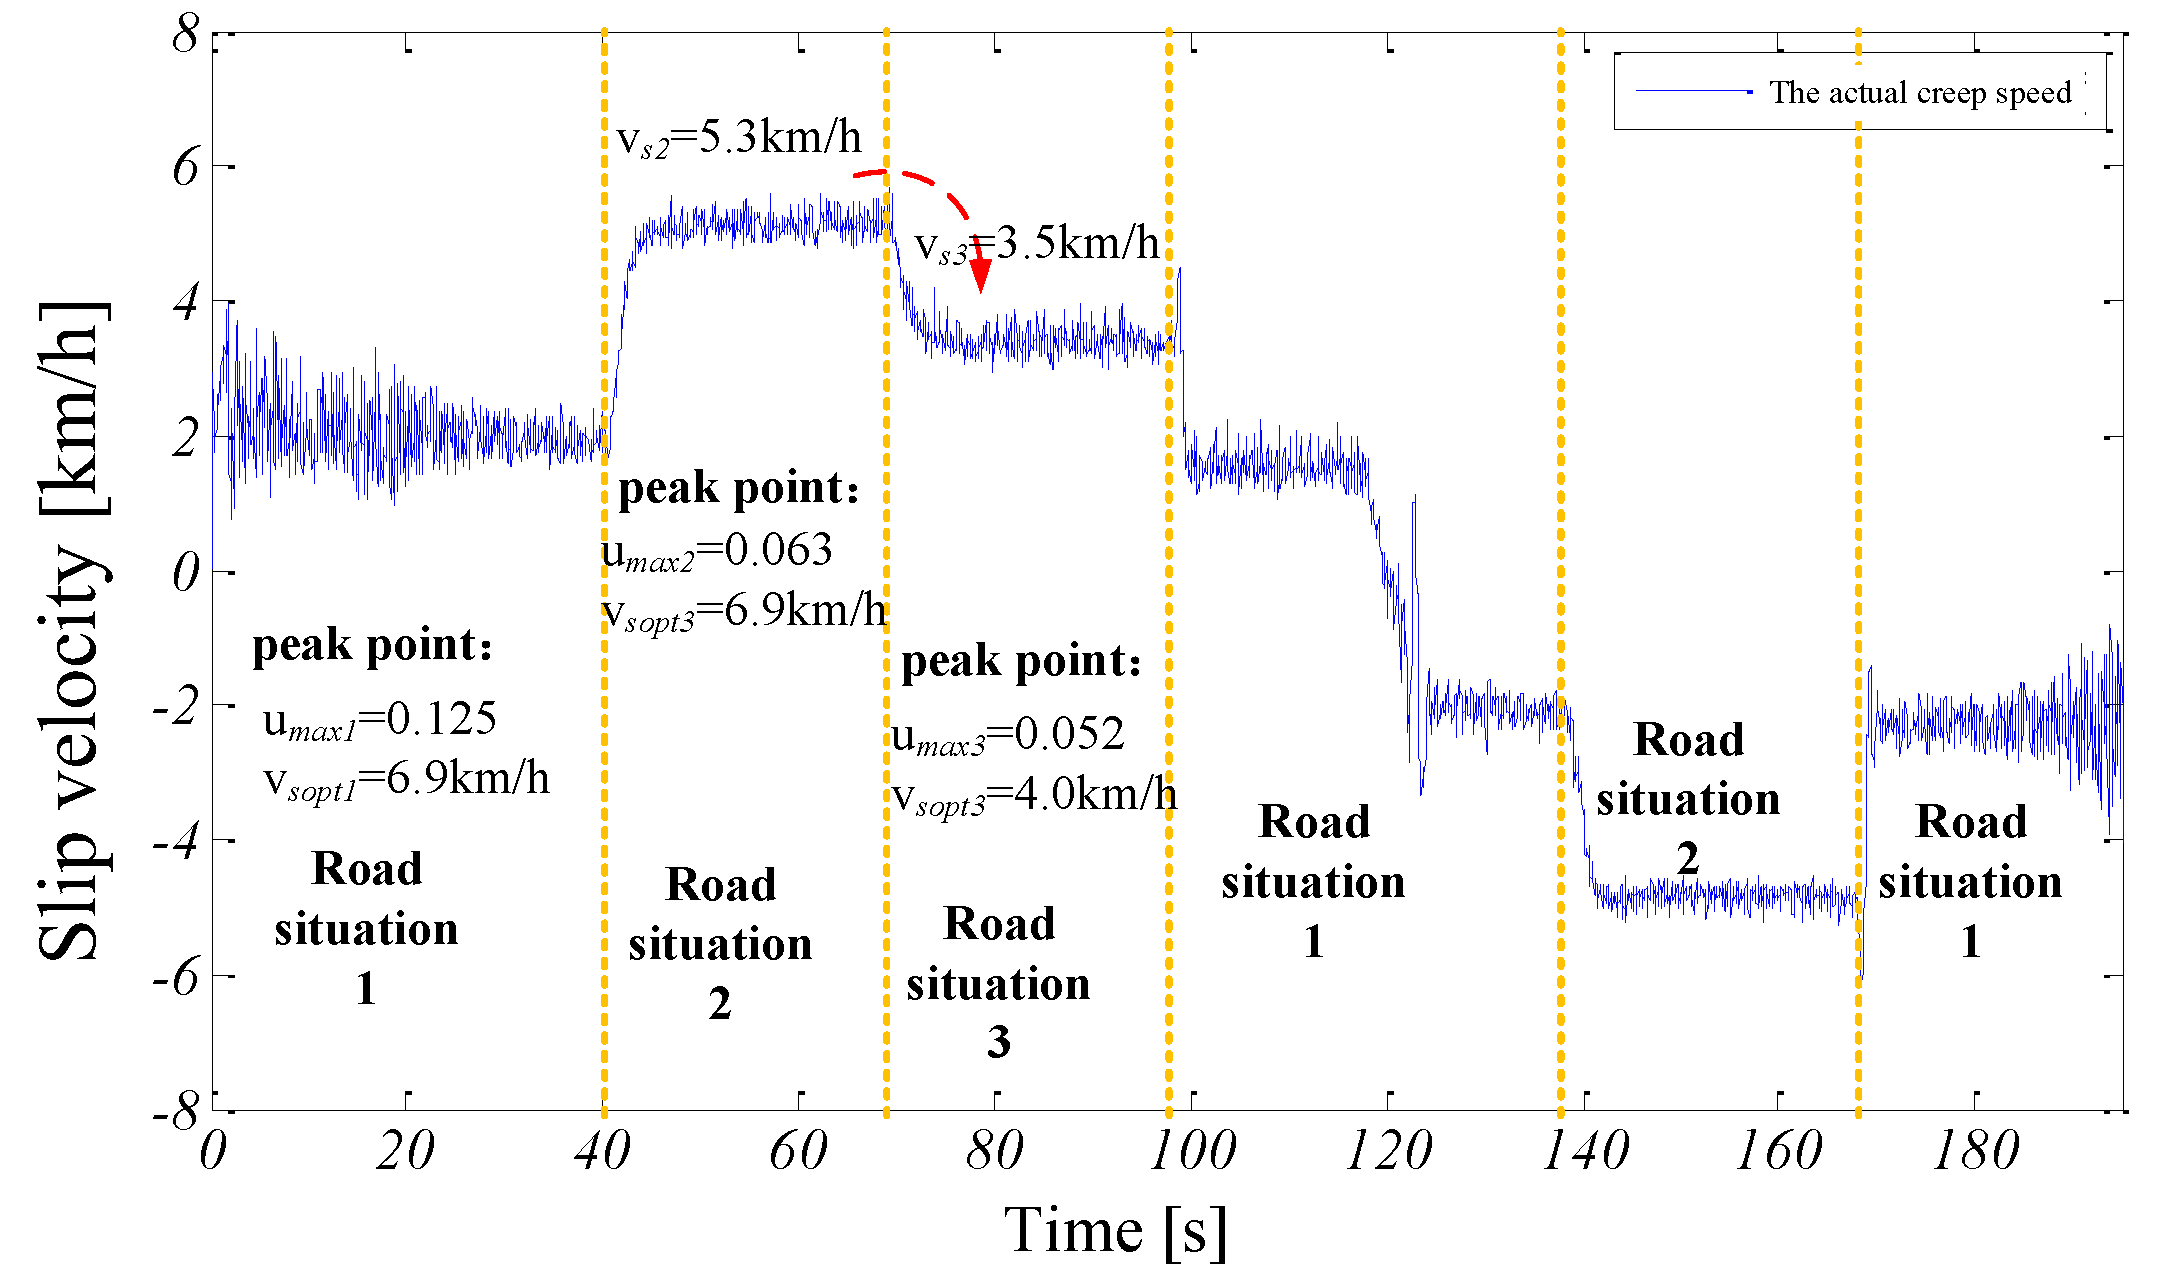
In addition, Figure 12 shows that in the traction condition, at a speed of 85 km/h, when road conditions deteriorate from poor road condition 2 to lower adhesion road condition 3, excessive slip velocity vs2 = 5.3 km/h (vs2 close to vsopt2 and bigger than vsopt3 = 4 km/h) can be suppressed rapidly, and decreased to vs3 = 3.5 km/h close to the peak point vsopt3 (vsopt3 < vsopt2). That means within a relatively short period of time after the road conditions change, the operation point is located in the unstable region of condition 3 and the operation point moves to the stable region by the proposed control. This shows that the proposed adhesion control method is still effective even if the wheel-rail operation point is in an unsteady area, and the proposed scheme can judge the operation area accurately.
5. Conclusions
This paper briefly introduces the wheel-rail adhesion characteristic, and establishes simplified single axle dynamic mathematical models of the CRH2A EMUs. Then, based on the literature [8,9], using the tangential force coefficient μ all dimension observation and the adhesion-slip slope dμ/dvs RSL estimation, this paper proposes the modified torque feedback adhesion control. Besides, this paper analyzes the feasibility of the proposed method and the setting method of control parameters K1 and K2. The experimental study of the proposed adhesion control is carried out based on the 5.5 kW induction motor drag platform using dSPACE simulation technology. According to the experimental results, the proposed adhesion control method can be achieved in different poor adhesion road conditions. The wheel-rail operation area stably nears peak point and the adhesion control is still effective in adhesion-slip unstable areas. The experimental results have confirmed the feasibility of the adhesion control method proposed in this paper.
Author Contributions
X.F., Z.Y., F.L. and L.H. conceived and developed the ideas behind the research; X.F. carried out the experiments with support from S.L., L.H. and H.S.; X.F. wrote the paper. Z.Y. and F.L. supervised the research.
Acknowledgments
This work was supported by The National Key Research and Development Program of China (No. 2017YFB1201105 and No. 2016YFB1200506-18).
Conflicts of Interest
The authors declare no conflict of interest.
References
- Ma, J.L.J.; Peng, H. Basic principle and methods of adhesion control of locomotive. Electr. Drive Locomot. 2002, 6, 4–8. [Google Scholar]
- Kadowaki, S.; Ohishi, K.; Miyashita, I.; Yasukawa, S. Re-adhesion control of electric motor coach based on disturbance observer and sensor-less vector control. In Proceedings of the Power Conversion Conference 2002 (PCC-Osaka 2002), Osaka, Japan, 2–5 April 2002; pp. 1020–1025. [Google Scholar]
- Kadowaki, S.; Ohishi, K.; Hata, T.; Iida, N.; Takagi, M.; Sano, T.; Yasukawa, S. Antislip readhesion control based on speed-sensorless vector control and disturbance observer for electric commuter train—Series 205–5000 of the east japan railway company. IEEE Trans. Ind. Electron. 2007, 54, 2001–2008. [Google Scholar] [CrossRef]
- Kwon, S.; Huh, U.; Kim, H.; Kim, J. Re-adhesion Control with Estimated Adhesion Force Coefficient for Wheeled Robot using Fuzzy Logic. In Proceedings of the 30th Annual Conference of IEEE Industrial Electronics Society 2004 (IECON 2004), Busan, Korea, 2–6 November 2004; pp. 2530–2535. [Google Scholar]
- Spiryagin, M.; Lee, K.; Hong, H. Control system for maximum use of adhesive forces of a railway vehicle in a tractive mode. Mech. Syst. Signal Process. 2008, 22, 709–720. [Google Scholar] [CrossRef]
- Chen, Z.; Zeng, J.; Luo, R. Traction adhesion control and simulation for railway train. Mod. Manuf. Eng. 2009, 6, 8–12. [Google Scholar]
- Lin, W.; Zhao, L.; Dong, K. Performance Analysis of Re-adhesion Optimization Control Based on Full-dimension State Observer. Proced. Eng. 2011, 23, 531–536. [Google Scholar]
- Ohishi, K.; Nakano, K.; Miyashita, I.; Yasukawa, S. Anti-Slip Control of Electric Motor Coach Based on Disturbance observer. In Proceedings of the 1998 5th International Workshop on Advanced Motion Control (AMC’98-Coimbra), Coimbra, Portugal, 29 June–1 July 1998; pp. 580–585. [Google Scholar]
- Ohishi, K.; Nakano, K.; Miyashita, I.; Yasukawa, S. Anti-slip Re-adhesion Control of Electric Motor Coach Based on Force Control using Disturbance Observer. In Proceedings of the 2000 IEEE Industry Applications Conference, Rome, Italy, 8–12 October 2000; pp. 1001–1007. [Google Scholar]
- Verhille, J.; Bouscayrol, A.; Barre, P.; Mercieca, J.; Hautier, J.; Semail, E. Torque tracking strategy for antislip control in railway traction systems with common supplies. In Proceedings of the 39th IAS Annual Meeting Industry Applications Conference, Seattle, WA, USA, 3–7 October 2004; pp. 2738–2745. [Google Scholar]
- Verhille, J.; Bouscayrol, A.; Barre, P.; Hautier, J. Validation of anti-slip control for traction system using hardware-in-the-loop simulation. In Proceedings of the IEEE Vehicle Power and Propulsion Conference 2007 (VPPC 2007), Arlington, TX, USA, 9–12 September 2007; pp. 440–447. [Google Scholar]
- Verhille, J.; Bouscayrol, A.; Barre, P.; Hautier, J. Hardware-in-the-loop simulation of the traction system of an automatic subway. In Proceedings of the 2007 European Conference on Power Electronics and Applications, Aalborg, Denmark, 2–5 September 2007; pp. 1–9. [Google Scholar]
- Lin, W.; Diao, L.; Zhang, G.; Chen, D.; Li, Z. Maximum Adhesion Force Control Simulated Model of Electric Locomotive. In Proceedings of the 2007 International Conference on Automation and Logistics, Jinan, China, 18–21 August 2007; pp. 1704–1708. [Google Scholar]
- Lin, W.; Liu, Z.; Fang, Y. Re-adhesion Optimization Control Strategy for Metro Traction. J. Southwest Jiaotong Univ. 2012, 47, 465–470. [Google Scholar]
- Sado, H.; Sakai, S.; Hori, Y. Road Condition Estimation for Traction Control in Electric Vehicle. In Proceedings of the IEEE International Symposium on Industrial Electronics (ISIE 1999), Bled, Slovenia, 12–16 July 1999; pp. 973–978. [Google Scholar]
- Li, S.; Lu, F.; Yang, Z. Torque Control in Traction Motor Load Simulation System. Electr. Drive 2010, 40, 52–56. [Google Scholar]
- Qin, J. Braking Force Redistribution Strategy Research of High-Speed Train When Slide. Master’s Thesis, Beijing Jiaotong University, Beijing, China, 2013. [Google Scholar]
- Zhang, S. CRH2EMU; China Railway Publishing House: Beijing, China, 2008; pp. 9–42. [Google Scholar]
- Ishikawa, Y.; Kawamura, A. Maximum Adhesive Force Control in Super High Speed Train. In Proceedings of the IEEE Power Conversion Conference 1997, Nagaoka, Japan, 6 August 1997; pp. 3–6. [Google Scholar]
- Cao, M.; Takeuchi, K.; Furuya, T.; Kawamura, A. Adhesion Control in Low-Speed Region and Experiment Verification with Considering Low-Resolution Pulse Generator. In Proceedings of the IEEE Power Conversion Conference 2002, Osaka, Japan, 2–5 April 2002; pp. 873–878. [Google Scholar]
Figure 1.
Adhesion-slip phenomenon and adhesion-slip characteristic curve.

Figure 2.
The simplified traction force transferring model for single axle.

Figure 3.
The diagram of modified adhesion control algorithm for high-speed train.

Figure 4.
The block diagram of the 5.5 kW adhesion load simulation experimental platform.

Figure 5.
The 5.5 kW semi-physical adhesion load simulation platform.

Figure 6.
Adhesion-slip characteristic curves under different road conditions.

Figure 7.
The changing of train speed and wheel speed.

Figure 8.
The torque command of traction motor and load motor.

Figure 9.
The actual torque of traction motor and load motor.

Figure 10.
The observed value of μ and dμ/dvs.

Figure 11.
The actual running track of μ-vs.

Figure 12.
The change of vs.

© 2018 by the authors. Licensee MDPI, Basel, Switzerland. This article is an open access article distributed under the terms and conditions of the Creative Commons Attribution (CC BY) license (http://creativecommons.org/licenses/by/4.0/).
Share and Cite
MDPI and ACS Style
Fang, X.; Lin, S.; Yang, Z.; Lin, F.; Sun, H.; Hu, L. Adhesion Control Strategy Based on the Wheel-Rail Adhesion State Observation for High-Speed Trains. Electronics 2018, 7, 70. https://doi.org/10.3390/electronics7050070
AMA Style
Fang X, Lin S, Yang Z, Lin F, Sun H, Hu L. Adhesion Control Strategy Based on the Wheel-Rail Adhesion State Observation for High-Speed Trains. Electronics. 2018; 7(5):70. https://doi.org/10.3390/electronics7050070
Chicago/Turabian StyleFang, Xiaochun, Shuai Lin, Zhongping Yang, Fei Lin, Hu Sun, and Liang Hu. 2018. "Adhesion Control Strategy Based on the Wheel-Rail Adhesion State Observation for High-Speed Trains" Electronics 7, no. 5: 70. https://doi.org/10.3390/electronics7050070
Note that from the first issue of 2016, this journal uses article numbers instead of page numbers. See further details here.