Article

MWCNT–Epoxy Nanocomposite Sensors for Structural Health Monitoring

1
School of Mechanical Engineering, College of Engineering, University of Tehran, Tehran 1417466191, Iran
2
Institute of Smart Systems Technologies, Alpen-Adria-Universität Klagenfurt, 9020 Klagenfurt, Austria
3
CTR Carinthian Tech Research AG, 9524 Villach, Austria
4
Mechanical Engineering Department, Carinthian University of Applied Sciences, 9524 Villach, Austria
*
Author to whom correspondence should be addressed.
Electronics 2018, 7(8), 143; https://doi.org/10.3390/electronics7080143
Submission received: 22 July 2018 / Revised: 5 August 2018 / Accepted: 7 August 2018 / Published: 9 August 2018
(This article belongs to the Special Issue Innovative Technologies and Services for Smart Cities)

Abstract

:
We address multi-walled carbon nanotubes (MWCNTs) for structural health monitoring in adhesive bonds, such as in building structures. MWCNT-loaded composites are employed to sense strain changes under tension load using an AC impedance measurement setup. Different weight percentages of 1, 1.5, 2 and 3 wt % MWCNTs are added to the base epoxy resin using different dispersion times, i.e., 5, 10, and 15 min. The equivalent parallel resistance of the specimens is first measured by applying an alternating voltage at different frequencies. To determine the mechanical as well as sensory properties, the specimens are then subjected to a tensile test with concurrent impedance measurement at a fixed pre-chosen frequency. Using alternating voltage, a higher sensitivity of the impedance reading can be achieved. Employing these sensors in buildings and combining the readings of a network of such devices can significantly improve the buildings’ safety. Additionally, networks of such sensors can be used to identify necessary maintenance actions and locations.

1. Introduction

The aim to fabricate smart composite structures to improve safety and to monitor structures as part of our living environment has resulted in a major research effort regarding the composition and performance of composites based on advanced materials. Advanced materials are used to fabricate smart sensors based on carbon particles, such as carbon fibers, carbon blocks, graphite [1,2], and also multi-walled carbon nanotubes (MWCNTs). MWCNTs have distinctive mechanical and electrical properties. They provide a unique potential to improve the mechanical [3,4,5] as well as electrical properties [6,7,8,9,10] of polymer–matrix composites. MWCNT–epoxy adhesives are used for applications such as electronic devices, smart adhesive joints in buildings and bus structures [11,12,13], and gas sensors [14]. In [3], the authors study the tensile behavior of carbon nanotubes (CNT)-loaded epoxy nanocomposite films, and report that, by adding CNTs to the polymer matrix, the tensile modulus, yield strength, and ultimate strength of the final polymer films can be increased. In [7], the electrical properties of CNT–epoxy nanocomposites were improved by surface treatment of the CNT specimens. A comparison of the electrical and mechanical properties of various carbon-loaded composites with a focus on their piezo-resistive properties is presented in [15].
The changes in the electrical resistance result from deformations and failures within the polymer matrix when the composites are subjected to mechanical loading [16,17,18]. The two predominant factors governing the resulting resistance are as follows [19]: first, the contact between two adjacent carbon nanotubes, which might be broken; second, the change in the tunneling resistance between two adjacent carbon nanotubes due to variation of the distance between them. A detailed elaboration of the mechanisms governing the change of the electrical resistance of MWCNT–epoxy nanocomposites under mechanical stress is given in [20]. Based on these changes in electrical resistance, MWCNT thin films have been employed for damage sensing [21,22,23], and CNT-loaded composites were suggested as strain sensors in the industrial sector for health monitoring [24,25,26].
It has further been shown that the morphological properties of carbon nanoparticles influence the response of the respective nanocomposite sensors [27]. The nanocomposite sensors are comprised of conductive networks or agglomerates distributed within the polymer matrix, where MWCNT form 1-D structures. The network conductivity is further affected by the weight percentage of the nanoparticles, mutual interactions between them, and their state of dispersion in the polymer matrix [28,29], which strongly depend on the preparation and activation process.
In this work, we present a study which investigates the influence of weight percentage of MWCNT and its dispersion time on the alternating current (AC) impedance. This AC impedance measurement can provide higher sensitivity by considering, also, the electrostatic properties of the material. Considering also such frequency dependent parameters, the sensing functionality of MWCNT–epoxy composites can thus be exploited or even improved, investing less energy. This presents a novelty compared to aforementioned studies, where direct current (DC) measurement is employed to determine the electrical properties of the considered specimens.
Low necessary energy facilitates the design of autarkic sensor systems [30] to monitor building structures. Using technologies such as transducer electronic data sheets (TEDS) [31], these devices can additionally be integrated into modern building automation facilities. There, a network of such sensors can provide information on the health state of a building and indicate necessary maintenance.
In Section 2, the material and equipment needed for the preparation method, as well as the mechanical and electrical testing of the nanocomposites, is presented. First, the preparation method, which consists of only basic steps, such as mixing and deagglomeration, is introduced. Then, the tensile testing machine and the electrical impedance measurement for, first, the percolation threshold, and secondly, during the tensile testing, are described. In Section 3, the results of the percolation threshold measurements and tensile testing are described, then the microstructure of the nanocomposites is presented based on scanning electron microscopy (SEM) images. Finally, in Section 4, concluding remarks on the presented study are given.

2. Materials and Methods

2.1. Materials

The base of the prepared nanocomposites is epoxy as matrix, and MWCNTs as the conductive nanofiller. The used epoxy resin is EpoThin® (Buehler, Braunschweig, Germany), a free-flowing, low viscosity, low shrinkage epoxy resin which allows the nanofiller to easily distribute in the EpoThin matrix. It has a typical cure time of nine hours at 27 °C, according to the manufacturer datasheet. MWCNT conductive nanoparticles by Cheaptube (Grafton, VT, USA) were used. The outer diameter of the considered MWCNT is 30 to 50 nm. The length of the used MWCNT is between 10 to 20 µm, with a purity of more than 95%.

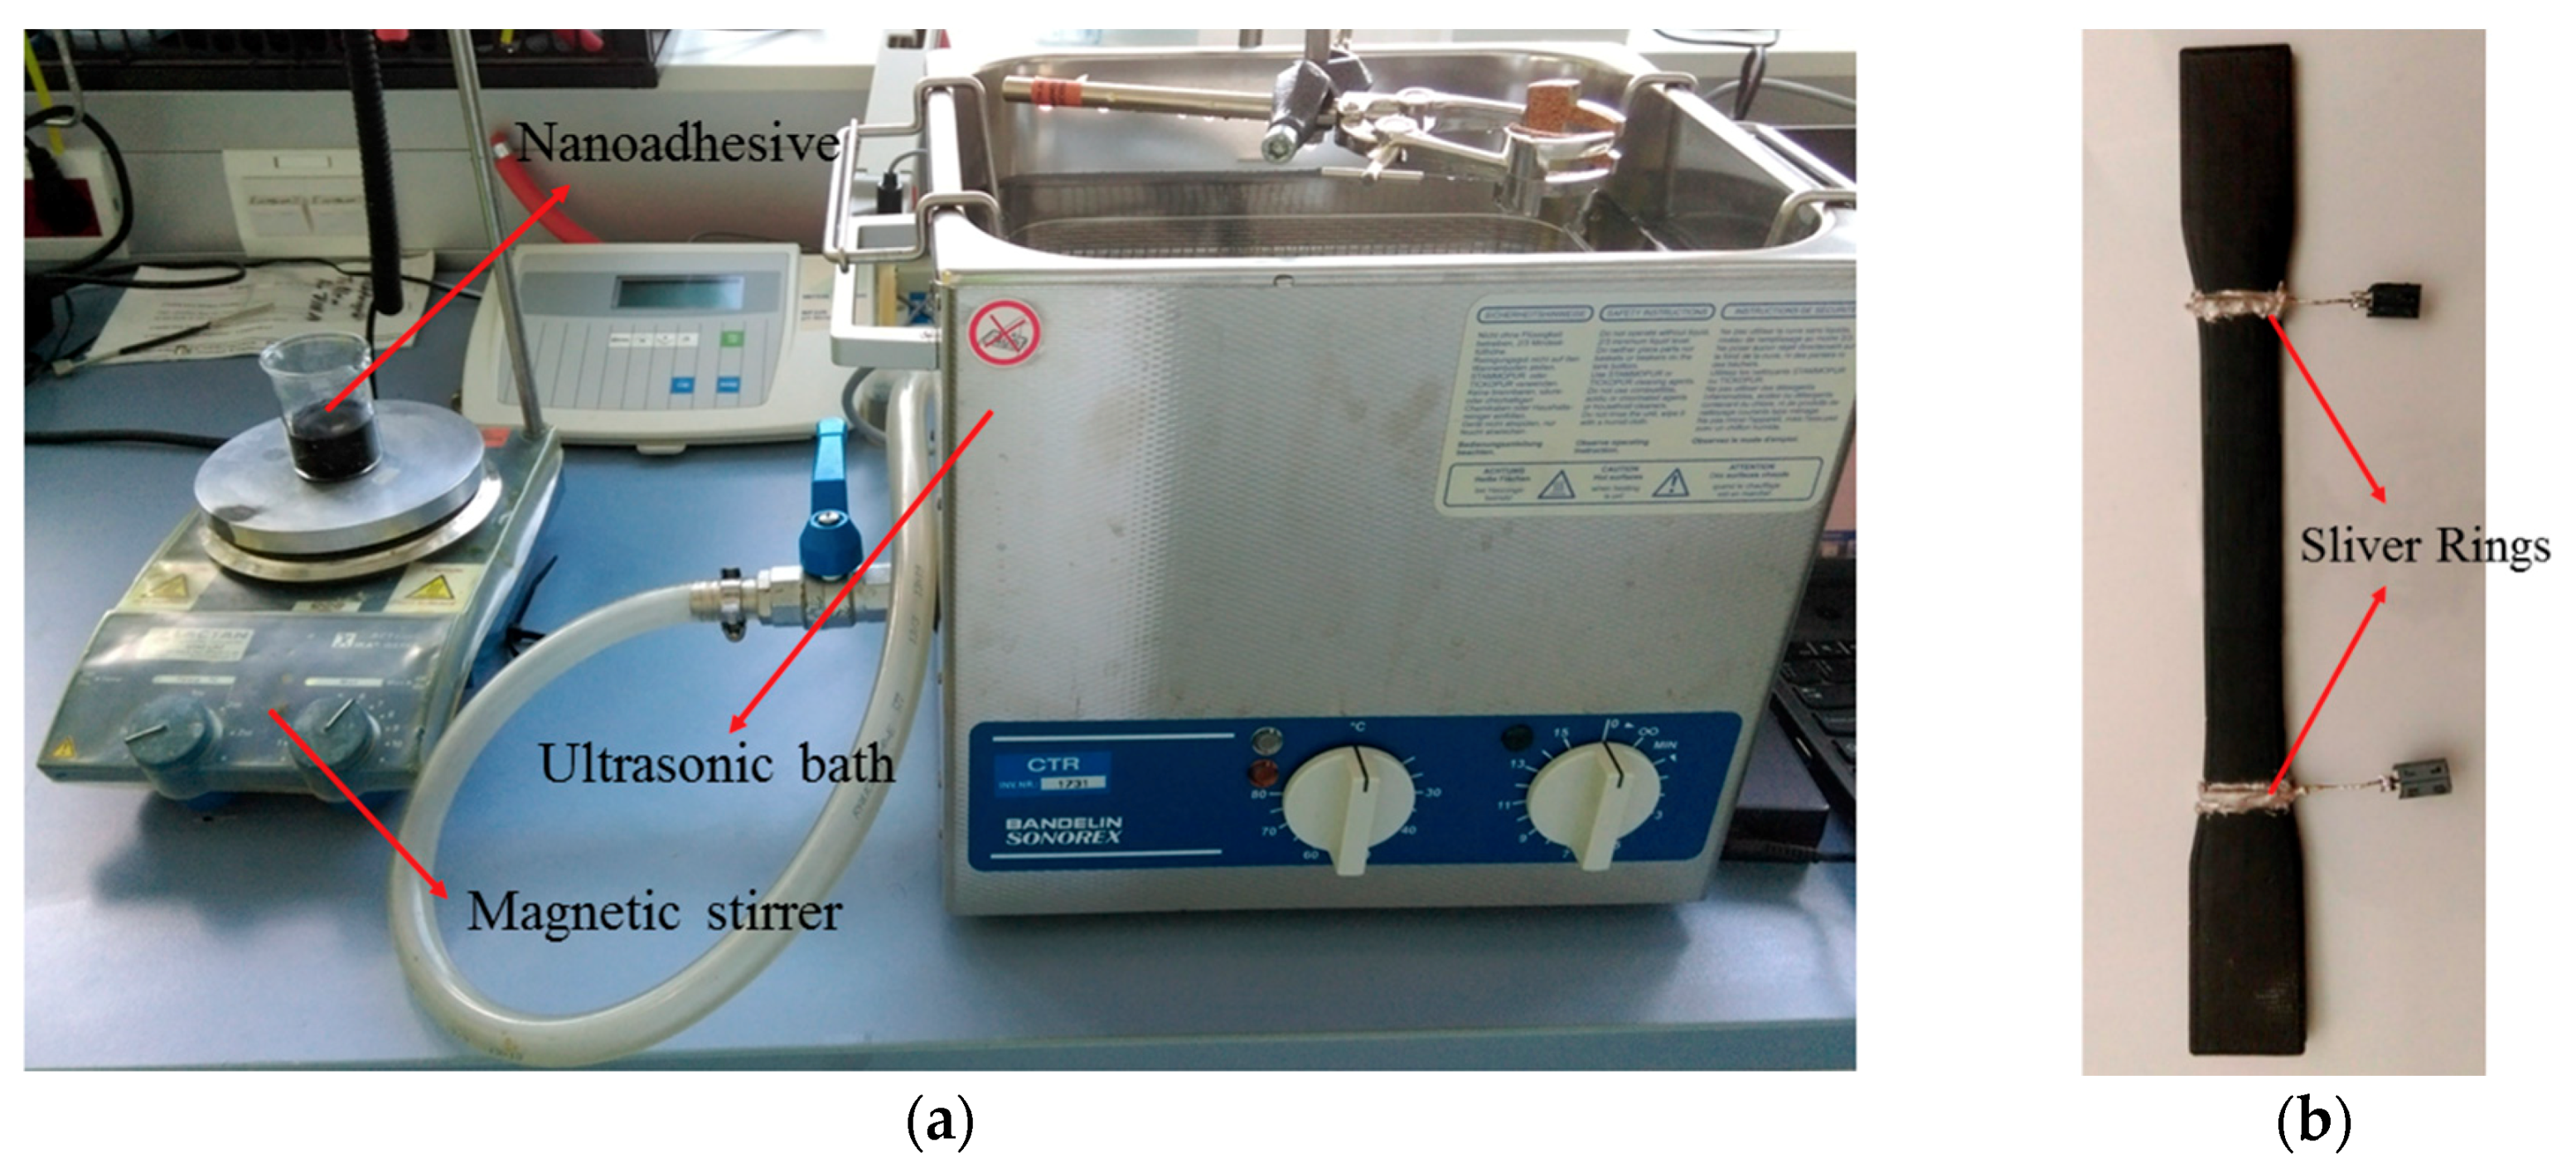
2.2. Preparation of Specimens

Due to the exploitation of the conduction, as well as electrostatic effect occurring in the specimen, the fabrication process can be kept less sophisticated than those reported in previous work [32,33] without significant loss of sensory properties.
Weighed amounts of epoxy resin and carbon nanotubes (measured by a digital scale with accuracy equal to 0.1 mg) were mechanically stirred for 5 min in a beaker. The mixture was then placed in a shear mixer (IKA T18 digital ULTRA TURRAX, IKA, Staufen, Germany), at 1000 rpm for 15 min. Then, the dispersion of the MWCNT in the epoxy resin was further accomplished using an ultrasonic bath (see Figure 1a). Effective means of deagglomerating and dispersing are needed to overcome the bonding forces after wettening the powders. Therefore, an ultrasonic bath with high frequency (35–60 kHz) was used to disperse the MWCNTs in the epoxy resin appropriately, and break agglomerated particles. The time was set accordingly to the considered respective time of dispersion (see Table 1), and the environmental temperature was kept constant at 25 °C. Thus, CNTs with weight percentages of 1, 1.5, 2, and 3 wt % were dispersed in the epoxy matrix at different dispersion times. The resin was then combined with hardener in the ratio of 2:1 for 15 min on the stirrer, and was immediately poured into the dog-bone molds. After 24 h, the dog-bone shape samples, for tensile testing, were extracted from the mold. The curing temperature affects the electrical properties and strength of the nanocomposites. Therefore, it is preferred to use room temperature (25 °C) for a duration of one day to cure the specimens. The mold was designed according to the ASTM D638 standard. In this process, we avoid commonly employed, often complex, activation procedures.
To facilitate the electrical measurement of the samples, two metallic wires were applied close to the necking end parts at a specific distance of 7.5 cm. The wires are fixed using conductive silver adhesive. The surface-ring contact was used to minimize electrical contact resistance (see Figure 1b).

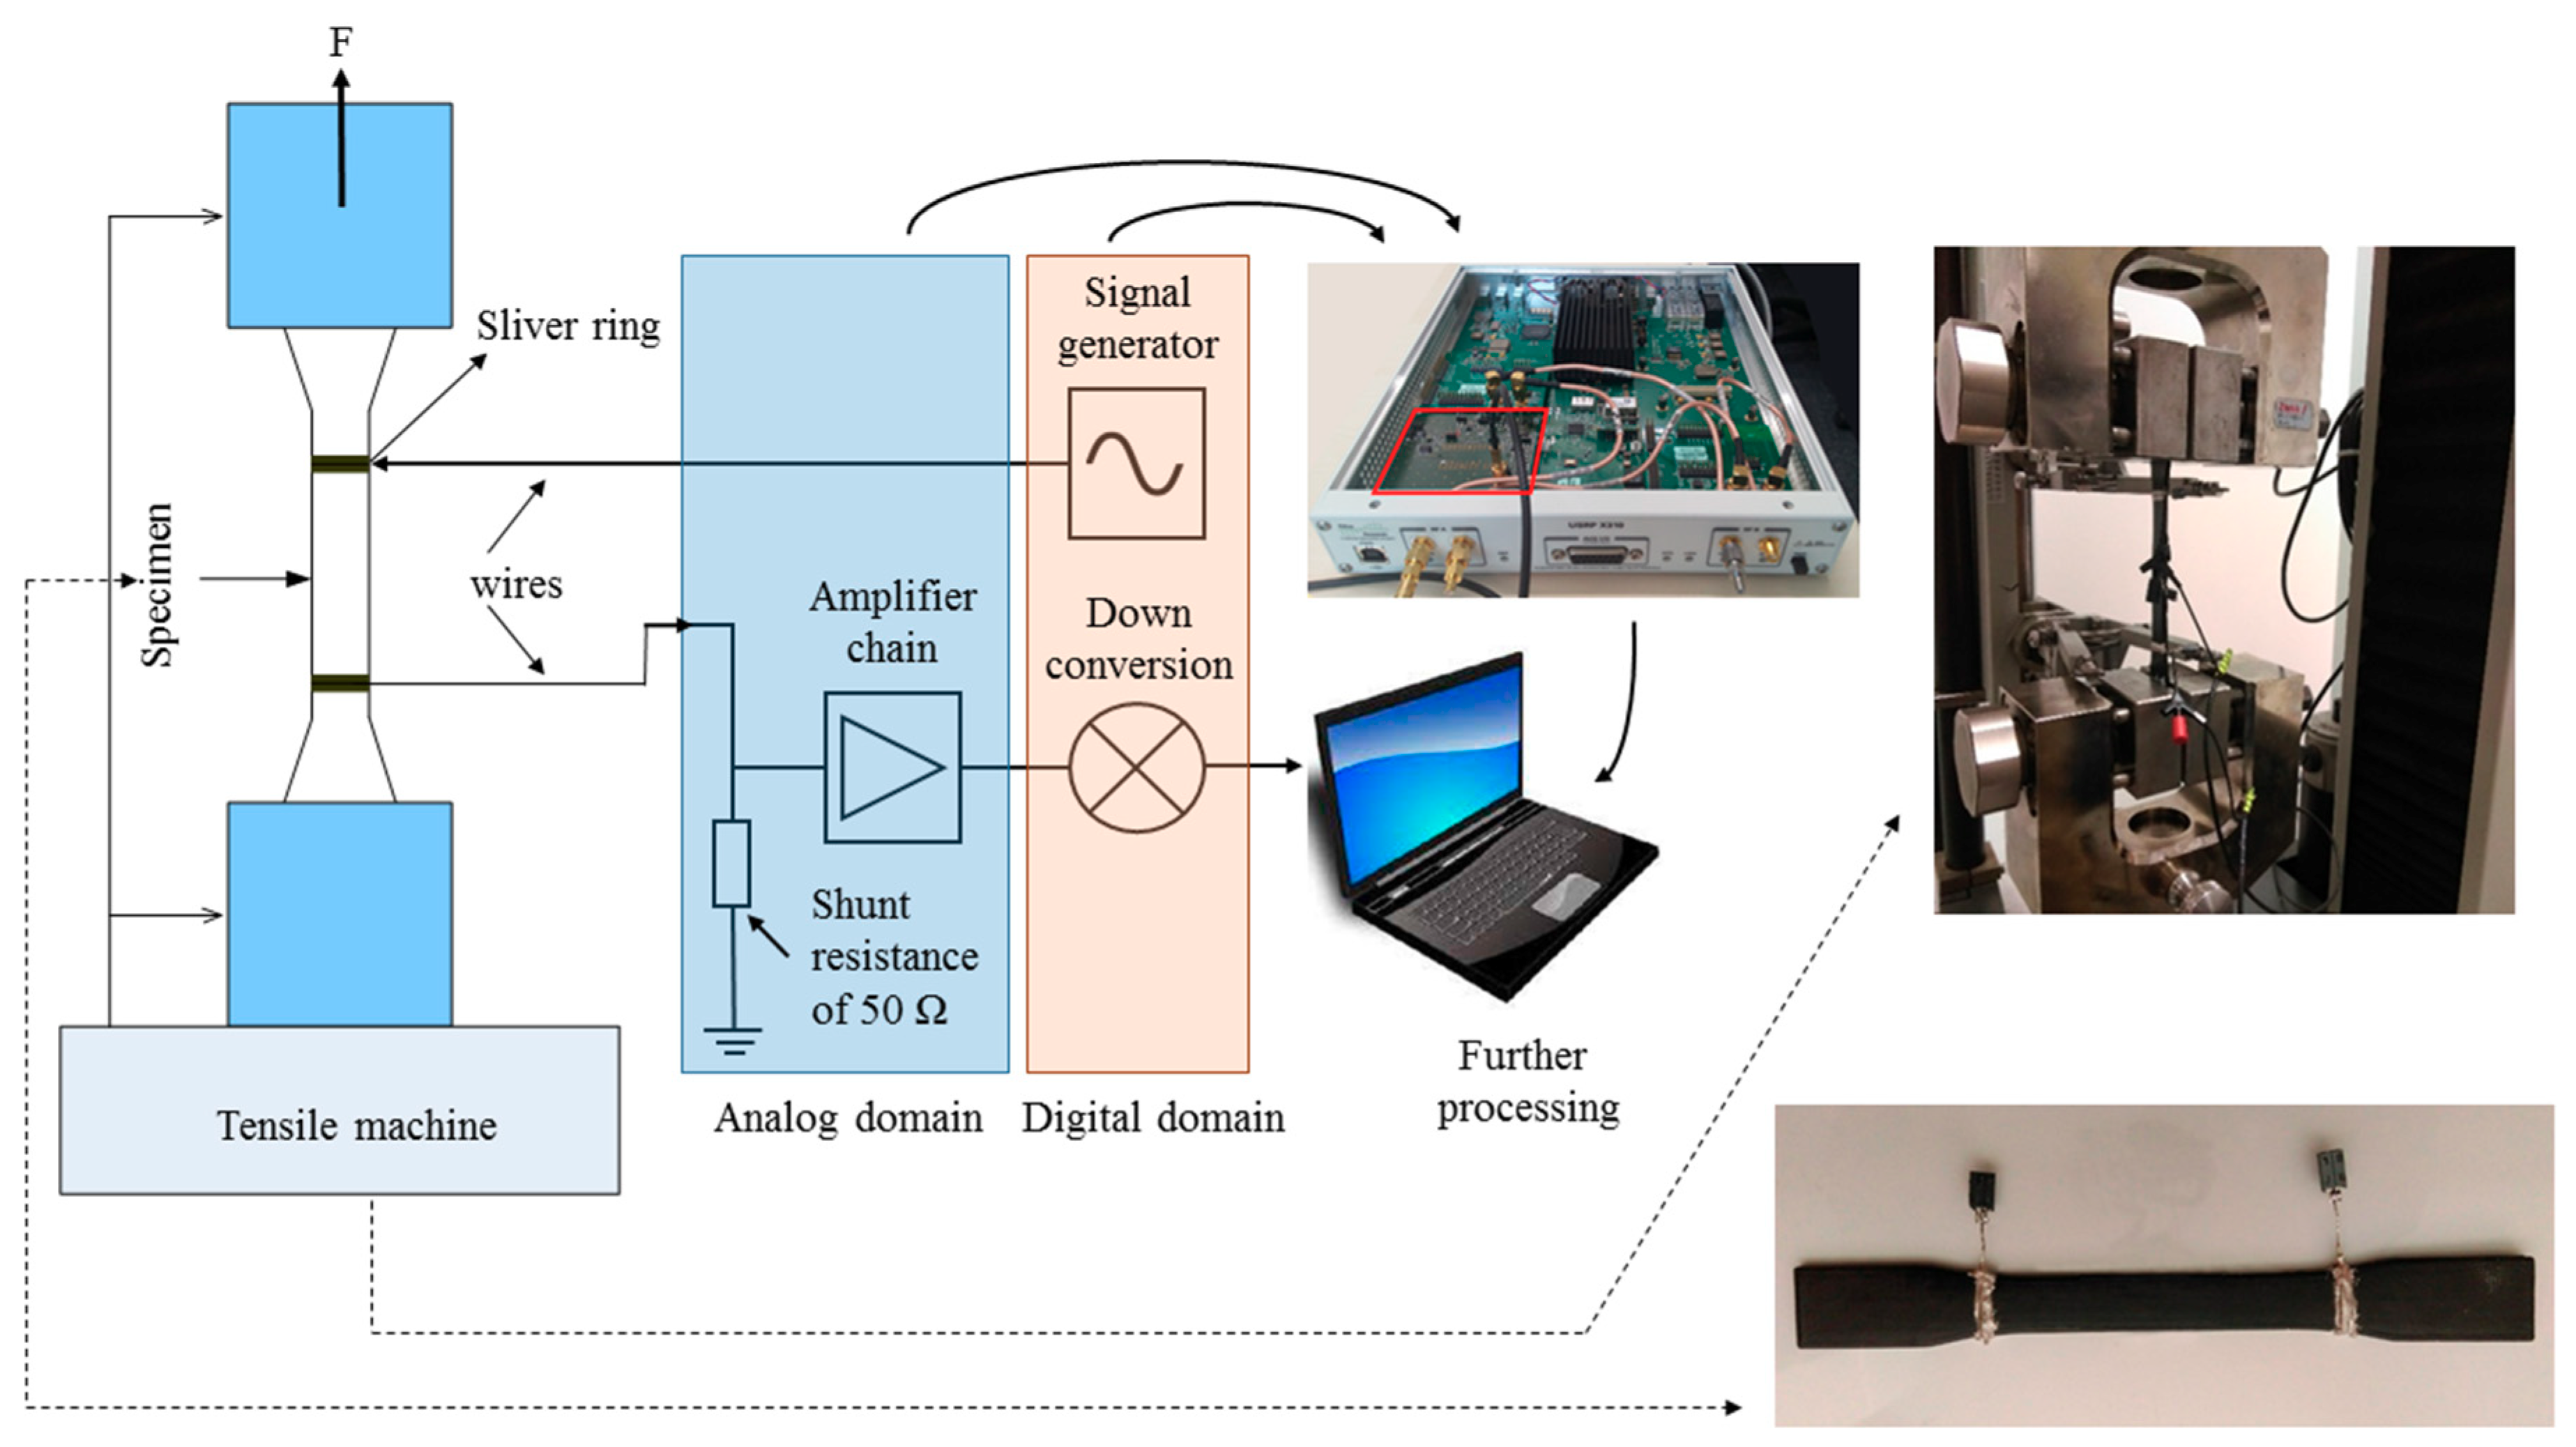
2.3. Mechanical and Electrical Acquisition System

Three specimens were prepared under equivalent conditions for each test case of this study, and the effect of the dispersion time and various filler contents were investigated on the initial equivalent parallel resistance. Then, the specimens were subjected to a longitudinal loading until fracture using a Zwick/Roell Z020 (Zwick, Ulm, Germany) universal testing machine (see Figure 2 upper right). A crosshead displacement rate of 1 mm/min was applied according to the standard for polymer testing. The tensile force, longitudinal displacement, and voltage changes were measured simultaneously versus time.
Electrical measurements were conducted in two steps. The first step was to determine the frequency-dependent initial equivalent parallel resistance Rp of the specimens using an LCR measurement bridge by Extech Instruments. This instrument determines the equivalent parallel resistance at different frequency settings. The shape of the resulting measurement curves can be analyzed to determine the respective percolation threshold of the samples; for non-conducting materials, the resistance will decrease with increasing frequency. This is due to the predominant capacitive effect that can be observed here. Above the percolation threshold, the resistive behavior will dominate, and the impedance of the samples stays constant over frequency.
The second step is the impedance measurement at a fixed frequency during the tensile test. The frequency is chosen in order to optimally exploit the range of the input amplifier. These measurements are done using a high-speed, high-resolution measurement platform [34,35]. It is based on an FPGA system with a customized analog front-end to enable high-speed, high-resolution measurements. For series production, the components can be integrated into a system which, in terms of size and costs, is well suited for the application of commercial structural health monitoring in buildings.
The measurement setup is illustrated in Figure 2: Left is the nanocomposite specimen which, on one side, is connected to the input analog amplifier chain as part of the impedance measurement hardware. The other side is connected to the output, which supplies a digitally generated sine signal. In the digital domain, the measurement platform also supplies the algorithms necessary for signal processing, e.g. down-conversion of the acquired signal. Down-conversion is done to transfer the measurement signal from a higher measurement frequency to a lower frequency, together with a reduction of the necessary number of samples. The results can then be used for further processing, such as analysis and visualization.
A higher measurement frequency can, in the first place, be beneficial to avoid or reduce the influence of other electrical equipment present near the sensors. This is important when these nanocomposite sensors are to be employed in buildings which commonly suffer from high electric emissions due to the used machinery and other equipment. Secondly, in this application, we assume that improved impedance readings are achieved also for samples below the percolation threshold through the application of a high frequency measurement signal. Thus, also samples with less attractive electrical properties, but prepared using a simplified and less time-consuming fabrication process, might as well be used for sensing.
Through preliminary analysis done in the initial impedance measurements described in Section 3.1, the measurement frequency for the tensile testing (Section 3.3) is chosen to be 100 kHz with an excitation voltage of 1 V (signal generator in Figure 2) to optimally exploit the input range of the equipment. Via the shunt resistance of 50 Ω, which incorporates a voltage divider with the measurement impedance (see Figure 2), a voltage reading is recorded, which is proportional to the resistance of the sample. For a resistance change, the voltage signal also changes accordingly. To determine the impedance as illustrated in the result diagrams, first a calibration measurement using a known resistance is done. Using this calibration measurement, and a proportionality factor (to relate the voltage at the measurement impedance to the voltage at the shunt resistance), the recorded voltage reading can be corrected to give the equivalent impedance.

3. Results and Discussions

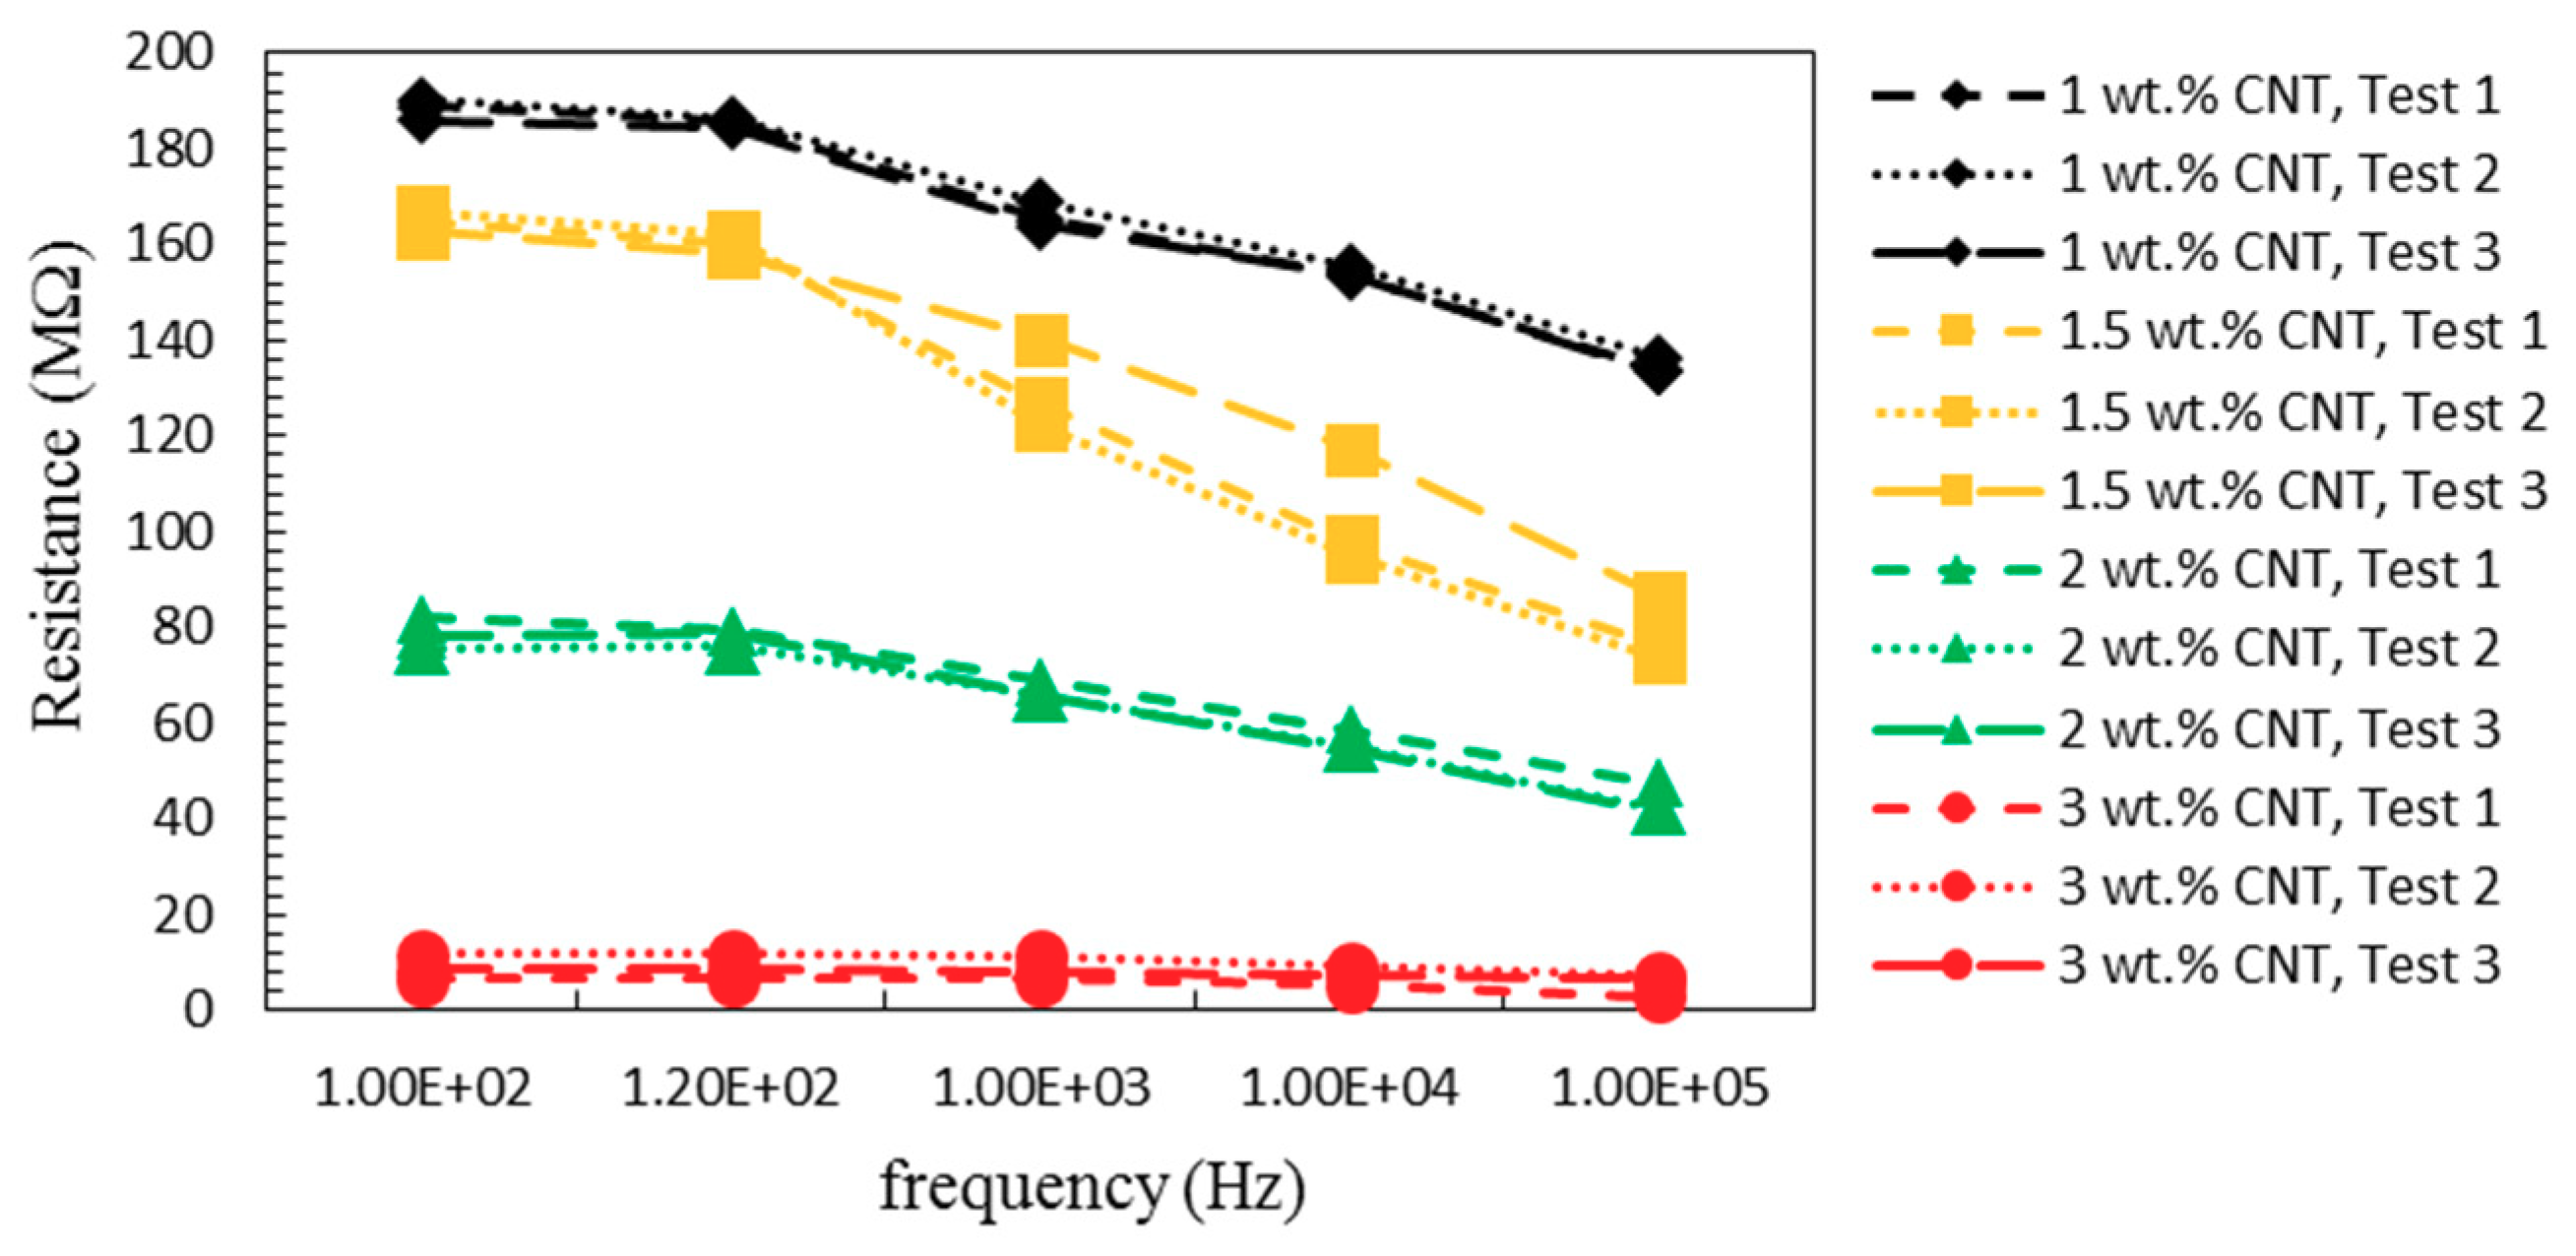
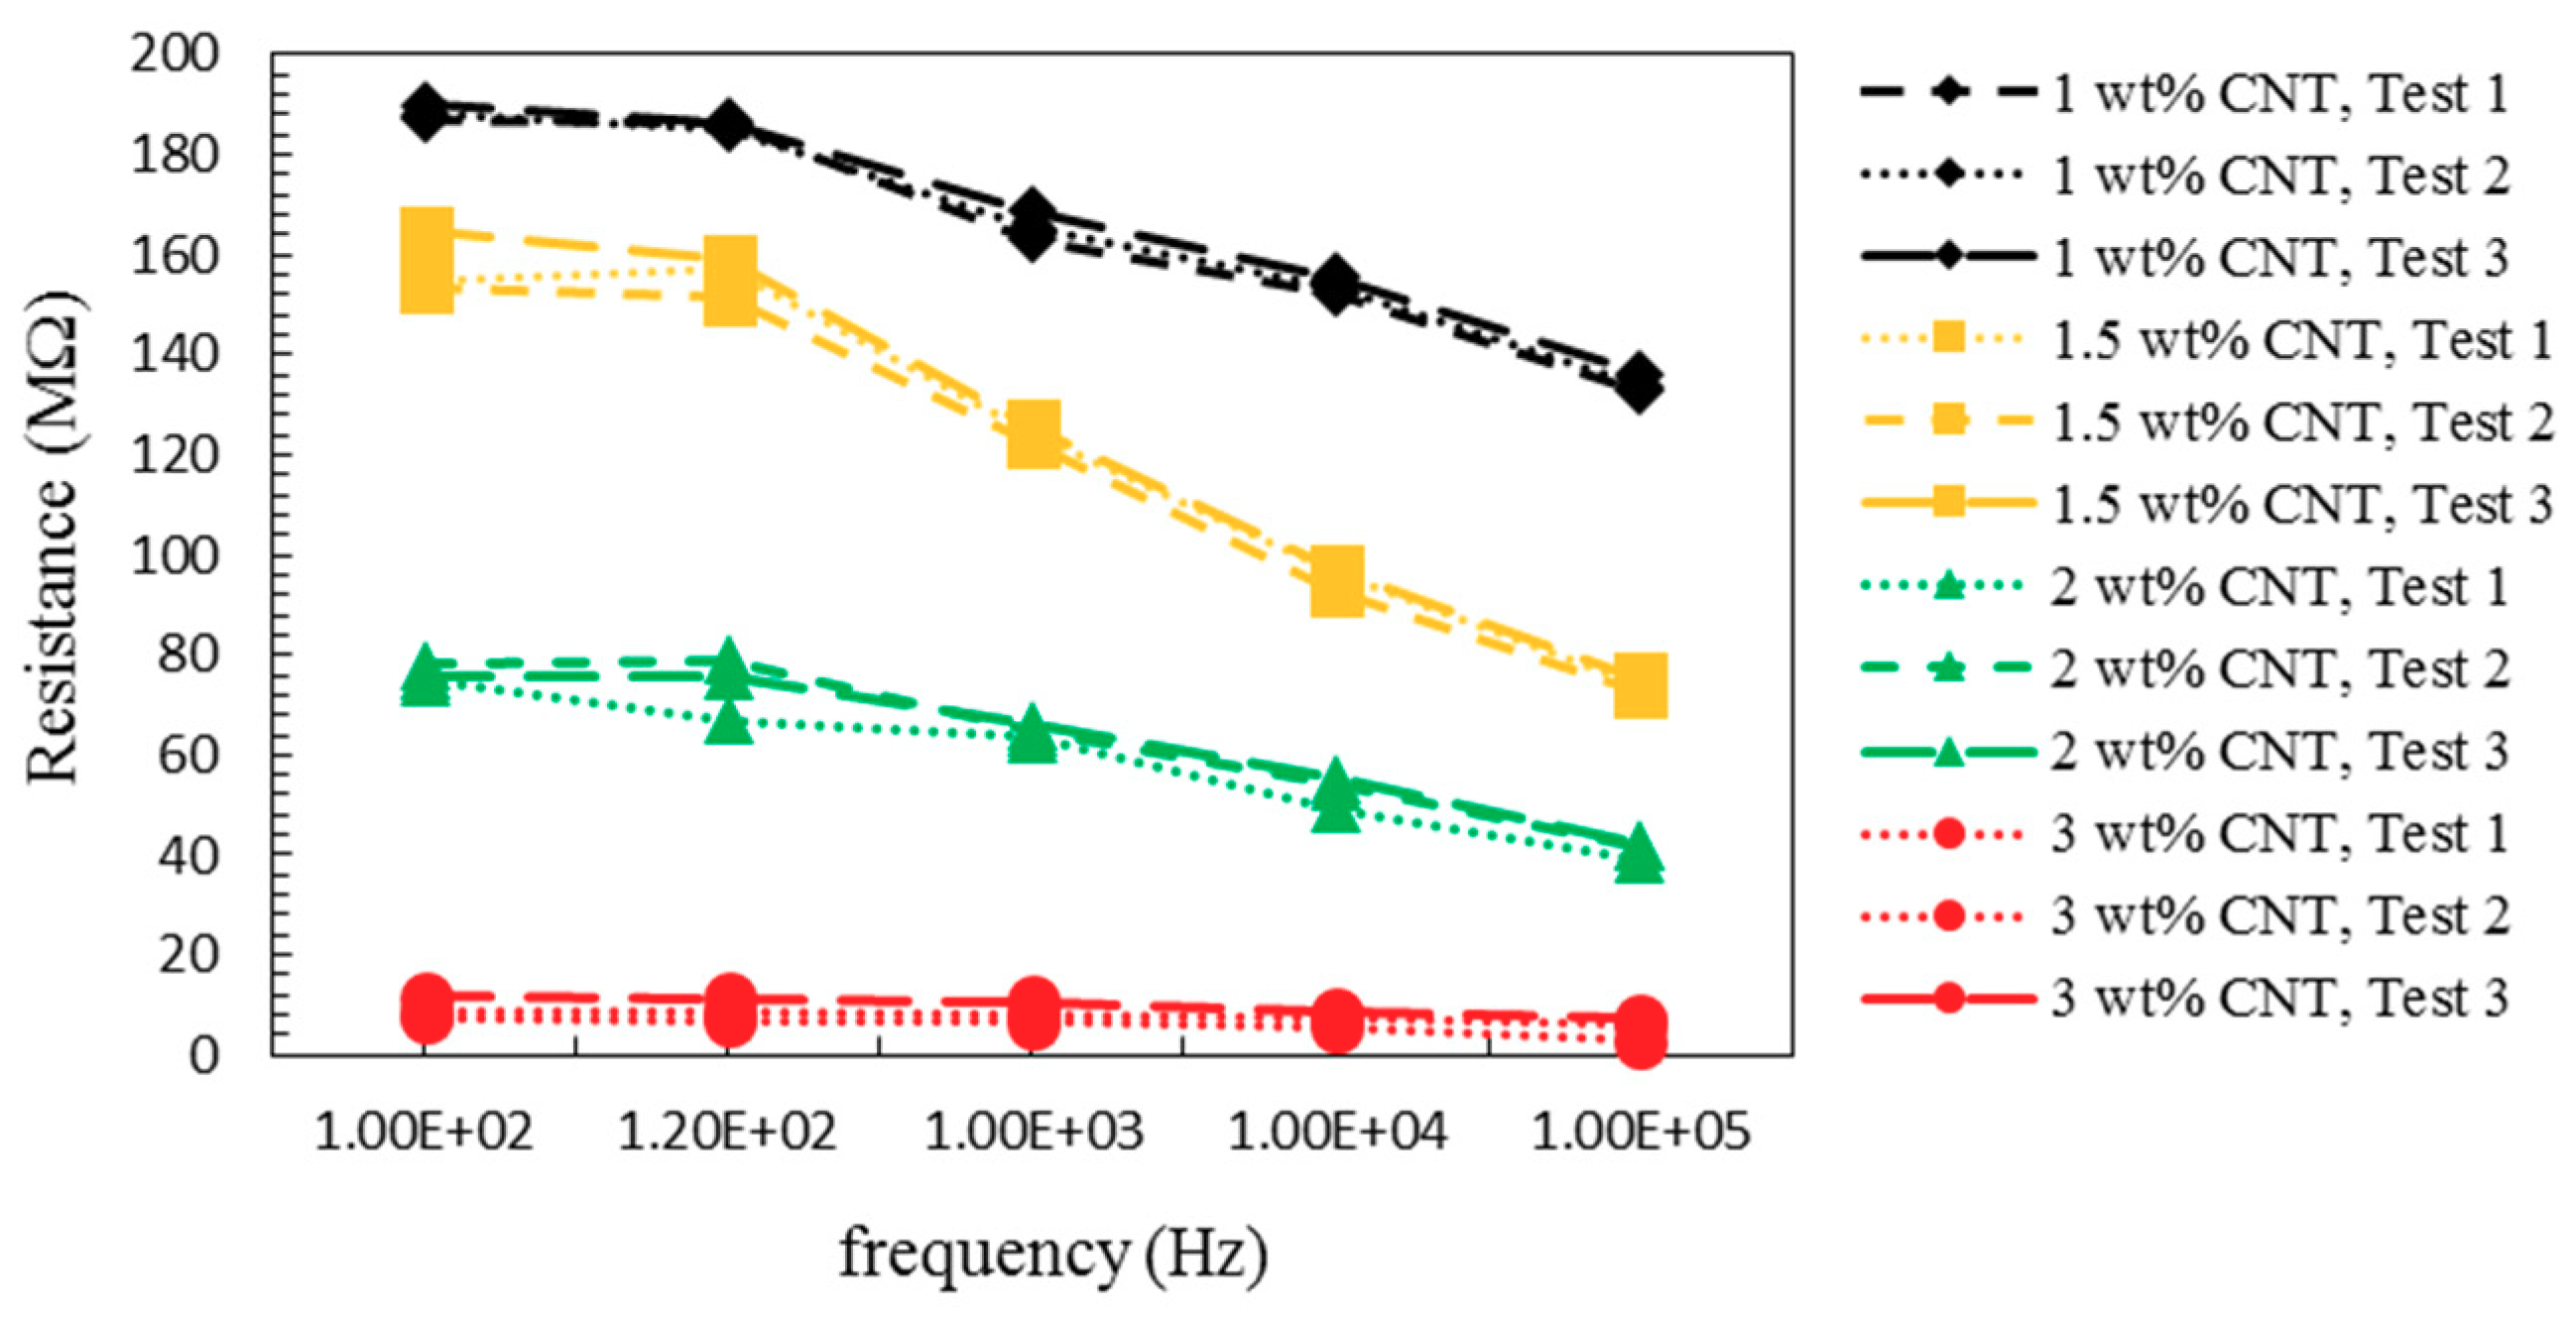
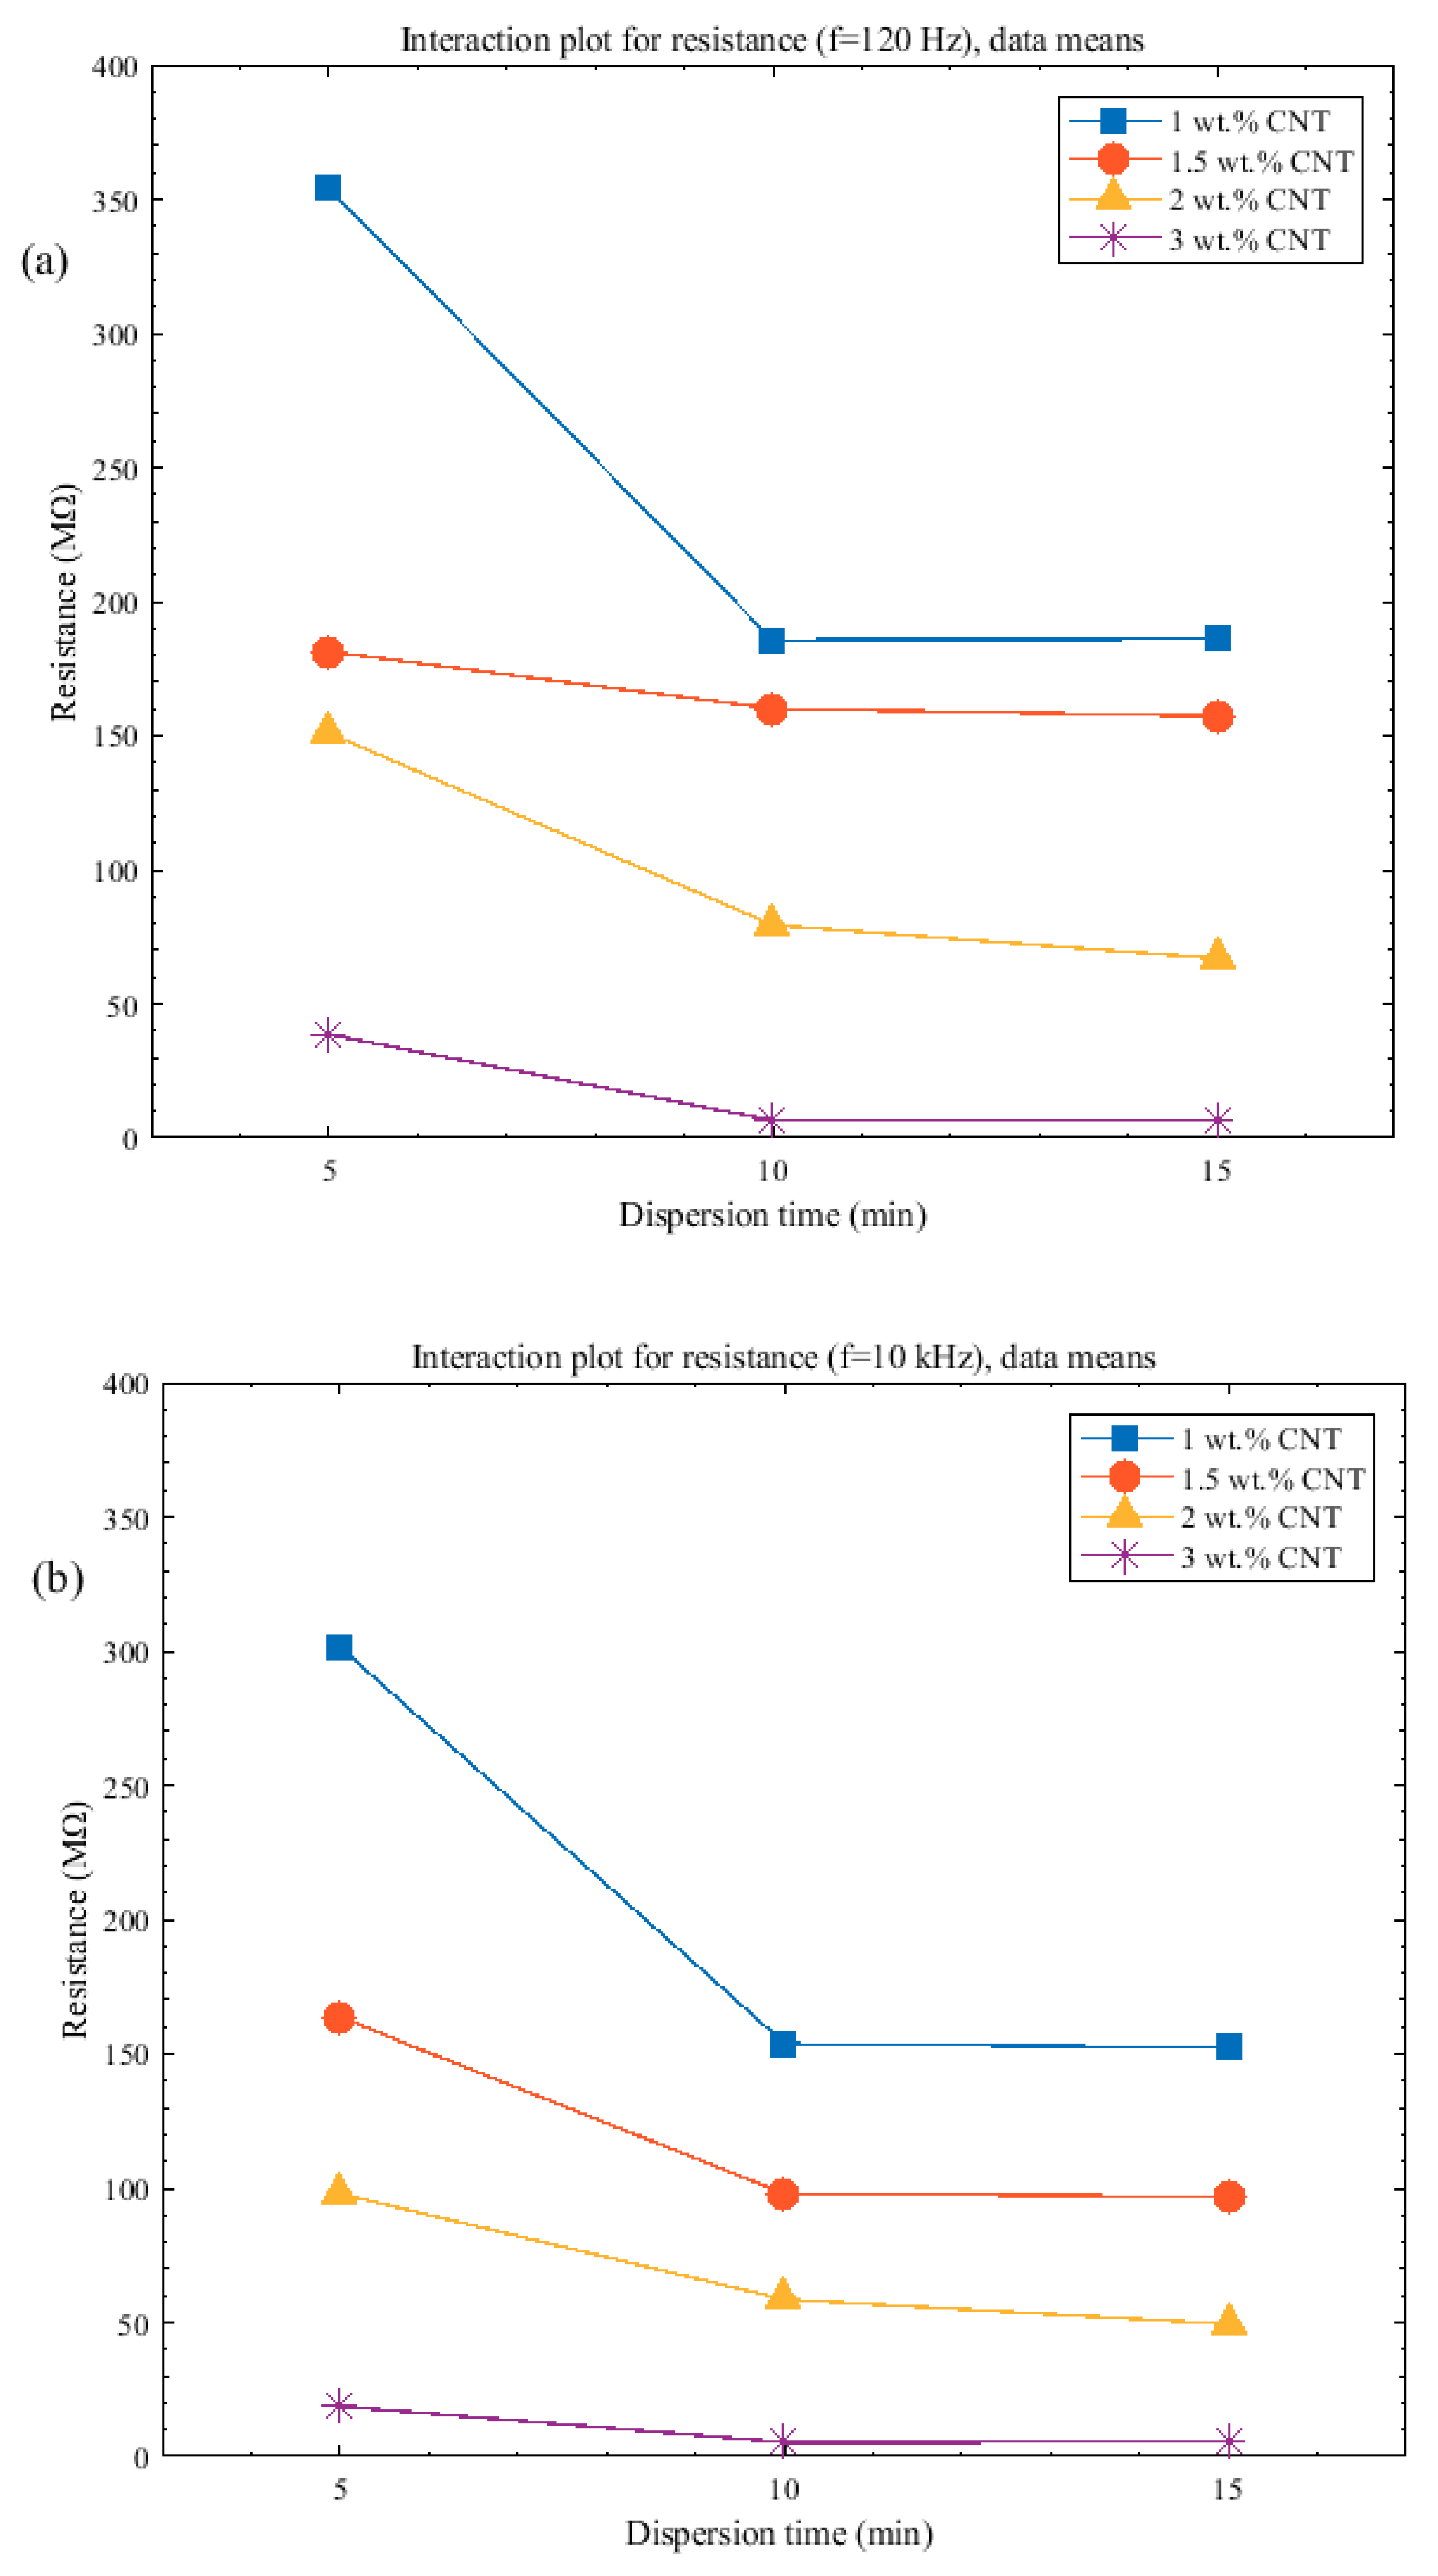
3.1. Achieved Impedance Without Mechanical Loading
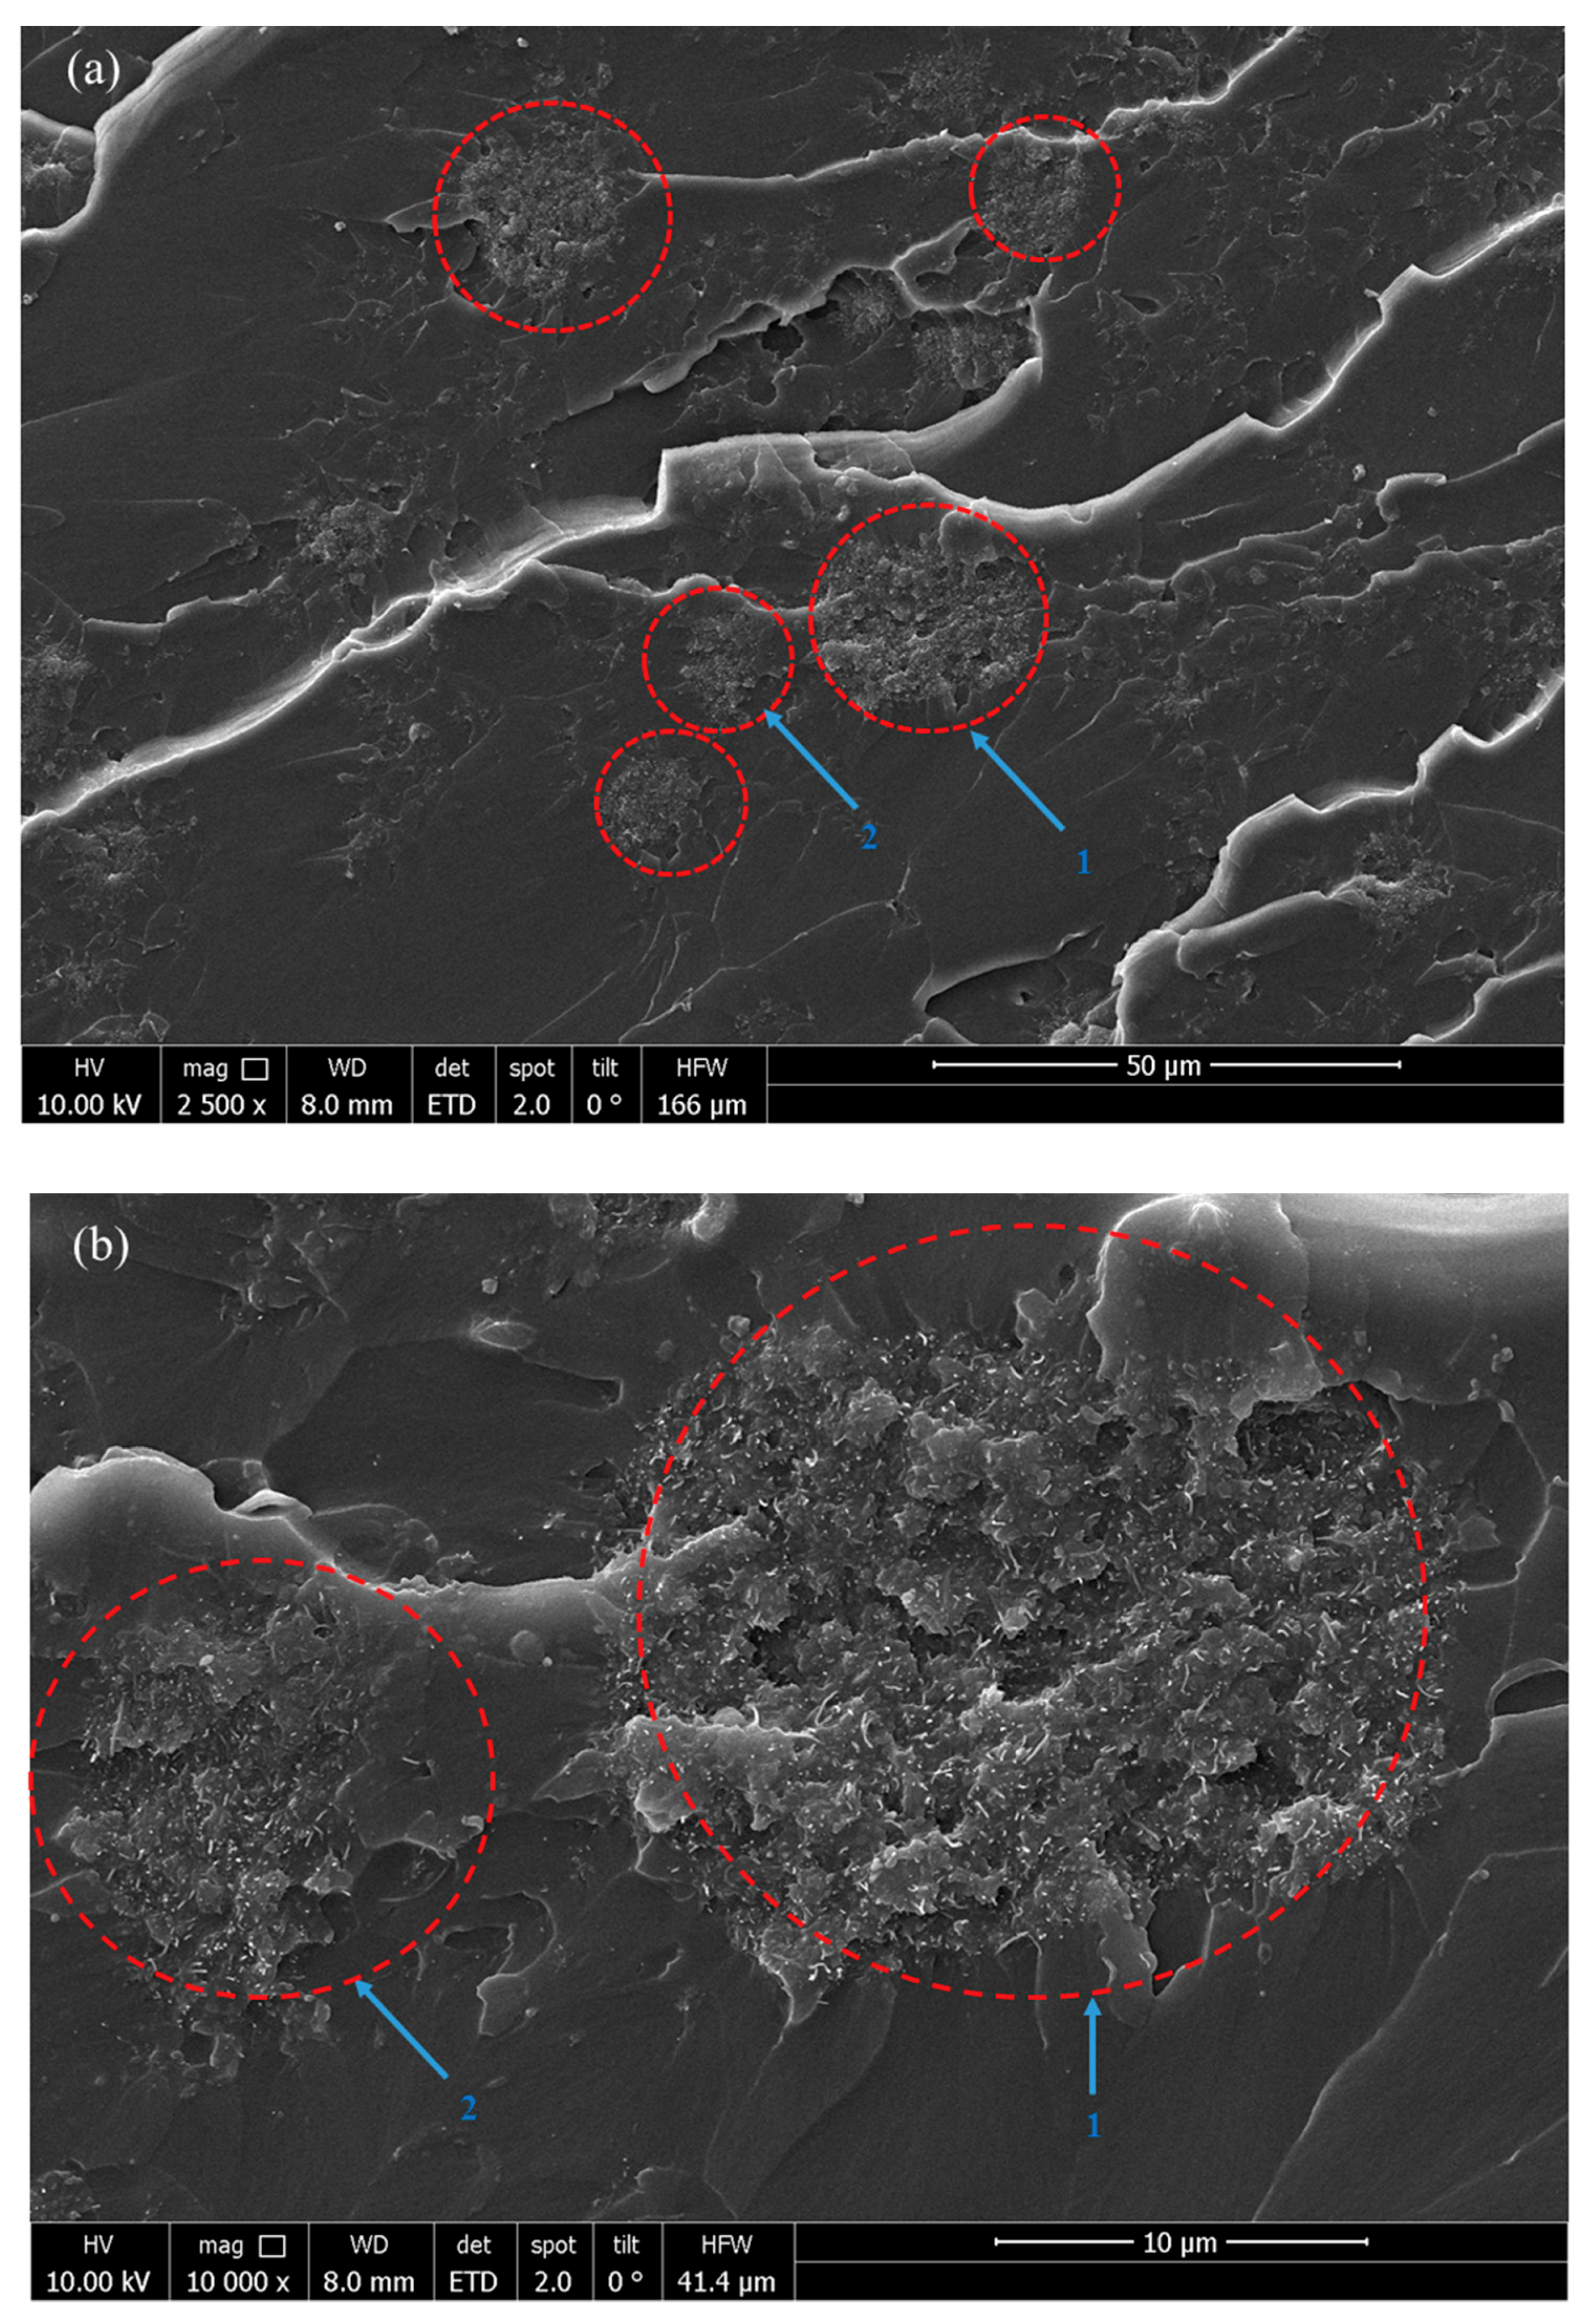
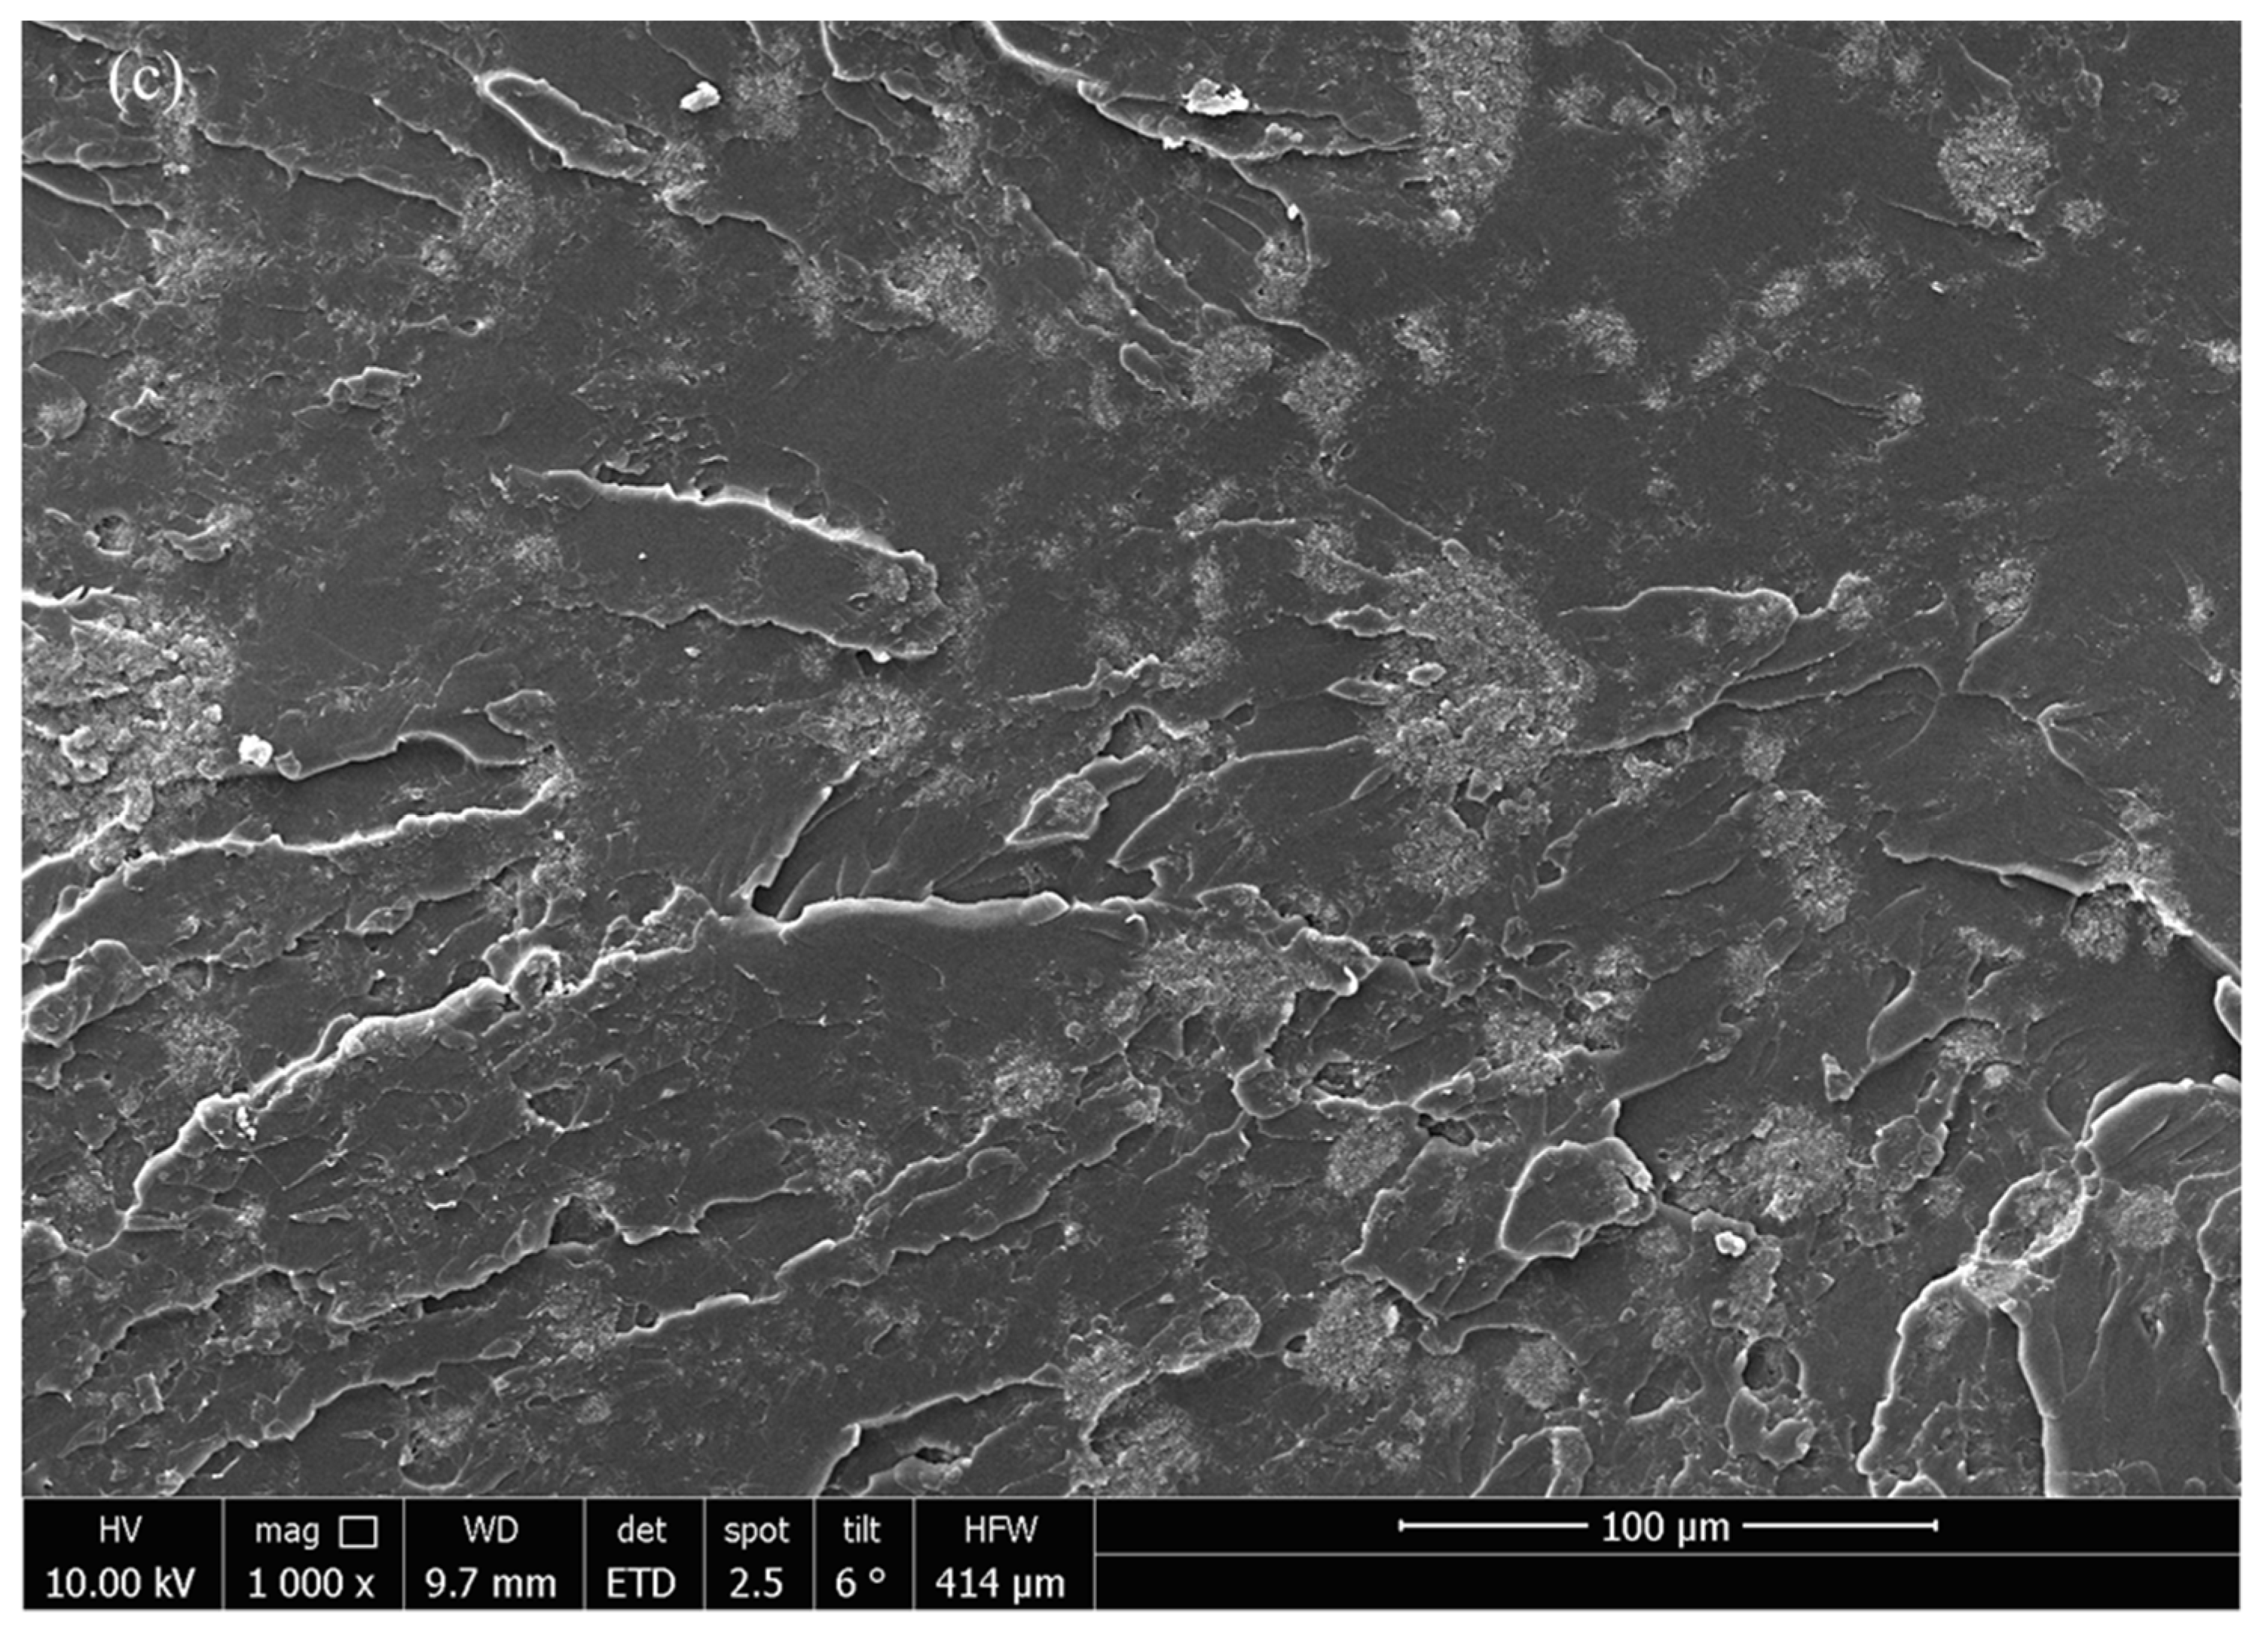
The equivalent parallel resistance of the nanocomposite specimens changes significantly when measured at different frequencies. The results of this initial equivalent parallel resistance measurements are illustrated for dispersion times of 10 and 15 min in Figure 3 and Figure 4, respectively. In all of these diagrams, the equivalent parallel resistance Rp decreases with increasing frequency. It can be seen from the Figure 3 that, when the filler content of MWCNTs increases up to 3 wt %, Rp decreases from 180 MΩ to less than 6 MΩ, given the same dispersion time. The equivalent parallel resistance clearly shows a flat curve shape at 3 wt %. At this point, the transition from the insulating to the conductive phase, called percolation threshold, is observed. The experimental method for the determination of the respective percolation threshold measurement was in compliance with the method used in [36]. Due to simplifications in the preparation process of the samples, the percolation threshold was achieved with samples containing a higher weight percent of CNTs.
Conductive networks formed in the epoxy matrix as conductive fillers are distributed appropriately within the epoxy matrix [37]. As a result, the initial resistance changes with the employed dispersion time.
Based on the equivalent parallel resistance value, the effect of dispersion time was investigated using statistical analysis in Minitab (see Figure 5a,b). Since the resistance does not change significantly for an increase of the dispersion time above 10 min, this value could be identified as sufficient with respect to the given process settings. Additionally, this analysis shows that the effect of the dispersion time is higher at a low weight percent of MWCNTs.

3.2. Morphology

The dispersion of MWCNTs in the epoxy resin was validated using SEM images. SEM pictures of the fracture surface of the nanocomposite specimens were taken after the tensile test. In Figure 6a,b, SEM images of nanocomposites containing 2 wt % MWCNTs at lower and higher magnifications with 5 min dispersion time are given. The highlighted circles in Figure 6a,b mark agglomerated zones of MWCNTs in the epoxy matrix. When compared to the scale given at the lower right corner of the images, it can be seen that the size of the highlighted zones is between 10 and 20 µm (see Figure 6b). However, high degrees of agglomeration have to be avoided when preparing MWCNT composites, agglomeration zones of diameters larger than 10 µm are required to achieve a sufficient conductivity. Additionally, we observed a nearly uniform distribution of MWCNTs in the epoxy matrix with increasing dispersion time and weight percent (see Figure 6c).

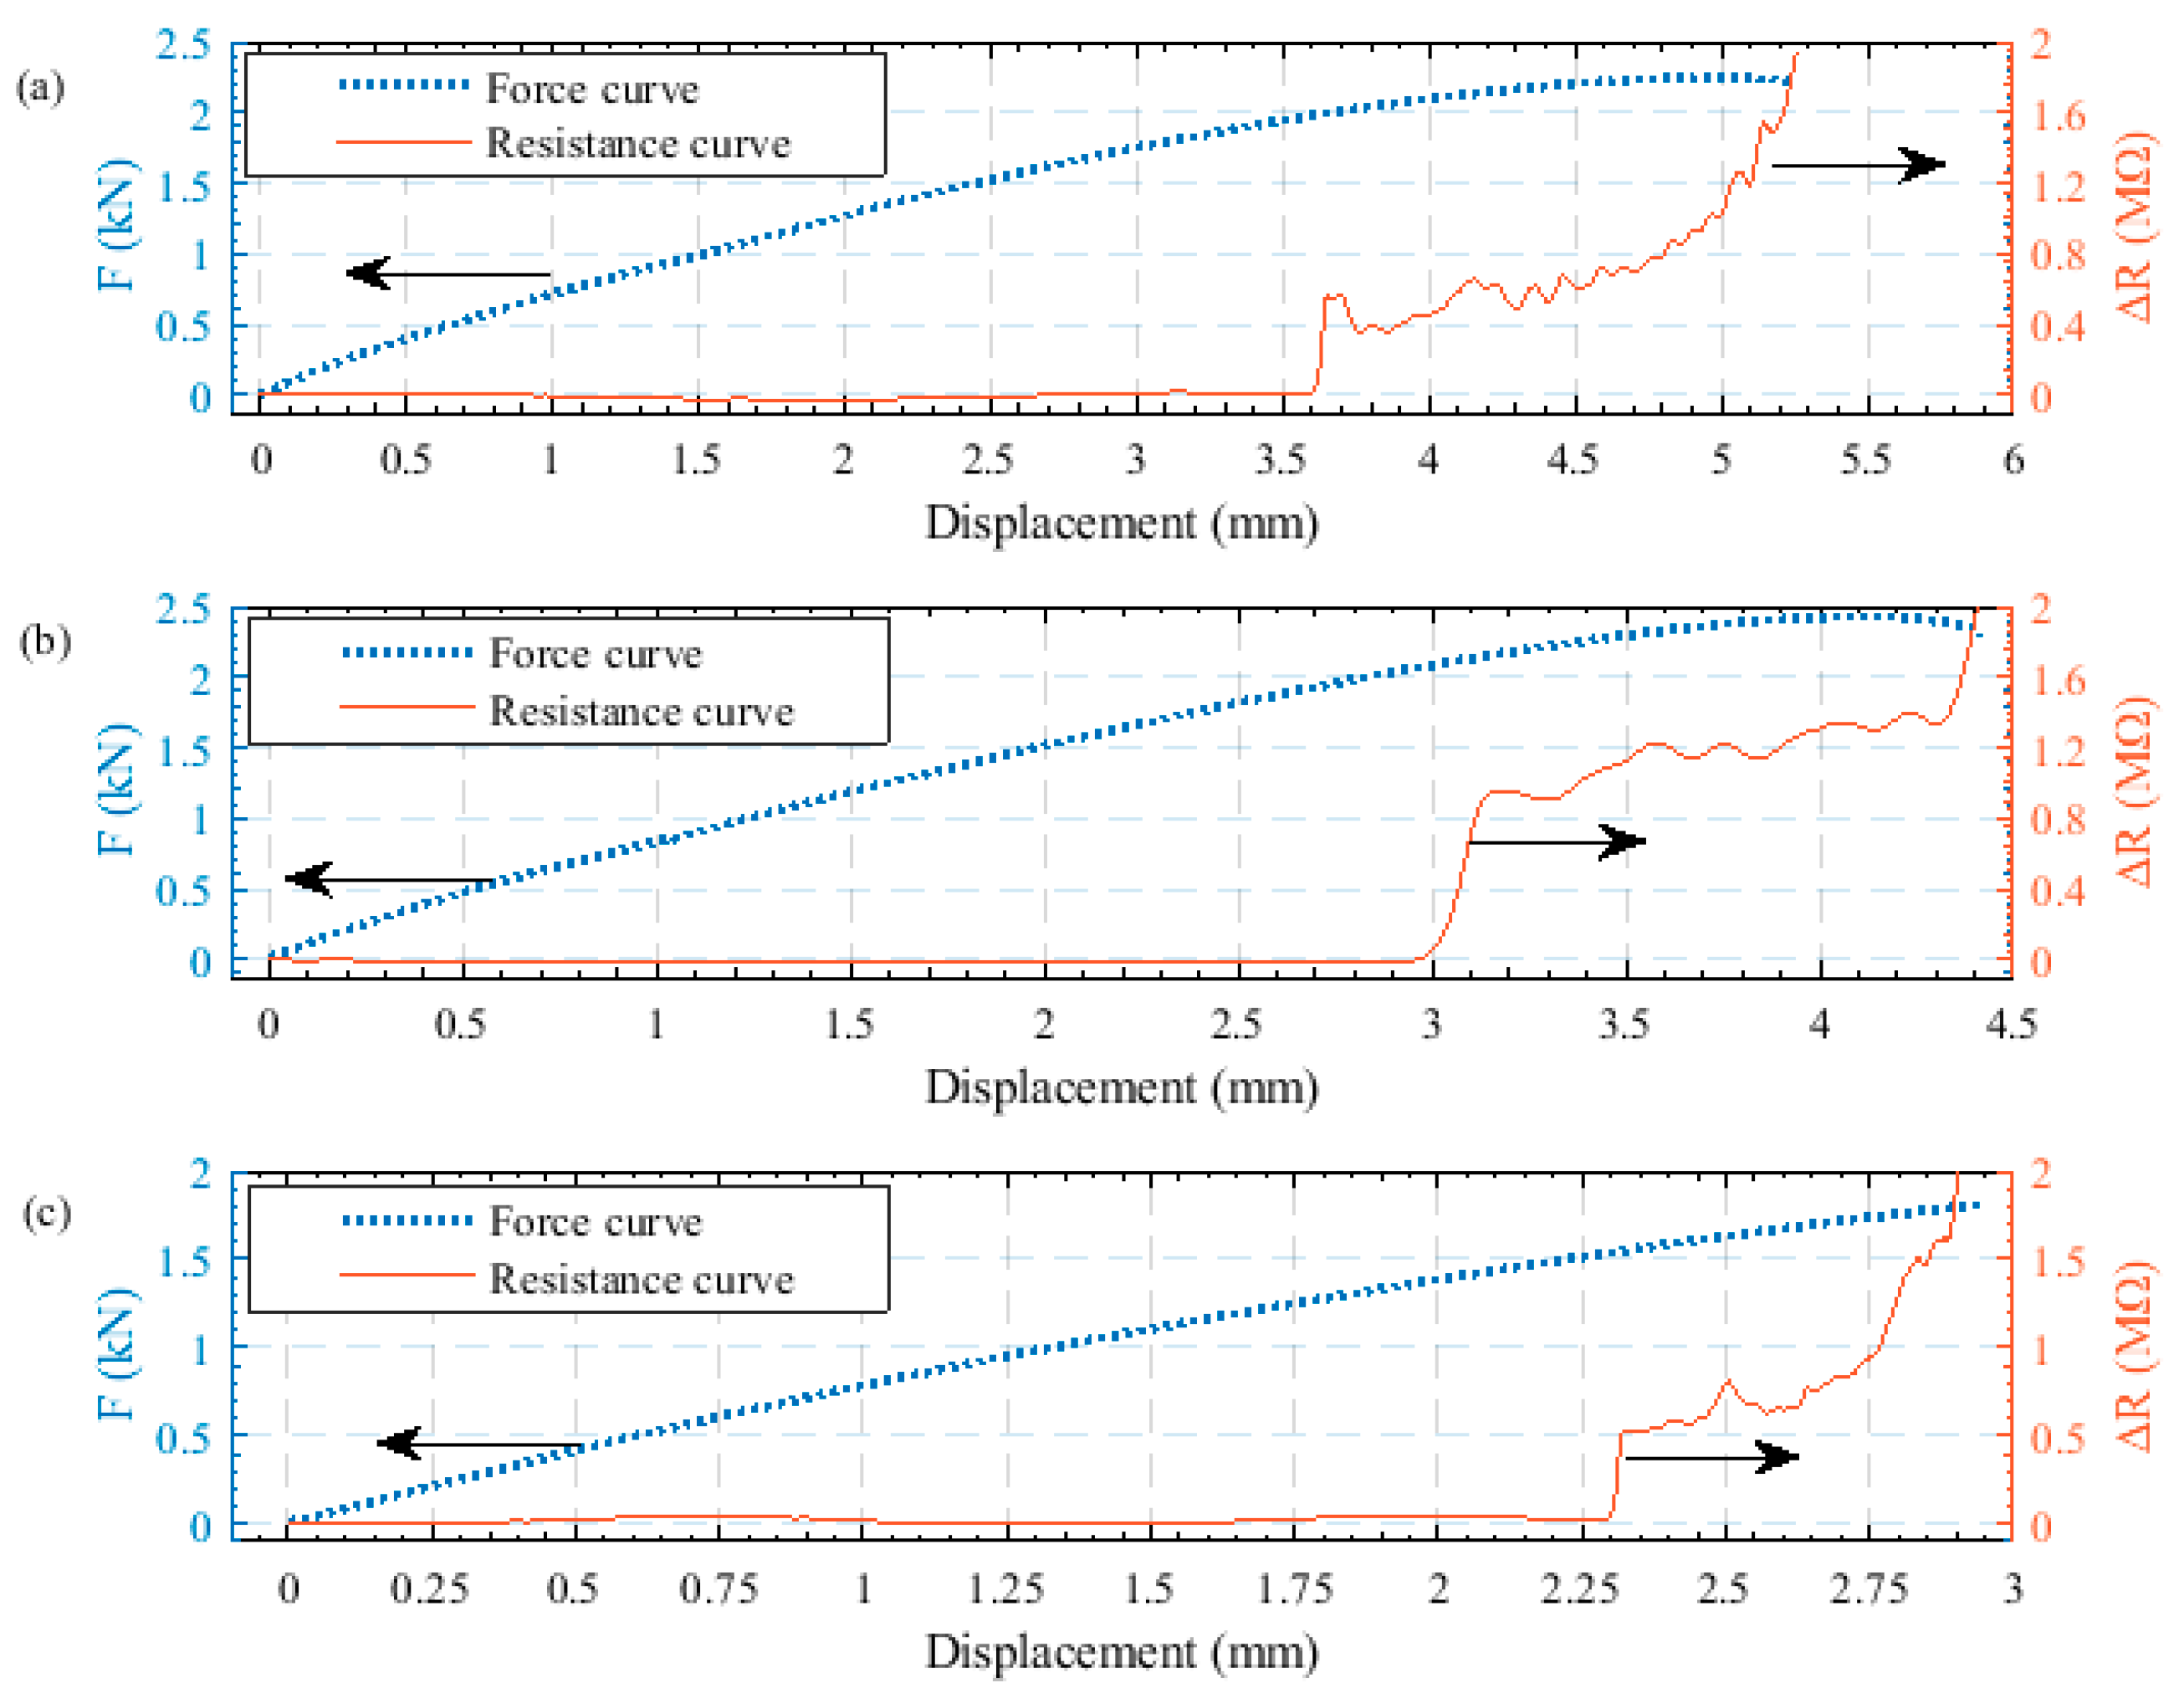
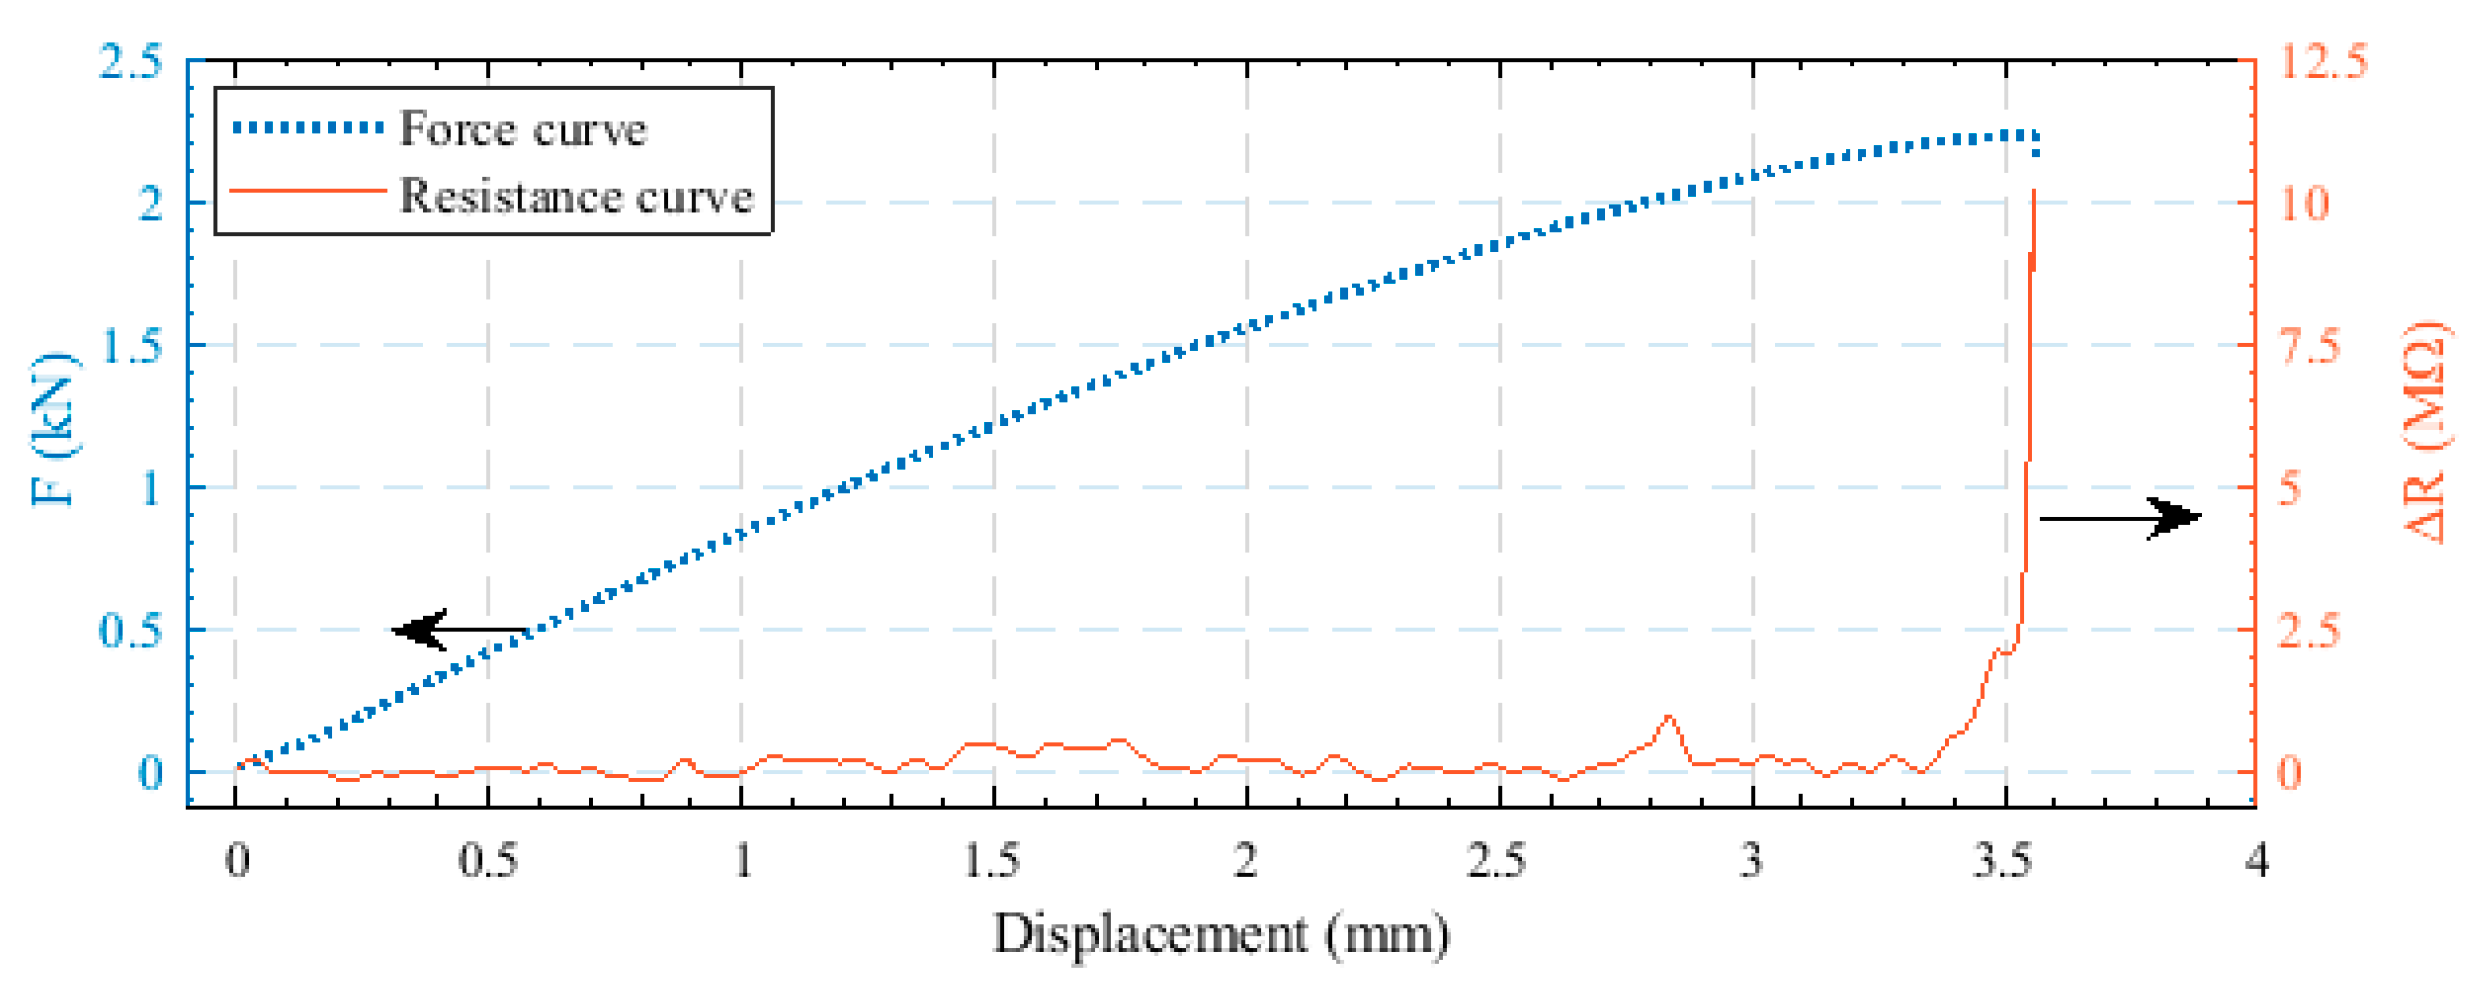
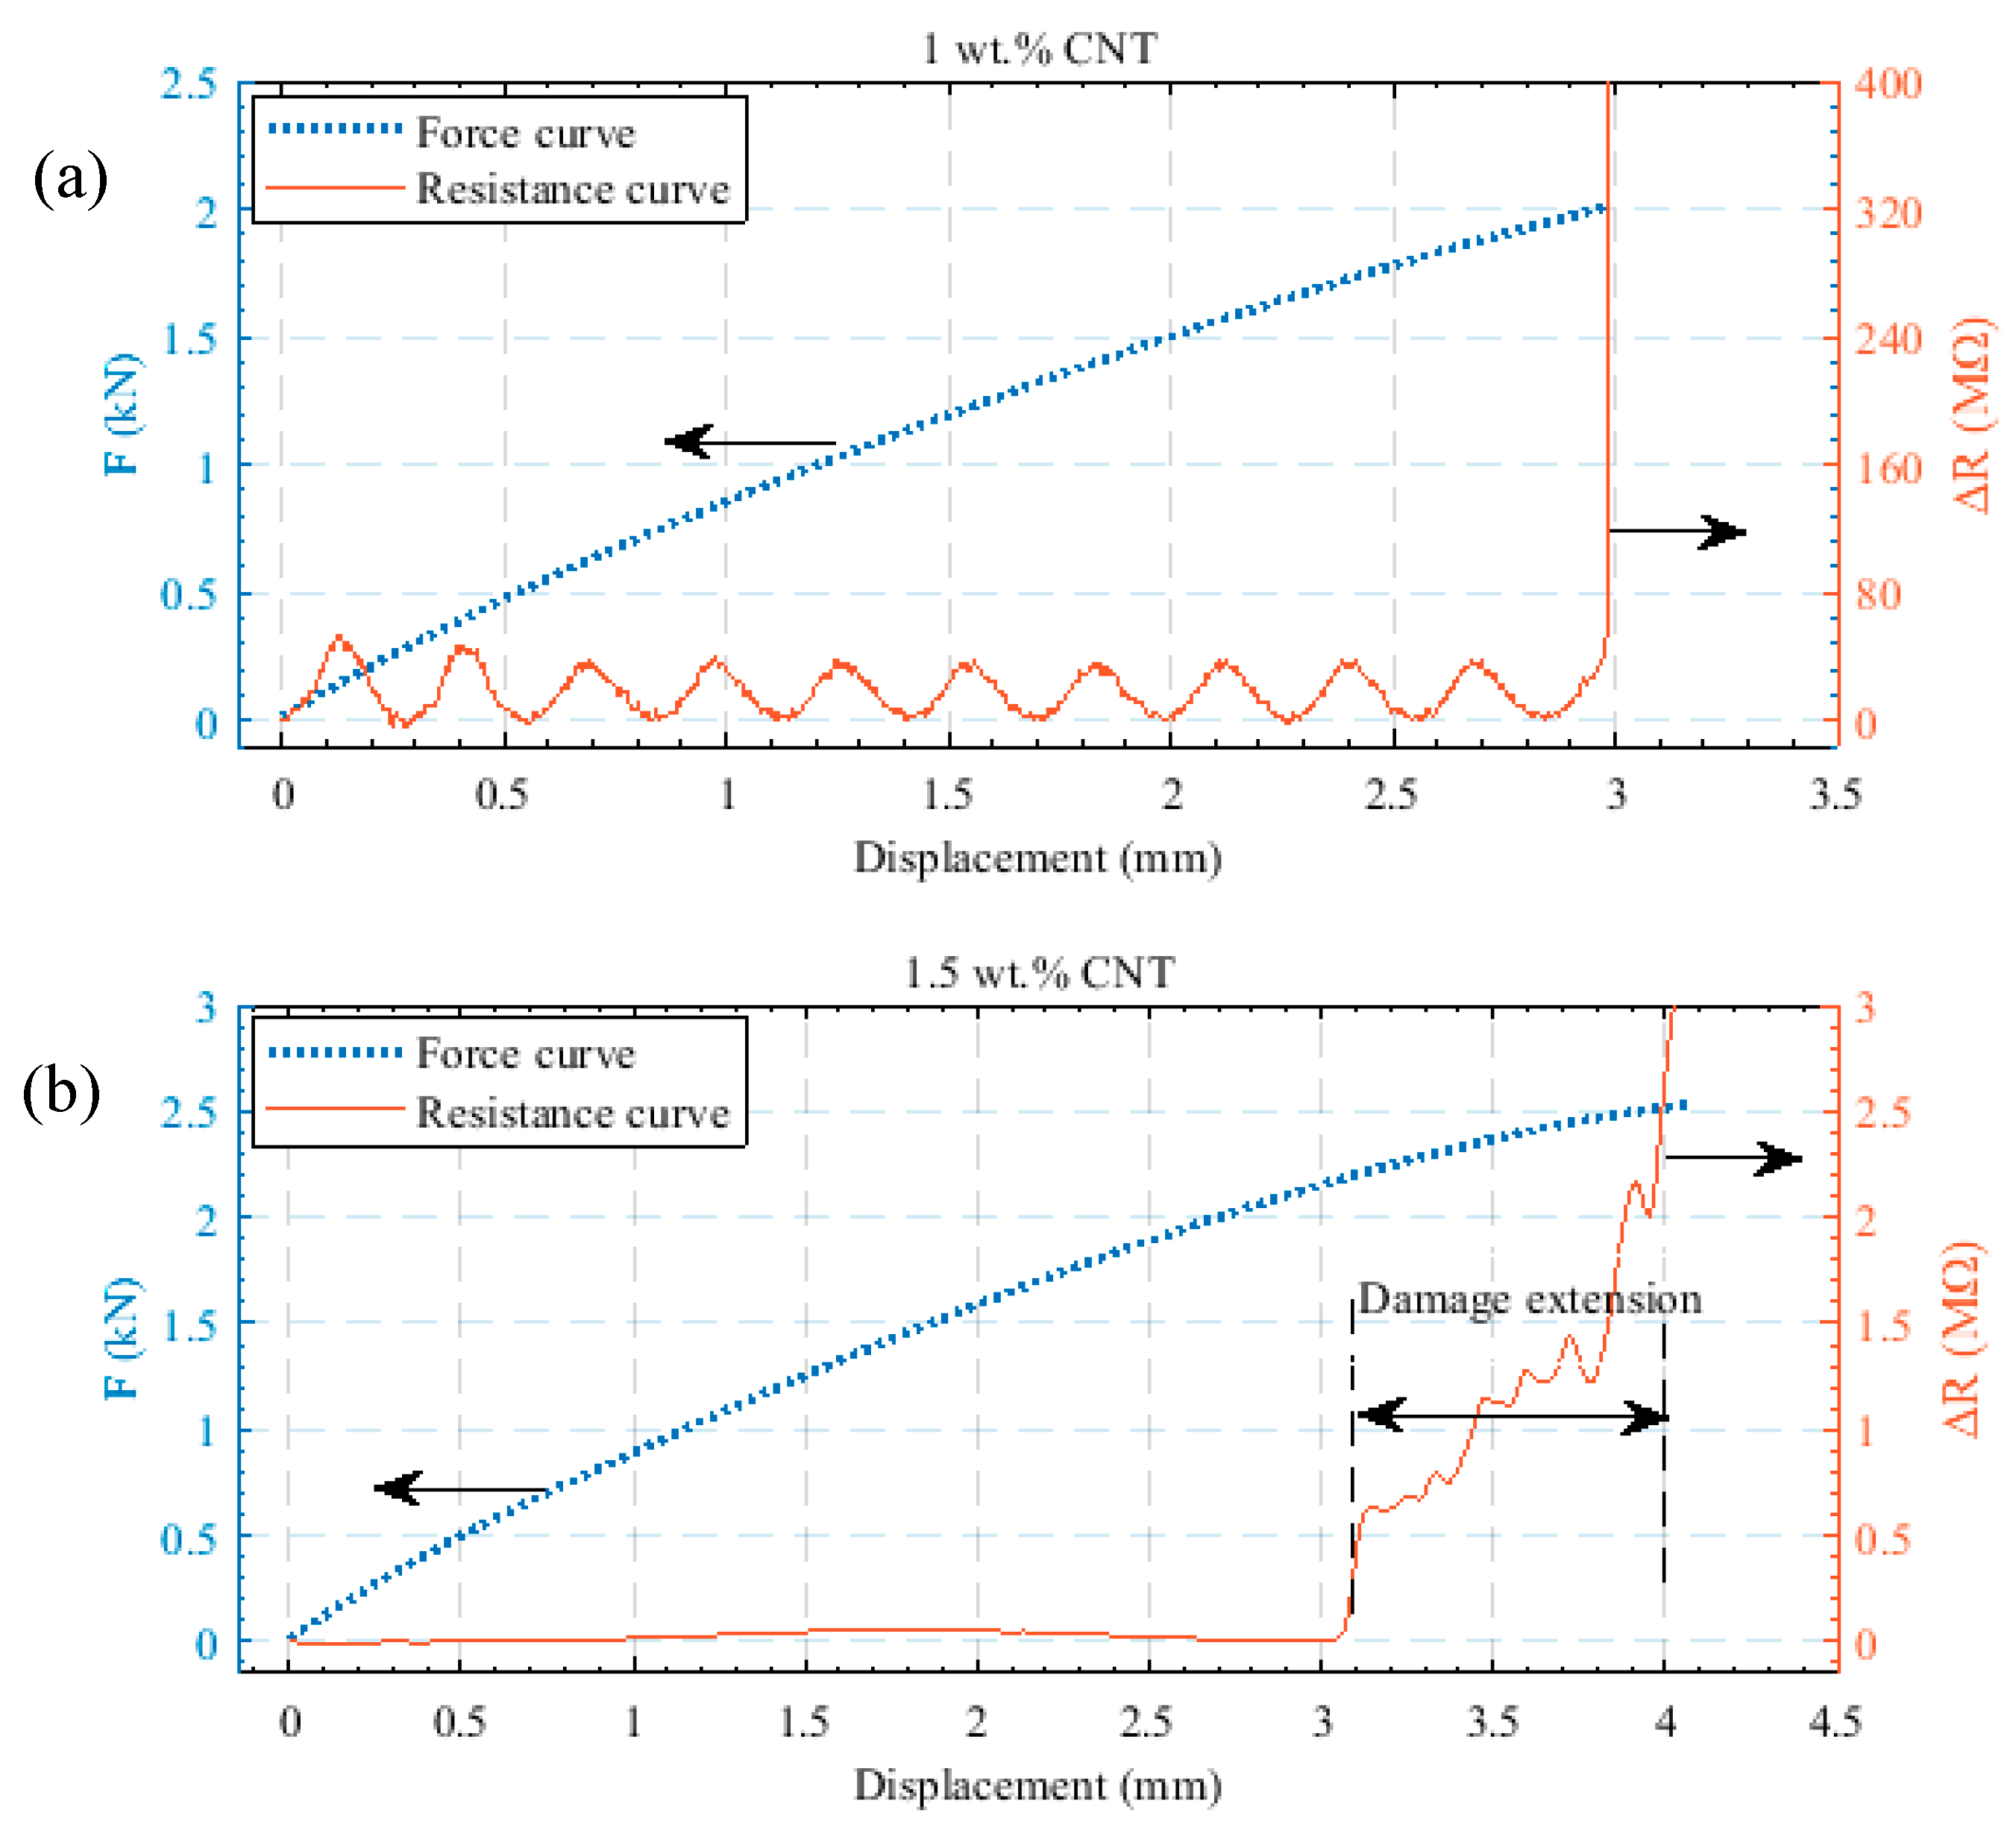
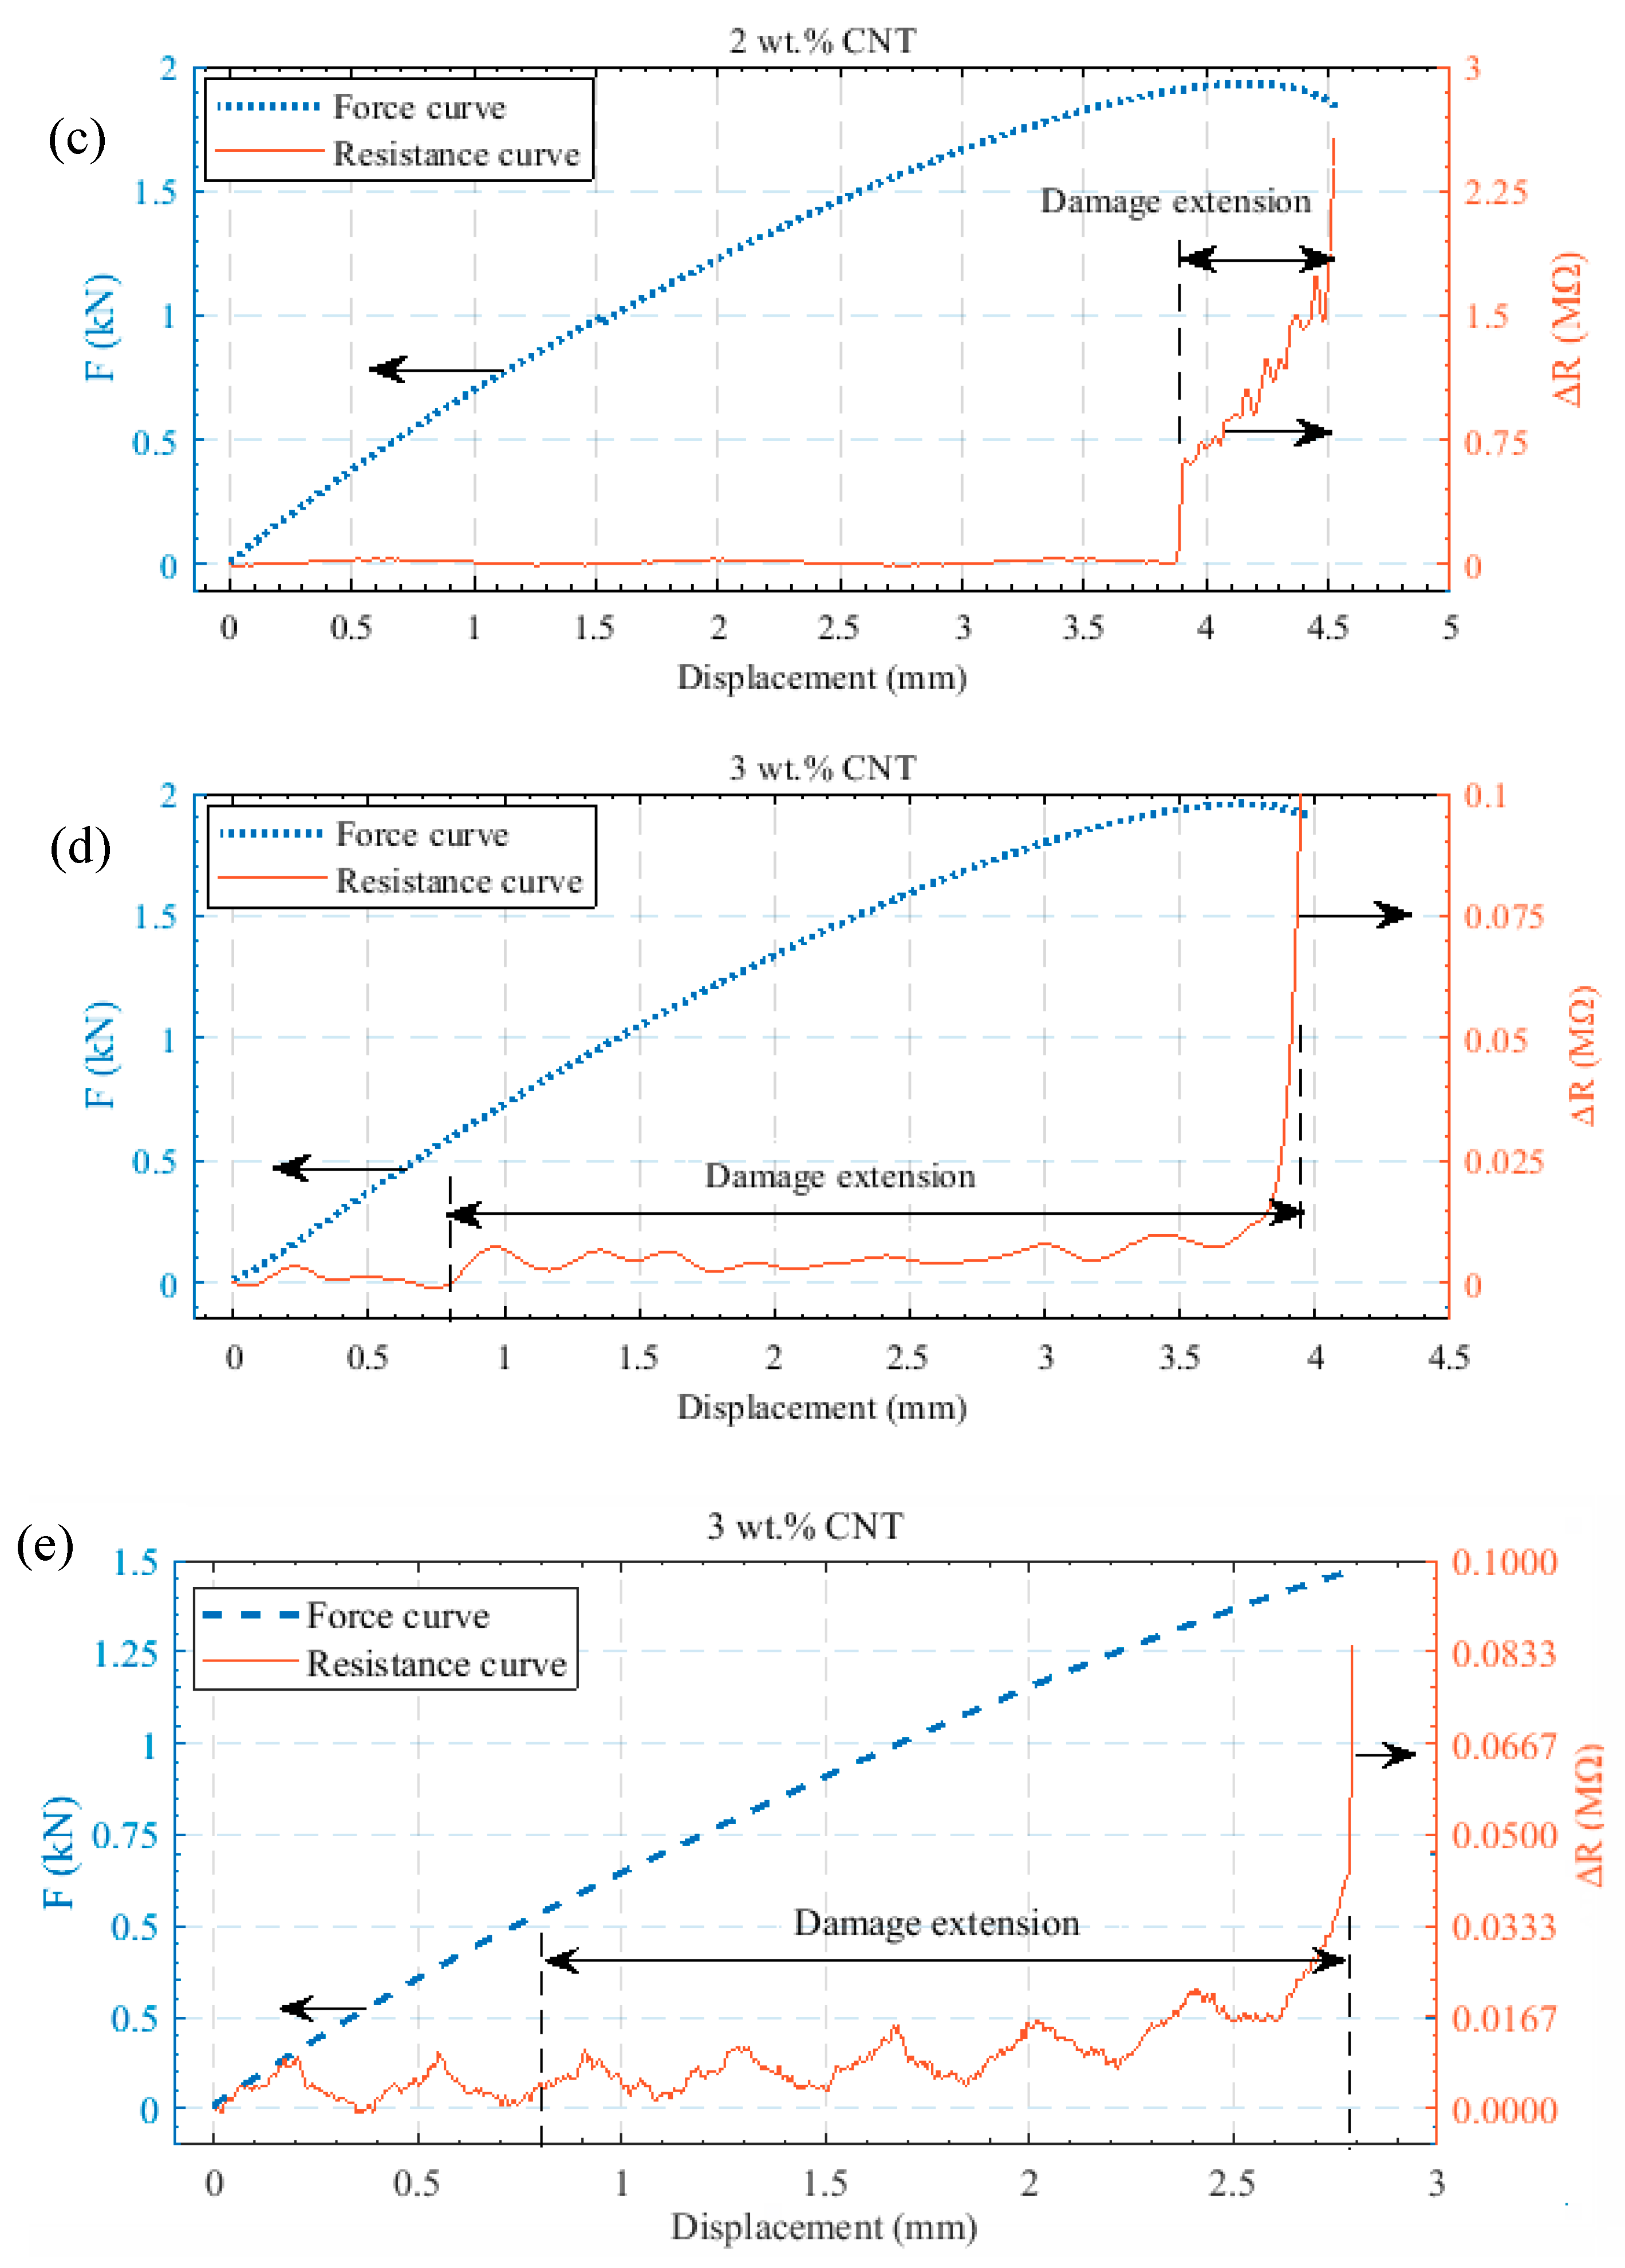
3.3. Sensing Capabilities during Mechanical Loading

The majority of previous studies used the two-probe method to measure the electrical resistance changes during the tensile test [38,39,40], which may provide disadvantages for the DC measurements. Here, we use an AC measurement setup at an intermediate frequency, therefore, the two-probe method is sufficient, and the cumbersome preparation of two additional connections per specimen can be avoided. The sensitivity of the specimen is proportional to the normalized resistance change ∆R/R0, where ∆R is the resistance increment and R0 is the equivalent parallel resistance value at the chosen measurement frequency (here 100 kHz). For every specimen, R0 is constant, so that the sensitivity of the specimen can be related to the impedance changes ∆R [41]. In the following Figures, we consequently report the absolute impedance change ∆R. The axes giving the impedance changes are plotted at different scales in the following result graphs. This is done because the impedance changes are at different ranges.
According to the diagrams in Figure 7, for specimens with a filler content of 2 wt % MWCNTs and the lowest dispersion time of 5 min, a non-constant and non-uniform change of the electrical impedance was observed (see Figure 7a). The steep curve segments result from deferments of large agglomeration zones of CNTs in the epoxy matrix present due to the low dispersion time. The uniformity of the electrical impedance change curves improves for dispersion times of 10 and 15 min, separately, as depicted in Figure 7b,c. The curve observed for 3 wt % MWCNTs shows a nearly constant increase without additional peaks, and thus qualifies the fabricated nanocomposites for continuous sensing of damage and damage progression. Figure 8 shows the resistance change for a nanocomposite specimen including 3 wt % MWCNTs with a dispersion time value of 5 min. Nanocomposite specimens with higher percentage of carbon nanotubes generally exhibit a steeper slope in the electrical resistance change (see Figure 9). Although an impedance increase cannot be seen for the specimens with 1, 1.5, 2 wt % CNTs for a displacement lower than 3 mm, it is seen for 3 wt % MWCNTs and a displacement of at least 0.8 mm. In this region where there is no impedance change, we see the elastic behavior of the fabricated nanocomposite material. Up to the point where the impedance starts to change, the material is structurally able to compensate for the applied force.
Consequently, the specimen with 3 wt % with 10 min dispersion time is more sensitive than the others (see Figure 9) given the chosen measurement setup. These results are also further consistent with the SEM image of the nanocomposite with 3 wt % MWCNT at 10 min dispersion time (see Figure 6c). This filler amount is also determined to be the percolation threshold as elaborated in Section 3.1. In comparison to the specimens including 1 and 2 wt % MWCNT, the slope of the resistance changes diagram for the specimens with 3 wt % MWCNTs also exhibits a smoother shape. Georgousis et al. [36] reported that the highest sensitivity can be achieved close to the percolation threshold. In the present study, we confirm these results showing that the smoothest curves are achieved above the percolation threshold. Obviously, the samples below the percolation threshold (1, 1.5, and 2 wt %) can be used for sensing by applying an AC impedance measurement setup and a suitable read-out strategy to correct for the non-smooth curve shape. The employment of specimen with different filler content and dispersion times may be adapted to the application and the sensitivity requirements at certain force and displacement regions.
Based on the max forces of the specimens using different dispersion time, the max strength was obtained for every weight percent (Table 2). The maximum strength is the ultimate strength of the nanocomposite (the apex point of the force-displacement diagram). This is different from the failure stress, which occurs after this maximum point. A significant difference could be observed between the maximum forces achieved for specimens containing different percentages of MWCNTs. The specimens including 3 wt % MWCNTs could withstand less longitudinal force. It can further be seen from Table 2 that when increasing the filler amount from 1 to 3 wt %, the maximum strength decreases from 68.36 MPa to 50.19 MPa. In general, the strength of nanocomposites obtained from tensile tests were improved by adding MWCNT to the epoxy matrix. As reported in Table 2, the maximum strength of the nanocomposites increased with respect to pure epoxy. However, the maximum strength decreased by adding more than 1 wt % MWCNTs, which is similar to what was reported in [42].
The slopes of the electrical impedance diagrams show that a filler amount equal to 3 wt % MWCNTs, and at least 10 min dispersion time, provided the highest sensitivity with respect to displacement and applied force using the suggested measurement setup. However, the mechanical strength decreased to 50.19 MPa.

4. Conclusions

In this work, we introduce a measurement technique for condition monitoring of damage in composites for structures and buildings by conductive nano-adhesive. The conductive nano-adhesive was prepared with various MWCNT contents and different dispersion times. Then, the capability of the prepared MWCNT–epoxy composites as nanocomposite sensors was studied by determining their electrical impedance changes during longitudinal loading. It was observed that dispersion times longer than 10 min provide no significant improvement in the equivalent parallel resistance of the nanocomposite. Although the maximum tolerated forces of these nanocomposite sensors were achieved with 1 wt % MWCNT content, the nanocomposite sensors fabricated with 3 wt % MWCNTs and a dispersion time of 10 minutes showed better self-damage sensing capabilities in the considered setup, while still achieving a mechanical strength higher than that of pure epoxy.

Author Contributions

O.S.-D. prepared the specimens, contributed to electrical and mechanical testing and drafted the paper. L.-M.F. contributed to the electrical and mechanical measurements, did the analysis in MATLAB and edited the paper. M.F. gave suggestions on how to modify the paper and provided supervision. A.R. aided in preparation of the specimen and contributed the SEM analyses. H.O. contributed in the tensile testing, and T.M. worked on the suitable signal processing for the electrical measurements. A.A. is supervisor. H.Z. organized the financing and collaborations, L.-M.F. and H.Z. reviewed the paper and provided supervision.

Funding

This research received no external funding.

Acknowledgments

This study was financially supported by the Alpen-Adria-Universität. The preparation of specimens was conducted in the chemistry lab of the Carinthian Tech Research (CTR) AG and mechanical testing equipment was supplied by the Carinthian University of Applied Sciences (FH Kärnten) in Villach.

Conflicts of Interest

The authors declare no conflict of interest.

References

  1. Lu, J.; Chen, X.; Lu, W.; Chen, G. The piezoresistive behaviors of polyethylene/foliated graphite nanocomposites. Eur. Polym. J. 2006, 42, 1015–1021. [Google Scholar] [CrossRef]
  2. Le, J.-L.; Du, H.; Dai Pang, S. Use of 2d graphene nanoplatelets (gnp) in cement composites for structural health evaluation. Compos. Part B 2014, 67, 555–563. [Google Scholar] [CrossRef]
  3. Thostenson, E.T.; Chou, T.-W. Aligned multi-walled carbon nanotube-reinforced composites: Processing and mechanical characterization. J. Phys. D Appl. Phys. 2002, 35, L77–L80. [Google Scholar] [CrossRef]
  4. Suhr, J.; Koratkar, N.; Keblinski, P.; Ajayan, P. Viscoelasticity in carbon nanotube composites. Nat. Mater. 2005, 4, 134–137. [Google Scholar] [CrossRef] [PubMed]
  5. Cha, J.; Jun, G.H.; Park, J.K.; Kim, J.C.; Ryu, H.J.; Hong, S.H. Improvement of modulus, strength and fracture toughness of cnt/epoxy nanocomposites through the functionalization of carbon nanotubes. Compos. Part B 2017, 129, 169–179. [Google Scholar] [CrossRef]
  6. Wang, L.; Dang, Z.-M. Carbon nanotube composites with high dielectric constant at low percolation threshold. Appl. Phys. Lett. 2005, 87, 042903. [Google Scholar] [CrossRef]
  7. Li, J.; Zhang, G.; Zhang, H.; Fan, X.; Zhou, L.; Shang, Z.; Shi, X. Electrical conductivity and electromagnetic interference shielding of epoxy nanocomposite foams containing functionalized multi-wall carbon nanotubes. Appl. Surf. Sci. 2018, 428, 7–16. [Google Scholar] [CrossRef]
  8. Guadagno, L.; Raimondo, M.; Vertuccio, L.; Naddeo, C.; Barra, G.; Longo, P.; Lamberti, P.; Spinelli, G.; Nobile, M. Morphological, rheological and electrical properties of composites filled with carbon nanotubes functionalized with 1-pyrenebutyric acid. Compos. Part B 2018, 147, 12–21. [Google Scholar] [CrossRef]
  9. Gardea, F.; Lagoudas, D.C. Characterization of electrical and thermal properties of carbon nanotube/epoxy composites. Compos. Part B 2014, 56, 611–620. [Google Scholar] [CrossRef]
  10. Krainoi, A.; Kummerlöwe, C.; Nakaramontri, Y.; Vennemann, N.; Pichaiyut, S.; Wisunthorn, S.; Nakason, C. Influence of critical carbon nanotube loading on mechanical and electrical properties of epoxidized natural rubber nanocomposites. Polym. Test. 2018, 66, 122–136. [Google Scholar] [CrossRef]
  11. Galvez, P.; Quesada, A.; Martinez, M.A.; Abenojar, J.; Boada, M.J.L.; Diaz, V. Study of the behaviour of adhesive joints of steel with cfrp for its application in bus structures. Compos. Part B 2017, 129, 41–46. [Google Scholar] [CrossRef]
  12. Vajtai, R.; Wei, B.; Zhang, Z.; Jung, Y.; Ramanath, G.; Ajayan, P. Building carbon nanotubes and their smart architectures. Smart Mater. Struct. 2002, 11, 691–698. [Google Scholar] [CrossRef]
  13. Koo, Y.; Shanov, V.N.; Yun, Y. Carbon nanotube paper-based electroanalytical devices. Micromachines 2016, 7, 72. [Google Scholar] [CrossRef]
  14. Lee, J.; Lim, S.-H. CNT foam-embedded micro gas pre-concentrator for low-concentration ethane measurements. Sensors 2018, 18, 1547. [Google Scholar] [CrossRef] [PubMed]
  15. Avilés, F.; May-Pat, A.; López-Manchado, M.; Verdejo, R.; Bachmatiuk, A.; Rümmeli, M. A comparative study on the mechanical, electrical and piezoresistive properties of polymer composites using carbon nanostructures of different topology. Eur. Polym. J. 2018, 99, 394–402. [Google Scholar] [CrossRef] [Green Version]
  16. Nofar, M.; Hoa, S.; Pugh, M. Failure detection and monitoring in polymer matrix composites subjected to static and dynamic loads using carbon nanotube networks. Compos. Sci. Technol. 2009, 69, 1599–1606. [Google Scholar] [CrossRef]
  17. Wang, Y.; Wang, S.; Li, M.; Gu, Y.; Zhang, Z. Piezoresistive response of carbon nanotube composite film under laterally compressive strain. Sens. Actuators A 2018, 273, 140–146. [Google Scholar] [CrossRef]
  18. Kim, H.; Kim, Y. High performance flexible piezoelectric pressure sensor based on cnts-doped 0–3 ceramic-epoxy nanocomposites. Mater. Des. 2018, 151, 133–140. [Google Scholar] [CrossRef]
  19. Hu, N.; Fukunaga, H.; Atobe, S.; Liu, Y.; Li, J. Piezoresistive strain sensors made from carbon nanotubes based polymer nanocomposites. Sensors 2011, 11, 10691–10723. [Google Scholar]
  20. Prudencio, E.; Bauman, P.; Williams, S.; Faghihi, D.; Ravi-Chandar, K.; Oden, J. Real-time inference of stochastic damage in composite materials. Compos. Part B 2014, 67, 209–219. [Google Scholar] [CrossRef]
  21. Kwon, D.-J.; Wang, Z.-J.; Choi, J.-Y.; Shin, P.-S.; DeVries, K.L.; Park, J.-M. Damage sensing and fracture detection of cnt paste using electrical resistance measurements. Compos. Part B 2016, 90, 386–391. [Google Scholar] [CrossRef]
  22. Mishra, S.; Kumaran, K.; Sivakumaran, R.; Pandian, S.P.; Kundu, S. Synthesis of PVDF/CNT and their functionalized composites for studying their electrical properties to analyze their applicability in actuation & sensing. Colloids Surf. A 2016, 509, 684–696. [Google Scholar]
  23. Na, W.-J.; Byun, J.-H.; Lee, M.-G.; Yu, W.-R. In-situ damage sensing of woven composites using carbon nanotube conductive networks. Compos. Part A 2015, 77, 229–236. [Google Scholar] [CrossRef]
  24. Li, C.; Thostenson, E.T.; Chou, T.-W. Sensors and actuators based on carbon nanotubes and their composites: A review. Compos. Sci. Technol. 2008, 68, 1227–1249. [Google Scholar] [CrossRef]
  25. Lee, B.M.; Gupta, S.; Loh, K.J.; Nagarajaiah, S. Strain sensing and structural health monitoring using nanofilms and nanocomposites. In Innovative Developments of Advanced Multifunctional Nanocomposites in Civil and Structural Engineering; Loh, K., Nagarajaiah, S., Eds.; Elsevier: Cambridge, UK, 2016; pp. 303–326. [Google Scholar]
  26. Kang, I.; Schulz, M.J.; Kim, J.H.; Shanov, V.; Shi, D. A carbon nanotube strain sensor for structural health monitoring. Smart Mater. Struct. 2006, 15, 737–748. [Google Scholar] [CrossRef]
  27. Meeuw, H.; Viets, C.; Liebig, W.; Schulte, K.; Fiedler, B. Morphological influence of carbon nanofillers on the piezoresistive response of carbon nanoparticle/epoxy composites under mechanical load. Eur. Polym. J. 2016, 85, 198–210. [Google Scholar] [CrossRef]
  28. Alig, I.; Pötschke, P.; Lellinger, D.; Skipa, T.; Pegel, S.; Kasaliwal, G.R.; Villmow, T. Establishment, morphology and properties of carbon nanotube networks in polymer melts. Polymer 2012, 53, 4–28. [Google Scholar] [CrossRef]
  29. Pal, G.; Kumar, S. Multiscale modeling of effective electrical conductivity of short carbon fiber-carbon nanotube-polymer matrix hybrid composites. Mater. Des. 2016, 89, 129–136. [Google Scholar] [CrossRef]
  30. Zangl, H.; Muehlbacher-Karrer, S.; Hamid, R. Interfaces for autarkic wireless sensors and actuators in the internet of things. In Advanced Interfacing Techniques for Sensors; Springer: New York, NY, USA, 2017; pp. 167–189. [Google Scholar]
  31. Zangl, H.; Zine-Zine, M.; Mühlbacher-Karrer, S. Teds extensions toward energy management of wireless transducers. IEEE Sens. J. 2015, 15, 2587–2594. [Google Scholar] [CrossRef]
  32. Seyhan, A.T.; Tanoğlu, M.; Schulte, K. Tensile mechanical behavior and fracture toughness of MWCNT and DWCNT modified vinyl-ester/polyester hybrid nanocomposites produced by 3-roll milling. Mater. Sci. Eng. A 2009, 523, 85–92. [Google Scholar] [CrossRef] [Green Version]
  33. Kueseng, P.; Sae-oui, P.; Rattanasom, N. Mechanical and electrical properties of natural rubber and nitrile rubber blends filled with multi-wall carbon nanotube: Effect of preparation methods. Polym. Test. 2013, 32, 731–738. [Google Scholar] [CrossRef]
  34. Faller, L.-M.; Mitterer, T.; Leitzke, J.P.; Zangl, H. Design and evaluation of a fast, high-resolution sensor evaluation platform applied to mems position sensing. IEEE Trans. Instrum. Meas. 2017, 67, 1014–1027. [Google Scholar] [CrossRef]
  35. Faller, L.-M.; Leitzke, J.; Zangl, H. Design of a fast, high-resolution sensor evaluation platform applied to a capacitive position sensor for a micromirror. In Proceedings of the 2017 IEEE International Instrumentation and Measurement Technology Conference (I2MTC), Turin, Italy, 22–25 May 2017; pp. 1–6. [Google Scholar]
  36. Georgousis, G.; Pandis, C.; Kalamiotis, A.; Georgiopoulos, P.; Kyritsis, A.; Kontou, E.; Pissis, P.; Micusik, M.; Czanikova, K.; Kulicek, J. Strain sensing in polymer/carbon nanotube composites by electrical resistance measurement. Compos. Part B 2015, 68, 162–169. [Google Scholar] [CrossRef]
  37. Pircheraghi, G.; Powell, T.; Solouki Bonab, V.; Manas-Zloczower, I. Effect of carbon nanotube dispersion and network formation on thermal conductivity of thermoplastic polyurethane/carbon nanotube nanocomposites. Polym. Eng. Sci. 2016, 56, 394–407. [Google Scholar] [CrossRef]
  38. Ferrreira, A.; Rocha, J.; Ansón-Casaos, A.; Martínez, M.; Vaz, F.; Lanceros-Mendez, S. Electromechanical performance of poly (vinylidene fluoride)/carbon nanotube composites for strain sensor applications. Sens. Actuators A 2012, 178, 10–16. [Google Scholar] [CrossRef]
  39. Ku-Herrera, J.; Aviles, F. Cyclic tension and compression piezoresistivity of carbon nanotube/vinyl ester composites in the elastic and plastic regimes. Carbon 2012, 50, 2592–2598. [Google Scholar] [CrossRef]
  40. Grammatikos, S.; Paipetis, A. On the electrical properties of multi scale reinforced composites for damage accumulation monitoring. Compos. Part B 2012, 43, 2687–2696. [Google Scholar] [CrossRef]
  41. Lim, A.S.; An, Q.; Chou, T.-W.; Thostenson, E.T. Mechanical and electrical response of carbon nanotube-based fabric composites to hopkinson bar loading. Compos. Sci. Technol. 2011, 71, 616–621. [Google Scholar] [CrossRef]
  42. Yu, S.; Tong, M.N.; Critchlow, G. Wedge test of carbon-nanotube-reinforced epoxy adhesive joints. J. Appl. Polym. Sci. 2009, 111, 2957–2962. [Google Scholar] [CrossRef]
Figure 1. (a) Magnetic stirrer and ultrasonic bath (b) nanocomposite specimen.
Electronics 07 00143 g001
Figure 2. Illustration of the impedance measurement setup during the tensile test.
Electronics 07 00143 g002
Figure 3. Equivalent parallel resistance of the nanocomposite sensors with a dispersion time equal to 10 min.
Electronics 07 00143 g003
Figure 4. Equivalent parallel resistance of nanocomposite sensors with a dispersion time equal to 15 min.
Electronics 07 00143 g004
Figure 5. Interaction plots of the weight percent and dispersion time for Rp at different frequencies (a) 120 Hz (b) 10 kHz.
Electronics 07 00143 g005
Figure 6. Fracture surface images of MWCNT–epoxy nanocomposite with (a) 2 wt % MWCNTs with magnification of 2500× at 5 min dispersion time and (b) 2 wt % MWCNTs with magnification of 10,000× at 5 min dispersion time, and (c) 3 wt % MWCNTs at 10 min dispersion time with magnification of 1000×.
Electronics 07 00143 g006aElectronics 07 00143 g006b
Figure 7. Force and impedance changes for the nanocomposite sensor with 2 wt % MWCNTs for the different dispersion times of (a) 5 min, (b) 10 min, and (c) 15 min. The arrows indicate the axis belonging to the respective curve. Note: the scaling on the righthand axis and displacement are not uniform throughout the illustrated results.
Electronics 07 00143 g007
Figure 8. Force and impedance changes for the nanocomposite sensor with 3 wt % MWCNTs at 5 min dispersion time. The arrows indicate the axis belonging to the respective curve. Note: the scaling on the righthand axis and displacement below are not uniform throughout the illustrated results.
Electronics 07 00143 g008
Figure 9. Force and impedance changes as a function of displacement for nanocomposites with different weight percent prepared at 10 min dispersion time and (a) 1 wt % CNT; (b) 1.5 wt % CNT; (c) 2 wt % CN; (d) and (e) 3 wt % CNT. The arrows indicate the axis belonging to the respective curve. Note: the scaling on the righthand axis and displacement below are not uniform throughout the illustrated results.
Electronics 07 00143 g009aElectronics 07 00143 g009b
Table 1. Processing conditions of carbon nanotube (CNT)–epoxy sensor.
Amount of CNTDispersion Time
1; 1.5; 2; 35; 10; 15
Table 2. Mechanical properties of the nanocomposites.
SpecimenYoung‘s Modulus (GPa)Max Strength (MPa)
Pure epoxy3.533 ± 0.0447.19 ± 1.05
1 wt % CNT–epoxy3.045 ± 0.0368.36 ± 2.74
1.5 wt % CNT–epoxy3.109 ± 0.0464.89 ± 1.33
2 wt % CNT–epoxy2.932 ± 0.0562.26 ± 1.40
3 wt % CNT–epoxy2.008 ± 0.0250.19 ± 1.65

